

Translate this page into:
Experimental design approach in optimizing the sorption properties of a new generation of reinforced porous hybrid beads
⁎Corresponding author. chabane.leila.08@gmail.com (Leila Chabane)
-
Received: ,
Accepted: ,
This article was originally published by Elsevier and was migrated to Scientific Scholar after the change of Publisher.
Peer review under responsibility of King Saud University.
Abstract
Reinforced porous hybrid beads (RPHB) based on Al-pillared montmorillonite are prepared and characterized. Optimal conditions for elimination of malachite green are determined using the BBD experimental design. MG elimination rate exceeding 59%. Quadratic model is developed to predict the elimination of MG.
Abstract
A new sorbent called reinforced porous hybrid beads (RPHB) based on an Algerian aluminium pillared montmorillonite (Al-PIMt)/polyvinyl alcohol (PVA) and calcium carbonate (CC) was prepared using the extrusion method. These new composite bead sorbents were characterized by Scanning electron microscopy (SEM) and Fourier transform infrared spectroscopy (FTIR). The mechanical properties for a series of wet RPHB are measured using uniaxial compression tests. These RPHB beads were used in the batch mode sorption of malachite green (MG) in aqueous solution.
The effects of independent variables such as the initial concentration of MG, the sorbent dose and the pH of the suspension as well as their interactions during sorption processes are investigated. A Box–Behnken design based on the response surface methodology (RSM) is applied to evaluate the main effects of the variables. The response in term of the MG removal efficiency is maximized. The study of the interactions between the three variables shows that the initial concentration of MG and the pH of the aqueous media appear to be the most significant variables which significantly affect the elimination of MG. The optimal values favorable for the best sorption of MG on these new porous beads are an initial concentration of MG (92.36 mg L−1), a pH of the aqueous medium (pH = 5.01) as well as the dose of the RPHB sorbent (1.03 g L−1).
Statistical analysis results show a good correlation between the experimental results and those predicted with a very satisfactory coefficient of determination value (R2 = 0.99).
Keywords
Experimental design
Reinforced porous hybrid beads
Optimization
Malachite green
Sorption

1 Introduction
During the past decade, a particular and increasingly important interest was carried to the treatment of waters polluted by dyes. Indeed, more than 100,000 commercial dyes are used in various fields, such as those of the textile, paper, printing, rubber, plastics, cosmetics, leather tanning, food processing and dye manufacturing industries (Nawaz and Ahsan, 2014; Liu et al., 2016; Yagub et al., 2014; Kyzas et al., 2013). About 10–15% of all dyes used in industries are released directly to wastewater (Pei et al., 2007). Even at low concentrations (less than 1 mg L−1), these visible and aesthetically unpleasant dyes can affect both human health and the environment (Guechi and Hamdaoui, 2016).
Malachite green is one of the most common textile dyes used in aquaculture to control parasitic, fungal and protozoan infections on aquatic organisms (Srivastava et al., 2004).
However, many articles report the dangerous and carcinogenic effects of this dye (Hameed and El-Khaiary, 2008; Sudova et al., 2007; Matpang et al., 2017). It acts as a promoter of liver tumors, is also known to be highly cytotoxic and carcinogenic.
For human health, it may cause respiratory tract irritation by inhalation and irritation of the gastrointestinal tract during ingestion. Contact of malachite green with skin also causes irritation with redness and pain while contact with eyes will causes permanent injury to human eyes. In aquatic life, MG also causes harmful effects on the liver, gills, kidneys, intestine, gonads and pituitary gonadotropic cells (Hameed and El-Khaiary, 2008).
In the field of treatment of contaminated waters, various low-cost sorbents such as activated carbon, natural and/or modified clays, natural polymers, industrial waste have been successfully used to remove several dyes by sorption process in an aqueous medium.
Recently, the implementation of a new generation of sorbents in the form of macroporous hybrid beads intended for the removal of heavy metals (Li et al., 2011; Ablouh et al., 2019) and dyes (Liu et al., 2012; Shokry Hassan et al., 2014; Oussalah et al., 2019) has been successfully carried out. Thus, several gelled beads immobilizing the particles of activated carbon (Hassan et al., 2014), modified clays (Lezehari et al., 2010; Ely et al., 2011), magnetic particles (Rocher et al., 2008; Li et al., 2017), biomass (Gottlieb, 2005) in gels of alginate of sodium have been prepared and used in the adsorption.
Reinforced porous hybrid beads based on aluminium-pillared montmorillonite have been synthesized and have proven their capacity to eliminate, by sorption in an aqueous medium, malachite green (Chabane et al., 2017). In sorption field, the individual effect of each variable influencing sorption has been widely studied in several earlier studies (Guechi and Hamdaoui, 2016; Saha et al., 2010; Bulut et al., 2008; Sartape et al., 2017).
To reduce the number of experiments, the time and the total costs of research, the use of experimental design proves to be the most suitable method and could provide a large amount of information. Indeed, this method offers the advantage of offering knowledge of the effects of each individual variable, its importance as well as the possible interactions which may exist between two or more of these variables (Mtaallah et al., 2018).
In this study, new classes of gelled beads named reinforced porous hybrid beads (RPHB) and non-porous reinforced hybrid beads (NPRHB) for comparison based on aluminium pillared montmorillonite (Al-PIMt) particles, sodium alginate (SA), polyvinyl alcohol (PVA) and/or calcium carbonate (CC) were elaborated. Their performance has been evaluated in several sorption tests of malachite green (MG) taken as a model molecule representing toxic dyes.
Optimization of the main influence parameters such as the MG initial concentration, the pH of the aqueous medium and the sorbent dose giving the best MG elimination efficiencies was carried out using a Box Behnken-RSM Experimental design. A model describing the effect of these variables has been suggested based on the study of their effects as well as their interactions.
2 Material and methods
2.1 Materials
All chemicals are reactive grade and are used without further treatment. Malachite Green (Purity: over 99%, CI: 42000) was purchased from Fluka. The cationic MG dye has a chemical formula of C23H25ClN2 and a molecular weight of 364.911 g mol−1. A stock solution initial concentration of 1000 mg L−1 was prepared and kept until the end of the experiments. All the used solutions (standards and solutions of the various sorption tests) were prepared from the same mother solution. The stock was used to prepare the proposed concentrations. The desired pH values were modified using a few drops of 0.1 M sodium hydroxide (0.1 M NaOH) or a few drops of 0.1 M nitric acid (HNO3). All solutions are prepared using distilled water.
2.2 Preparation and characterization of RPHB sorbents
The extrusion technique is used to encapsulate the mixture of aluminium pillared montmorillonite (Al-PIMt) particles, polyvinyl alcohol (PVA) and/or calcium carbonate (CC) in the sodium alginate (SA) gel in order to prepare new spherical gelled composite beads.
Raw bentonite, as the basic constituent of the formulation, is supplied by the National Company for Geological and Mining (Province Maghnia deposit in western Algeria). This clay was first transformed into homo-ionic sodic montmorillonite (Na-Mt) by gravity sedimentation.
The obtained Na-Mt material was modified by adding dropwise an aluminium-pillaring solution prepared beforehand and supplying Al polycations (final aluminium concentration [Al]f = 0.1 M, OH/Al molar ratio = 1.8) to a suspension of Na-Mt (0.5% w/w) in order to obtain an Al/Na-Mt ratio of 4 mmolg−1. The resulting mixture was vacuum filtered and washed several times with distilled water. The corresponding solid denoted (Na-PIMt) was dried at 40 °C for 72 h, sieved to 3.50 mesh and then stored in dark glass flasks for further uses (Khalaf et al., 1997, Bouras et al., 2010).
All the beads used in this study were prepared according to the same method which consists in dispersing the mixture of powders of the chosen products (1.3 g of sodium alginate AS, 3 g of Al-PIMt and/or 0.5 g of calcium carbonate CC) in 50 mL of distilled water. The homogenization of each mixture was ensured by continuous stirring for 1 h. In order to obtain more rigid and reinforced beads, PVA solutions (1 g of solid PVA in 50 mL of distilled water, left stirring for 30 min at 80 °C and then slowly cooled) were added to the two initial dispersions (with and without calcium carbonate CC) under continuous stirring for 1 h. The gelled spherical beads were produced by dripping each final mixture in bath containing mixtures of boric acid solution (6%, 100 mL) and CaCl2 solution (0.1 M, 100 mL). The non-porous reinforced hybrid beads synthesized without calcium carbonate (CC) noted (NPRHB) are taken for comparison.
After a contact time of 24 h corresponding to the hardening time, the spherical beads containing CaCO3 were immersed in an HCl solution (1 M, 200 mL) in order to remove the calcium carbonate and therefore to create pores in these new reinforced porous hybrid beads denoted RPHB.
These new synthesized beads were washed four times with distilled water to remove excess residual hydrochloric acid and then stored in a flask containing distilled water (Chabane et al., 2017).
All gelled hybrid beads (RPHB and NPRHB) have been characterized by several methods such as:
-
–
Fourier transform infrared spectroscopy (instrument 8900-SHIMADZU) in order to identify the different chemical bonds of the different constituents of the beads. FT-IR spectra were collected in the range 400–4000 cm− 1.
-
–
Scanning electron microscopy (FEI/Ouank 650) to examine the morphology at the microscopic scale of these new composites.
-
–
Compression tests are very useful for measuring the rigidity of these new porous beads. For this, uniaxial tests on the RPHB sorbents are carried out using a compression test instrument (Model, Lloyd Instrument) fixed with a 2 N force transducer. These test experiments are conducted at room temperature (20 ± 2 °C). Young’s modulus is evaluated according to Hertz’s theory (Chabane et al., 2017).
2.3 Sorption experiments
The effects of three variables such as sorbent dose (SD), pH, and initial adsorbate concentration (Ci) on the elimination efficiency of MG were examined.
Sorption experiments were carried out by shaking a series of mixtures 0.1 g of bead sorbents with 100 mL volumes of MG dye solution in dark batch reactors with a capacity of 250 mL. The study is carried out at the desired concentrations and pH at room temperature (20 ± 2 °C).
All the aqueous mixtures (beads/MG) were stirred at 200 rpm for 6 h in a mechanical shaker (Edmund Bühler GmbH SM-30) (Chabane et al., 2017). The MG dye solutions were separated from the beads sorbents by filtration through Whatman filter paper.
All the concentrations including the initial concentration of MG (Ci) were obtained by their absorbances given by UV–Vis spectrophotometer (6800 UV/VIS Jenway) at the appropriate maximum absorption wavelength (λmax = 618 nm). The MG removal efficiency (E) was calculated with Eq. (1):
2.4 Experimental design
Box–Behnken design was used to study the effect of the variables involved on the responses in a cost-effective and rapid manner. The RSM (response surface methodology) designs allow us to estimate both quadratic interactions and effects and hence give the idea of the (local) shape of the response surface studied (Amini et al., 2008).
The effect of a factor is defined as the change in response produced by a change in the factor level. Table 1 illustrates the three parameters and their chosen levels for the experiment. The factors levels were coded as −1 (low), 0 (central point) and +1 (high).
Variable
Symbols
Level
Abbreviation
Naturel
Code(*)
(−1)
(0)
(+1)
Solution pH
pH
x1
X1
3
6
9
Sorbent dose (g L−1)
SD
x2
X2
0.5
1
1.5
Initial concentration (mg L−1)
Ci
x3
X3
10
55
100
The quadratic model used to predict the variables is a codified mathematical model used for three factors according to the following Eq. (2):
In addition, the real values of the natural independent variables (xi) were transferred to coded variables (Xi) in order to simplify the model calculations according to Eq. (3) (Eremia et al. 2008):
A total of 15 experiments were carried out by creating a matrix according to their high and low levels. To avoid systematic errors, the order in which the experiments were performed was randomized. The data were analyzed with 95% confidence intervals using the JMP 7 Statistical Discovery Software. Statistical significance of the model is obtained when diagnostics in fitting are investigated. For experimental design, the diagnostics in fitting mostly known are: dispersion matrix, leverage, R2, adjusted (R2Adj), residuals, analysis of variance (ANOVA), t-test of the coefficients, normal probability plot and inflation factors (Marrubini et al. 2020). The details of the experimental tests with the coded values of the variables with the response (E) are summarized in Table 2.
Run number
Coded values
Response
X1
X2
X3
MG removal efficiency (%)
1
−1
−1
0
53.20
2
1
0
1
73.37
3
−1
1
0
61.25
4
1
0
−1
92.51
5
0
0
0
65.50
6
0
0
0
64.00
7
0
1
1
49.66
8
1
−1
0
59.34
9
0
0
0
64.50
10
0
−1
−1
64.15
11
1
1
0
65.52
12
−1
0
1
62.30
13
0
1
−1
80.10
14
−1
0
−1
84.66
15
0
−1
1
47.12
3 Results and discussion
3.1 Characterization
As shown in Fig. 1(a), the reinforced porous hybrid beads (RPHB) are uniform and spherical in shape. Scanning electron micrographs show that the external area of the RPHB beads is porous. Fig. 1(b clearly) shows that the pores of the studied beads are heterogeneous both in size and shape.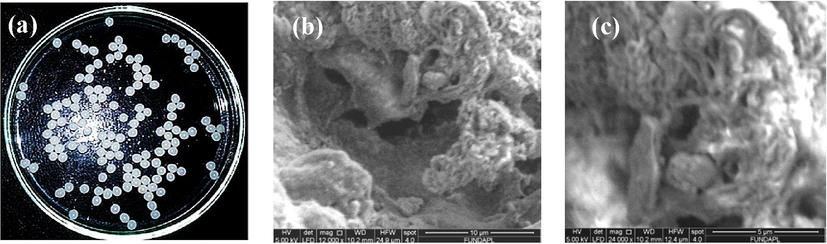
(a) Image and (b 10 µm; c 5 µm) SEM micrographs of RPHB.
The FTIR spectra of the RPHB composites presented in Fig. 2 show a strong absorption band around 3420 cm−1, corresponding to the O—H stretching vibrations. The two bands located at 1038 cm−1 and 520 cm−1 are attributed to the stretching and bending vibrations of the SiO, SiO − AlVI in the montmorillonite structure, respectively.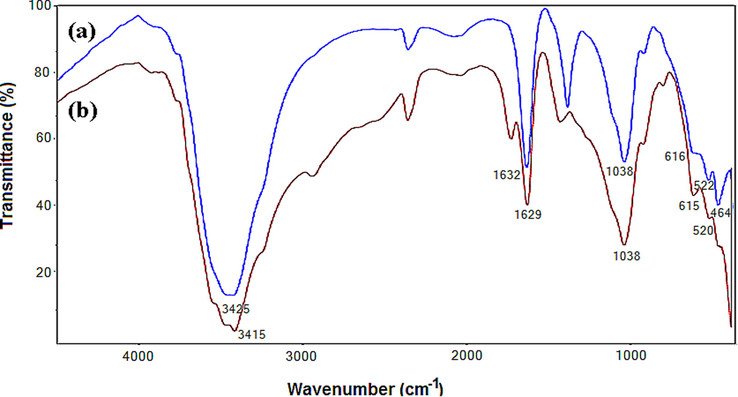
IR Spectra of the used sorbent material powders (a) Al-PIMt particles; (b) dried RPHB beads.
The Young’s modulus of the prepared samples (alginate beads, non porous reinforced beads and reinforced porous hybrid beads) was determined from the force–displacement curve generated during compression. A typical force (F) versus displacement (H) curve is shown in Fig. 3(a). Curves show elastic region (H < 0.001 m) and plastic region (H > 0.001 m).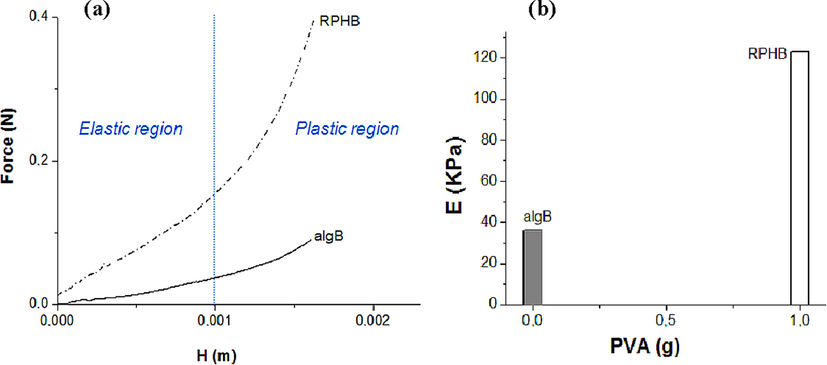
(a) Forces-displacement curves (b) Young's modulus as a function of PVA amount for RPHB beads.
Porous hybrid beads reinforced with both PVA and aluminium pillared montmorillonite (Al-PIMt) are more elastic and therefore difficult to crack because of their elastic properties.
Fig. 3(b) shows the effect of PVA amount on the Young’s modulus of the alginate beads used as references and RPHB sorbents. The corresponding results indicate that the value of Young’s modulus of the alginate beads (algB) increases with the increase in the amount of PVA. Indeed, the Young’s modulus values of algB and of the RPHB sorbents reach 33 and 123 kPa, respectively. Note that RPHB beads with a higher amount of PVA prove to be much more rigid in perfect agreement with our previous results (Chabane et al., 2017).
3.2 Model fitting and statistical analysis
The Analysis of variance (ANOVA) of the regression provides a conclusion on the statistical significance of the model. This model is acceptable if both the ANOVA of the regression model is statistically significant and the Lack-of-fit test is non-significant (Marrubini et al., 2020). In addition, the p-values are defined as the smallest level of significance leading then to rejection of the null hypothesis. The F-test is used as the criterion to evaluate the statistical significance of the regression coefficients of the determined parameters. The response is given by the quadratic model as indicated in the previous equation (2). The exploitation of the corresponding experimental results allowed us to estimate the main interaction effects which are grouped in Table 3.
Term
Coefficient value
Standarderror
Degree of freedom
Sum of squares
Mean square
F-value
p-value
ɑ0
64.66
1.062
<0.0001*
ɑ1
3.66
0.650
1
107.73
107.73
31.73
0.0024*
ɑ2
4.09
0.650
1
133.82
133.82
39.49
0.0015*
ɑ3
−11.12
0.650
1
989.45
989.45
292.00
< 0.0001*
ɑ12
−0.46
0.920
1
0.87
0.87
0.25
0.6331
ɑ13
0.80
0.920
1
2.59
2.59
0.76
0.4218
ɑ23
−3.35
0.920
1
44.95
44.95
13.26
0.0149*
ɑ11
6.55
0.957
1
158.73
158.73
46.84
0.0010*
ɑ22
−11.39
0.957
1
479.50
479.50
141.50
< 0.0001*
ɑ33
6.98
0.957
1
180.23
180.23
53.18
0.0008*
C.total
14
2181.62
Model
9
2164.68
240.52
70.98
< 0.0001*
Lack of Fit
3
15.77
5.35
9.01
0.1015
Error
5
16.94
3.38
According to Table 3, the ANOVA of this model shows that the F-value is statistically significant with a very low probability value (Prob > F-value). P-values less than 0.05 indicate that the model is considered to be statistical significant (Kim et al., 2003).
Based on the p value, the model is generally accepted with a confidence level of 95%.
Fig. 4 presents a condensate of informations relating to the proposed model. The corresponding values obtained by the models (axis: Predicted) are compared with those of the experimental data (axis: Actual). Graphs are used to verify the hypothesis, the normal distribution of the residues as well as their tracking in a straight line.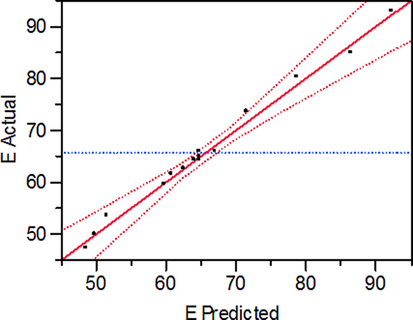
Actual and predicted values of MG removal efficiency.
The coefficient of determination (denoted R2) is defined as the ratio of the explained variation to the total variation represents the measure of the degree of adjustment. Corresponding coefficient value of this coefficient is always between 0 and 1. The empirical model will correspond to experimental data only when the value of R2 is equal to unity (Elhalil et al., 2016). The smaller the value of R2, the less relevant the dependent variables in the model have in explaining the behavior variation (Fu et al., 2007).
Unlike R2, the adjusted coefficient of determination R2Adj increases only if a newly included coefficient improves the model more than would be expected by chance; analogously, the adjusted R2Adj decreases when the new predictor improves the model less than expected by chance. The adjusted R2Adj which is always lower than the R2 can be negative. The more non-significant coefficients are added into the model equation, the greater becomes the numeric gap between R2 and adjusted R2Adj (Marrubini et al., 2020).
In the MG elimination tests, both coefficient of determination (R2) and adjusted coefficient of determination (R2Adj) values are very close and are equal to 0.992 and 0.978, respectively. This means that the 99% of the results are explained by the model given by the Eq. (4)
Fig. 4 shows a close fit between the experimental results (E actual values) and those predicted by the model. In general, the correlations between the theoretical and experimental response, calculated by the model, are satisfactory.
The empirical relationship between the MG removal efficiency (Y) and the three test variables in coded units obtained by the application of RSM is given by the following equation Eq. (4):
On the other hand, the distribution of the residuals must have properties of normality and absence of trends or structure (error randomly distributed). Note that to check the adequacy of the model, the study of the distribution must be more important than the estimate of R2 and adjusted R2Adj.
Based on the normal error distribution for the response values, there should be a normal distribution of the residuals. Indeed, a possible influence of the responses by systematic errors will be reflected in the distribution of the residuals and will appear as non-random. The representation of the residuals plotted on the y-axis versus the experiment number should produce on the abscissa axis a random distribution of the points around the zero (Marrubini et al., 2020).
The histogram and the normal probability plot of the residuals are the most useful plots to assess the distribution of the residuals. As shown in Fig. 5, the normal probability plot with a fairly straight line suggests that the residuals are normally distributed. The histogram shows that the distribution is bell-shaped. The plot of the residual values vs. experiment number represented in Fig. 6 clearly shows a non-uniform dispersion of the residuals around zero, so the data are not affected by the order of the experiment.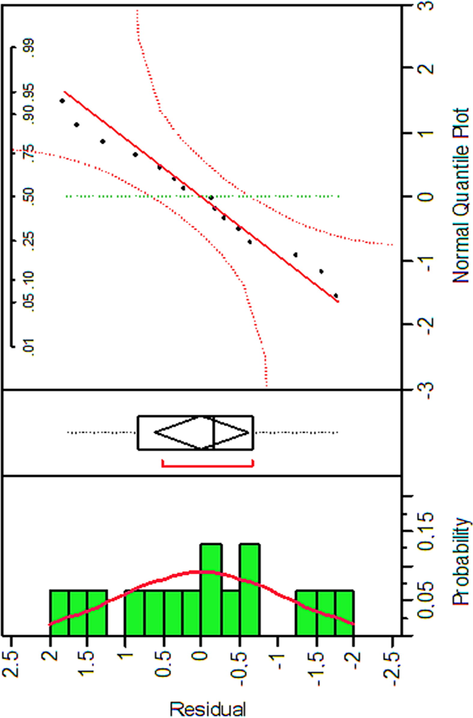
Histogram and Normal probability vs. Residual plot for MG removal.
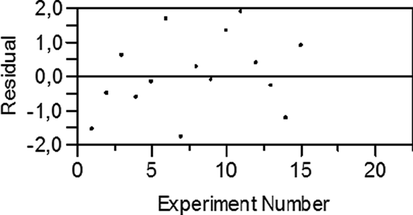
Residual vs. Experiment number plot for MG removal.
From those results, we can only claim that the small error on the y-values is only attributed to random effects.
The statistical significance of the model coefficients through the Student's t-test under the null-hypothesis is that the coefficient equal to zero can also be applied. It is a simple way to evaluate the model utility. However, there is an important conceptual difference between considering the model to be significant because some coefficients are significant or because the ANOVA of the regression shows the overall model significance (Marrubini et al., 2020). The standardized Pareto chart presented in Fig. 7 describes the main effect of the independent variables on the response. In this graph, the length of each bar indicates both the effect of these factors and the level of their effects on the MG removal efficiency. Rather, the bars beyond the line indicate values reaching statistical significance.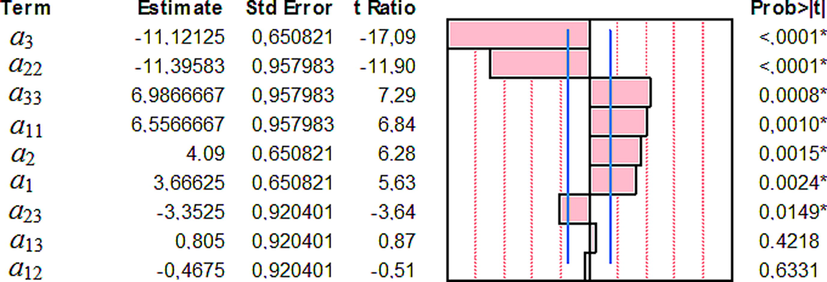
Pareto chart showing the standardized effect of variables and their interaction for MG removal. The x-axis shows the t ratio of the variables.
Based on all these results presented in this section, the model adopted in this study seems to be strongly and statistically significant.
3.3 RSM results and interaction effects between variables
As shown in Table 3 relating to the three studied variables (pH, Ci and SD), it is the sorbent dose (SD) parameter which is the most important variable since its coefficient is the largest (4.09). The effects of the variables have the highest statistical significance (p-values < 0.0149) with the smaller standard error values. The pairs of variables which have meaningless effects are [pH × SD (sorbent dose)] and [pH × Ci (initial concentration of MG)] because their p-values are more than 0.05.
On the other hand, the variables [Ci × Ci], [pH × pH], SD and pH have a positive effect on the MG removal efficiency. The corresponding coefficient ɑ3 (ɑ3 = −11.12) shows a negative sign thereby showing that the intensification of this variable leads to a decrease in the response value (E).
Consequently and to better understand the relationship between the variables studied and the response relating to the elimination efficiency of MG, a cubic graph is presented in Fig. 8.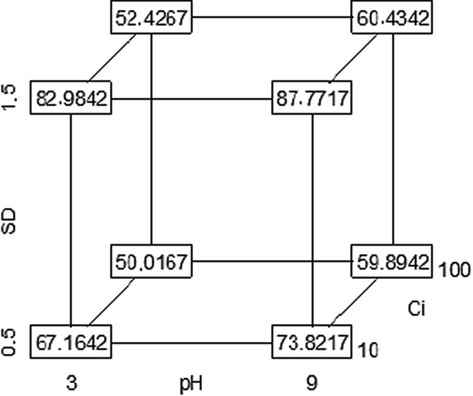
Cube plot for MG removal efficiency.
The cubic graph shows that increasing the pH from 3 to 9 and the sorbent dose (SD) from 0.5 to 1.5 g L−1 considerably improves the elimination efficiency of MG. Indeed, the values increased from 67 to 74% and from 83 to 88% when the sorbent dose increases from 0.5 to 1.5 g L−1, respectively.
The most important interaction is obtained between sorbent dose (SD) and initial concentration (Ci). For high MG initial concentrations (100 mg L−1), the variable relative to the sorbent dose seems to show no significant effect. Indeed, only an increase of 0.5% is recorded when the dose of sorbent increases from 0.5 to 1.5 g L−1 at pH 9.
The sorption efficiency of MG increases considerably when the concentration is lower due to the greater number of accessible sites on the surface of the RPHB sorbent beads. However, an increase in the concentration of MG dye leads to a decrease in sorption due to the saturation of accessible sites. Under such conditions, the MG molecules to compete with each other against unoccupied surface sites. The fraction of unadsorbed MG molecules remains in solution and therefore causes a reduction in the elimination efficiency.
These results are in perfect agreement with those obtained previously by some authors (Noorimotlagh et al., 2015; Bagheri et al., 2019).
It has been previously reported that an increase in dye sorption depends on both the surface properties of the sorbent and the physico-chemical characteristics of the dye structure. This behavior clearly indicates a process of protonation of MG molecules in an acid medium while an increase in the pH of the medium would further promote deprotonation (Baek et al., 2010).
In Fig. 9, the response surface curves clearly show that the sorption of MG is the most favorable at pH 9. The effect of pH on the sorption of MG by the RPHB sorbent gelled beads can be explained in terms of point of zero charge (pHPZC). This is defined as the pH where the total net charge of particles is zero.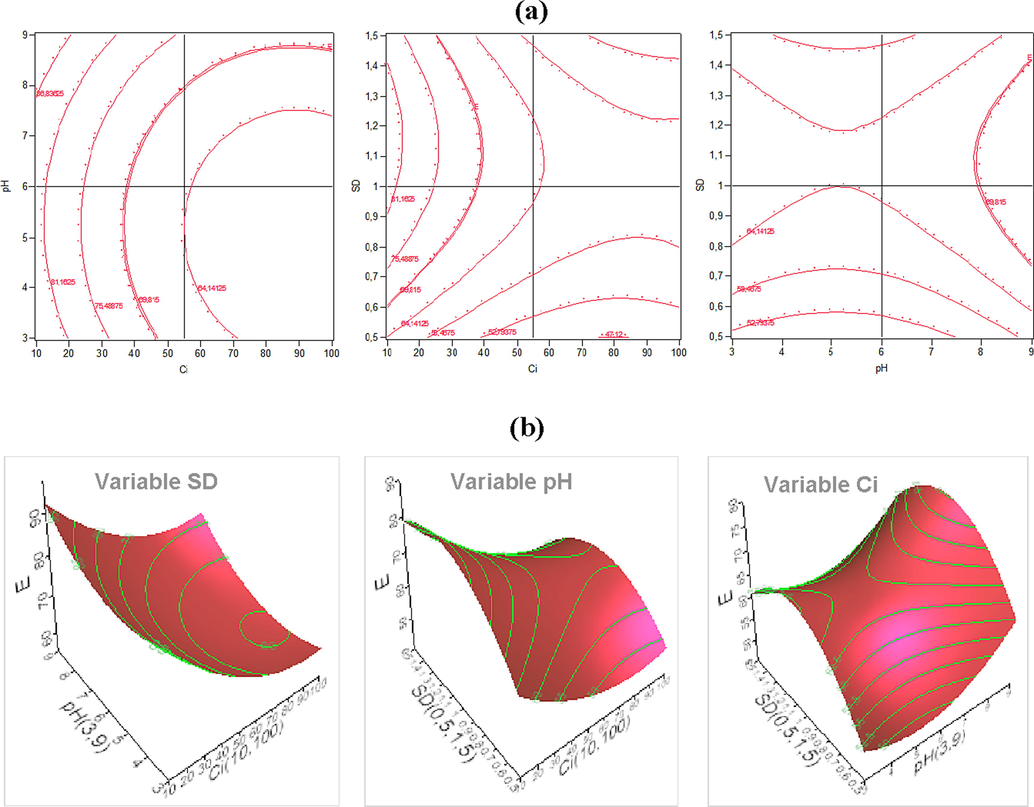
Contour (a) and RSM plots (b) of the combined effects on the MG removal efficiency.
At pH <(pHPZC = 7), the surface charge of the RPHB beads becomes positive due to the protonation of the carboxylic groups of MG, thus resulting in a high positive charge density in acid medium and therefore a decrease in sorption (Bulut et al., 2008). Under these conditions, there is both an electrostatic repulsion between the positively charged surface sites and the positively charged MG cations as well as the competition between the H+ and MG cations.
On the other hand, a basic medium where the pH> (pHPZC = 7) causes a considerable increase in the efficiency of elimination of MG due to a transformation of the charge of the surface sites of the RPHB sorbent which become negative and a deprotonation of the MG molecules (Chabane et al., 2017).
3.4 Optimization of influencing factors
The main objective of this part is to optimize the variables using the model obtained by experience in order to achieve maximum efficiency in eliminating MG. The model developed in this study predicted that the maximum MG removal efficiency is 59.58%, while the maximum values of the process variables in coded values given as follows: X1 = -0.656, X2 = 0.064 and X3 = 0.83.
According to relationship between Xi and xi, the natural values of the test variables are 5.01 for pH of the aqueous medium, 1.03 g L−1 for sorbent dose and 92.36 mg L−1 for MG initial concentration. In the study, it should, therefore, be noted that prediction is only possible if the calculated model provides an adequate representation of the response function in the experimental domain. According to Marrubini et al., 2020, the model can only be considered as “adequate” if the value of the calculated response for each point of the domain corresponds to the value obtained from experiments, within the acceptable precision limits for the study purpose.
The applicability of the model is therefore related to its reliability in prediction new data. To confirm the adequacy of the model and predict the maximum efficiency of MG elimination in the present study, two other independent experiments using the optimum operating conditions were carried out. The optimal point obtained from the model seems to be a point that does not coincide with the experiments used to build the model. The experimental results gave a maximum average MG removal efficiency of approximately 59.11%. The corresponding absolute errors in the efficiency of MG removal between the experimental and the predicted are of the order of 0.47%.
As shown in Table 4, the obtained experimental value of MG removal efficiency was found included to the fall into the predicted value ± confidence interval estimated by empirical model.
Parameter
Estimate
Lower Cla
Upper Clb
1-Alphac
Mean (predicted E%)
65.812
58.925
72.670
0.95
Std Devd
12.434
9.103
19.610
Mean (residual)
4.74 10−16
−0.60921
0.609209
0.95
Std Devd
1.1000089
0.805404
1.734949
These results clearly indicate that the developed model shows both good adequacy and applicability.
The accuracy of the predicted model can also be measured by the sum of the prediction error of the squares (PRESS) and R2 of the prediction (R2prediction). The values of the sum of the predicted error squares (PRESS) and the root mean square error of PRESS (PRESS RMSE) are 255.042 and 4.123, respectively. Regression models with small values of PRESS are usually good prediction equations. The R2prediction of the developed model expressed by Eq. (4) has been calculated. The corresponding obtained value which is equal to 0.90 is reasonably similar to those of the two coefficients R2 and R2adj. Note that a value of R2prediction close to 1 indicates the suitability of the quadratic regression model for the prediction function. Many researchers have studied the elimination of the MG dye on several types of sorbents using an experimental design approach. Table 5 presents the comparative study between the results of this work with those obtained by our RPHB sorbents.
Sorbent
Optimum conditions
Experimental MG removal efficiency (%)
Predicted MG removal efficiency (%)
References
RPHB
[MG]0 = 92.35 mg L−1, pH 5.01, SD = 1.03 g,
59.11
59.58
This work
Activated carbon
[MG]0 = 19.89 mg L−1, pH 7, SD = 0.027 g, contact time: 75 min
99.80
100
Bagheri et al. (2019)
TiO2-sodium alginate film
[MG]0 = 5 mg L−1, pH 8; SD = 0.15 g
98.11
98.55
Sreedharan and Ong (2020)
Nanoscale zerovalent zinc (nZVZ)
[MG]0 = 619.61 mg L−1, pH 4.16, T = 29.16 °C, contact time:114.54 min
77.37
89.50
Ruan et al. (2018)
Multi-walled carbon nanotubes
[MG]0 = 20 mg L−1, SD = 0.03 g, pH 7, contact time:17 min, agitation speed:150 S min−1
99.90
100
Zulkepli et al. (2016)
Peanut (Arachis Hypogaea) Shell Biochar
[MG]0 = 35.18 mg L−1, pH 7.4, contact time: 29.71 min,
96.90
97.33
Wannahari et al. (2019)
4 Conclusion
This study made it possible to draw the following conclusions:
-
–
The three variables tested showed a significant effect on the elimination of MG.
-
–
The two variables “sorbent dose and pH of the medium” were found to be the most significant since they positively influenced the adsorption of MG molecules, unlike that of the initial concentration which rather exerts a negative influence.
-
–
The analysis of variance also showed a very good coefficient of determination R2 = 0.99, F value = 70.98, p < 0.0001 and an insignificant adjustment of the p value of “Lack of Fit” (0.101) ensuring the correct fit of the model.
-
–
Obtained results successfully proved the significance of all the experimental factors which affect the rate of the adsorption.
-
–
The quadratic equation developed in this study shows the presence of a strong correlation between the observed values and those predicated. RSM plots prove to be are a good way to visualize the interactions between the different studied variables.
Acknowledgements
The authors would like to thank the Directorate General of Scientific Research and Technological Development and the Water Environment and Sustainable Development laboratory at Blida 1 University for their support.
Declaration of Competing Interest
The authors declare that they have no known competing financial interests or personal relationships that could have appeared to influence the work reported in this paper.
References
- Chitosan microspheres/sodium alginate hybrid beads: An efficient green adsorbent for heavy metals removal from aqueous solutions. Sustain. Environ. Res.. 2019;29:1-11.
- [CrossRef] [Google Scholar]
- Application of response surface methodology for optimization of lead biosorption in an aqueous solution by Aspergillus niger. J. Hazard. Mater.. 2008;154:694-702.
- [CrossRef] [Google Scholar]
- Removal of malachite green from aqueous solution using degreased coffee bean. J. Hazard. Mater.. 2010;176:820-828.
- [CrossRef] [Google Scholar]
- RSM-CCD design of malachite green adsorption onto activated carbon with multimodal pore size distribution prepared from Amygdalus scoparia: Kinetic and isotherm studies. Polyhedron.. 2019;171:464-472.
- [CrossRef] [Google Scholar]
- Effect of humic acids on pentachlorophenol sorption to cetyltrimethylammonium-modified, Fe- and Al-pillared montmorillonites. Appl. Clay Sci.. 2010;50:58-63.
- [CrossRef] [Google Scholar]
- Adsorption of malachite green onto bentonite: Equilibrium and kinetic studies and process design. Micropor. Mesopor. Mat.. 2008;115:234-246.
- [CrossRef] [Google Scholar]
- Synthesis and characterization of reinforced hybrid porous beads: Application to the adsorption of malachite green in aqueous solution. Chem. Eng. Res. Des.. 2017;120:291-302.
- [CrossRef] [Google Scholar]
- Factorial experimental design for the optimization of catalytic degradation of malachite green dye in aqueous solution by Fenton process. Water Resour. Ind.. 2016;15:41-48.
- [CrossRef] [Google Scholar]
- Ely, A., Baudu, M., Ould Sid’Ahmed Ould Kankou, M., Basly, J.P., 2011. Copper and nitrophenol removal by low costalginate/Mauritanian clay composite beads. Chem. Eng. J. 178, 168–174. https://doi.org/10.1016/j.cej.2011.10.040
- Optimization of hydroxyl radical formation using TiO2 as photocatalyst by response surface methodology. Talanta.. 2008;77:858-862.
- [CrossRef] [Google Scholar]
- Optimising photoelectron catalytic oxidation of fulvic acid using response surface methodology. J. Hazard. Mater.. 2007;144:499-505.
- [CrossRef] [Google Scholar]
- Preparation, morphology and function of biomass filled porous epoxy beads as chelation-ion-exchange for lead ion sorption. React. Funct. Polym.. 2005;63:107-117.
- [CrossRef] [Google Scholar]
- Sorption of malachite green from aqueous solution by potato peel: Kinetics and equilibrium modeling using non-linear analysis method. Arab. J. Chem.. 2016;9:S416-S424.
- [CrossRef] [Google Scholar]
- Batch removal of malachite green from aqueous solutions by adsorption on oil palm trunk fibre: equilibrium isotherms and kinetic studies. J. Hazard. Mater.. 2008;154:237-244.
- [CrossRef] [Google Scholar]
- Comparative study of calcium alginate, activated carbon, and their composite beads on methylene blue adsorption. Carbohydr. Polym.. 2014;102:192-198.
- [CrossRef] [Google Scholar]
- Synthesis and characterization of al-pillared and cationic surfactant modified algerian bentonite. Micropor. Mat.. 1997;8:141-150.
- [CrossRef] [Google Scholar]
- Optimization and characterization of UV-curable adhesives for optical communications by response surface methodology. Polym. Test.. 2003;22:899-906.
- [CrossRef] [Google Scholar]
- The change from past to future for adsorbent materials in treatment of dyeing wastewaters. Materials.. 2013;6:5131-5158.
- [CrossRef] [Google Scholar]
- Alginate encapsulated pillared clays: removal of a neutral/anionic biocide (pentachlorophenol) and a cationic dye (safranine) from aqueous solutions. Colloids Surf. A Physicochem. Eng. Asp.. 2010;366:88-94.
- [CrossRef] [Google Scholar]
- Synthesis of magnetic microspheres with sodium alginate and activated carbon for removal of methylene blue. Materials.. 2017;10:1-14.
- [CrossRef] [Google Scholar]
- Preparation of macroporous bead adsorbents based on poly(vinyl alcohol)/chitosan and their adsorption properties for heavy metals from aqueous solution. Chem. Eng. J.. 2011;178:60-68.
- [CrossRef] [Google Scholar]
- The removal of dye from aqueous solution using alginate-halloysite nanotube beads. Chem. Eng. J.. 2012;187:210-216.
- [CrossRef] [Google Scholar]
- Selective adsorption of cationic dyes from aqueous solution by polyoxometalate-based metal-organic framework composite. Appl. Surf. Sci.. 2016;362:517-524.
- [CrossRef] [Google Scholar]
- Experimental designs for solid-phase microextraction method development in bioanalysis: A review. Anal. Chim. Acta.. 2020;1119:77-100.
- [CrossRef] [Google Scholar]
- Effects of malachite green on growth and tissue accumulation in pak choy (Brassica chinensis Tsen & Lee) Agric. Nat. Resour.. 2017;51:96-102.
- [CrossRef] [Google Scholar]
- Factorial experimental design applied to adsorption of cadmium on activated alumina. J. Water Reuse Desalin.. 2018;8:76-85.
- [CrossRef] [Google Scholar]
- Comparison of physico-chemical, advanced oxidation and biological techniques for the textile wastewater treatment. Alex. Eng. J.. 2014;53:717-722.
- [CrossRef] [Google Scholar]
- Noorimotlagh, Z., Shahriyar, S., Darvishi Cheshmeh Soltani, R., Tajik, R., 2015. Optimized adsorption of 4-chlorophenol onto activated carbon derived from milk vetch utilizing response surface methodology. Desalin. Water Treat. 57, 14213–14226. https://doi.org/10.1080/19443994.2015.1067830
- Cationic and anionic dyes removal by low-cost hybrid alginate/natural bentonite composite beads: Adsorption and reusability studies. Int. J. Biol. Macromol.. 2019;124:854-862.
- [CrossRef] [Google Scholar]
- Factors affecting ionic liquids based removal of anionic dyes from water. Environ. Sci. Technol.. 2007;41:5090-5095.
- [CrossRef] [Google Scholar]
- Removal of organic dyes by magnetic alginate beads. Water Res.. 2008;42:1290-1298.
- [CrossRef] [Google Scholar]
- Modeling of malachite green removal from aqueous solutions by nanoscale zerovalent zinc using artificial neural network. Appl. Sci.. 2018;8:1-23.
- [CrossRef] [Google Scholar]
- Toxicological effects of malachite green. Aquat. Toxicol.. 2004;66:319-329.
- [CrossRef] [Google Scholar]
- Insight into adsorption equilibrium, kinetics and thermodynamics of Malachite Green onto clayey soil of Indian origin. Chem. Eng. J.. 2010;165:874-882.
- [CrossRef] [Google Scholar]
- Removal of malachite green dye from aqueous solution with adsorption technique using Limonia acidissima (wood apple) shell as low cost adsorbent. Arab. J. Chem.. 2017;10:S3229-S3238.
- [CrossRef] [Google Scholar]
- Formulation of synthesized zinc oxide nanopowder into hybrid beads for dye separation. J. Nanomater.. 2014;3:1-14.
- [CrossRef] [Google Scholar]
- Combination of plackett burman and response surface methodology experimental design to optimize malachite green dye removal from aqueous environment. Chem. Data Coll.. 2020;25:100317.
- [CrossRef] [Google Scholar]
- Negative effects of malachite green and possibilities of its replacement in the treatment of fish eggs and fish: A review. Vet. Med.. 2007;52:527-539.
- [CrossRef] [Google Scholar]
- Removal of malachite green dye by peanut (Arachis Hypogaea) shell biochar: optimisation using response surface methodology. Int. J. Sci. Technol. Res.. 2019;8:2564-2569.
- [Google Scholar]
- Dye and its removal from aqueous solution by adsorption: A review. Adv. Colloid Interface Sci.. 2014;209:172-184.
- [CrossRef] [Google Scholar]
- Removal of malachite green dye from aqueous solution using multi-walled carbon nanotubes: An application of experimental design. Malaysian J. Anal. Sci.. 2016;20:258-271.
- [CrossRef] [Google Scholar]


