Translate this page into:
Exploration of properties (crystallographic, morphological, optical) of nano cobalt aluminate synthesized by facile sol–gel method: Effects of sintering temperature
⁎Corresponding author. ahmedfarid@bcsir.gov.bd (Md. Farid Ahmed)
-
Received: ,
Accepted: ,
This article was originally published by Elsevier and was migrated to Scientific Scholar after the change of Publisher.
Peer review under responsibility of King Saud University.
Abstract
The present work reports on the facile sol–gel synthesis of CoAl2O4 nanoparticles using cobalt nitrate and aluminum nitrate as the metal salts and citric acid and glycerol as chelating agents. The consequence of sintering temperature on the structure, particle size, morphology, composition, zeta potential, color, and reflectance spectra at neutral pH condition were explored with various instrumental techniques. The CoAl2O4 nanoparticles were characterized with Powder X-ray diffraction (PXRD), Fourier-transform infrared spectroscopy (FT-IR), Field emission scanning electron microscopy (FESEM), Energy dispersive spectroscopy (EDS), Nanoparticle size analyzer, Ultraviolet–Visible Diffuse Reflectance Spectroscopy (UV–Vis-DRS) and CIE-Lab colorimetric method. From the data of PXRD, the crystallite size and peak profile analysis were investigated by four different models. It was found that the average crystallite size varied in the range of 28.01–320.97 nm and single-phase cubic CoAl2O4 was formed without any impurity. The average particle size of CoAl2O4 nanoparticles was discerned from the FESEM images using ImageJ software and from a nanoparticle size analyzer. The average particle sizes were increased with the increasing sintering temperature. The values of zeta potential found in all of the samples represented high dispersion stability. From the colorimetry of CoAl2O4 nanoparticles, the CIE-La*b* output illustrated high purity and brightness and the spectra.
Keywords
Sol–gel
CoAl2O4
XRD
FESEM
PXRD
CIE-L*a*b*
1 Introduction
Nano-sized cobalt aluminate (CoAl2O4) also familiar as Thenard’s blue is an environmentally friendly inorganic compound having mainly a normal spinel structure in which Co2+ ions are arranged in tetrahedral positions and Al3+ ions are in octahedral sites (Peymannia et al., 2014; Sirotyuk et al., 1998; Zayat and Levy, 2000; Zhou et al., 2018). Cobalt aluminate exhibits outstanding characteristics such as high thermal stability, high mechanical resistance, dispersion, color strength, impermeability and non-migration, which leads to potential diverse application (Dhak and Pramanik, 2006; X. Zhao, L. Zhang, P. Xiong, Wenjing Ma, Na Qian, Wencong Lu, 2015). In various applications such as ceramic pigments, electrochemical sensors, thin films, catalysts, and color filters for automotive lamps (A. Walsh, Y. Yan, M.M. Al-Jassim, S.-H. Wei, J, 2008; Carta et al., 2005; D. Rangappa, T. Naka, A. Kondo, M. Ishii, T. Kobayashi, T. Adschiri, 2007; Deraz and Fouda, 2013; Desouza et al., 2009; Ji et al., 2001; Maurizio et al., 2010; P.M.T. Cavalcante, M. Dondi, G. Guarini, M. Raimondo, G. Baldil, Dyes Pigments, 2009; Rangappa et al., 2007; W.S. Cho, M. Kakihana, 1999; X.L. Duan, D.R. Yuan, Z.H. Sun, C.N. Luan, D.Y. Pan, D. Xu, M.K. Lv, 2005).These diverse uses are enabled by the material's distinct optical characteristics. It has also been successfully used in coloration of ceramic samples, decorative and protective coatings and in paint (Pan Z, Wang Y, Huang H, Ling Z, Dai Y, Ke S., 2015; Peymannia et al., 2014; Tong Y, Zhang H, Wang S, Chen Z, Bian B, 2016; Zhang A, Mu B, Luo Z, Wang A, 2017).
Recently, many a variety of synthesis technique such as polymeric sol–gel, co-precipitation route, micro emulsion, hydrothermal process,combustion etc. used for the preparation of nanocrystalline cobalt aluminate (D. Rangappa, T. Naka, A. Kondo, M. Ishii, T. Kobayashi, T. Adschiri, 2007; F.L. Yu, J.F. Yang, J.Y. Ma, J. Du, Y.Q. Zhou, 2009; J. Chandradass, M. Balasubramanian, K.H. Kim, 2010; L. Gama, M.A. Ribeiro, B.S. Barros, R.H.A. Kiminami, I.T. Weber, A.C.F.M. Costa, 2009). Most of these methods except sol–gel require highly sophisticated apparatus and are expensive, high thermal process, low productivity with inhomogeneity. Compared to other methods, it was ascertained that the sol–gel processes high reproducibility route and it improves the purity of CoAl2O4 with high degree of homogeneity. It also produces the nanoparticles with small particle size distribution at lower temperature synthesis process (F. Davar, M.S. Niasari, 2011; F. Meyer, R. Hempelmann, S. Mathur, M. Veith, J. Mater, 1999).
Parvin Imanipour et all studied the possibility of vanadium substitution on Co lattice sites in CoFe2O4 synthesized by sol–gel autocombustion method (Imanipour et al., 2020). A process was optimized to study the structural and magnetic properties of MnFe2O4 doped by Zn and Dy using Taguchi method (Shayestefar et al., 2022). Zinc and Vanadium Co-Substituted CoFe2O4 nanoparticles were synthesized by using the Sol-Gel auto-combustion method (Imanipour et al., 2022).
Several authors have utilized the sol–gel route to fabricate CoAl2O4 nanoparticles. For instance, Stranger and Orel employed the sol–gel technique, utilizing ethyl acetoacetate as the chelants, to prepare CoAl2O4 nanoparticles (U.L. Stangar, B. Orel, M.J. Krajnc, 2003). Cui et al. described a study where they reported the fabrication of a series of spinel nanoparticles using the sol–gel process (Cui H, Zayat M, Levy D., n.d.).
From the previous studies, it is observed that the synthesis temperature is strongly affected the color of CoAl2O4 (I.S. Ahmed, S.A. Shama, M.M. Moustafa, H.A. Dessouki, A.A. Ali, 2009; M. Zayat, D. Levy, 2000; U.L. Stangar, B. Orel, M.J. Krajnc, 2003). In detail, at relatively low temperature synthesis process, the green color of CoAl2O4 is obtained but at relatively high temperature, the color changes to blue. Some authors shown that the blue color is originates from the Co2+ in tetrahedral co-ordination (Karmaoui M, Silva NJ, Amaral VS, Ibarra A, Millan A, Palacio F, 2013) and violet and green color originate from the octahedral Co2+ and Co3+ coordination (Herrero M, Benito P, Labajos FM, Rives V., 2007; Tielens F, Calatayud M, Franco R, Recio JM, Pérez-Ramírez J, Minot C, 2009). Some suggested the color is affected due to the crystalline Co3O4 existing (Štangar UL, Orel B., 2003). There are different types of materials which are used in the modification of internal and external properties of materials for various purposes. The fruitful applications of any material are mainly depended on the properties of the material. During the synthesis process, reaction parameters and supporting elements are varies to get desired properties. Magnetic properties were changed with the variation of temperature (Choudhary et al., 2021b).
In the current study, sol–gel method is used to prepare nano crystalline CoAl2O4. It was found that blue color spinel CoAl2O4 were prepared without using any dopant. The impact of varying sintering temperature on the structural, morphological, dispersion stability, and optical characteristics of CoAl2O4 was assessed using various characterization techniques. These included powder X-ray diffraction (PXRD) for structural analysis, Fourier transform infrared spectroscopy (FT-IR) for chemical bonding analysis, scanning electron microscopy (SEM) combined with energy dispersive spectroscopy (EDS) for morphological and elemental composition analysis, a nanoparticle size analyzer for particle size distribution analysis, UV–Vis absorption spectroscopy for studying absorption properties, and CIE-La*b* colorimetric analysis for evaluating color characteristics. These techniques collectively provided insights into the changes occurring in the material as a result of different sintering temperatures.
2 Experimental
2.1 Materials
Nano cobalt aluminates were synthesized from precursors cobalt nitrate-hexahydrate [Co(NO3)2·6H2O], aluminum nitrate-nanohydrate [Al(NO3)3·9H2O], glycerol (GC,C3H8O3), citric acid (C6H8O7) and aq·NH3 (25 %), which were purchased from Merck, Mumbai with 98 % purity.
2.2 Synthesis
In a traditional sol–gel method, 0.01 mol of Co(NO3)2·6H2O and 0.02 mol of Al(NO3)3·9H2O were dispersed in 300 mL of deionized water. The solution was heated to 75 °C while vigorously stirring for 30 min. A mixture containing a chelating agent, citric acid, at a concentration of 0.03 mol/L, and fuel glycerol, was mixed to the above solution. The resulting solution was then stirred for 2 hrs. Thereafter, the pH of the solution was adjusted to ∼ 7 by adding aq·NH3 drop by drop. The solution was vaporized at 85 °C until it formed a thick gel-like substance. The product was then dried in an electrical oven at 120 °C for 5 hrs. At the end, the resulting black powder was collected and subjected to calcination at temperatures ranging from 1000, 1100, 1200, 1300 and 1400 °C for 4 hrs. The samples that followed were labeled as S1, S2, S3, S4, and S5, in that order. Graphical representation is visualized in Fig. 1.
2.3 Characterization
The PXRD patterns of the materials were investigate by powder X-ray Diffractometer (Smart Lab SE, Rigaku, Japan) with Cu-Kα radiation. The XRD peaks observed from 10 °C to 80 °C with a scan speed 20°/ min. FE-SEM and EDX were investigated by Field Emission Scanning Electron Microscopy (Model 7610f, Jeol, Japan). The infrared spectra were analyzed using FT-IR spectrometer (Model-IRAffinity-1S, MIRACLE 10, Shimadzu, Japan) at room temperature and analysis was conducted using KBr pellets, covering a frequency range of 400–4000 cm−1. The absorbance spectra were measured by UV–Vis spectra and the colorimetric parameters L*, a* and b* were determined by UV–visible Spectrophotometer (Brand:Perkin Model: Elmer Lambda 1050+). The Nanoparticle Size Analyzer (Model:nanoParticaSZ-100-S2, Brand:HORIBA scientific Ltd, Japan) was used to measure the particle size and zeta potential.( ).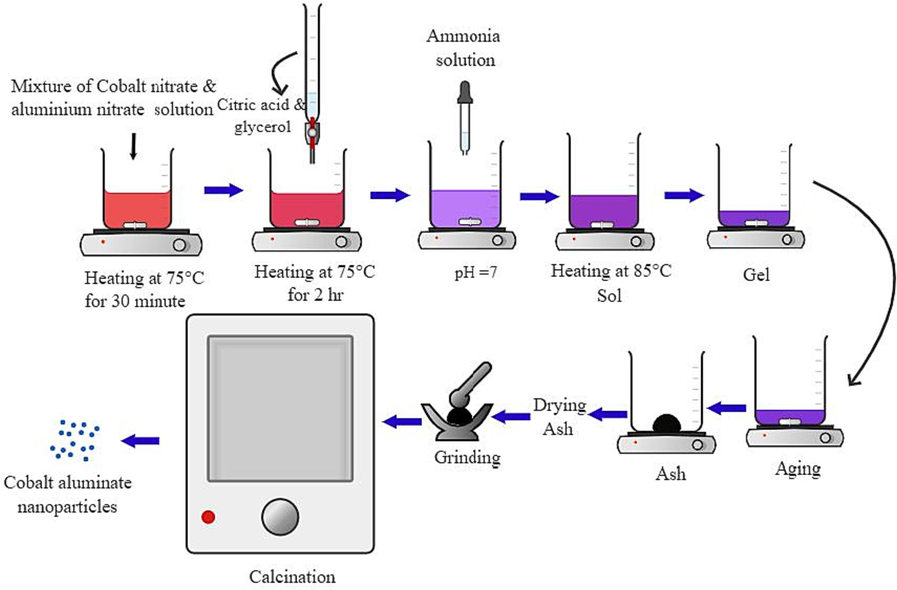
The pictorial representation of the process of synthesizing CoAl2O4 nanoparticles through the sol–gel method.
3 Results and discussion
3.1 XRD analysis
The PXRD patterns of the prepared samples at various calcination temperatures are given in Fig. 2. The PXRD patterns showed different characteristic peak at 2θ values of 31.16°, 36.72°, 44.65°, 55.45°, 59.12° and 64.99° which could be assigned to (2 2 0), (3 1 1), (4 0 0), (4 2 2), (5 1 1) & (4 4 0) of single phase cubic CoAl2O4 respectively. Additionally, it was noticed that the relative intensity of the CoAl2O4 peaks progressively rises as the annealing temperature increases. This trend correlates with an augmentation in crystallinity. The results are good agreement to spinel cubic CoAl2O4 (JCPPS Card no.01–082-2243). No impurity was found in the XRD peaks which proved that the sintering temperature (1000–1400 °C) was adequate for the synthesis of highly pure CoAl2O4. The Rietveld refinement analysis has been performed to determine the structural properties of the synthesized cobalt aluminate nanoparticles (Afshari et al., 2019; Darvishi et al., 2023; Mohebbi et al., 2023).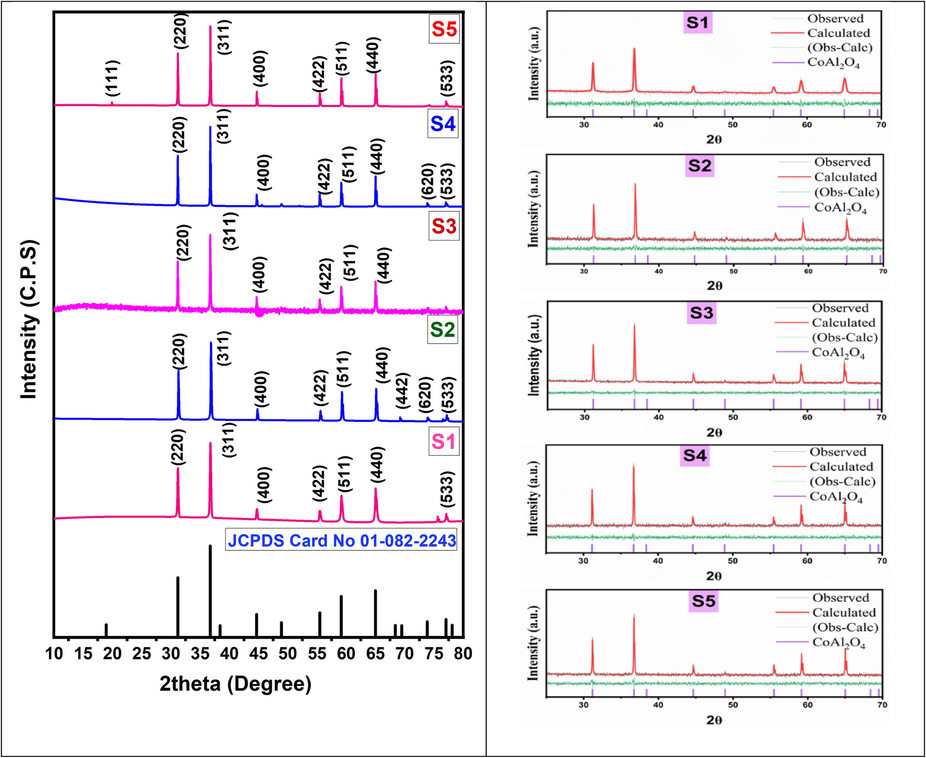
PXRD patterns and Rietveld refinement of CoAl2O4 nanoparticles sinteredd at (1000–1400)°C.
The x-ray peak profile analysis and average crystallite sizes were calculated using various methods, including the Classical Scherrer model (C-S), Williamson-Hall (W-H)model, Halder-Wagner (H-W) model, and Size-Strain Plot (SSP) procedure.
3.1.1 The Debye-Scherrer equation
Using the X-ray diffractogram patterns, the crystallite size is measured from Scherrer’s model Eq. (1) (Choudhary et al., 2021a; Sen et al., 2020b).
The values of crystallite size of the CoAl2O4 nanoparticles using Scherrer method are shown in Table 1.
Sample ID
DC-S(nm)
DW-H(nm)
DH-W(nm)
DSSP(nm)
S1
44.9
28.01
45.02
45.02
S2
80.0
56.59
77.03
77.03
S3
102.1
108.32
99.04
99.04
S4
122.8
175.51
113.65
113.65
S5
134.9
320.97
180.61
180.61
3.1.2 W-H model
The W-H analysis refers to simplified methods that distinguish between nano crystallite size and strain-dependent peak broadening by examining the width of peaks as a function of 2θ (Mote et al., 2012).The peak widening in nanoparticles resulting from lattice strain can be determined using the Stokes-Wilson equation (Sen et al., 2020b; Stokes and Wilson, 1944). In this model, lattice strain was also been estimated in addition to the crystallite size. As peak broadening is dependent on the lattice strain and domain size, this model is considered more accurate and the expression of microstructural property (Hossain and Ahmed, 2023).
The total broadening is observed through the sum of βstrain and βD.
Where, βhkl is the instrumental corrected broadening, βS is due to strain induced broadening and βD is the peak widening based crystallite size. By substituting the values of βstrain and βD from equations (2) and (3) into equation (4), we can calculate.
By rearranging the Equation (4),
Equation (5) represents the Williamson-Hall equation as a linear equation, y = mx + c. By graphing between βhklcosθ and 4sinθ, as shown in Fig. 3, and obtained slope and intercept gives Halder-Wagner crystallite size and strain (Yadav et al., 2016). The values of crystallite size are tabulated in Table 1.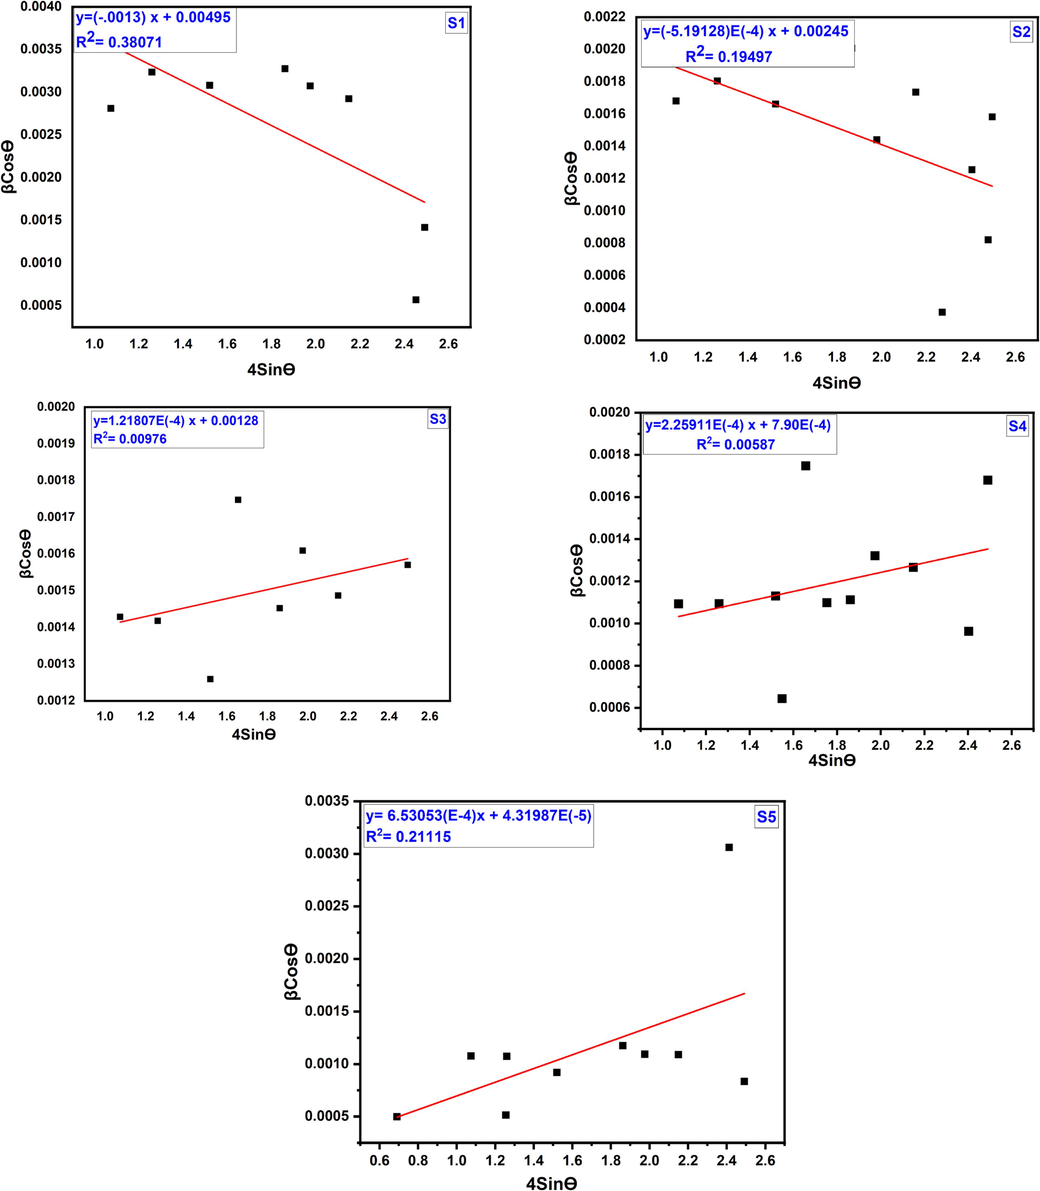
Williamson-Hall plot of cobalt aluminate nanoparticles for different sintering temperature.
The linear lines obtained from the W-H plot do not exhibit a strong correlation, which indicated by the correlation factor of R2 is 0.38071, 0.19497, 0.00976, 0.00587, 0.21115 for 1000 °C, 1100 °C, 1200 °C, 1300 °C, 1400 °C, respectively. For the first two samples (S1 and S2) negative strain was found and for the rest of the sample positive strain was found. Negative and positive values of the strain carried good evidence for the compressive and tensile strain of the crystallites (Hossain and Ahmed, 2023).
3.1.3 H-W model
The H-W model provides another procedure that incorporates the integral width β* of the corresponding lattice point and d* as the interplanar spacing for the corresponding cell. This model allows for the determination of both the crystallite size (DH-W) and lattice strain (εH-W) using βhkl and the interplanard-spacing (distance among neighboring planes) through the application of H-W analysis (Sen et al., 2020b).
Modifying the Equation Eq. (9),
Equation (10) can be understood as a straight-line equation, y = mx + c, where the slope represents kλ / D(H-W) and the intercept corresponds to 16
(Sen et al., 2020a). In the H-W method, a graph has been constructed with βcosθ/sin2θ vs (β/tanθ)2, as depicted in Fig. 4. The linear fitting allows for the calculation of crystallite size and lattice strain from the slope and intercept, respectively (Leila et al., 2018).These values have been determined and are tabulated in Table 1.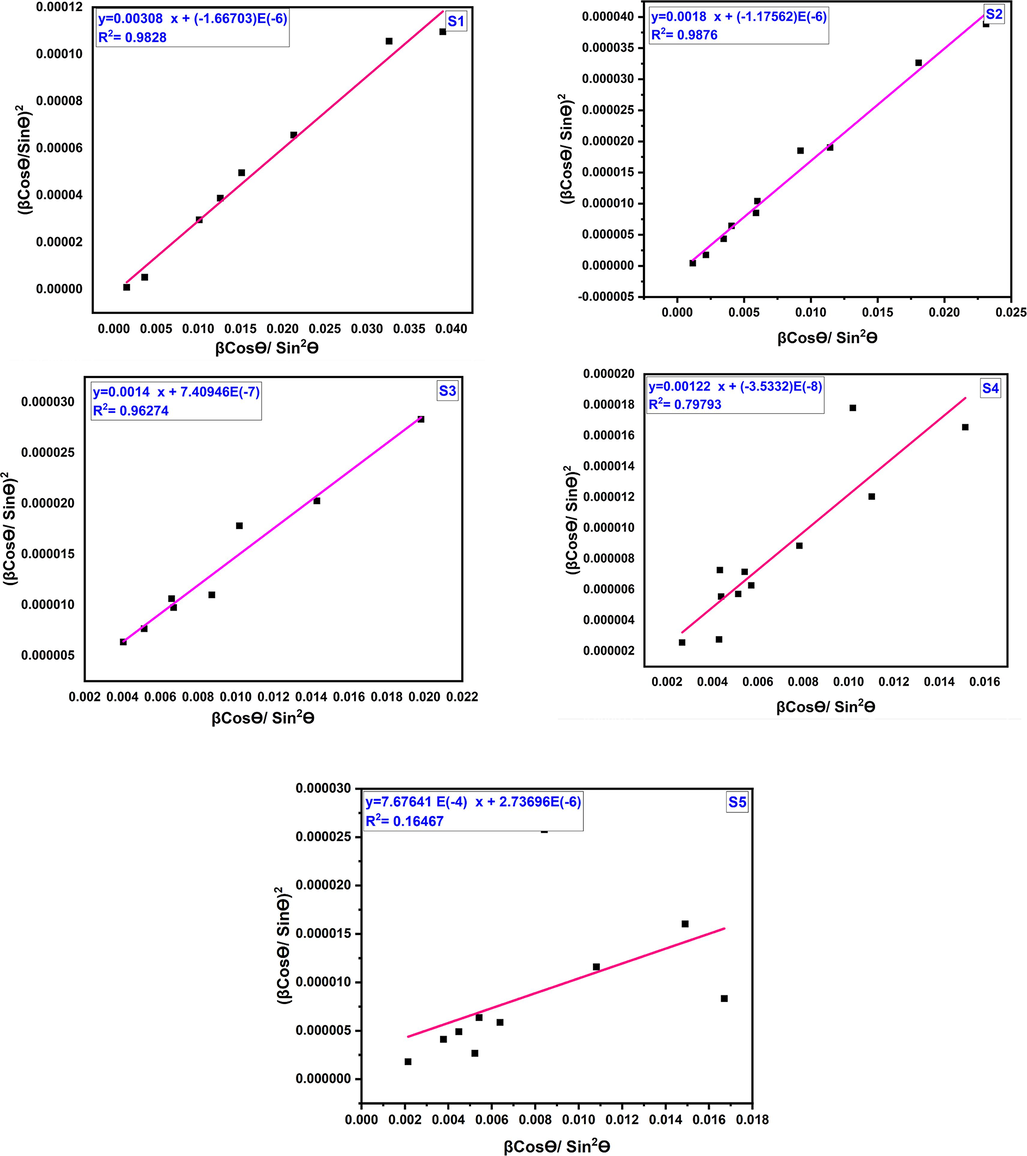
Halder-Wagner plot of cobalt aluminate nanoparticles for different sintering temperature.
The linear fitting using the H-W method exhibit a good fit, as indicated by the correlation factor values of R2. For the respective temperatures of 1000 °C, 1100 °C, 1200 °C, 1300 °C, and 1400 °C, the correlation coefficient values are 0.9828, 0.9876, 0.96274, 0.79793, and 0.16467. These high correlation coefficients suggest a strong linear relationship between the variables in the H-W plot for temperatures up to 1300 °C, while the correlation becomes weaker at 1400 °C.
3.1.4 SSP model
The SSP model is utilized to determine the crystallite size and strain of nanoparticles. This technique assumes the crystal structure to be isotropic (R. Sivakami, S. Dhanuskodi, R. Karvembu, 2016; Sen et al., 2020b). In SSP analysis, the crystallite size is pointed utilizing the Lorentzian function, while the lattice strain is described by the Gaussian function (Ahemen et al., 2016; Kafashan, 2018).
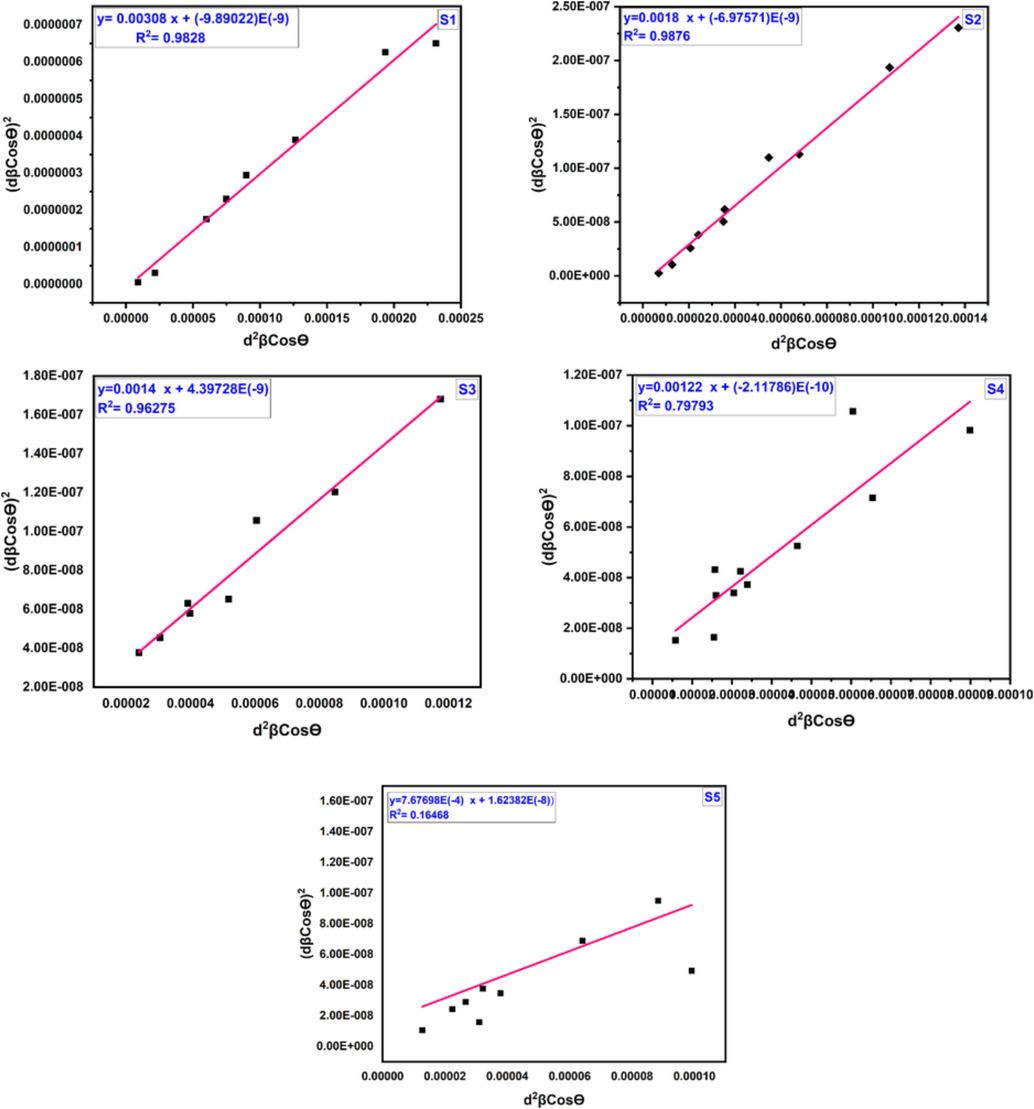
SSP plot of cobalt aluminate at (1000–1400)°C for different calcination temperature.
The SSP method demonstrates a strong fit, as evidenced by the correlation factor (R2) of 0.9828, 0.9876, 0.96275, 0.79793, and 0.16468 for S1, S2, S3, S4, and S5, respectively. These high correlation coefficients indicate a good agreement between the SSP analysis and the data, suggesting that the SSP method is a reliable approach for determining crystallite size and strain in these samples.
The obtained results for the structural parameters show good agreement between the SSP and H-W plot methods. The data is accurately fit in both of these methods, with all high-intensity points aligned with the linear adaptation (Irfan et al., 2018; R. Sivakami, S. Dhanuskodi, R. Karvembu, 2016). This alignment is more pronounced compared to the W-H method. Therefore, it is evident that the SSP and H-W methods are superior in terms of accuracy. The crystallite size for CoAl2O4 nanoparticles derived from the Scherrer model, W-H, H-W, and SSP techniques are relatively similar to each other. This consistency further strengthens the reliability of the SSP and H-W methods for determining crystallite size at various calcination temperatures. It can be observed that sample S1 has the smallest crystallite size among the analyzed samples.
3.2 FTIR analysis
Fig. 6 displays the FTIR absorption bands for samples S1 (1000 °C), S3 (1200 °C), and S5 (1400 °C). Upon analysis, it is observed that three prominent absorption bands are identified at roughly 650 cm−1, 550 cm−1, and 430 cm−1, respectively. These bands indicate the presence of CoAl2O4 spinel in the materials (Zayat and Levy, 2000).The sharp two bands, located around 600 cm−1, are attributed to the intrinsic stretching vibrations of tetrahedral metal complexes. On the other hand, the lowest band around 400 cm−1 is affiliated with octahedral metal complexes (Wang et al., 2004). Moreover, broad bands in the vicinity of 3462 cm−1 represent the –OH stretching vibrational modes.The band at 1630 cm−1 because of vibrational mode of absorbed water molecules (Ge et al., 2013). Additionally, small peaks observed around 2922 cm−1 and 2850 cm-1complementary to the stretching vibrations of C–H bonds (Sharma and Ghose, 2014).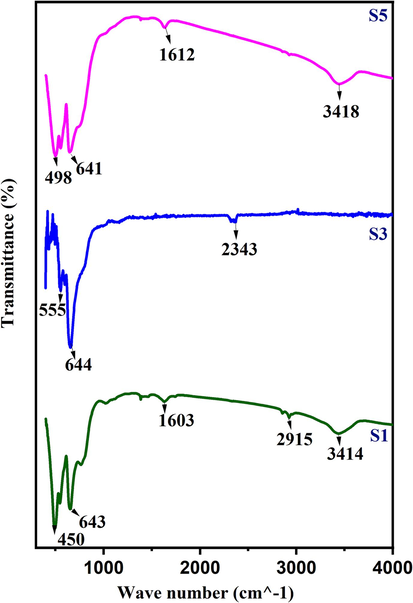
FTIR absorption band of CoAl2O4 nanoparticles for 1000 °C, 1300 °C and 1400 °C.
The existence of CO2 is indicated by the absorption band obtained at 2337 cm−1. On the other hand, small absorption band obtained at 1384 cm−1 is corresponds to left over nitrogen groups arise from the combustion reaction (Wei and Chen, 2006). Notably, in all the samples, observed vibrational modes confirm the existence of spinel CoAl2O4 nanoparticles.
3.3 Morphological analysis
The surface morphology of the samples was analyzed by using Field Emission Scanning Electron Microscopy (FE-SEM). Fig. 7 displays the FE-SEM images and histograms depicting the distribution of particle sizes for different calcination temperatures. The FE-SEM images revealed that the surfaces of the nanoparticles obtained were extensively agglomerated and exhibited various shapes. The degree of agglomeration in CoAl2O4 increased as the calcination was raised from 1000 °C to 1400 °C, primarily due to the augmented surface energy, resulting in larger particle sizes. Increasing the calcination temperature proved advantageous in promoting complete reactions and enhancing the stability and uniformity of the particles. The particle size distribution was found to be irregular and non-uniform. Through the utilization of FESEM micrographs and ImageJ Software (Mazzoli and Favoni, 2012), the average nanoparticle sizes of all materials were determined to range from 23.25 nm to 237.14 nm, as presented in Table 2. The particle sizes of the synthesized materials were increased with the increment of temperature. Similar types of results were also noticed in the case of crystallite size estimated from XRD data. Thus, it can be predicted that the augmented temperature influenced the formation of large crystallites as well as extended agglomeration. In addition to the formation of large particles, the surface roughness was also increased which is clearly visualized form the images.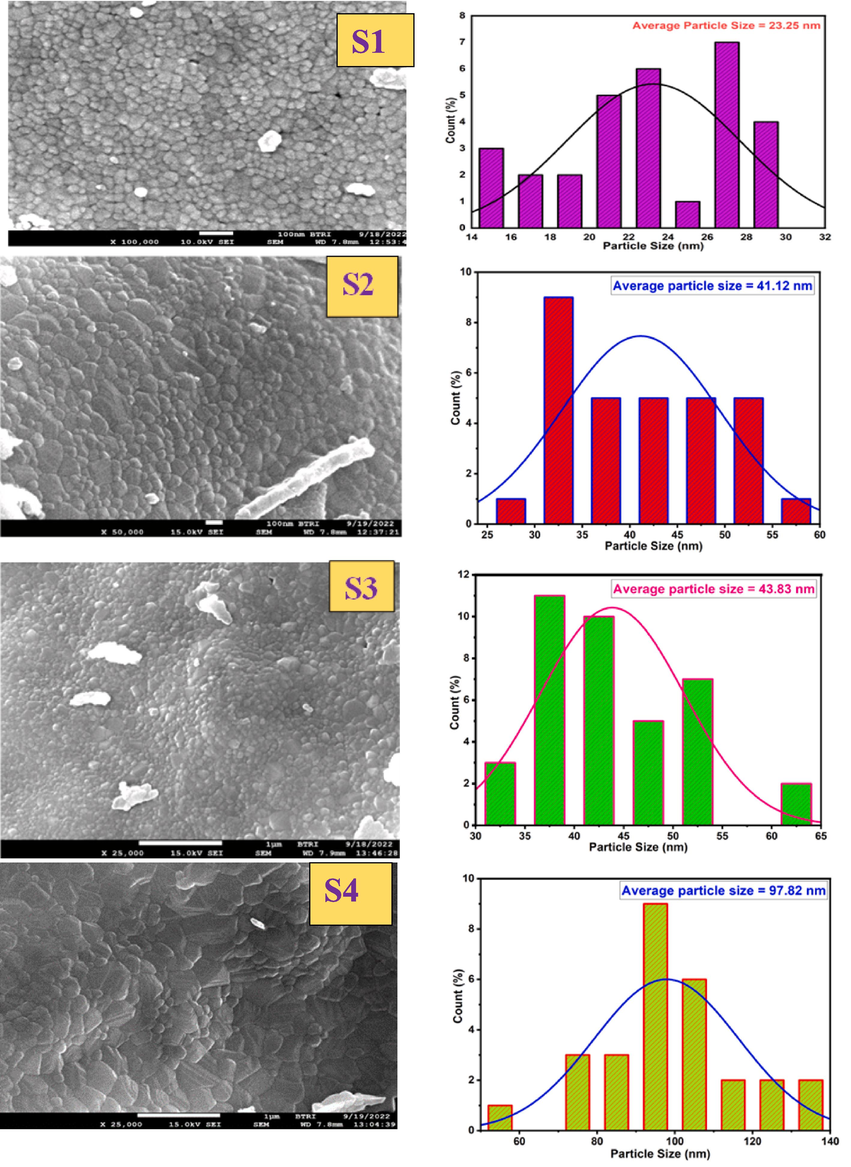
FE-SEM image of CoAl2O4 nanoparticles (for different calcination temperature).
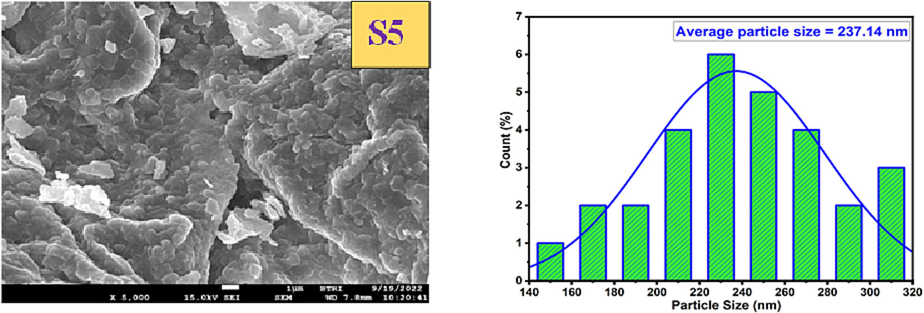
FE-SEM image of CoAl2O4 nanoparticles (for different calcination temperature).
Sample ID
Particle Size(nm)
S1
23.25
S2
41.12
S3
43.83
S4
97.82
S5
237.14
3.4 Compositional analysis of CoAl2O4 nanoparticles
EDS was utilized to verify the elemental and compositional analysis of the CoAl2O4 nanoparticles. The atomic weight percentages at 15 KeV, as depicted in Fig. 8 and Table 3, indicate that the experimental atomic ratio of cobalt (Co) to aluminum (Al) is approximately 1:2 for all the samples. The EDS pattern of CoAl2O4 revealed that the Co/Al ratio of samples S1, S2, S3, S4, and S5 is relatively close to 0.5, except for the S1 sample. Upon conducting the composition analysis, it was confirmed that the presence of Co, Al, and O is free from any impurities.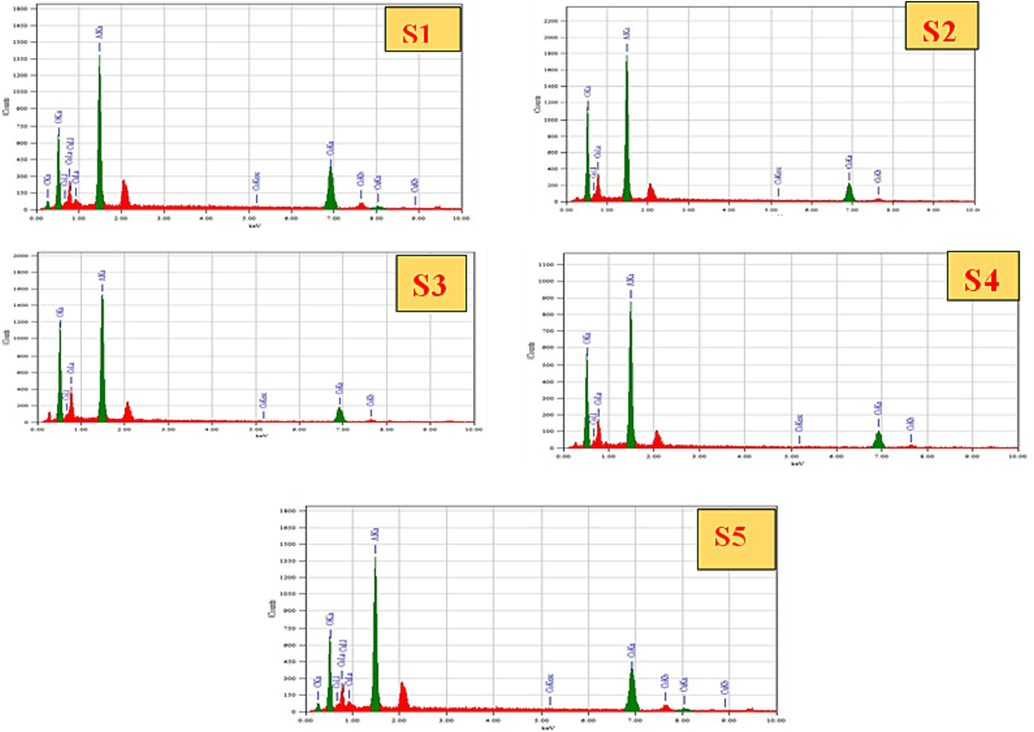
EDS results of CoAl2O4 nanoparticles at different sintering temperature.
Sample ID
Atomic Weight (%)
Co/Al
Co
Al
S1
35.89
28.65
1.25
S2
17.85
28.60
0 0.62
S3
23.65
31.03
0 0.76
S4
17.47
29.24
0 0.60
S5
17.39
28.83
0 0.60
3.5 Zeta potential analysis of CoAl2O4
The zeta potential results for all samples are displayed in Table 4, and these findings are visually represented in Fig. 9. When the values fall within the range of higher + 30 mV and lower −30 mV, it indicates that the nanoparticles are stable in the dispersed solvent (Madhavi et al., 2013). The study reveals that all the samples exhibit a high level of stability in water. As stated in Ohshima's model, smaller particles tend to have higher zeta potential values, while larger particles have lower values. This is attributed to the more intense density of oppositely charged ions surrounding smaller particles compared to larger ones (Holmberg et al., 2013). The sample S1 demonstrates the highest value (-59.4 mV) due to its smaller particle size of 23.25 nm, as observed through FE-SEM, which is significantly smaller than the other obtained nanoparticles.
Sample ID
Zeta potential (mV)
S1
−59.4
S2
−55.3
S3
−46.9
S4
−43.1
S5
−53.6
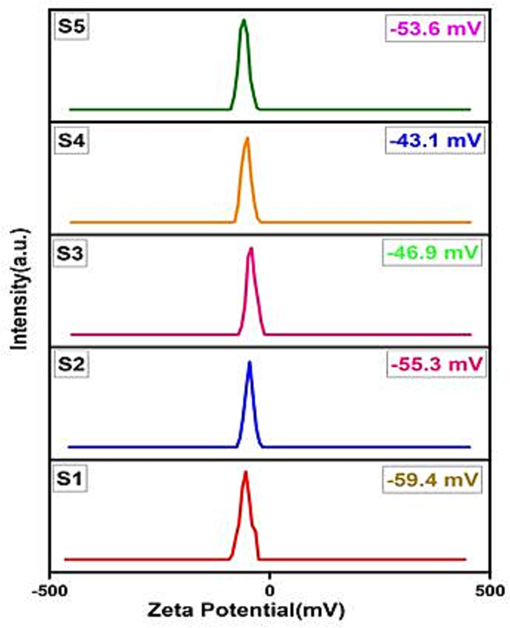
Zeta potentials of CoAl2O4 nanoparticles at different sintering temperature.
3.6 Nanoparticle size analysis of CoAl2O4
Table 5 showcases the particle size distribution of CoAl2O4 nanoparticles, as obtained through the dynamic light scattering model utilizing a nano-particle size analyzer. It is worth noting that the average particle size measured by the nano-particle size analyzer is higher compared to the measurements obtained through FESEM. This disparity can be accredited to the fact that the nanoparticles were dispersed in a 0.005 % water solution during the analysis, causing the nano-particle size analyzer to provide the hydrodynamic diameter, which tends to be larger than the dehydrated diameter observed in FESEM (Bootz et al., 2004; de la Calle et al., 2019). Despite this difference, the trend of increasing particle size aligns with the observations made in FESEM. Specifically, with the increase of calcination temperature the particle size gradually increases within the range of 3130 to 4204.3 nm.
Sample ID
Average Particle Size (nm)
S1
3130.0
S2
3217.8
S3
3373.5
S4
3800.0
S5
4204.3
3.7 Color property analysis of CoAl2O4 at different sintering temperature
The color characteristics of the particles were evaluated using colorimetric data represented by CIE-La*b* values, which are listed in Table 6. The intensity of the blue color in the particles was primarily determined by the b* parameter, where a more negative value indicated a stronger blue hue. With higher in calcination temperature, the b* value steadily rose from −13.74 to −27.36, accompanied by an increase in chroma from 29.28 to 36.40. This demonstrates that the sintering temperature had a remarkable impact on the color characteristics of the nanoparticles. Notably, the S5 sample, calcinated at 1400 °C, exhibited the most intense blue color (b* = −27.36) and the highest saturation (36.40), indicating exceptional color purity and brightness. .
Sample ID
L
a*
b*
Chroma
S1
61.03
−2.33
−13.74
29.28
S2
61.49
−0.74
−16.84
29.81
S3
61.37
0.23
−17.64
29.67
S4
60.03
2.47
−21.81
28.16
S5
66.83
5.45
−27.36
36.40
Cobalt Aluminate
Band Gap Energy
Reference
Zn- and Cu-doped cobalt aluminate
3.1–4.29 eV
(Pathak et al., 2021)
Semiconductor CoAl2O4
1.83 eV
(Boudiaf et al., 2020)
Cobalt Aluminate (C12 &C13)
2.20 – 2.25 eV
(Gingasu et al., 2018)
Cobalt Aluminate
1.89–1.95 eV
This study
To further assess the color characteristics, the reflectivity of the CoAl2O4 nanoparticles was analyzed in the visible range, as depicted in Fig. 10. The intensity of the reflected peak in the blue region (400–492 nm) significantly increased with higher sintering temperatures, aligning with the colorimetric data and confirming the color changes observed (Song et al., 2017).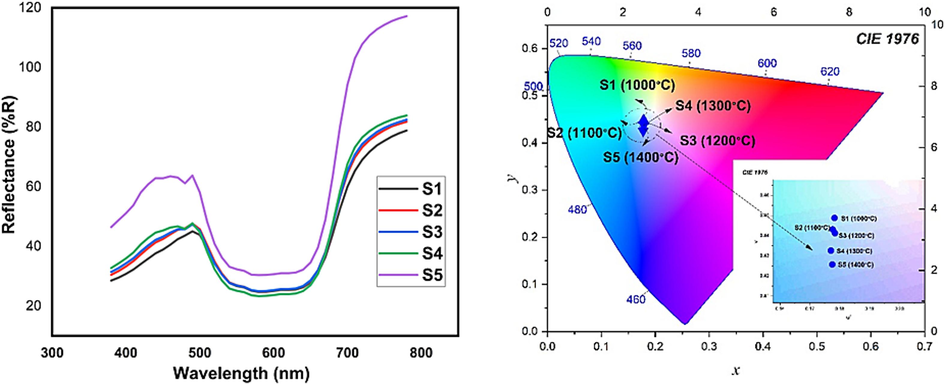
Reflection spectra and Chromaticity of CoAl2O4 nanoparticles in the visible wavelength range.
3.8 Band gap energy
The optical Band-gap energy (Eg) of the obtained nanoparticles was calculated through Kubelka-Munk (K-M) function, which is expressed as follows Eq. (12):
Where, the Kubelka-Munk (K-M) functionEq. (13), denoted as F(R). In this function, R represents the percentage reflectance, while F(R) is directly linked to the material's absorption co-efficient. The Band gap analysis of all the obtained samples was performed on their solid forms. The energy Band gap is a critical parameter in semiconductors, as it provides valuable information regarding their potential applications in optoelectronic devices.
Where, Eg represents the band gap, hϑ signify the energy of photon, n represents the optical transition. In the case of a direct allowed transition, the value of n is assigned as 1/2. The Eg is determined by graphing (αhϑ)2 vs hϑ, as illustrated in Fig. 11 (Debnath and Das, 2020). Optical band gap of nano ferrites normally varied form 3.7 to 5.0 eV (Lal et al., 2020). The calculated values for the Eg using the Kubelka-Munk (K-M) function fall within the range of 1.89 to 1.95 eV. A comparative study is registered in Table 7.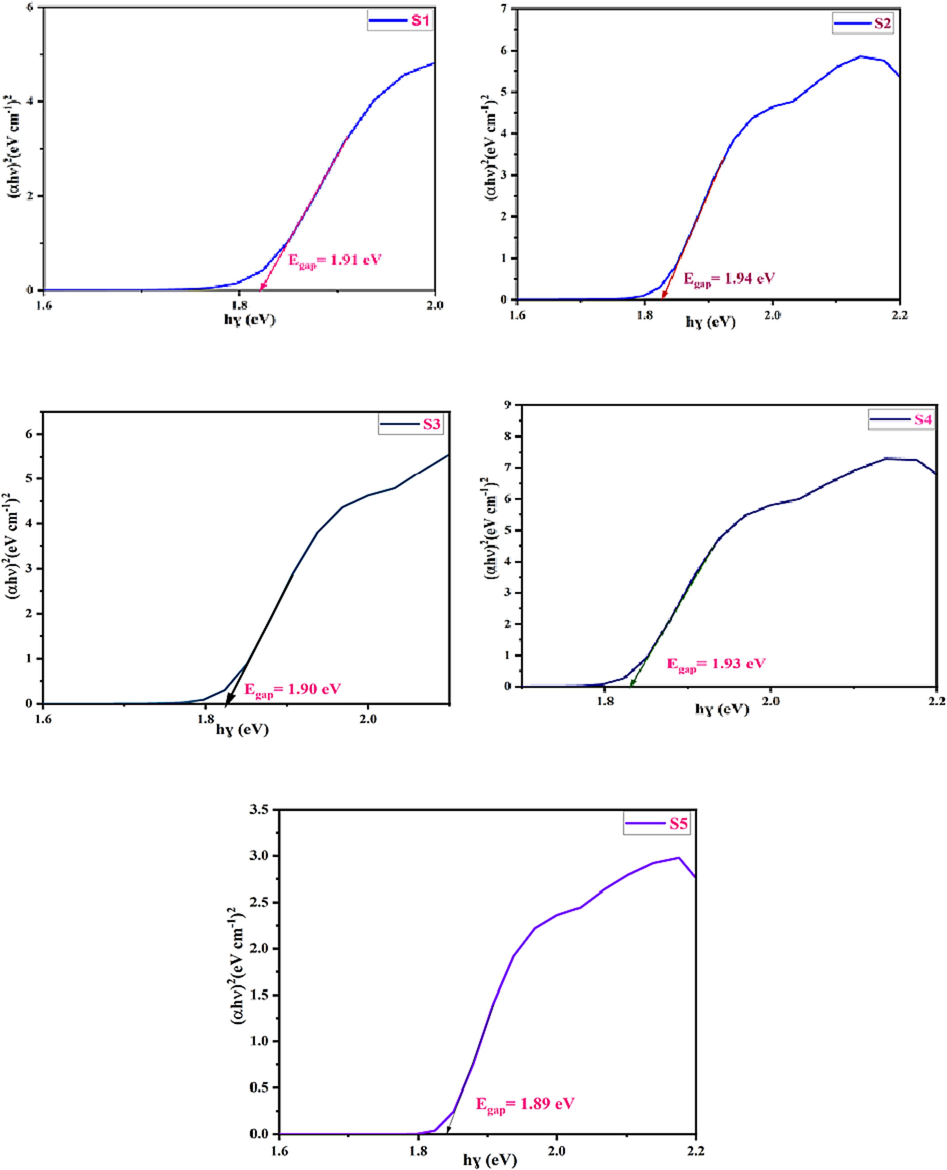
The optical Band gap energy of CoAl2O4 nanoparticles.
4 Conclusion
The CoAl2O4 nanoparticles were synthesized successfully using metal salts and citric acid and glycerol as chelating agents. Phase purity was confirmed from the X-ray diffraction patterns as well as Rietveld refinement. The average crystallite size from four different methods was in the range from 28.01 to 320.97 nm. FESEM images and nanoparticle size analysis demonstrated that the particle size of CoAl2O4 nanoparticles increased with higher calcination temperatures. The zeta potential measurements indicated high dispersion stability for all the samples, suggesting good colloidal stability. Moreover, the colorimetric data using CIE-La*b* values revealed the high purity and brightness of the CoAl2O4 nanoparticles. The findings contribute to the understanding of the relationship between synthesis parameters, sintering temperature, and the resulting properties of CoAl2O4 nanoparticles, offering potential uses in variety of fields such as photocatalysis, energy storage, and sensors. Further research could focus on exploring the specific applications of these nanoparticles and optimizing their synthesis for desired properties.
CRediT authorship contribution statement
Monmon Podder: Investigation, Formal analysis, Software, Data curation, Writing – review & editing, Writing – original draft. Md. Rassel Moni: Validation, Resources, Writing – review & editing. Md. Lutfor Rahman: Validation, Resources, Writing – review & editing. Bristy Biswas: Validation, Resources, Writing – review & editing. Nahid Sharmin: Project administration, Supervision, Writing – review & editing, Funding acquisition. Mahmuda Hakim: Validation, Resources, Writing – review & editing. Moksodur Rahman: Writing – review & editing. Md.Sahadat Hossain: Validation, Resources, Writing – review & editing. Md. Farid Ahmed: Conceptualization, Methodology, Resources, Supervision, Project administration, Visualization, Writing – review & editing.
Acknowledgements
This work was supported by the Ceramic Raw Materials & Ceramic Materials Testing Division, Institute of Glass and Ceramic Research &Testing (IGCRT), Strengthening of Institute of Glass and Ceramic Research & Testing (SIGCRT) of BCSIR project, IGCRT and Biomedical and Toxicological Research Institute (BTRI), Bangladesh Council of Scientific and Industrial Research (BCSIR), Dhaka, Bangladesh.
Declaration of competing interest
The authors declare that they have no known competing financial interests or personal relationships that could have appeared to influence the work reported in this paper.
References
- Effect of apple cider vinegar agent on the microstructure, phase evolution, and magnetic properties of CoFe 2 O 4 magnetic nanoparticles. Int. J. Appl. Ceram. Technol.. 2019;16:1612-1621.
- [CrossRef] [Google Scholar]
- White light tunable emissions from ZnS: Eu 3+ nanophosphors over 330–465 nm excitation range for white LED applications. Mater. Res. Express. 2016;3:045016
- [CrossRef] [Google Scholar]
- Synthesis and spectral characterization of CoxMg1-xAl2O4 as new nano-coloring agent of ceramic pigment. Spectrochim. Acta A. 2009;74(3):665-672.
- [CrossRef] [Google Scholar]
- Comparison of scanning electron microscopy, dynamic light scattering and analytical ultracentrifugation for the sizing of poly(butyl cyanoacrylate) nanoparticles. Eur. J. Pharm. Biopharm.. 2004;57:369-375.
- [CrossRef] [Google Scholar]
- Synthesis and characterization of semiconductor CoAl2O4 for optical and dielectric studies: application to photodegradation of organic pollutants under visible light. Optik. 2020;219:165038
- [Google Scholar]
- MOCVD deposition of CoAl2O4 films. Electrochim. Acta. 2005;50:4592-4599.
- [CrossRef] [Google Scholar]
- J. Chandradass, M. Balasubramanian, K.H. Kim, 2010. https://www.sciencedirect.com/science/article/pii/S0925838810016968. J Alloys Compd 506, 395–399.
- Crystallization of ceramic pigment CoAl2O4 nanocrystals from Co-Al metal organic precursor. J. Alloys Compd.. 1999;287:87.
- [Google Scholar]
- Low temperature field dependent magnetic study of the Zn0. 5Co0. 5Fe2O4 nanoparticles. J. Magn. Magn. Mater.. 2021;536:168102
- [Google Scholar]
- Relaxation mechanism in Ni0.5Zn0.5Fe2O4 nanocrystalline ferrite at a lower temperature. Mater. Lett.. 2021;304:130731
- [CrossRef] [Google Scholar]
- Cui H, Zayat M, Levy D., n.d. Sol-Gel Synthesis of Nanoscaled Spinels Using Propylene Oxide as a Gelation Agent. J. Sol-Gel Sci. Technol. 35, 175–181.
- Application of the full factorial design to improving the properties of CoFe2O4 nanoparticles by simultaneously adding apple cider vinegar and agarose. Mater. Sci. Eng. B. 2023;297:116754
- [Google Scholar]
- Synthesis and characterization of spinel-type zinc aluminate nanoparticles by a modified sol–gel method using new precursor. J. Alloys Compd.. 2011;509:2487-2492.
- [CrossRef] [Google Scholar]
- Particle size characterization of Sepia Ink Eumelanin biopolymers by SEM, DLS, and AF4-MALLS: A comparative study. Food Anal. Methods. 2019;12:1140-1151.
- [CrossRef] [Google Scholar]
- Study of the optical properties of Zn doped Mn spinel ferrite nanocrystals shows multiple emission peaks in the visible range –a promising soft ferrite nanomaterial for deep blue LED. J. Mol. Struct.. 2020;1199:127044
- [CrossRef] [Google Scholar]
- Synthesis, structural, morphological properties of cobalt- aluminum nano-composite. Int. J. Electrochem. Sci.. 2013;8:12.
- [Google Scholar]
- Blue pigments based on CoxZn1−xAl2O4 spinels synthesized by the polymeric precursor method. Dyes Pigments. 2009;81:187-192.
- [CrossRef] [Google Scholar]
- Particle size comparison of soft-chemically prepared transition metal (Co, Ni, Cu, Zn) aluminate spinels. J. Am. Ceram. Soc.. 2006;89:1014-1021.
- [CrossRef] [Google Scholar]
- Preparation of Co2+-doped ZnAl2O4 nanoparticles by citrate sol–gel method. J. Alloys Compd.. 2005;386:311.
- [CrossRef] [Google Scholar]
- L. Gama, M.A. Ribeiro, B.S. Barros, R.H.A. Kiminami, I.T. Weber, A.C.F.M. Costa, 2009. Synthesis and characterization of the NiAl2O4, CoAl2O4 and ZnAl2O4 spinels by the polymeric precursors method. J Alloys Compd 483, 453–455. http://dx.doi.org/10.1016%2Fj.jallcom.2008.08.111.
- Facile synthesis of highly thermostable mesoporous ZnAl 2 O 4 with adjustable pore size. J. Mater. Chem. A. 2013;1:1651-1658.
- [CrossRef] [Google Scholar]
- Synthesis of cobalt aluminate nanoparticles by combustion methods using cinnamon bark extract. Rev. Roum. Chim.. 2018;63:459-466.
- [Google Scholar]
- Stabilization of Co2+ in layered double hydroxides (LDHs) by microwave-assisted ageing. J Solid State Chem 2007; 180: 873–884. J. Solid State Chem.. 2007;180:873-884.
- [Google Scholar]
- Surface charge and interfacial potential of titanium dioxide nanoparticles: Experimental and theoretical investigations. J. Colloid Interface Sci.. 2013;407:168-176.
- [CrossRef] [Google Scholar]
- Easy and green synthesis of TiO2 (Anatase and Rutile): Estimation of crystallite size using Scherrer equation, Williamson-Hall plot, Monshi-Scherrer Model, size-strain plot, Halder-Wagner Model. Results Mater.. 2023;20:100492
- [Google Scholar]
- Imanipour, P., Hasani, S., Seifoddini, A., Nabia\lek, M., 2022. Synthesis and characterization of zinc and vanadium co-substituted CoFe2O4 nanoparticles synthesized by using the sol-gel auto-combustion method. Nanomaterials 12, 752.
- The possibility of vanadium substitution on Co lattice sites in CoFe2O4 synthesized by sol–gel autocombustion method. J. Sol-Gel Sci. Technol.. 2020;95:157-167.
- [CrossRef] [Google Scholar]
- X-ray peak profile analysis of CoAl2O4 nanoparticles by Williamson-Hall and size-strain plot methods. Mod. Electron. Mater.. 2018;4:31-40.
- [CrossRef] [Google Scholar]
- CO2 reforming of methane to synthesis gas over sol–gel-made Co/γ-Al2O3 catalysts from organometallic precursors. Appl. Catal. Gen.. 2001;207:247-255.
- [CrossRef] [Google Scholar]
- Structural characterizations of pure SnS and In-doped SnS thin films using isotropic and anisotropic models. Mater. Res. Express. 2018;5:046417
- [CrossRef] [Google Scholar]
- Synthesis of cobalt aluminate nanopigments by a non-aqueous sol-gel route. Nanoscale. 2013;5:4277-4283.
- [Google Scholar]
- Lal, G., Punia, K., Dolia, S.N., Alvi, P.A., Choudhary, B.L., Kumar, S., 2020. Structural, cation distribution, optical and magnetic properties of quaternary Co0. 4+ xZn0. 6-xFe2O4 (x= 0.0, 0.1 and 0.2) and Li doped quinary Co0. 4+ xZn0. 5-xLi0. 1Fe2O4 (x= 0.0, 0.05 and 0.1) nanoferrites. J. Alloys Compd. 828, 154388.
- Effect of polyethylene glycol and propyltrimethoxysilane on structural and optical properties of zinc oxide nanoparticles synthesized by sol–gel process. J. Theor. Appl. Phys.. 2018;12:159-167.
- [CrossRef] [Google Scholar]
- Application of phytogenic zerovalent iron nanoparticles in the adsorption of hexavalent chromium. Spectrochim. Acta. A Mol. Biomol. Spectrosc.. 2013;116:17-25.
- [CrossRef] [Google Scholar]
- XAS and GIXRD study of Co sites in CoAl 2 O 4 layers grown by MOCVD. Chem. Mater.. 2010;22:1933-1942.
- [CrossRef] [Google Scholar]
- Particle size, size distribution and morphological evaluation of airborne dust particles of diverse woods by Scanning Electron Microscopy and image processing program. Powder Technol.. 2012;225:65-71.
- [CrossRef] [Google Scholar]
- Microemulsion mediated sol-gel synthesis of nano-scaled MAl2O4 (M=Co, Ni, Cu) spinels from single-source heterobimetallic alkoxide precursors. J. Mater. Chem.. 1999;9:1755-1763.
- [CrossRef] [Google Scholar]
- Preparation and investigation of the structural properties of α-Al2O3 nanoparticles using the sol-gel method. Chem. Data Collect.. 2020;29:100531
- [CrossRef] [Google Scholar]
- The effect of agarose agent on the structural, magnetic and optical properties of barium hexaferrite nano-particles synthesized by sol-gel auto-combustion method. Ceram. Int.. 2023;49:9757-9770.
- [Google Scholar]
- Williamson-Hall analysis in estimation of lattice strain in nanometer-sized ZnO particles. J. Theor. Appl. Phys.. 2012;6:6.
- [CrossRef] [Google Scholar]
- Recent development on preparation of ceramic inks in ink-jet printing. Ceram. Int.. 2015;41:12515-12528.
- [Google Scholar]
- Enhanced stability and tunable bandgap of Zn- and Cu-doped cobalt aluminate. J. Mater. Sci. Mater. Electron.. 2021;32:182-190.
- [CrossRef] [Google Scholar]
- Production of a stable and homogeneous colloid dispersion of nano CoAl2O4 pigment for ceramic ink-jet ink. J. Eur. Ceram. Soc.. 2014;34:3119-3126.
- [CrossRef] [Google Scholar]
- Transparent CoAl2O4 hybrid nano pigment by organic ligand-assisted supercritical water. J. Am. Chem. Soc.. 2007;129:11061-11066.
- [CrossRef] [Google Scholar]
- Synthesis and organic modification of CoAl2O4 nanocrystals under supercritical water conditions. J. Mater. Chem.. 2007;17:4426.
- [CrossRef] [Google Scholar]
- X-ray peak profile analysis of pure and Dy-doped α -MoO 3 nanobelts using Debye-Scherrer, Williamson-Hall and Halder-Wagner methods. Adv. Nat. Sci. Nanosci. Nanotechnol.. 2020;11:025004
- [CrossRef] [Google Scholar]
- XRD peak profile and optical properties analysis of Ag-doped h-MoO3 nanorods synthesized via hydrothermal method. J. Mater. Sci. Mater. Electron.. 2020;31:1768-1786.
- [CrossRef] [Google Scholar]
- Synthesis and characterization of nanocrystalline zinc aluminate spinel powder by sol–gel method. Ceram. Int.. 2014;40:3209-3214.
- [CrossRef] [Google Scholar]
- Optimization of the structural and magnetic properties of MnFe2O4 doped by Zn and Dy using Taguchi method. J. Magn. Magn. Mater.. 2022;541:168390
- [Google Scholar]
- Effect of chemistry and particle size of cryochemical powders on the properties of humidity sensors. Powder Metall. Met. Ceram.. 1998;37:161-164.
- [CrossRef] [Google Scholar]
- Estimation of lattice strain in nano crystalline RuO2 by Williamson-Hall and size-strain plot method. Spectrochim. Acta - Part Mol. Biomol. Spectrosc.. 2016;152:43-50.
- [CrossRef] [Google Scholar]
- Sol-Gel Sci. Technol.. 2003;26:771.
- Preparation and spectroscopic characterization of blue CoAl2O4 coatings. J. Sol-Gel Sci. Techn.. 2003;26:771-775.
- [Google Scholar]
- The diffraction of X rays by distorted crystal aggregates - I. Proc. Phys. Soc.. 1944;56:174-181.
- [CrossRef] [Google Scholar]
- Theoretical investigation of the inversion parameter in Co3−sAl sO4 (s=0–3) spinel structures. Solid State Ion.. 2009;180:1011-1016.
- [Google Scholar]
- Highly dispersed re-doped CoAl2O4 nanopigments: synthesis and chromatic properties. J. Nanomater.. 2016;2016
- [CrossRef] [Google Scholar]
- A. Walsh, Y. Yan, M.M. Al-Jassim, S.-H. Wei, J, 2008. . J Phys Chem C 112, 12044.
- Synthesis of cobalt-aluminum spinels via EDTA chelating precursors. J. Mater. Sci.. 2004;39:6191-6201.
- [CrossRef] [Google Scholar]
- Synthesis and characterization of nanosized zinc aluminate spinel by sol–gel technique. Mater. Lett.. 2006;60:823-827.
- [CrossRef] [Google Scholar]
- Eu-doped ZnO nanoparticles for dielectric, ferroelectric and piezoelectric applications. J. Alloys Compd.. 2016;689:333-341.
- [CrossRef] [Google Scholar]
- Preparation of nanosized CoAl2O4 powders by sol–gel and sol–gel-hydrothermal methods. J. Alloys Compd.. 2009;468:443-446.
- [CrossRef] [Google Scholar]
- Chem. Mater.. 2000;2763
- Blue CoAl 2 O 4 particles prepared by the sol−gel and citrate−gel methods. Chem. Mater.. 2000;12:2763-2769.
- [CrossRef] [Google Scholar]
- Bright blue halloysite/CoAl2O4 hybrid pigments: Preparation, characterization and application in water-based painting. Dyes Pigments. 2017;139:473-481.
- [Google Scholar]
- A novel method for synthesis of Co–Al layered double hydroxides and their conversions to mesoporous CoAl2O4 nanostructures for applications in adsorption removal of fluoride ions. Micropor. Mesopor. Mat.. 2015;201:91-98.
- [Google Scholar]
- Synthesis and characterization of Co 1–x Ca x Al 2 O 4 composite blue nano-pigments by the polyacrylamide gel method. Dyes Pigments. 2018;148:25-30.
- [CrossRef] [Google Scholar]


