

Translate this page into:
Exploring the potential of carbon-coated MoSe2 nanoparticles as a photothermal therapy for ovarian cancer
⁎Corresponding authors at: Department of Obstetrics and Gynecology, The First Affiliated Hospital of Xi’an Jiaotong University, Xi’an Jiaotong University, Xi’an, Shaanxi, PR China. wangjia_80@163.com (Jia Wang), gaoli23@mail.xjtu.edu.cn (Li Gao)
-
Received: ,
Accepted: ,
This article was originally published by Elsevier and was migrated to Scientific Scholar after the change of Publisher.
Abstract
Molybdenum selenide (MoSe2) as a nano near-infrared absorber has been widely studied in the field of photothermal therapy of cancer. However, there are few studies on its application in the treatment of ovarian cancer. In this paper, a new type of carbon-coated MoSe2 (MEC) nanoparticle was prepared by a one-step hydrothermal method. MEC was successfully synthesized as avidenced by chemical characterization. A large number of biological experiments confirmed that MEC + Laser group had the lowest cell viability (61.6 % ± 8.9 %), inhibited the proliferation of human ovarian cancer (SKOV-3) cells in G2/M phase, induced apoptosis (apoptosis rate: 43.24 % ± 0.85 %), and increased the intracellular ROS level (93.86 % ± 1.42 %). Furthermore, MEC nanoparticles displayed excellent photothermal therapy in tumor-bearing mice with no obvious side effects on major organs. Finally, the therapeutic mechanism of MEC nanoparticles was explored, and it was found that they had higher absorbance and could generate more heat during laser irradiation, thereby improving their therapeutic effect on ovarian cancer. MEC nanoparticles, as photothermal agents, have good anticancer ability. And they have the potential to become an important candidate for the treatment of ovarian cancer.
Keywords
MoSe2
Carbon-coated
Ovarian cancer
Photothermal therapy

1 Introduction
Ovarian cancer is one of the common malignant tumors in female genital organs, and it is the most common gynecological malignant tumor with high incidence and mortality (Siegel et al., 2020). At present, chemotherapy is one of the main methods for treating ovarian cancer, but traditional chemotherapy drugs often have limitations in efficacy and side effects, which bring great pain and a decline in quality of life to patients (Narod, 2016, Alharbi et al., 2018, Richardson et al., 2023, Yu et al., 2023). Therefore, searching for new, efficient, and safe chemotherapy drugs has become an important research direction in current ovarian cancer treatment.
Photothermal therapy (PTT) is a minimally invasive method that has received extensive attention from researchers in recent years (Sweeney et al., 2018, Ledezma et al., 2022, Mishra et al., 2022, Yun et al., 2022, Mosleh-Shirazi et al., 2023, Shabani et al., 2023). In this method, photothermal agents play a primary role. There are various types of photothermal agents, most of which are near-infrared (NIR) absorbing nanomaterials such as Au nanomaterials (Jabeen et al., 2014, Feng et al., 2015, Hu et al., 2015, Noh et al., 2015), carbon nanomaterials (Akhavan and Ghaderi, 2013, Hu et al., 2014, Jaque et al., 2014), and two-dimensional (2D) layered transition metal dichalcogenides (TMDCs) (Liu et al., 2015, Wang et al., 2015, Li and Wong, 2017, Tan et al., 2017). TMDCs due to their relatively good stability, low price, and good dispersibility compared to the other two materials, have been widely studied. Selenium-doped molybdenum disulfide (MoSe2) as a TMDC has been applied in PTT for cancer treatment (Chen et al., 2018, He et al., 2019, Wu et al., 2020). Yuwen et al. developed an ultrasound-assisted liquid detachment method to prepare ultrasmall MoSe2 nanodots (NDs) directly in water. In vitro cell experiments showed that MoSe2 NDs had insignificant cell toxicity and effectively killed HeLa cells (human cervical cancer cell line) under NIR laser irradiation (Yuwen et al., 2016). Zhang et al. prepared MoSe2 nanocrystalline functionalized bioactive bredigite scaffolds (MS-BRT) using a 3D printing and hydrothermal method. MS-BRT not only had low toxicity and good osteogenesis but also had the ability to photothermally kill bone tumors (Zhang et al., 2022). Besides, much emphasis has been focused on photodynamic therapy (PDT), which uses photosensitizers under appropriate light irradiation to produce reactive oxygen species (ROS) and induce irreversible damage to the local tumor tissue (Wang et al., 2019a,b). MoSe2 exerted highly efficient synergistic effects on the photothermal/photodynamic combination therapy of breast cancer (Liu et al., 2020) and hepatoma carcinoma (Wang et al., 2019a,b). However, the biological compatibility and stability of MoSe2 may not meet requirements in some cases, so surface coating treatment is needed. After surface coating treatment, MoSe2 is isolated from the outside world, thereby improving its biological compatibility and stability. Chai et al. prepared a polydopamine (PDA)-coated MoSe2 doxorubicin (DOX) hollow mesoporous silica nanoparticle (HMSN) nanoplatform (PM@HMSNsDOX) with good biological compatibility, stability, and synergistic photothermal conversion efficiency (Chai et al., 2018). Gao et al. prepared a carbon-coated MoSe2 nanoparticle and studied its anticancer effect in renal cell carcinoma (RCC). The experimental results showed that doped carbon-coated MoSe2 nanoparticles had an obvious anticancer effect on 786-O and human renal carcinoma (ACHN) cells in RCC, and had good biocompatibility with Human Kidney-2 (KH-2) cells (Gao et al., 2019).
Compared with other studies, molybdenum selenide was selected as the main photothermal agent, and molybdenum selenide was coated with C as the carrier. Carbon-coated MoSe2 (MEC) nano-materials were synthesized by hydrothermal method in one step. MEC nanoparticles were successfully prepared as evidenced by chemical characterization. In addition, the photothermal effect of MEC was evaluated in vitro and in vivo, and it was found that MEC could effectively inhibit the proliferation of ovarian cancer cells and kill them under the condition of laser irradiation. MEC is expected to be widely used in the treatment of ovarian cancer.
2 Experimental
2.1 Materials
Selenium (Se) powder was purchased from Beilian Fine Chemicals Development Co., Ltd (Shanghai, China). Sodium molybdate (Na2MoO4⋅2H2O) was purchased from Chemical Reagent Plant Four (Tianjin, China). Hydrazine hydrate (80 %, N2H4⋅H2O) was purchased from Fuyu Fine Chemical Co., Ltd (Tianjin, China). Ethanol was purchased from Damao Chemical Reagent Factory (Tianjin, China). The reagents and materials applied in this research were of an analysis grade (AR).
2.2 Preparation of MoSe2 (M) nanoparticles
First of all, add 0.765 g of Na2MoO4⋅2H2O (241.95 g/mol), 0.5 g of selenium powder (78.96 g/mol), and 5 mL of N2H4⋅H2O (132.504 g/mol) into 40 mL of deionized water. Then, mix the mixture with a magnetic stirrer at a speed of 1000 r/min for 30 min. Next, transfer the mixture to a 100 mL Teflon high-pressure reaction flask and keep it at a temperature of 200 °C for 12 h. After that, cool the high-pressure reaction flask down to room temperature and remove the complex from the flask using a centrifugal separator three times with deionized water. In addition, the deposit obtained after centrifugation is dried at 60 °C for 12 h to obtain MoSe2 (M) nanoparticles.
2.3 Preparation of carbon-coated MoSe2 (MEC) nanoparticles
0.765 g of Na2MoO4⋅2H2O and 0.5 g of selenium powder are added into 40 mL of deionized water, and then 20 mL of ethanol and 10 mL of N2H4⋅H2O are added into the mixture. After stirring for 30 min, the mixture was evenly stirred and transferred to a 100 mL stainless steel autoclave lined with polytetrafluoroethylene, and kept at 200 °C for 12 h. Then the reactants were naturally cooled to room temperature, and the suspension was centrifuged. After ultrasonic treatment with deionized water and isopropanol (volume ratio of 1:1) for 2 h, it was washed by centrifugation. After drying at 60 °C, black MEC powder was obtained.
2.4 Characterization
The surface morphology of nanoparticles was observed by both scanning electron microscopy (SEM, OXFORD instruments, UK) and transmission electron microscopy (TEM, H-7650, HITACHI, Japan). X-ray diffraction (XRD, D8 Advance Diffractometer, Bruker, Germany) was used to analyze the crystal phase structure of the prepared nanoparticles, with Cu-Ka radiation (λ = 0.15406 nm) running at 40 kV and 40 mA. Fourier transform infrared spectroscopy (FT-IR, Nicolet iS50 spectrometer, Thermo Fisher Scientific, USA) was used to analyze the chemical functional groups of the prepared nanoparticles, with a spectral resolution of 4 cm−1 in the range of 400–4000 cm−1. The thermal stability of the prepared nanoparticles was analyzed from room temperature to 800 °C by thermogravimetric analysis (TGA, NETZSCH Group, Germany). X-ray photoelectron spectroscopy (XPS, Escalab 250Xi, Thermo Fisher Scientific, USA) was used to analyze the chemical composition of the prepared nanoparticles, with a range of 0–800 eV. Multi-peak fitting of elements such as Mo, Se, N, C, and O was performed using XPSpeak41 software. The Ultraviolet–visible (UV–Vis) absorption spectrum from 200 to 850 nm was recorded using the UV–2700 UV–Visible Spectrophotometer (Shimadzu Corporation, Japan). Using a dynamic light scattering instrument to evaluate the particle size, particle size distribution, and stability of MEC. Using a thermal imaging instrument to monitor the temperature changes under laser irradiation in real time to assess the photothermal performance of MEC.
2.5 In vitro cytotoxicity
The in vitro cytotoxicity was assessed by 3-(4,5-dimethylthiazol-2-yl)-2,5-diphenyltetrazolium bromide (MTT) assay. SKOV-3 cells were collected and counted by an automatic cell counter (Countstar). 5 × 10³ cells in 100 μL dulbecco's modified eagle medium (DMEM) medium were seeded into 96-well plates overnight. On the second day, cells were treated with different concentrations of M or MEC dispersed in the culture medium. After 12 h, cells of the laser group were irradiated with 808 nm NIR laser at 2 W/cm2 for 10 min and incubated for another 12 h. Then, the culture medium was removed, and 100 μL of MTT solution (0.5 mg/mL, Solarbio) was added into each well. After 4 h incubation, MTT solution was removed and 150 μL of Dimethyl sulfoxide(DMSO, Sigma) was added into each well to dissolve the formazan crystals. Absorbance at 490 nm was measured by a microplate reader (Biotek Synergy Neo2).
2.6 Colony formation assay
SKOV-3 cells were seeded and cultured in the six‐well plate at a density of 1000 cells/well in DMEM high glucose containing 10 % FBS for 48 h. Next, the cells were treated with M and MEC nanoparticles. After incubation for 24 h, near-infrared light irradiation (808 nm, 10 min) was applied to the experimental groups. Cells were cultured in the 5 % CO2, 37 °C environments for another 10 days to allow colony formation. The plate was washed with PBS three times. The colonies were fixed with 4 % polyformaldehyde for 15 min and dyed with crystal violet staining solution (C0121, Beyotime) for 15 min at room temperature. After washing with PBS 3 times, the colonies were counted. Three individual experiments were performed.
2.7 Cell cycle
SKOV-3 cells were cultured in 6-cm dishes and incubated overnight. Medium containing M or MEC were added, respectively. After incubation for 24 h, cells were irradiated with near-infrared light (808 nm, 10 min). Cells were digested by trypsin and collected for centrifugation (1000g, 5 min). After being washed with phosphate buffered saline (PBS) twice, precipitates were fixed in 70 % ethanol at 4 °C overnight. Cells were washed with PBS twice and incubated with propidium iodide (PI)/RNase staining buffer at 37 °C for 30 min. The cell cycle was determined with flow cytometry (ACEA NovoCyte, Agilent, U.S.A).
2.8 Migration assay
Transwell migration experiments used a 24-well transwell cavity with an aperture of 8 μm to evaluate the migration activity of SKOV-3 cells. SKOV-3 cells were cultured in a 6 cm Petri dish and incubated overnight. Adding culture medium containing M or MEC respectively. After 24 h incubation, the cells were irradiated with near-infrared light (808 nm, 10 min). Trypsin digested the cells, and the cells were collected and centrifuged (1000 g, 5 min). SKOV-3 cells (5 × 10⁴) suspended in 200 μL serum-free DMEM were inoculated in the upper chamber, and 800 μL medium containing 10 % FBS was inoculated in the lower chamber. Cells migrated in transwell for 24 h. After washing with PBS three times, the cells were fixed with 4 % polyoxymethylene for 15 min, and stained with crystal violet staining solution (C0121, Beyotime) for 15 min at room temperature. Wipe the non-migrating cells from the upper surface of the filter with a cotton swab. The cells migrating to the lower surface of the filter were counted at a magnification of 100× in five randomly selected fields of view using an inverted optical microscope. Each assay was done in triplicate.
2.9 Live/dead cells assay
The killing efficiency on SKOV-3 cells was detected by Calcein-AM/PI co-staining. SKOV-3 cells were cultured in a 12-well plate and incubated overnight. 500 μL culture media containing M or MEC were added, respectively. After incubation for 24 h, the excess nanoparticles were washed with PBS, and then the cells were irradiated with near-infrared light (808 nm, 10 min). Cells were stained by Calcein-AM and PI (Cat No. PF00007, Proteintech). The fluorescence images of cells were taken by fluorescence microscopy.
2.10 Apoptosis
SKOV-3 cells were cultured in a 6-well plate and incubated overnight. Medium containing M or MEC were added, respectively. After incubation for 24 h, cells were irradiated with near-infrared light (808 nm, 10 min). Cells were digested by trypsin and collected for centrifugation. After being washed with PBS twice, cells were stained by Annexin V-FITC/PI (40302ES60, Yeasen Biotechnology Co., Ltd.) for 15 min in the dark. Cells were detected by flow cytometry and shown in a two-color dot plot.
2.11 ROS detection
ROS in cells was detected by 2,7-Dichlorodihydrofluorescein diacetate (DCFH-DA). Briefly, SKOV-3 cells were seeded in a 6-well plate and cultured overnight. M and MEC were added to cells in the dark environment for 24 h. Cells were irradiated with laser (808 nm) for 10 min. After that, the cells were washed 3 times with PBS and further incubated with DCFH-DA (10 μM) for 30 min in the dark. Stained cells were photographed by fluorescence microscopy (Leica DMC6200). For quantification of fluorescence, cells were collected after irradiation and incubated with a DCFH-DA probe. The stained cells were analyzed by flow cytometry.
2.12 SKOV-3 xenograft nude mice model
Female 4-week-old BALB/c-Nude mice were bought from Gempharmatech Co., Ltd. Before experiments, all mice were acclimatized for one week. They were housed with free access to food and water under normal conditions with a 12–hour light/dark cycle. All operations on animals were conducted under protocols approved by the Animal Ethics Committee of Xi’an Jiaotong University. SKOV-3 cells in the logarithmic growth phase were counted under sterile conditions and were suspended in serum-free DMEM containing Matrigel (Corning) with a density of 5 × 10⁷/mL. The tumor models were established by subcutaneous injection of 100 µL cell suspension of SKOV-3 at the right flank of each mouse. After approximately one week, mice with tumor volumes of 70–100 mm3 were randomized into different groups.
2.13 In vivo studies
SKOV-3 tumor-bearing mice were randomly divided into four groups (n = 5 per group), including (1) Saline, (2) Saline + Laser, (3) MEC, and (4) MEC + Laser. 100 μL of MEC (0.25 mg/mL) were intratumorally injected into the group (3) and group (4). After 24-h injection, tumors in group (2) and group (4) were irradiated with an 808 nm laser (2.0 W/cm2, 2 min). Group (1) was given 100 μL normal saline. Mice’s body weights were recorded every 2 days. The tumor dimensions were measured every 2 days via digital caliper measurements. The tumor volume was calculated with the formula V = length × width2 × 0.5. At the end of the experiment, the mice were sacrificed, and the major organs and tumors were obtained. The animal model construction and treatment scheme are shown in Fig. 1.
Schematic representation of the established SKOV-3 tumor-bearing mice model and treatments.
2.14 Statistical analysis
All statistical analyses were performed with GraphPad Prism 8.0.2. The data were expressed as mean ± SD based on at least three independent experiments. The statistical significance of the difference among groups was determined using a one-way ANOVA and two-way ANOVA. P value <0.05 was considered statistically significant.
3 Results and discussion
3.1 SEM, TEM and Particle size analysis
After being prepared, M and MEC nanoparticles were observed by SEM and TEM to determine their surface morphology. The SEM image of M nanoparticles (Fig. 2A) presented a flower shape and was adsorbed together due to the higher surface energy (Li et al., 2019, Lu et al., 2021). The TEM image of M nanoparticles is displayed in Fig. 2B, and it can be seen that the spherical M nanoparticles are composed of relatively thin nanosheets piled up. The SEM image of MEC nanoparticles (Fig. 2C) demonstrated that the edges and surface of MEC nanoparticles become relatively smooth compared to the SEM image of M nanoparticles (Fig. 2A), and the morphology of the internal M nanoparticles becomes fuzzy, thus confirming that M nanoparticles are surrounded by a layer of material. Fig. 2D is the TEM image of MEC nanoparticles, and it can be seen that a thin film exists at the edge of MEC nanoparticles, surrounding the internal M nanoparticles (Gao et al., 2019). Dynamic light scattering was used to evaluate particle size, size distribution, and stability of MEC. The hydrodynamic size of MEC was 413.6 nm, larger than the particle size determined by TEM analysis in a dry state (Qin et al., 2022). Size distribution of MEC was shown in Fig. 2E demonstrating unimodal narrow size distribution. Moreover, the stability of MEC was assessed in deionized water (Fig. 2F), and the results indicated that the mean diameter did not change significantly over a week, implying that MEC remained quite stable.
Scanning electron microscopy (SEM) and transmission electron microscopy (TEM) images of nanoparticles: (A)–(B) M, (C)–(D) MEC; (E) particle size distribution curves of MEC; (F) stability test of MEC in water.
3.2 XRD, FT-IR, TGA and DSC analysis
Fig. 3A and B show the XRD images of M and MEC. It can be seen that M detected the characteristic peaks of 004, 100, 102, 106, and 110 at 28.6°, 33.4°, 35.6°, 53.8° and 57.1°, respectively. However, the crystallinity of MEC at corresponding positions is lower than that of M. This indicates that a layer of material coats M and blocks direct exposure of X-rays to M (Hao et al., 2013, Bin Yaqub et al., 2020). Fig. 3C and D show the FT-IR spectra of M and MEC. The infrared absorption peaks from 2009 cm−1 to 2675 cm−1 are mainly due to NH2+ and NH3+ vibrations. It can be clearly seen that the intensity of the C—OH infrared absorption peak at 685 cm−1 in MEC is much higher than that in M (Gao et al., 2019, Wang et al., 2021a,b). And it can be seen that Se—O absorption peak is detected in both M and MEC, and more absorption peaks can be found in MEC between 500 and 1000 cm−1, which may be caused by the presence of C-containing functional groups (Vishnu and Badhulika, 2019, Kaur et al., 2020). Combining XRD and FT-IR spectra, it can be inferred that M is coated with a layer of carbon-containing material. TGA analysis was used to study the thermal stability, and the weight loss of the MEC nanoparticles presented a unique curve as Fig. 3E shown. The MEC nanoparticles have the weight increase before the temperature of 311 °C, because the MEC nanoparticles reacted with air. And the sharp weight loss of 311–447 °C can be attributed to the decomposition of carbon compound. Then the TGA curve became stable in the temperature range of 447-701 °C, and the curve had a sharp weight after 701 °C. As shown in Fig. 3F, the total heat of melt is represented by DSC. The data revealed that the thermo-oxidative decomposition temperature was at 285 °C. Compared to the 311 °C in TGA (Fig. 3E), the weight increase revealed that the MEC nanoparticles also reacted with air after 285 °C (Gao et al., 2019).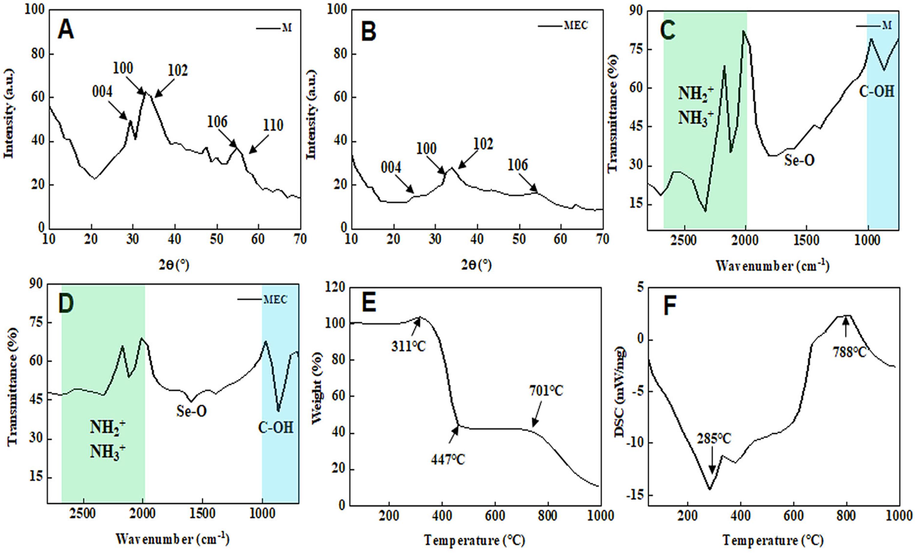
X-ray diffraction (XRD) image of M (A) and MEC (B); Fourier transform infrared spectroscopy (FT-IR) spectra of M (C) and MEC (D); (E) Thermogravimetric (TGA) image of MEC; (F) Differential scanning calorimetry (DSC) image of MEC.
3.3 XPS analysis
Fig. 4 is the XPS image of MEC. It can be seen from Fig. 4A that MEC is mainly composed of C, O, Mo, Se, and N. Fig. 4B–F shows the high-resolution spectra of Mo 3d, Se 3d, N 1s, C 1s, and O 1s. Fig. 4B shows the high-resolution spectrum of Mo 3d. Two characteristic peaks appear at 228 eV and 231.1 eV respectively, corresponding to Mo 3d5/2 and Mo 3d3/2, which are the main forms of Mo in MoSe2 (Li et al., 2020). Fig. 4C shows the high-resolution spectrum of Se 3d, and the characteristic peaks appear at 53.9 eV and 55.7 eV representing Se 3d5/2 and Se 3d3/2 respectively (Jeevanandham et al., 2021). Fig. 4D shows the high-resolution spectrum of N 1s, and the characteristic peak appears at 398.4 eV. The existence of element N is due to the addition of N2H4 as an oxidant during the preparation of MEC, which leads to the residue. Fig. 4E shows the high-resolution spectrum of C 1s, and the characteristic peaks that appear at 283.2 eV and 285.6 eV represent C 1s and C-OR respectively. The appearance of element C is due to the coating treatment with ethanol in the preparation of MoSe2. Fig. 4F shows the high-resolution spectrum of O 1s, and the characteristic peak appears at 531.8 eV. It is also caused by ethanol coating.
X-ray photoelectron spectroscopy (XPS) spectra of MEC: (A) survey, (B) Mo 3d, (C) Se 3d, (D) N 1s, (E) C 1s, (F) O 1s.
3.4 UV–vis and photothermal performance analysis
As shown in Fig. 5A, MEC displays strong light absorption throughout the UV–vis spectrum, which is likely caused by its dark black color (Wang et al., 2021a,b). The characteristic of MEC UV–vis absorption spectrum is similar to the UV–vis absorption spectrum of MoSe2 reported by Huang et al (Huang et al., 2022) and Wang et al (Wang et al., 2021a,b). Fig. 5B-C demonstrated the temperature variation curves depend on irradiation time. Under laser irradiation, MEC-induced temperature rose from 22 °C to 77.9 °C, while M-induced temperature from 22 °C to 57.5 °C (Fig. 5B). Additionally, 500 μg/mL MEC can induce a higher temperature rise than 100 μg/mL MEC. Therefore, MEC showed a good photothermal performance in a dose-dependent manner.
(A) Ultraviolet absorption spectrum of MEC; photothermal performance of MEC. (B) Temperature variation curves versus irradiation time for MEC aqueous solution (500 μg/mL, 200 μL), M aqueous solution (500 μg/mL, 200 μL) and H2O (200 μL) under NIR laser irradiation (808 nm, 1 W/cm2). (C) Temperature variation curves versus irradiation time for different concentrations of MEC aqueous solution (0, 100, 500 μg/mL, 200 μL) under NIR laser irradiation (808 nm, 1 W/cm2).
3.5 Phagocytosis analysis
The phagocytosis of nanoparticles in SKOV-3 cells was observed by biological transmission electron microscopy (Bio-TEM), which is shown in Fig. 6. High-magnification images (50,000×) of M nanoparticles further demonstrated that these particles easily aggregate to form larger particles. Ovarian cancer cell line SKOV-3 cells have high uptake efficiency of these particles, which may be due to the ligand-mediated intracellular endocytosis pathway. These particles can be phagocytized by lysosomes implying that the phagocytosis of particles by lysosomes may be related to cell apoptosis. Therefore, these particles can enter SKOV-3 cells and suppress cell proliferation by inducing cell apoptosis.
Low- (10000×) and high-magnification (50000×) Bio-TEM images of SKOV-3 cells treated with M and MEC.
3.6 Cytotoxicity analysis
We used the 3-(4,5-dimethylthiazol-2-yl)-2,5-diphenyltetrazolium bromide (MTT) method to determine the cell toxicity of M and MEC on the ovarian cancer cell line SKOV-3 cells after treatment for 24 h. As shown in Fig. 7A-B, M and MEC decreased cell viability in a dose-dependent manner, and MEC showed a stronger cell-killing effect. To evaluate the photothermal therapeutic effect of materials, cells were treated with different concentrations of nanoparticles for 12 h, followed by irradiation with near-infrared light (808 nm, 2 W/cm2) for 10 min and incubation at 37 °C in a cell culture incubator for another 12 h. MTT assay was utilized to detect the cell viability before and after irradiation at the same concentration of nanoparticles. It was found that when the MEC concentration was 10 μg/mL, the cell viability after irradiation (61.6 % ± 8.9 %) was lower than that before irradiation (74 % ± 4.1 %) (P < 0.05). Additionally, we used IOSE-80 cells to assess the MEC cytotoxicity for normal ovarian epithelial cells and found negligible cytotoxicity, as shown in Fig. 7D–E. The clone formation assay is an in vitro cell survival assay for evaluating the ability of a single cell to grow into a cell colony. When a cell proliferates and grows for more than 6 generations in an in vitro simulation environment, the colony formed by all the cells of that one cell is called a colony, which is a preferred method for determining changes in cell survival ability after treatment. As shown in Fig. 7C, the number of colonies in the MEC and MEC + Laser (MEC + L) treatment groups were significantly fewer than that in other treatment groups, indicating that the cell toxicity of MEC and its photothermal therapeutic effect can significantly inhibit cell proliferation.
Cell viability of SKOV-3 cells treated with different concentrations of M (A) and MEC (B) with/without NIR laser irradiation (808 nm, 10 min). (C) Colony formation assays of SKOV-3 cells with different treatments. *P < 0.05; cell viabilities of IOSE-80 cells treated with different concentration of M (D) or MEC (E).
3.7 Cell proliferation and migration analysis
Due to the impact of the cell cycle on cell proliferation, we conducted flow cytometry to detect the effects of different treatments on the cell cycle. As shown in Fig. 8A and 8C, the percentage of SKOV-3 cells in the G0/G1 phase in the control group was 44.39 % ± 0.28 %, while the percentages of SKOV-3 cells in the G0/G1 phase after M, MEC, and MEC + L treatments were lower (30.16 % ± 2.84 %, 28.7 % ± 2.49 %, and 29.1 % ± 2.87 %, respectively) (P < 0.05). However, the percentage of SKOV-3 cells in the G2/M phase after MEC + L treatment was higher than that in the control group (7.75 % ± 0.41 %) (P < 0.05). This indicates that MEC + L treatment caused the cell cycle of SKOV-3 cell arrest in the G2/M phase, which is unfavorable for cell proliferation, further explaining the mechanism of its antiproliferation effect. Additionally, cell migration is a crucial biological process of tumorigenesis and metastasis. To explore the effects of MEC on the migration ability of SKOV-3 cells, cells were collected after 24 h exposure to different treatments for transwell migration experiments. As shown in Fig. 8B and 8D, the number of migrated cells in the MEC and MEC + Laser treatment groups was significantly fewer than that in the other treatment groups, indicating that the cytotoxicity of MEC and its photothermal therapeutic effect can also significantly inhibit cell migration, providing excellent therapeutic effects.
(A) Cell cycle analysis for SKOV-3 cells after being treated with M and MEC with/without NIR laser irradiation (808 nm, 10 min). (B) Representative images of transwell migration assays in SKOV-3 cells after different treatments. (C) Effects of different drug treatments on the cell cycle phase. (D) Number of cell migration. *P < 0.05; **P < 0.01; ***P < 0.001; ****P < 0.0001.
3.8 Cell-killing ability
Calcein-AM and PI were employed to stain live and dead cells simultaneously, as shown in Fig. 9A. The control group and the laser group showed significant green fluorescence, indicating the presence of many live cells. In the M and M + Laser treatment groups, the green fluorescence decreased while the red fluorescence increased, indicating the presence of a few dead cells caused by the cell-killing effect of the corresponding treatments. In the MEC and MEC + Laser treatment groups, the red fluorescence increased significantly, indicating a high degree of cell death caused by the cell-killing effect of the corresponding treatments. The fluorescence intensity (FL) was quantified by Image J software to assess the ratio of red FL to the total FL, showing the significant difference in the comparison of the MEC+Laser group with other groups (Fig. 9C). Flow cytometry was employed to quantify apoptotic cells labeled with Annexin V-FITC/PI, the results are shown in Fig. 9B. Three independent experiments were conducted for repeating verification shown in Fig. 9D. The MEC + Laser group showed a dramatically higher rate of apoptosis (43.24 % ± 0.85 %) than the control group (9.7 % ± 3.87 %), the Laser group (10.41 % ± 1.88 %), the M group (17.13 % ± 0.37 %), the M + Laser group (19.76 % ± 1.20 %), and the MEC group (40.22 % ± 1.45 %) (P < 0.05). This indicates that the photothermal therapeutic effect of MEC can effectively induce significant cell apoptosis and thus kill cancer cells.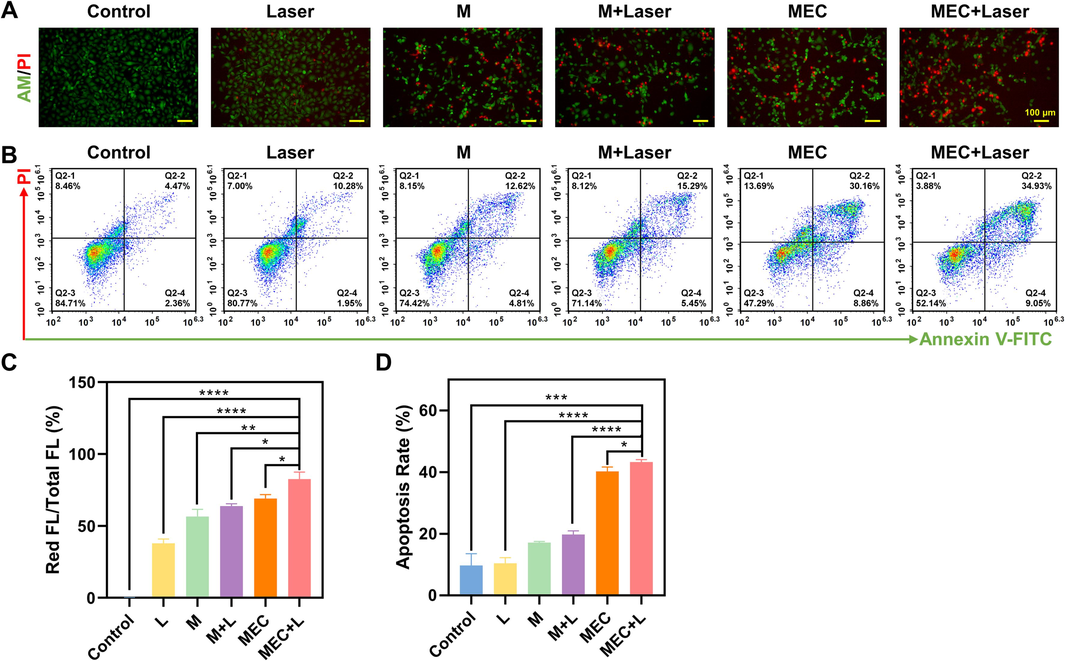
(A) Live and dead co-staining images of SKOV3 cells stained by Calcein-AM/PI after various treatments. (B) Apoptosis for SKOV-3 cells after being treated with M and MEC with/without NIR laser irradiation (808 nm, 10 min). (C) The ratio of red fluorescence intensity to total fluorescence intensity. (D) Apoptosis rate. *P < 0.05; **P < 0.01; ***P < 0.001; ****P < 0.0001. (For interpretation of the references to color in this figure legend, the reader is referred to the web version of this article.)
3.9 Intracellular ROS level
The DCFH-DA probe, which may be converted by ROS into DCFH exhibiting green fluorescence, was examined to evaluate the level of ROS in SKOV-3 cells. As shown in Fig. 10A, the green fluorescence of cells treated with light and M was weak, while the green fluorescence of cells treated with M + Laser, MEC, and MEC + Laser was stronger. Among them, the green fluorescence of cells in the MEC + Laser group was the strongest (Fig. 10C). The quantitative analysis of ROS levels determined by flow cytometry for DCFH-DA fluorescence was consistent with the fluorescence images. The results are shown in Fig. 10B and 10D, the intracellular ROS level in the MEC + Laser group (93.86 % ± 1.42 %) was significantly higher than that in the control group (0.08 % ± 0.07 %), the laser group (23.52 % ± 3.26 %), the M group (49.62 % ± 2.34 %), the M + Laser group (86.03 % ± 2.73 %), and the MEC group (71.10 % ± 4.01 %) (P < 0.05). Similarly, Wang et al. synthesized the MoSe2 nanoflower as photosensitizers to produce intracellular ROS in response to NIR irradiation (Wang et al., 2018). The increased ROS production is due to the successful separation of photogenic charges (Wang et al., 2019a,b). The hyperpyrexia produced by the photothermal effect can enhance the transfer of photo-generated electrons, which is favorable for the production of ROS (Wang et al., 2019a,b). Due to its redox properties, selenium is an oxidant that can lead to oxidative stress by producing excessive amounts of harmful reactive oxygen species (ROS) (Zhou et al., 2020). According to research from Ujjawal H. Gandhi, selenium can exacerbate the generation of intracellular ROS, by inhibiting processes that provide antioxidant defense and triggering mitochondrial oxidative phosphorylation-dependent ROS synthesis (Gandhi et al., 2014). Excess selenium overcomes these antioxidant defenses, resulting in increased ROS-dependent genomic instability and apoptosis (Gandhi et al., 2014).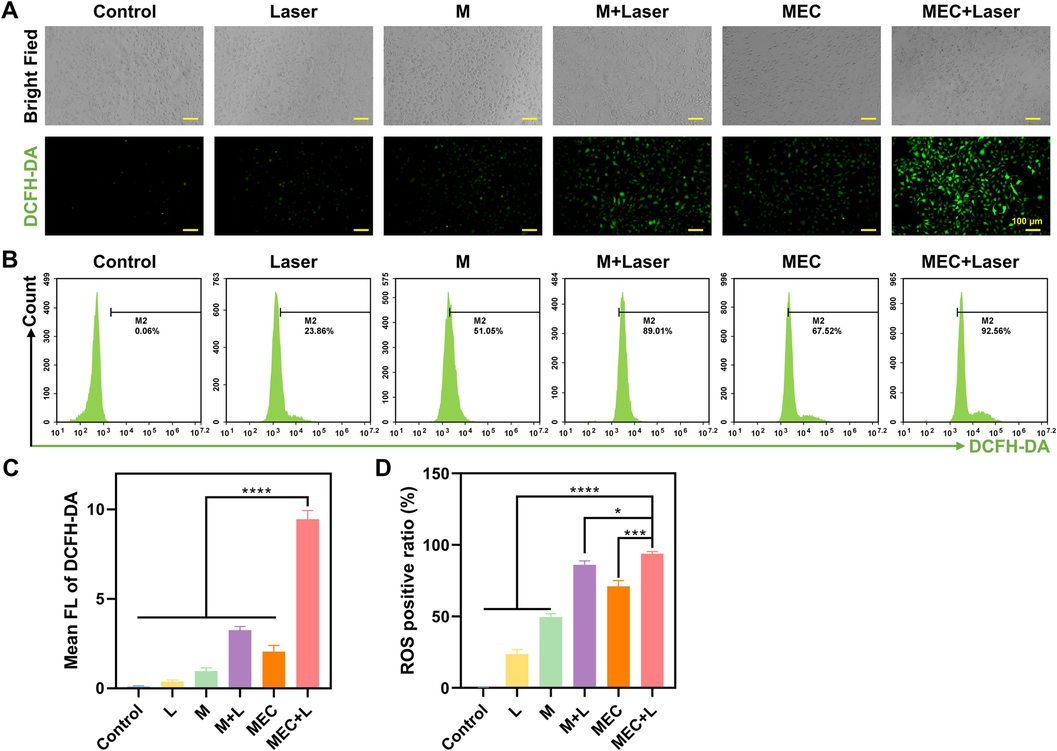
Fluorescence microscopic images (A) and flow cytometry analysis (B) of ROS generation by DCFH-DA in SKOV-3 cells after being treated with M and MEC with/without NIR laser irradiation (808 nm, 10 min). (C) Mean FL of DCFH-DA. (D) ROS positive ratio. *P < 0.05; **P < 0.01; ***P < 0.001; ****P < 0.0001.
3.10 Anti-cancer effect in vivo
Based on the above results, we further evaluated the antitumor effect of nanoparticles on an ovarian cancer animal model in xenotransplanted mice. Firstly, female nude mice were subcutaneously inoculated with SKOV-3 cells to establish a subcutaneous xenograft model. To evaluate the general condition of the mice, the weight of the tumor-bearing mice was measured every other day and the weight change was recorded, as shown in Fig. 11A. The weight of all treatment groups of mice increased, and there were no significant differences between the groups, indicating that treatments had no apparent side effects on the mice. In contrast, the weight of the control group decreased, indicating that the general condition of the mice in the untreated group was terrible, and ovarian cancer is a highly malignant tumor.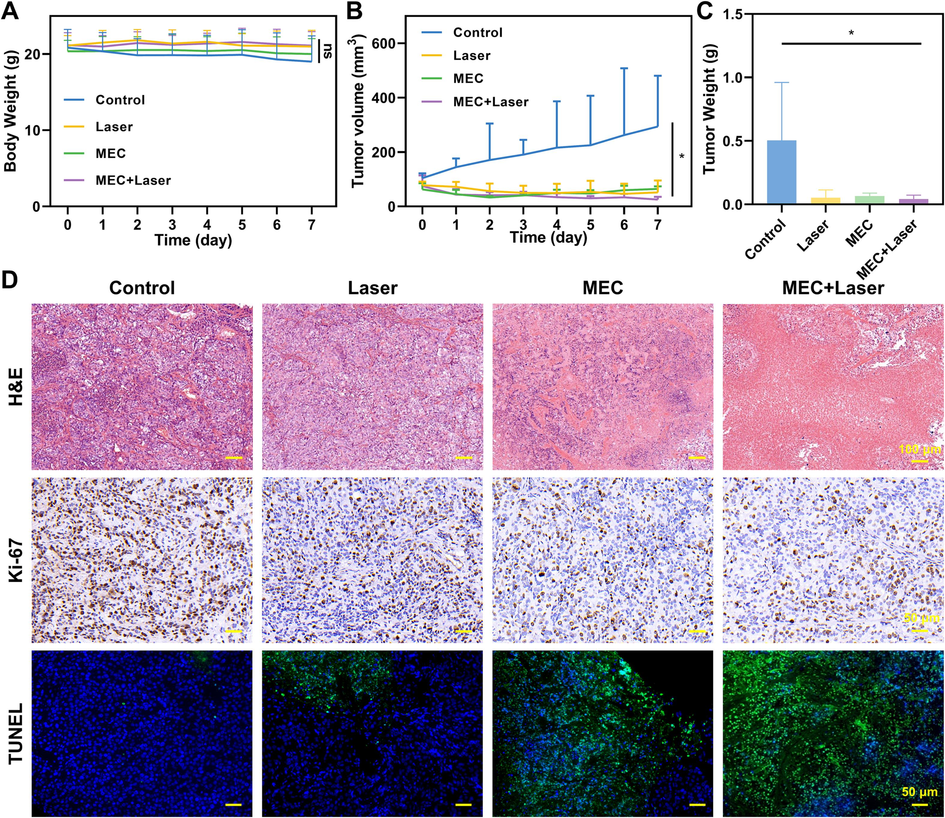
Therapeutic efficacy in vivo. (A) Body weight changes of mice in different groups (n = 5). (B)Tumor growth curves of tumor-bearing mice subject to diverse treatments. (C) Mean weights of dissected tumors after different treatments. (D) H&E, Ki-67, and TUNEL staining images of xenograft tumors after different treatments. *P < 0.05.
The volume of tumors in each group was calculated to plot tumor growth curves (Fig. 11B). MEC had a suppressive effect on tumor growth, and when combined with near-infrared radiation, the growth rate of the tumors significantly slowed down. At the end of the treatment, the tumor-bearing mice were euthanized and the major organs and tumors were collected for evaluation. The weight of the tumors was consistent with the volume growth curve, and the tumors in the treatment groups were smaller than those in the control group, indicating great antitumor efficacy (Fig. 11C). Hematoxylin-eosin (H&E) staining is the most widely used method for tissue research. It is also the fundamental method for pathological diagnosis to visualize the microstructure of normal and pathological tissues. H&E staining was performed on the tumor tissues, and the control group showed significant abnormal morphology, while the MEC and MEC + Laser groups showed severe damage to the tumor cells, indicating necrotic cells (Fig. 11D). Recombinant Ki-67 Protein (Ki-67) is a biomarker for cell proliferation, and immunostaining for Ki-67 was used to further evaluate the impact of MEC incorporating photothermal therapy on the proliferation of cancer cells at the tissue level. The control group showed a significant brownish-yellow color in the cell nuclei, indicating a high expression of Ki-67, while the MEC + Laser group had a significantly lower expression of Ki-67, indicating excellent inhibition of cell proliferation. Terminal deoxynucleotidyl transferase (TdT)-mediated 2-deoxyuridine-5-triphosphate (dUTP) nick-end labeling (TUNEL) staining was employed to evaluate the level of cell apoptosis in the tumor tissues. The control and light groups showed no significant green fluorescence, indicating that most of the cancer cells were alive, while the MEC and MEC + Laser groups showed significant green fluorescence, indicating a high level of apoptosis. It suggests that MEC has a significant cytotoxic effect and its photothermal therapy can effectively promote cell apoptosis, consistent with the results of the flow cytometry apoptosis assay.
3.11 Histological structure staining of major organs in mice after treatment
H&E staining was performed to observe the structural organization of the mice's major organs, as shown in Fig. 12. The myocardial fibers were arranged regularly, and there was no loss or vacuolation observed in the hearts of mice. The hepatic lobules were intact, and the hepatocyte morphology was normal. The splenic parenchyma was intact, and the cell morphology was normal. The lung tissue had a normal alveolar structure, and there was no detection of lung fibrosis. The kidney tubule structure was normal, and there was no damage or necrosis.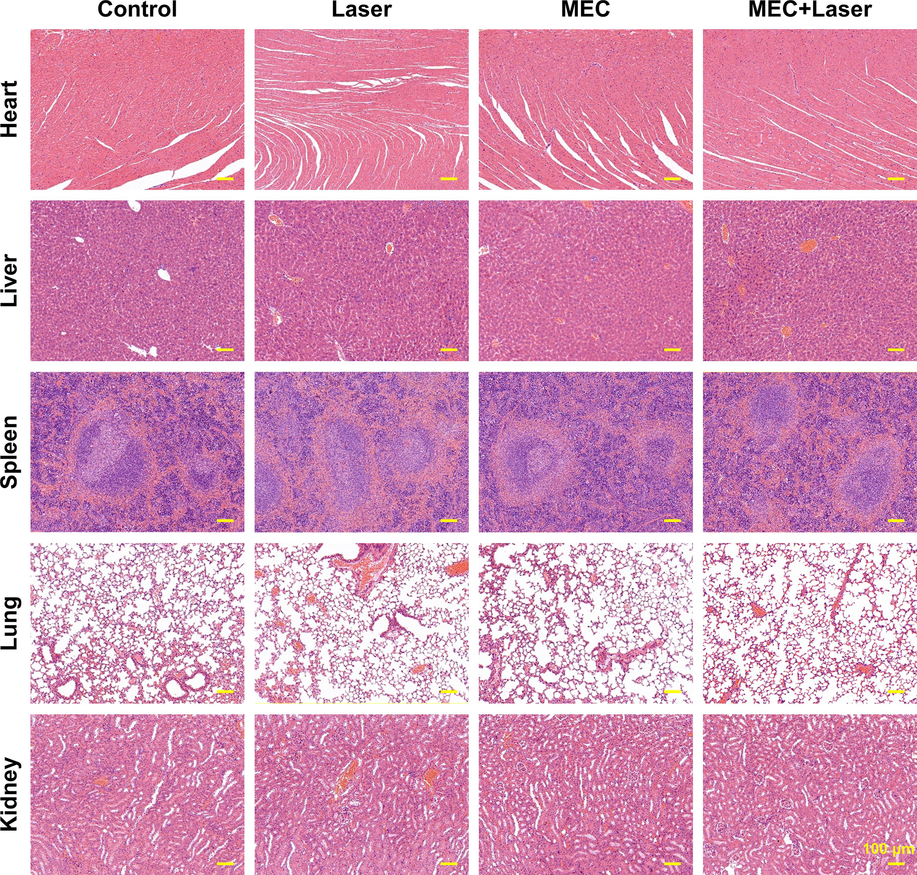
HE staining of major organs (Heart, Liver, Spleen, Lung, and Kidney) in mice after different treatments.
3.12 MEC treatment mechanism analysis
The therapeutic mechanism of MEC nanoparticles is shown in Fig. 13. First of all, it can be seen that MEC is darker than M because it is coated with amorphous carbon (which is reflected in both Figs. 2 and 6), which leads to an increase in the absorbance of MEC relative to M, and the heat generated at the same time as the absorbance increases. When MEC enters SKOV-3 cells, MEC nanoparticles can effectively inhibit the proliferation of SKOV-3 cells and induce the apoptosis of SKOV-3 cells through photothermal effect under near-infrared laser irradiation (808 nm, 10 min), and there are no obvious toxic and side effects on major organs after treatments.
Therapeutic mechanism.
4 Conclusions
As a nano near-infrared absorber, MoSe2 has been widely studied in the field of photothermal therapy of cancer. Compared with previous studies, MEC nanoparticles were prepared by a one-step hydrothermal method. The successful synthesis of MEC nanoparticles was confirmed by various chemical characterization. The MTT experiment on normal ovarian epithelial cells that MEC nanoparticles had good biocompatibility. In vivo and in vitro study confirmed that compared with other control groups, MEC + L group had the lowest tumor and cell viability (61.6 % ± 8.9 %), inhibited G2/M human ovarian cancer (SKOV-3) cell proliferation, induced apoptosis (apoptosis rate: 43.24 ± 0.85 %), and increased intracellular ROS level (93.86 % ± 1.42 %). And MEC had no obvious toxic or side effects on major organs of tumor-bearing mice. Finally, the therapeutic mechanism of MEC nanoparticles was explored, and it was found that they had higher absorbance and could generate more heat during laser irradiation, thereby improving their therapeutic effect on ovarian cancer. Therefore, MEC can transform NIR laser energy into heat and selectively destroy cancer cells via local hyperthermia while not interfering with healthy cell growth.
Author contributions
Li Gao and Hui Yu developed the initial concept. All authors discussed the results and commented on the manuscript.
Funding
Natural Science Basic Research Program of Shaanxi (Program No.2020SF-030).
Acknowledgements
This work was supported by the Natural Science Basic Research Program of Shaanxi (Program No. 2020SF-030).
Declaration of competing interest
The authors declare that they have no known competing financial interests or personal relationships that could have appeared to influence the work reported in this paper.
References
- Graphene nanomesh promises extremely efficient in vivo photothermal therapy. Small. 2013;9:3593-3601.
- [CrossRef] [Google Scholar]
- The potential role of miRNAs and exosomes in chemotherapy in ovarian cancer. Endocr. Relat. Cancer. 2018;25:E663-E685.
- [CrossRef] [Google Scholar]
- Insights into the wear track evolution with sliding cycles of carbon-alloyed transition metal dichalcogenide coatings. Surf. Coat. Technol.. 2020;403
- [CrossRef] [Google Scholar]
- Fabricating polydopamine-coated MoSe2-wrapped hollow mesoporous silica nanoplatform for controlled drug release and chemo-photothermal therapy. Int. J. Nanomed.. 2018;13:7607-7621.
- [CrossRef] [Google Scholar]
- Hybrid MoSe2-indocyanine green nanosheets as a highly efficient phototheranostic agent for photoacoustic imaging guided photothermal cancer therapy. Biomater. Sci.. 2018;6:1503-1516.
- [CrossRef] [Google Scholar]
- Au/Polypyrrole@Fe3O4 Nanocomposites for MR/CT Dual-Modal Imaging Guided-Photothermal Therapy: An in Vitro Study. ACS Appl. Mater. Interfaces. 2015;7:4354-4367.
- [CrossRef] [Google Scholar]
- Gandhi, U.H., Kaushal, N., Hegde, S., et al., 2014. Selenium suppresses leukemia through the action of endogenous eicosanoids. 74, 3890–3901. https://doi.org/10.1158/0008-5472.CAN-13-3694.
- Biocompatible carbon-doped MoSe2 nanoparticles as a highly efficient targeted agent for human renal cell carcinoma. RSC Adv.. 2019;9:11567-11575.
- [CrossRef] [Google Scholar]
- Hao, T., Dou, K., Kaun, C.C., et al., 2013. MoSe2 nanosheets and their graphene hybrids: synthesis, characterization and hydrogen evolution reaction studies. 2, https://doi.org/10.1039/C3TA13584E.
- Designing bioinspired 2D MoSe2 nanosheet for efficient photothermal-triggered cancer immunotherapy with reprogramming tumor-associated macrophages. Adv. Funct. Mater.. 2019;29
- [CrossRef] [Google Scholar]
- Double-walled Au nanocage/SiO2 nanorattles: Integrating SERS imaging, drug delivery and photothermal therapy. Small. 2015;11:985-993.
- [CrossRef] [Google Scholar]
- Facile fabrication of a C-60-polydopamine-graphene nanohybrid for single light induced photothermal and photodynamic therapy. Chem. Commun.. 2014;50:10815-10818.
- [CrossRef] [Google Scholar]
- Huang, Y., Chen, F., Guan, Z., et al., 2022. S-Scheme BiOCl/MoSe2 heterostructure with enhanced photocatalytic activity for dyes and antibiotics degradation under sunlight irradiation. 22, 3344. https://doi.org/10.3390/s22093344.
- Jabeen, F., Najam-ul-Haq, M., Javeed, R., et al., 2014. Au-nanomaterials as a superior choice for near-infrared photothermal therapy. 19, 20580–20593. https://doi.org/10.3390/molecules191220580.
- Jaque, D., Martínez Maestro, L., Del Rosal, B., et al., 2014. Nanoparticles for photothermal therapies. 6, 9494–9530. https://doi.org/10.1039/c4nr00708e.
- Fabrication of 2D-MoSe(2) incorporated NiO Nanorods modified electrode for selective detection of glucose in serum samples. Sci. Rep.. 2021;11:13266.
- [CrossRef] [Google Scholar]
- Study of linear and non-linear optical responses of MoSe2-PMMA nanocomposites. J. Mater. Sci.-Mater. Electron.. 2020;31:19974-19988.
- [CrossRef] [Google Scholar]
- Interstitial photothermal therapy generates durable treatment responses in neuroblastoma. Adv. Healthc. Mater.. 2022;11
- [CrossRef] [Google Scholar]
- A facile method to enhance the tribological performances of MoSe2 nanoparticles as oil additives. Tribol. Int.. 2019;137:22-29.
- [CrossRef] [Google Scholar]
- Functionalization of 2D transition metal dichalcogenides for biomedical applications. Mater. Sci. Eng. C. 2017;70:1095-1106.
- [CrossRef] [Google Scholar]
- Fabricated high performance ultrathin MoSe2 nanosheets grow on MWCNT hybrid materials for asymmetric supercapacitors. J. Alloys Compd.. 2020;826
- [CrossRef] [Google Scholar]
- Liu, Y., Wei, C., Lin, A., et al., 2020. Responsive functionalized MoSe2 nanosystem for highly efficient synergistic therapy of breast cancer. 189, 110820. https://doi.org/10.1016/j.colsurfb.2020.110820.
- Bismuth sulfide nanorods as a precision nanomedicine for in vivo multimodal imaging-guided photothermal therapy of tumor. ACS Nano. 2015;9:696-707.
- [CrossRef] [Google Scholar]
- Tribological properties of biocompatible molybdenum selenide nanoparticles as water lubrication additives for ultra-high molecular weight polyethylene/304 stainless steel contact. Mater. Chem. Phys.. 2021;272
- [CrossRef] [Google Scholar]
- Photothermal therapy (PTT) is an effective treatment measure against solid tumors which fails to respond conventional chemo/radiation therapies in clinic. Biomater. Adv.. 2022;143
- [CrossRef] [Google Scholar]
- Mosleh-Shirazi, S., Kasaee, S.R., Dehghani, F., et al., 2023. Investigation through the anticancer properties of green synthesized spinel ferrite nanoparticles in present and absent of laser photothermal effect. 49, 11293–11301. https://doi.org/10.1016/j.ceramint.2022.11.329.
- Can advanced-stage ovarian cancer be cured? Nat. Rev. Clin. Oncol.. 2016;13:255-261.
- [CrossRef] [Google Scholar]
- Target-specific near-IR induced drug release and photothermal therapy with accumulated Au/Ag hollow nanoshells on pulmonary cancer cell membranes (vol 45, pg 81, 2015) Biomaterials. 2015;65:124-125.
- [CrossRef] [Google Scholar]
- Qin, A., Chen, S., Li, S., et al., 2022. Artificial stem cells mediated inflammation-tropic delivery of antiviral drugs for pneumonia treatment. 20, 1–15. https://doi.org/10.1186/s12951-022-01547-x.
- Late relapse of germ cell tumors after prior chemotherapy or surgery-only. Clin. Genitourin. Cancer 2023
- [CrossRef] [Google Scholar]
- Shabani, L., Kasaee, S.R., Chelliapan, S., et al., 2023. An investigation into green synthesis of Ru template gold nanoparticles and the in vitro photothermal effect on the MCF-7 human breast cancer cell line. 129, 564. https://doi.org/10.1007/s00339-023-06832-6.
- Photothermal therapy generates a thermal window of immunogenic cell death in neuroblastoma. Small. 2018;14
- [CrossRef] [Google Scholar]
- Tan, C., Lai, Z., Zhang, H., 2017. Ultrathin two-dimensional multinary layered metal chalcogenide nanomaterials. 29, 1701392. https://doi.org/10.1002/adma.201701392.
- Single step synthesis of MoSe2-MoO3 heterostructure for highly sensitive amperometric detection of nitrite in water samples of industrial areas. Electroanalysis. 2019;31:2410-2416.
- [CrossRef] [Google Scholar]
- Wang, Y., Zhang, F., Wang, Q., et al., 2018. Hierarchical MoSe2 nanoflowers as novel nanocarriers for NIR-light-mediated synergistic photo-thermal/dynamic and chemo-therapy. 10, 14534–14545. https://doi.org/10.1039/c8nr04538k.
- Wang, Y., Zhang, F., Lin, H., et al., 2019. Biodegradable hollow MoSe2/Fe3O4 nanospheres as the photodynamic therapy-enhanced agent for multimode CT/MR/IR imaging and synergistic antitumor therapy. 11, 43964–43975. https://doi.org/10.1021/acsami.9b17237.
- Wang, Y., Zhao, J., Z. Chen, Z., et al., 2019. Construct of MoSe2/Bi2Se3 nanoheterostructure: Multimodal CT/PT imaging-guided PTT/PDT/chemotherapy for cancer treating. 217, 119282. https://doi.org/10.1016/j.biomaterials.2019.119282.
- Wang, X., Wang, X., Huang, J., et al., 2021b. Interfacial chemical bond and internal electric field modulated Z-scheme Sv-ZnIn2S4/MoSe2 photocatalyst for efficient hydrogen evolution. 12, 4112. https://doi.org/10.1038/s41467-021-24511-z.
- Lubrication performances of carbon-doped MoSe2 nanoparticles and their biocompatibility characterization in vitro. Front. Chem.. 2021;8
- [CrossRef] [Google Scholar]
- Biocompatible PEGylated MoS2 nanosheets: Controllable bottom-up synthesis and highly efficient photothermal regression of tumor. Biomaterials. 2015;39:206-217.
- [CrossRef] [Google Scholar]
- Ultrathin transition metal chalcogenide nanosheets synthesized via topotactic transformation for effective cancer theranostics. ACS Appl. Mater. Interfaces. 2020;12:48310-48320.
- [CrossRef] [Google Scholar]
- Photodynamic therapy combined with systemic chemotherapy for unresectable extrahepatic cholangiocarcinoma: A systematic review and meta-analysis. Photodiagn. Photodyn. Ther.. 2023;41
- [CrossRef] [Google Scholar]
- How did conventional nanoparticle-mediated photothermal therapy become “hot” in combination with cancer immunotherapy? Cancers. 2022;14
- [CrossRef] [Google Scholar]
- Aqueous phase preparation of ultrasmall MoSe2 nanodots for efficient photothermal therapy of cancer cells. Nanoscale. 2016;8:2720-2726.
- [CrossRef] [Google Scholar]
- 3D-printed bioactive ceramic scaffolds with MoSe2 nanocrystals as photothermal agents for bone tumor therapy. RSC Adv.. 2022;12:30588-30597.
- [CrossRef] [Google Scholar]
- Zhou, L., Luo, C., Yin, J., et al., 2020. Diverse associations of plasma selenium concentrations and SELENOP gene polymorphism with metabolic syndrome and its components. 2020, https://doi.org/10.1155/2020/5343014.


