

Translate this page into:
Fabrication, characterization of polyaniline intercalated NiO nanocomposites and application in the development of non-enzymatic glucose biosensor
⁎Corresponding author at: Mother Teresa Women’s University, Kodaikanal, Tamil Nadu 624 102, India. suganthiphd09@gmail.com (A. Suganthi)
⁎⁎Corresponding author at: Madurai Kamaraj University, Madurai, Tamil Nadu 625 021, India. rajarajanchem1962@gmail.com (M. Rajarajan),
-
Received: ,
Accepted: ,
This article was originally published by Elsevier and was migrated to Scientific Scholar after the change of Publisher.
Peer review under responsibility of King Saud University.
Abstract
Determination of glucose plays very important part in diagnostics and management of diabetes. Nowadays, determination of glucose is necessary in human health. In order to develop the glucose biosensor, polymer modified catalytic composites were fabricated and used to detect glucose molecules. In this work, NiO nanostructure metal oxide (NMO) was fabricated via thermal decomposition method and polyaniline (wt% = 2, 4 and 6) assisted nanocomposites (NiO/PANI) were also prepared. The morphology and structure of synthesized nanocomposites were characterized by UV–visible diffusion reflectance spectroscopy (UV–vis-DRS), Fourier transform- infra red spectroscopy (FT-IR), X-ray powder diffraction (XRD), scanning electron microscopy (SEM), energy dispersive X-ray spectroscopy (EDX), high resolution transmission electron microscopy (HR-TEM), X-ray photoelectron spectroscopy (XPS) and N2 adsorption-desorption isotherm measurement. The modified NiO/6%PANI/GCE had higher catalytic activity toward the oxidation of glucose than NiO/GCE, PANI/GCE, NiO/2%PANI/GCE and NiO/4%PANI/GCE. This is due to the larger surface area of NiO/6%PANI nanocomposites provide a ploform for faster electron transfer to the detection of glucose. The constructed glucose biosensor have been exhibited a high sensitivity of 606.13 µA mM−1 cm−2, lowest detection limit of 0.19 µM, high selectivity, stability, simplicity and low cost for the quick detection of glucose in real sample as well.
Keywords
Nickel oxide
Thermal decomposition
Nanocomposites
Polyaniline
Biosensor

1 Introduction
Glucose detection is important, not only in the field of diabetes diagnosis, but also in food, textile industries, waste water treatment and environmental monitoring (Wang et al., 2013; Newman and Turner, 2005). In recent years, biosensors based on glucose oxidase (GOx) as a catalyst and various nano-materials have been investigated extensively (Zhang et al., 2011; Shan et al., 2010) due to their high sensitivity, specificity and low detection limit. However, enzymatic reaction is suffering from number of draw backs viz complicated immobilization techniques, rigorous operating conditions and inherent instability (Yoo and Lee, 2010; Zhang et al., 2015). Moreover, the bioactivity of GOx is easily impacted by environment factors including temperature, pH value, humidity and toxic chemicals (Wilson and Turner, 1992). Therefore, development of sensitive and selective non-enzymatic glucose sensor has received great attention in recent years.
Previous studies focused towards the use of noble metals such as gold (Au), platinum (Pt), lead (Pb) and palladium (Pd) as well as their alloy electrodes for developing non-enzymatic glucose sensors (Li et al., 2015; Sun et al., 2001). Since these metals are very expensive, considerable research has been concentrated on the use of more affordable NMO materials such as nickel oxide (Ding et al., 2010), copper oxide (Zhang et al., 2009), manganese oxide (Chen et al., 2008), titanium oxide (Viticoli et al., 2006) and cobalt oxide (Ding et al., 2011) for non-enzymatic glucose sensor applications. Among these relatively low-cost metal oxides, NiO received particular importance owing to its good electrochemical stability, catalytic activity and biocompatibility.
Besides non-enzymatic glucose sensor the nickel oxide nanostructures have been widely used for various other applications (Zhang et al., 2012). However, due to some notable drawbacks of homogeneous metal oxide nanoparticles employed in the development of biosensors, like high oxidation potential, low sensitivity, agglomeration and fouling of the oxidation signals (Chen and Chatterjee, 2013), the researchers move to nanocomposite materials for finding a better solution. Specifically, incorporation of polymer in nanocomposite shows a significant enhancement. The polymers such as PVA (poly vinylalcohol) (Hariharan et al., 2012), PVP (poly vinylpyrrolidone) (Lee et al., 2008), PEG (poly ethyleneglycol) (Sudha et al., 2013), PAA (poly acrylicacid) (Mo et al., 2001) and PANI (polyaniline) (Chen et al., 2000) are involved in the preparation of nanocomposites. The polymer provides more active catalytic sites as well as numerous effective electrolytes for electron transfer. Among the above mentioned polymers, PANI is a promising candidate for performing as a binding matrix to immobilize inorganic catalyst. This is due to its inherent high electrical conductivity, catalytic activity, ease of preparation and good environment as well as chemical stability (Wang et al., 2014; Xu et al., 2014). Moreover, PANI enhances electrocatalytic efficiency and increased surface area in composites (Kulesza et al., 2001). Numerous attempts have been made for the fabrication of PANI based nanocomposites and its application in various fields. For instance, Ghanbari and Babaei (2016) fabricated ternary NiO/CuO/polyaniline nanocomposite for the application of non-enzymatic glucose sensor and Yu et al. (2016) synthesised NiCo2O4@polyaniline core-shell nanocomposite for determination of glucose. Wang et al. (2013) reported polyaniline/mesoporous tungsten trioxide composite as anode electrocatalyst for high- performance microbial fuel cells and Zhang et al. (2009) reported that, polyaniline-vanadium oxide hybrid hierarchical architectures assembled from nanoscale building blocks by homogenous polymerization.
The development of simple nickel oxide/PANI composite and examination of its biosensor performances has been rarely reported. It is a necessary and challenging task to develop a simple and reliable strategy for constructing metal oxide-PANI composite with a controlled size, morphology as well as good stability.
In the present work, a simple NiO NMO was fabricated through thermal decomposition method and PANI was used as a modifier or surfactant. The electrochemical performances of fabricated nanomaterials were utilized towards the oxidation of glucose evaluated by cyclic voltammetry (CV) and amperometry methods. The proposed modified electrode exhibited outstanding catalytic activity, high stability, sensitivity and selectivity for determination of glucose (see Table 1).
S. No
Electrodes
Detection of limit
Linear range
Ref
1
Cu/MWCNT
2 × 10³–10-4 mM
7–3.5 mM
Kang et al. (2007)
2
Ni(OH)2-Graphene
6.00 × 10⁻⁴ mM
1–10 mM
Qiao and Zheng (2012)
3
CuxO/ PPy/Au
6.2 mM
up to 8 mM
Meng et al. (2013)
4
Ni-Cu/TiO2 nanotubes
10–3.2 mM
5 µM
Li et al. (2013)
5
Pt/Ni/RGO
0.01 mM
Up to 35 mM
Gao et al. (2011)
6
Ni-BDD
2.7 µM
10 µM – 10 mM
Toghill et al. (2010)
7
NiO-PANI/ GCE
0.19 µM
upto 100 µM
This work
2 Experimental section
2.1 Reagents
NiCl2·6H2O, hydrazine hydrochloride, KOH, acetone, D-glucose, ethanol and NaOH were purchased from merk, India. All of the reagents were of analytical grade and used as received without further purification. 0.1 M NaOH solution was used as the supporting electrolyte. All aqueous solution was prepared with double distilled water.
2.2 Preparation of nickel oxide
2.37 g of NiCl2·6H2O was dissolved in 100 ml of ethanol and 1.0497 g of hydrazine was dissolved in 200 ml of double distilled water (DD water) separately. The hydrazine solution was slowly added to the above NiCl2 solution with constant stirring. pH of the solution was adjusted to 8–12 by using KOH solution. The mixture was stirred for 2 hrs and dried at 120 °C. Ultimately, pale violet colour precipitate was obtained. The precipitate was washed with DD water subsequently by acetone and then filtered and calcinated at 600 °C for 2 h.
2.3 Preparation of polyaniline
The 50 ml of aniline (0.5 M) was taken in RB flask and 50 ml of ammonium peroxydisulfate (APS) (0.5 M) was added to the above solution, then mixed well and stand for 1 day. The polyaniline (PANI) precipitate obtained was collected and washed with acetone. Further it was dried at 60 °C for 2 h (Stejskal and Gilbert, 2002). The prepared PANI was used in the synthesis of nanocomposites.
2.4 Preparation of NiO/PANI nanocomposite
The polymer modified nickel oxide is prepared by immersion method. 2 g of earlier synthesized NiO NMO was immersed with 100 ml of ethanol and mixed with 2% PANI in ethanol (2 g of PANI dissolved in 100 ml of ethanol) by using ultrasonication for 1 hr. After 12 hrs stirring the solvent was evaporated and the product was collected and dried at 80 °C followed by a heat treatment at 180 °C in a hot air oven for 2 h. Similarly, 4% of PANI and 6% of PANI were incorporated with NiO NMO successively.
2.5 Preparation of modified GCE
Prior to modification, the GCE was polished carefully with 1.0, 0.3 and 0.05 µm alumina powder, respectively. Then the polished GCE was cleaned sequentially with 1:1 HNO3 ethanol and DD water and dried at room temperature.
The NiO/PANI/GCE was prepared as follows: 5 mg of synthesised NiO was dispersed with DD water (3 ml) and ethanol (2 ml) using ultrasonically dispersion. Then approximately 5 µL of dispersion was drop casted onto the clean GC electrode and dried at room temperature to form the modified NiO/GCE. Similarly, NiO/2% PANI (N2P)/GCE, NiO/4% PANI (N4P)/GCE, NiO/6% PANI (N6P)/GCE and PANI/GCE electrodes were obtained successively.
2.6 Measurement method
The absorption of synthesized nanocomposites were determined by JASCO V-750 spectrophotometer. The functional group of metal-oxygen band was predicted by JASCO FT/IR-4200 Fourier-Transform spectrophotometer. The crystalline structure of synthesised NMO was examined by Analytical XPERT PRO X-ray diffractometer with Cu Kα radiation of wavelength 1.541. The morphology and elemental analysis (SEM-EDX) results of synthesized nanocomposites were obtained by JOEL model JSM 6701FSEM. The HR-TEM images were acquired from JOEL model 3010 microscope. The surface area was measured by micromatrics, ASAP 2020B.E.T instrument. Electrochemical measurements were performed with a CHI608D electrochemical workstation. The electrochemical cell consist of a three electrode system with a modified GCE (i.d., 3 mm) as working electrode, a platinum foil as the counter electrode and a Ag/AgCl electrode as the reference electrode. All potentials in this study were reported with respect to the Ag/AgCl. The measurements were carried out in a 0.1 M NaOH solution at a pH of 12 at room temperature.
3 Results and discussion
3.1 UV–vis DRS
The UV–vis DR Spectrum of NiO, N2P, N4P and N6P are shown in Fig. 1. The absorption edge of NiO NMO was found at 369.14 nm. Whereas, the polymer modified N2P, N4P and N6P nanocomposites (Fig. 1b–d) existed at 402.51, 512.91 and 712.68 nm respectively. When compared with NiO NMO, the polymer modified N2P, N4P and N6P were red shifted at 402.51, 512.91 and 712.68 nm respectively. This shift renders to the electron transfer process taking place between NiO and PANI by overlapping or capping effect and also to electrocatalytic activity of PANI on NiO. This indicates that PANI present on the surface of NiO NMO. This shift further leads to increase in grain size, electroactive sites and electrocatalytic ability while increasing the loading content of PANI.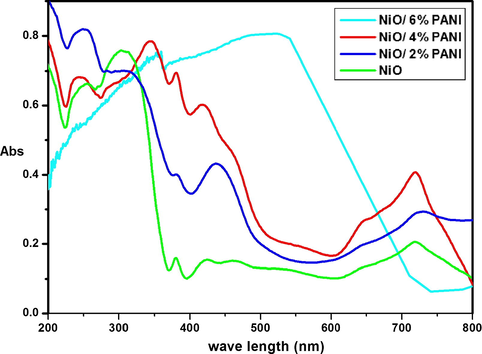
UV–vis DR spectrum of NiO, N2P, N4P and N6P.
3.2 FT-Ir
The Fig. 2 indicates FT-IR spectrum of NiO, N2P, N4P and N6P nanocomposites. In FT-IR spectra of NiO NMO (Fig. 2a) the main characteristic peak was observed at 464.54 and 625.82 cm−1 is assigned to Ni-O vibration mode (Chen et al., 2013) and there is no impurity peak was found in NiO NMO. The FT-IR spectrum of polymer modified nanocomposite N2P (Fig. 2b) shows absorption bands at 463.21 and 653.68 cm−1. For N4P (Fig. 2c) nanocomposite, the absorption peaks appeared at 460.87 and 630.54 cm−1. The absorption peaks of N6P (Fig. 2d) at 466.63 and 636.34 cm−1 are corresponds to Ni—O stretching vibration mode. The band appeared at 1637.63, 1636.54 and 1631.09 cm−1 in the FT-IR spectrum of N2P, N4P and N6P can be assigned to the bending vibration of H—O—H, respectively. Which demonstrates the existence of water molecules (Deepa et al., 2008) and in the band region 1000–1140 cm−1 of N2P, N4P and N6P spectrum are due to in-plane bending vibration of ⚌C—H mode of PANI.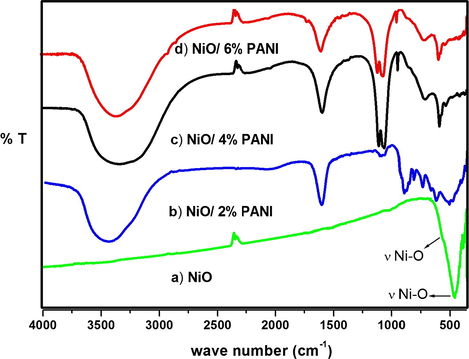
FT-IR spectrum of (a) NiO, (b) N2P, (c) N4P and (d) N6P.
Furthermore, the peaks appeared at 3467.69, 3370.91 and 3338.18 cm−1 in Fig. 2(b–d) are assigned to N—H stretching in PANI for N2P, N4P and N6P respectively. It is noted that, the wave number of N2P to N6P decreases from 3467.69 to 3338.18 cm−1 while the concentration of PANI increases onto the NiO NMO. This is due to the encapsulation of PANI on the surface of NiO NMO.
3.3 XRd
The crystallinity and purity of the synthesized NiO before and after capping of PANI samples were evaluated by means of X-ray diffraction (XRD) pattern. Fig. 3 shows the XRD pattern of NiO, N2P, N4P and N6P nanocomposites. The Fig. 3a shows the XRD pattern of NiO NMO. The peak positions of NiO appeared at 2θ = 37.55°, 43.54°, 63.17°, 75.89° and 79.35° can be readily indexed as (1 1 1), (2 0 0), (2 2 0), (3 1 1) and (2 2 2) crystal planes of the NiO respectively. All the reflections can be indexed to face-centered cubic (fcc) NiO phase with lattice constant (a): 4.175 Å (Kanthimathi et al., 2004) which agree well with standard data (JCPDS card no. 47-1049). The sharpness and the intensity of the peaks revealed that, the prepared NiO sample belongs to well crystalline nature. When compared with NiO (Fig. 3(a)), all polymer modified nanocomposites N2P (Fig. 3(b)), N4P (Fig. 3(c)) and N6P (Fig. 3(d)) were not able to keep the typical NiO crystal structure. This is mainly attributed to amorphous nature of PANI. Besides it is found that, the broad peak at around 2θ value of 20–30° in the PANI loaded nanocomposites of N4P and N6P is due to amorphous nature of polyaniline (Tambolia et al., 2012). While N2P nanocomposite which has low PANI content has slight change in crystal structure. The change in crystal structure demonstrates that the PANI incorporated with NiO. The average crystallite size based on X-ray peak broadening was estimated from the corresponding X-ray spectral peak employing the Scherrer’s formula (Eq. (1)).
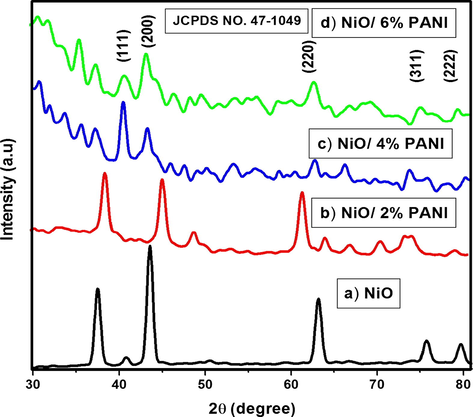
XRD pattern obtained for (a) NiO, (b) N2P, (c) N4P and (d) N6P.
3.4 Microstructure, surface morphology and XPS
The surface morphology of NiO, N2P, N4P and N6P were confirmed by SEM and shown in Fig. 4. The SEM image of NiO NMO exhibits bundles of nanofibers. However, after loaded with PANI the N2P nanocomposite (Fig. 4b) exhibits layers of irregular spheres from the parental counterpart. Then SEM image of N4P (Fig. 4c) is resembled with nanosphere like morphology and that of N6P (Fig. 4d) nanocomposite associate with hallow spheres like structure. It is noticed that, the diameter of the N6P nanocomposite is higher than N4P nanocomposite illustrating the polymerization of the poly aniline (PANI) on the surface of the NiO NMO. The HR-TEM images of N6P shown in Fig. 5a–c. It demonstrated good dispersion and array of the NiO NMO within the polymer network. The HR-TEM image also agreement with the XRD results of formation of cubic NiO which depicted in Fig. 5b.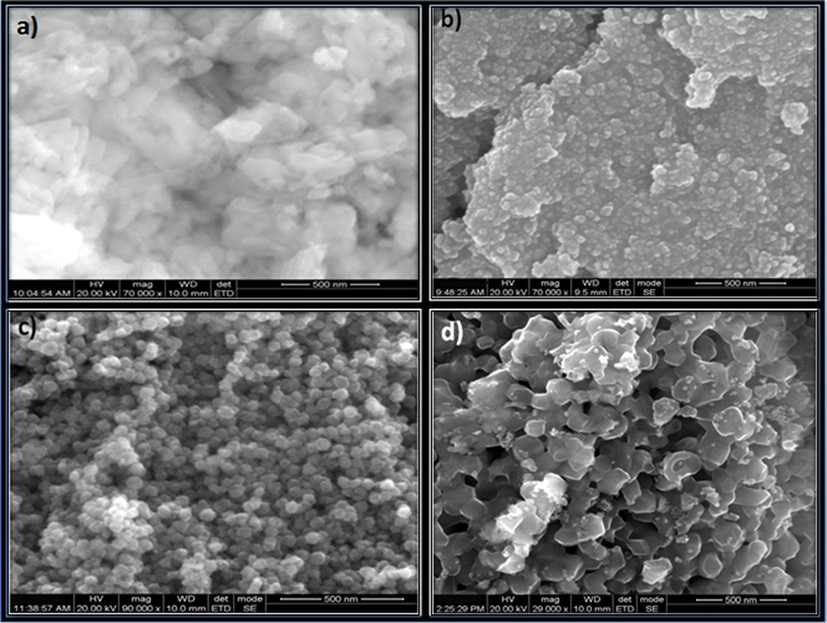
SEM images of (a) NiO, (b) N2P, (c) N4P and (d) N6P.
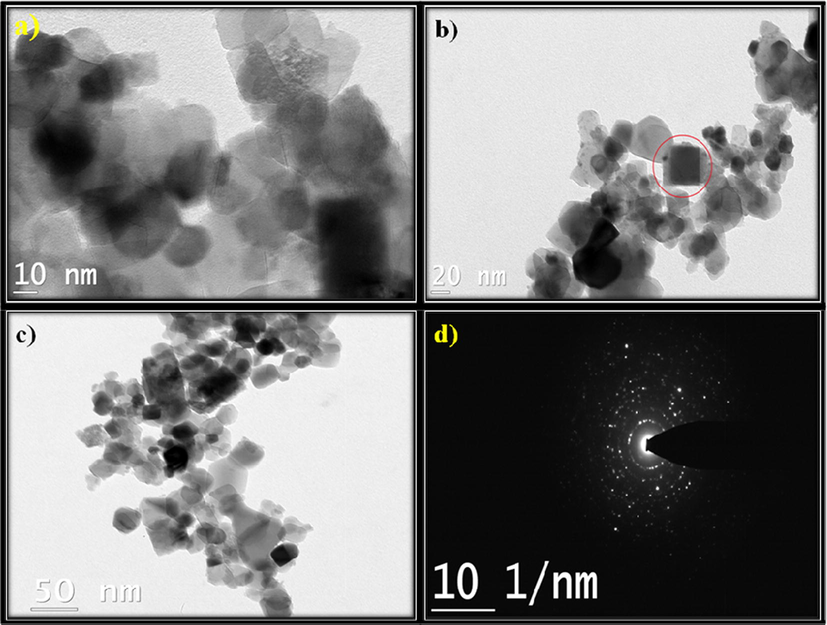
HR-TEM images and SAED pattern of N6P.
The existence of Ni and O were investigated by EDX and the results are given in Fig. 6(a–d). The EDX results confirm the presence of Ni and O. The observed peaks were significant to Ni and O. They clearly exist at their normal energy. The EDX spectral data indicates the formation of NiO NMO. Moreover, the intensity of peaks appeared at 6.21, 7.08 and 8.23 for N2P (Fig. 6(b)), N4P (Fig. 6(c)) and N6P (Fig. 6(d)) respectively, increased with the increase in the loading content of PANI. The change in intensity of EDX spectrum confirms the polymer PANI exists on the surface of the NiO NMO. The X-ray photoelectron spectroscopy (XPS) of N6P (Fig. 7a) was also carried out to investigate the chemical states of bonded elements in the as prepared sample. As shown in Fig. 7a, the peaks located at binding energies of 859.7 and 877.4 with a separation of 17.7 eV corresponding to Ni 2p 3/2 and Ni 2p 1/2. There is no peak observed to Ni indicating all Ni compounds are electrochemical oxidised to NiO (Zhang et al., 2012). Fig. 7b demonstrates high resolution X-ray photoelectron spectroscopy. The peaks appeared at binding energies of 861.2 and 879.8 eV are due to Ni2+ 2p3/2 and Ni2+ 2p1/2 respectively. Besides, Ni related compounds observed at high binding energies of 865.4 and 885.3 eV are satellite peaks (Peck and Langell, 2012).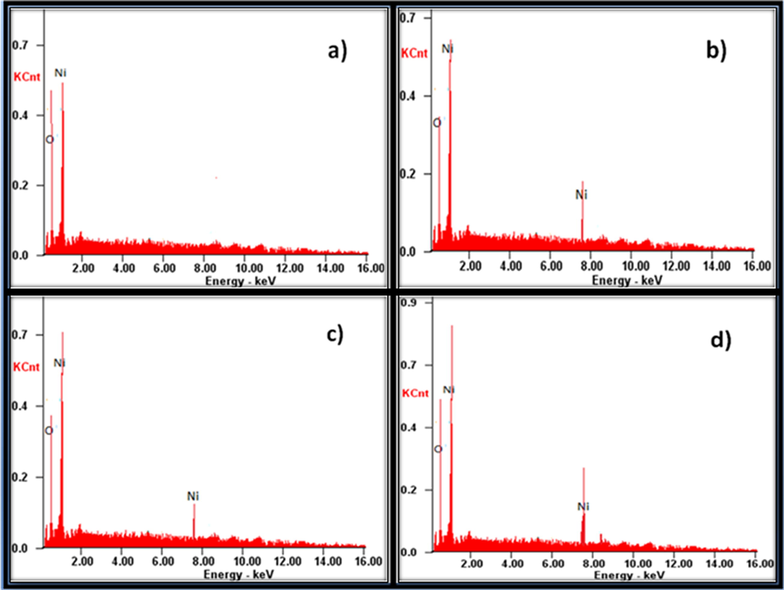
The EDX spectra obtained for (a) NiO, (b) N2P, (c) N4P and (d) N6P.
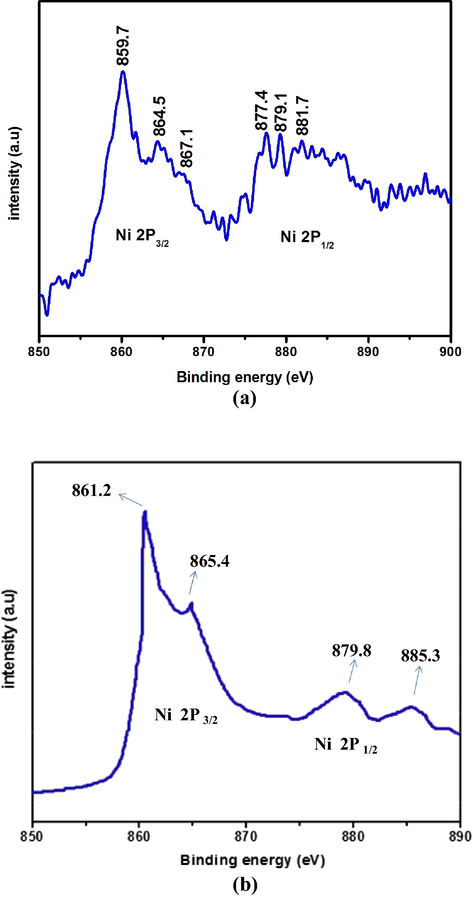
(a–b) XPS and HR-XPS survey spectrum of N6P.
3.5 N2 adsorption - desorption isotherm
To investigate the surface area and porous structure based on Brunauer-Emmett-Teller (BET) method. Fig. 8 shows the nitrogen adsorption-desorption isotherm curves of NiO, N2P, N4P and N6P nanocomposites measured at 77 K. Fig. 8a and 8b exhibit type V adsorption isotherm curve of NiO and N2P respectively. This is due to weak interaction of the adsorbate- adsorbent and also poor active sites provided by the adsorbent. On the other hand, Fig. 8c and d exhibit type IV adsorption isotherm curves, which exhibit distinct hysteresis loop at a relative pressure P/Po ranging from 0.4 to 0.8 and 0.4 to 0.9 for N4P and N6P respectively. These indicate existence of mesoporoes according to IUPAC nomenclature. When the loading of PANI increases from 2% to 6%, the interconnected macropores allow guest molecules to move into mesopores and connecting the sites of pore walls (Zhao et al., 2013). Hence, as prepared polymer modified nanocomposites are expected to exhibit potential applications. The prepared nanomaterial NiO, N2P, N4P and N6P possess BET surface area of 51.11, 57.95, 89.08 and 96.67 m2/g, respectively.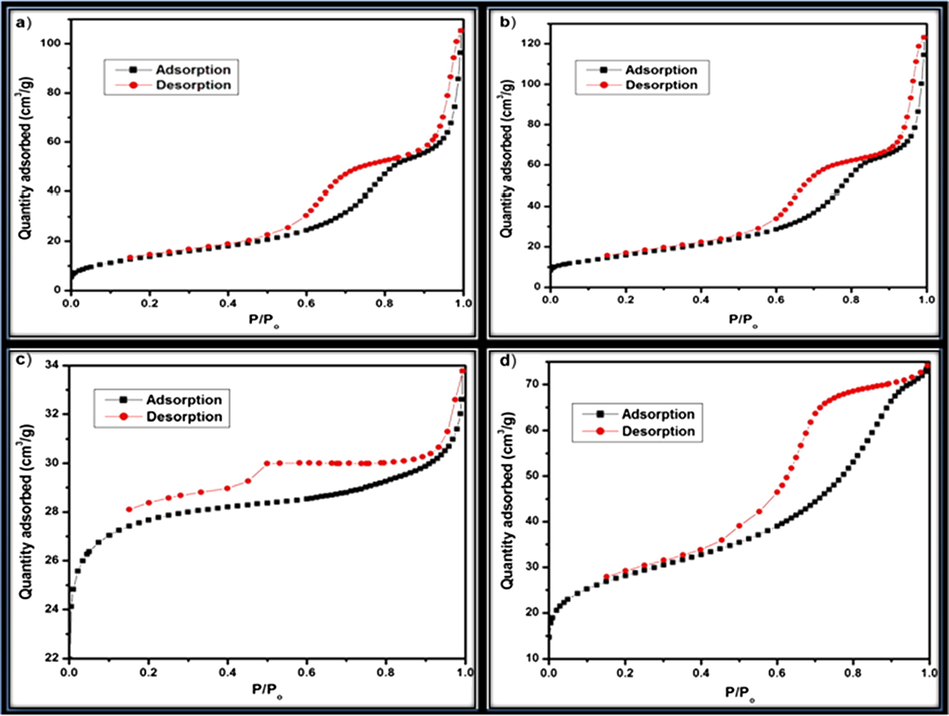
N2 adsorption-desorption isotherm for (a) NiO, (b) N2P, (c) N4P and (d) N6P.
Among the prepared nanocomposites, N6P having large surface area (96.67 m2/g) and more active-sites supplied by the polymer PANI, which may exhibit larger changes in the electrical conductivity of the biosensor. The sensitivity of the nanocomposites attributes mainly to the nature of polymer, which serve as a matrix with NiO to oxidise the glucose molecule.
3.6 Electrochemical performance of modified electrodes
The cyclic voltammograms of PANI/GCE, NiO/GCE, N2P/GCE, N4P/GCE and N6P/GCE are displayed in Fig. 9a. The supporting electrode 0.1 M of NaOH is used at the scan rate of 50 mV s−1. The PANI/GCE shows slight oxidation potential than bare GCE. This is due to the conducting nature of PANI. However, the NiO/GCE, N2P/GCE, N4P/GCE and N6P/GCE shows a pair of redox peaks with anodic peak and cathodic peak at +0.3 to +0.5 V and –0.2 to +0.2 V, respectively. It is obviously showed that, the intensity of oxidation peak of NiO/GCE, N2P/GCE, N4P/GCE and N6P/GCE were increased from 9.12, 11.27, 12.93 upto 16.15 µA. This is attributed to the redox couple of Ni2+/Ni3+ (Li et al., 2011) on the electrode surface in the alkaline electrolyte medium is generally considered as the following step: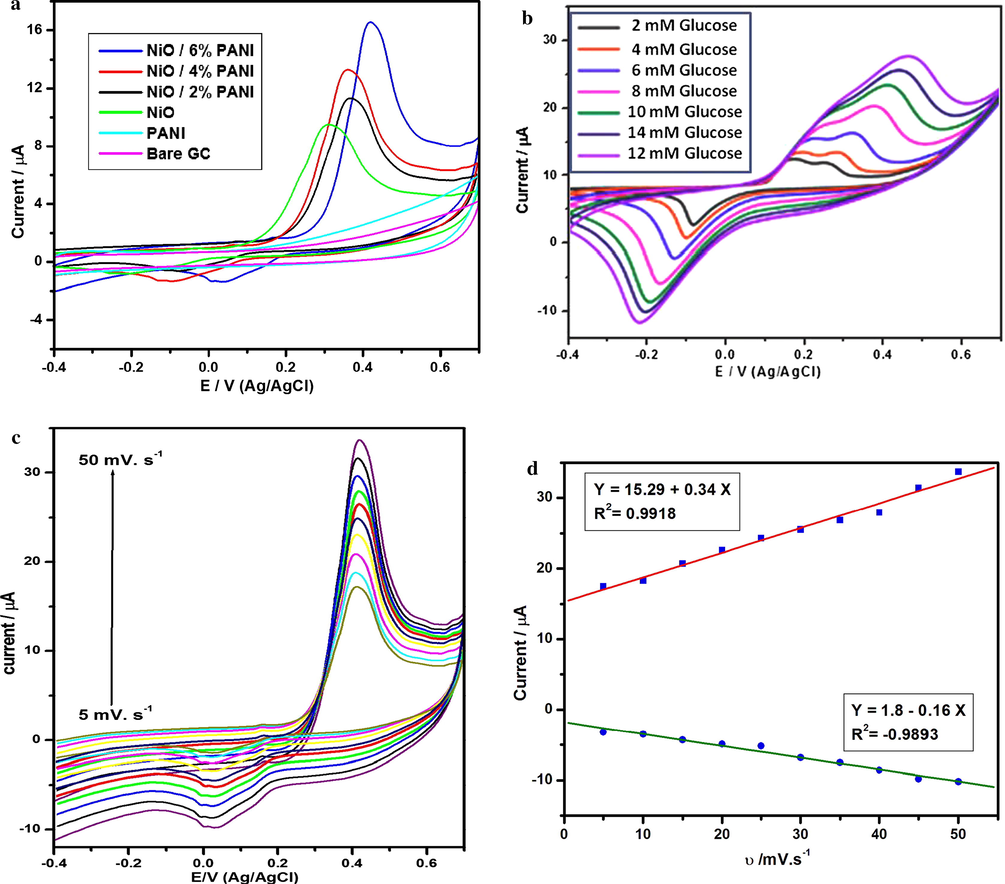
(a) CV curves of PANI, NiO, N2P, N4P and N6P modified GCEs in 0.1 M of NaOH solution at the scan rate of 50 mV s−1. (b) CV curves of N6P modified GCE under various glucose concentration in 0.1 M of NaOH solution at the scan rate of 50 mV s−1. (c) Give to supporting Cyclic voltammograms of 5 mM glucose at the different scan rate. (d) Corresponding calibration plot of anodic and cathodic peak currents vs. Scan rates.
The NiO is electrochemically oxidized to strong oxidizing Ni (III) species that is (NiO) OH
3.6.1 Effect of glucose concentration
Furthermore, the same N6P/GC electrode was used to detect glucose molecule with various concentrations between 2 and 14 mM glucose in 0.1 M NaOH medium at the scan rate of 50 mV s−1. As shown in Fig. 9(b), the redox couple with anodic peak and cathodic peak appeared at +0.2 V to +0.6 V and −0.2 V to −0.1 V respectively. This can be explained by the electrocatalytic oxidation process of glucose molecule by modified N6P/GCE in alkaline electrolyte through the following steps: Initially, the glucose molecule could be oxidized by Ni (III). In this process Ni (III) was reduced to Ni (II). Finally, gluconolactone is converted into gluconic acid by hydrolysis.
The reactions are demonstrated below:
Apparently, from Fig. 9b the oxidation peak current is increased gradually as well as the reduction peak current is decreased with the change in concentration of glucose ranging from 2 to 12 mM. This can be clarified by above mechanism. When the concentration of glucose is increased, more glucose molecules would be electrochemically oxidized. Similarly more Ni(III) consumed simultaneously. This lead to higher oxidation peak current and lower reduction peak current of Ni(II)/Ni(III). However, the peak current for 14 mM glucose is lower than 12 mM glucose. Because of degradation or fatigue phenomenon for repetitive measurements using the same one electrode (Hsu et al., 2012).
3.6.2 Effect of scan rate
The influence of scan rate on glucose oxidation at the N6P/GC modified electrode was investigated in 0.1 mM glucose for the understanding of oxidation process. Fig. 9(c) shows both anodic and cathodic peak current of N6P/ GC electrode in the range of 5–50 mV s−1. From the Fig. 9d both anodic and cathodic peak currents increased gradually with increase in the square root of scan rate. The linear relationship between anodic and cathodic peak current with scan rate and correlation coefficients are Ipa (µA) = 15.29 + 0.34 ν (mV s−1) (R2 = 0.9918) and Ipa (µA) = 1.8–0.16 ν (mV s−1) (R2 = −0.9893) respectively. This result validates that the electro oxidation reaction is diffusion controlled process.
3.6.3 Effect of pH
The effect of pH on the electrochemical response of N6P for the examination of glucose was measured by cyclic voltammetry in the pH range of 11–14 and displayed in Fig. 10. 0.1 M of NaOH solution was used as a supporting electrolyte. Solutions of NaOH with different pH (pH = 11, 12, 13 and 14) were prepared and tuned with NaOH and HCl (0.1 M) carefully (Zhong and Jang, 2014). The CV curves of pH 11 show redox couple with anodic and cathodic peak at +0.4 to +0.5 V and +0.3 V respectively.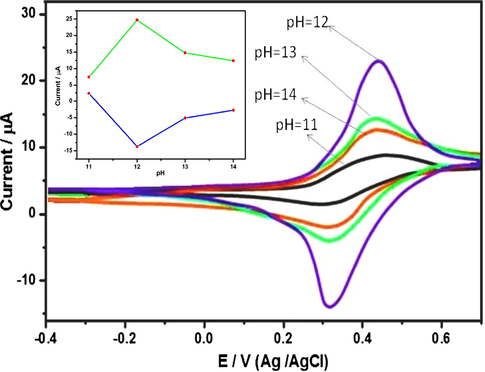
The CV curves of N6P on various pH in 0.1 M NaOH solution. Inset: Electrode potential of N6P plotted over a pH range of 11–14.
When the pH reached 12, cyclic voltammogaram showed the redox pair with anodic and cathodic peak at +0.4 to +0.5 V and +0.3 V. However, the intensity of CV curves at pH 12 is much higher than others. This is due to the moderate participation of OH− ion, therefore the electrooxidation process takes place rapidly. Beyond the pH 12, the redox couples of pH 13 and 14 show low anodic and cathodic peak currents at +0.4 to +0.5 V and +0.3 V respectively. This is rendered to the higher participation of OH– ions. The OH– ions interrupt the electrooxidation reaction between modified N6P/GC electrode and the glucose. From the Fig. 10, it is evident that anodic and cathodic peak current at a pH of 12 is much superior to that of other pH values. This signifies that, the modified electrode oxidized the glucose under the pH series of 12 (Fan et al., 2013; Wang et al., 2014). The inset demonstrates the electrode potential of N6P plotted over the pH range of 11–14.
3.7 Amperometric detection of glucose at N6P/ GCE
Amperometric response of N6P modified GCE was carried out to determine the current response of glucose. The influence of applied potential in amperometric determination was examined by successive injection of 2 µM glucose for every 25 s. Fig. 8b shows that anodic peak current was increased gradually from +0.4 to +0.5 V. Therefore, the optimum applied potential should be +0.4 V or +0.5 V. The effect of applied potentials on the response currents of the sensor is illustrated in Fig. 11. The 0.1 M NaOH was used as supporting electrolyte under different potentials of +0.4, +0.5 and +0.6 V. From Fig. 11 it is evident that the current response of glucose increased significantly with increase of applied potential from +0.4 to +0.6 V. The current response at +0.5 V was one fold larger than +0.4 V and one fold smaller than +0.6 V. Therefore, the +0.5 V was selected as the optimal constant applied potential in the amperometric determination of glucose. Meanwhile, the results are quite consistent with the CV curves depicted in Fig. 8b. The Fig. 11b shows the corresponding calibration plot of applied potential +0.5 V with linear regression equation Ipa (A) = 11.10 + 0.55 Cglucose with correlation coefficient (R2) 0.9961. Under optimal condition (Eapp = +0.5 V), the sensor shows a low detection limit (S/N = 3) of 0.19 µM with a sensitivity of 606.13 µA mM−1 cm−2.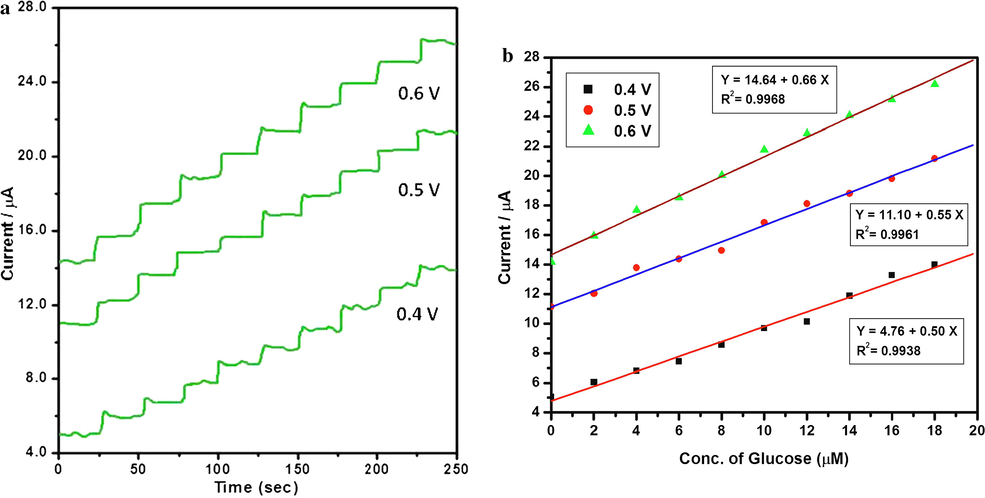
(a) Amperometric response of N6P modified GCE biosensor with the successive addition of each 2 µM glucose in 0.1 M of NaOH measured at +0.4, +0.50 and +0.6 V. (b) Corresponding calibration plot between the current and concentration of glucose.
The Fig. 12a represents the typical steady state current time response of the electrode in 0.1 M NaOH with successive addition of glucose in the range of 0 to 100 µM. Fig. 12b demonstrates a good linear relationship in the range of 0 to 100 µM. The linear regression equation is Ipa (A) = 4.51 + 0.05 Cglucose, with correlation coefficient (R2) of 0.9977. This high level sensitivity is mainly attributed to the large surface area orginated from the polymer network, high loading content of PANI and higher electrocatalytic activity of N6P/GCE.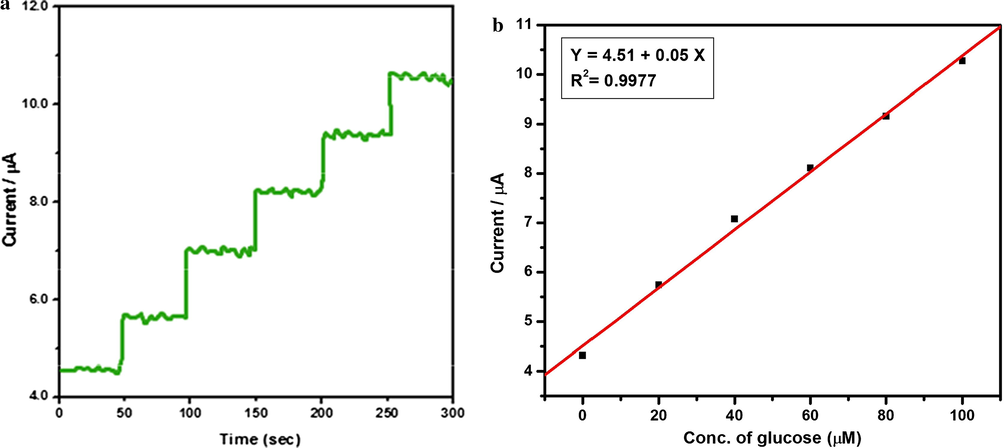
(a) Amperometric response of N6P modified GCE biosensor with the range of 0–100 µM glucose in 0.1 M of NaOH. Eapp = +0.50 V. (b) Corresponding calibration plot between the current and concentration of glucose.
The N6P modified GC electrode was exhibit a relatively wide linear range, low detection limit, high sensitivity, stability, good selectivity and low cost. The proposed polymer assisted N6P nanocomposite based non-enzymatic glucose sensor may have potential for the analysis of glucose in real samples. Comparison of analytic performance for NiO/6%PANI/GCE with other reported non-enzymatic glucose sensor is given Table 2. The analytic parameter of NiO/6%PVA/GCE for non-enzymatic glucose detection is best among the previous reported values in the literatures.
Sample
Clinical analyzer (mmol dm−3)
Biosensor (mmol dm−3)
Relative error (%)
1
6.3
6.42
−1.86
2
6.1
6.28
−2.86
3
6.7
6.49
3.13
4
6.5
6.46
0.61
5
6.4
6.37
0.46
3.8 Interference analysis
Anti-interference property is one of the key roles in non-enzymatic glucose oxidation. The co-existing material in blood, such as dopamine (DA), ascorbic acid (AA), fructose, ureic acid (UA) and lactose can be oxidize at potential analogous with glucose. Because, the impact of interfering species exist on glucose was evaluated. As shown in Fig. 13, no significant signals can be observed for interfering species such as 0.1 µM of fructose, 0.1 µM of lactose, 0.1 µM dopamine (DA) 0.1 µM ureic acid (UA) and 0.1 µM of ascorbic acid (AA), while the addition of 1 µM of glucose the oxidation peak current on N6P/GCE increases from 23.12 to 29.27 µA. From the Fig. 13, the addition of the interfering species cannot influence the modified electrode signal. Hence, the glucose can be determined by this method without concerning the interfering species effect.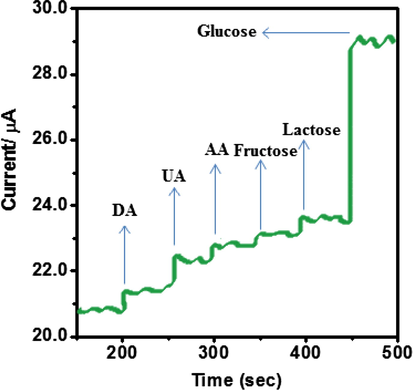
Interference test of the sensor in 0.1 M NaOH at +0.30 V with 1 µM glucose and other interferents including 0.1 µM dopamine, 0.1 ascorbic acid, 0.1 uric acid, 0.1 µM of fructose and 0.1 µM of lactose.
3.9 Storage stability
The storage stability of the electrode is evaluated at the same modified electrode over consecutive 30 days. When the modified electrode is not used, it is stored in air. After two weeks, the current response of N6P modified electrode just losses 1.5% of its original current. The good stability of N6P/GCE is owing to the chemically stable NiO phase intercalated with PANI network. The observed behaviour of the proposed glucose sensor using N6P/GCE confirms the good selective response for the detection of glucose.
3.10 Determination of glucose in real sample
The convenient application of the glucose sensor was inspected using amperometric experiment by noticed the glucose concentration of the real human blood serum samples which were acquired from the Periyakulam-Government hospital, Tamilnadu, India. The samples were initially centrifuged. The 20 µL of blood serum samples were added into 5 ml 0.1 M NaOH solution at a constant potential of +0.3 V and the current response was observed. Each sample was added and detected three times and the determination of the blood samples was ascribed from the clinical blood sugar analyzer (Mindray BS-120) and the result was given in Table 2. It can be observed that the two results of the samples were agreed with each other with a relative error of less than ±4%, which demonstrated the potential application of the N6P/GCE glucose sensor in real sample.
4 Conclusion
We have successfully synthesized nickel oxide nanocomposites by thermal decomposition method and PANI modified nanocomposites were also prepared. The polymer PANI was used as a surfactant/capping agent or binding mediator between substrate and glucose. The powder XRD investigation confirmed that the sample prepared with and without PANI in cubic structure corresponding to NiO. The SEM image of N6P shows that the formation of hallow nanosphere. The HR-TEM images show that the good dispersion and array of NiO NMO within the polymer network and also agreement with the XRD result. The EDX spectrum confirms the presence of Ni and O. The BET results exhibits that the modified N6P possess high surface area due to mesoporus. The proposed method for glucose determination revealed that higher sensitivity of 606.13 µA mM−1 cm−2 and lower detection limit of 0.19 µM (S/N = 3). The main reasons are the large surface area, active sites, high electron transfer and good electrocatalytic oxidation of N6P nanocomposites. The polymer PANI plays a vital role in the development of biosensor, which enhanced the efficiency of the electron transfer between the modified electrode and glucose. The NiO/PANI/GCE showed high stability and excellent selectivity, simplicity, low cost and rapid notice of glucose even in real samples.
Declaration of Competing Interest
The authors declared that there is no conflict of interest.
References
- A facil channel for D-glucose detection in aqueous solution. Spectrochim. Acta Part A. 2013;114
- [Google Scholar]
- Home blood glucose biosensor: a commercial perspective. Biosens. Bioelectron.. 2005;20:2435-2453.
- [Google Scholar]
- Enzymatic deposition of Au nanoparticles on the designed electrode surface and its application in glucose detection. Colloids Surf. B, Bio Interfaces. 2011;82:532-535.
- [Google Scholar]
- Graphene/ AuNPs/ chitosan nanocomposites film for glucose biosensing. Biosens. Bioelectron.. 2010;25:1070-1074.
- [Google Scholar]
- Glucose biosensors: An overview of use in clinical practice. Sensors. 2010;10:4558-4576.
- [Google Scholar]
- Electrospun graphene decorated MnCo2O4 composite nanofibers for glucose biosensing. Biosens. Bioelectron.. 2015;66:308-315.
- [Google Scholar]
- Bimetallic M Co (M = Cu, Fe, Ni and Mn) nanoparticles doped-carbon nanofibers synthesized by electrospinning for nonenzymatic glucose detection. Sens. Actuators, B. 2015;207:614-622.
- [Google Scholar]
- Combinatorial Discovery of Alloy Electrocatalysts for amperometric glucose sensors. Anal. Chem.. 2001;73:1599-1604.
- [Google Scholar]
- Preparation and characterization of NiO-Ag nanofibers, NiO nanofibers and porous Ag: towards the development of a highly sensitive and selective non-enzymatic glucose sensor. J. Mater. Chem.. 2010;20:9918-9926.
- [Google Scholar]
- Porous cuprous oxide microcubes for non-enzymatic amperometric hydrogen peroxide and glucose sensing. Electrochem. Commun.. 2009;11:812-815.
- [Google Scholar]
- Nonenzymatic electrochemical glucose sensor based on MnO2/MWNTs nanocomposite. Electrochem. Commun.. 2008;10:1268-1271.
- [Google Scholar]
- Third generation biosensors based on TiO2 nanostructured films. Mater. Sci. Eng., C. 2006;26:947-951.
- [Google Scholar]
- Electrospun Co3O4 nanofibers for sensitive and selective glucose detection. Biosens. Bioelectron.. 2011;30:28-34.
- [Google Scholar]
- Nonenzymatic glucose sensor based on graphene oxide and electrospun NiO nanofibers. Sens. Actuators, B. 2012;171–172:580-587.
- [Google Scholar]
- Nanomaterials based electrochemical sensor for biomedical applications. Chem. Soc. Rev.. 2013;42:5425-5438.
- [Google Scholar]
- Photodynamic action of curcumin derived polymer modified ZnO nanocomposite. Mater. Res. Bull.. 2012;47:3090-3099.
- [Google Scholar]
- Synthesis and characterization of PVP-coated large core iron oxide nanoparticles as an MRI contrast agent. Nanotechnology. 2008;19 165101/1–165101/6
- [Google Scholar]
- Synthesis, characterization and study of photocatalytic activity of surface modified ZnO nanoparticles by PEG capping. J. Sol-Gel Sci. Technol.. 2013;65:301-310.
- [Google Scholar]
- A novel ultraviolet- irradiation route to CdS nano crystallites with different morphologies. Mater. Res. Bull.. 2001;36:2277-2282.
- [Google Scholar]
- Templated synthesis of CdS/PAN composites nanowires under ambient conditions. J. Colloid Interf. Sci.. 2000;229:217-221.
- [Google Scholar]
- Enhanced sensitivity and stability of room-temperature NH3 sensors using core shell CeO2 nanoparticles@cross-linked PANI with p-n heterojunctions. Appl. Mater. Interfaces. 2014;6:14131-14140.
- [Google Scholar]
- Heterogeneous branched core-shell SnO2- PANI nanorod arrays with mechanical integrity and three dimentional electron transport for lithium batteries. NANO Engery. 2014;8:196-204.
- [Google Scholar]
- Oxidation of methanol at an electrocatalytic film containing platinum and polynuclear oxocyanoruthenium microcenters dispersed within tungsten oxide matrix. J. Electroanal. Chem.. 2001;512:110-118.
- [Google Scholar]
- Fabrication and characterization of non-enzymatic glucose sensor based on ternary NiO/CuO/polyaniline nanocomposite. J. Anal. Biochem.. 2016;498:37-46.
- [Google Scholar]
- Facile synthesis of NiCo2O4@polyanilline core-shell nanocomposite for sensitive determination of glucose. Biosens. Bioelectron.. 2016;75:161-165.
- [Google Scholar]
- Polyaniline/ mesoporous tungsten trioxide composite as anode electrocatalyst for high- performance microbial fuel cells. Biosens. Bioelectron.. 2013;41:582-588.
- [Google Scholar]
- Polyaniline-vanadium oxide hybrid hierarchical architectures assembled from nanoscale building blocks by homogenous polymerization. Polym. Int.. 2009;58:1422-1426.
- [Google Scholar]
- Polyaniline, preparation of a conducting polymer. Pure Appl. Chem.. 2002;74:857-867.
- [Google Scholar]
- one-pot hydrothermal synthesis of reduced graphene oxide/ carbon nanotube/α-Ni(OH)2 composites for high performance electrochemical supercapacitor. J. Power Sources. 2013;243:555-561.
- [Google Scholar]
- Nanostructured tungsten oxide-poly(3,4-ethylenedioxythiophene); poly(styrenesulfonate) hybrid films; synthesis, electrochromic response and durability characteristic, electrochemical/ chemical deposition and etching. J. Electrochem. Soc.. 2008;155:D703-D710.
- [Google Scholar]
- Nanosized nickel oxide using bovine serum albumin as template. Mater. Lett.. 2004;58:2914-2917.
- [Google Scholar]
- Nanowires of silver- polyaniline nanocomposite synthesized via in situ polymerization and its novel functionality as an antibacterial agent. Colloids Surf. B. 2012;92:35-41.
- [Google Scholar]
- Nonenzymatic glucose sensor based on graphene oxide and electrospun NiO nanofibers. Sens. Actuators, B. 2012;171–172:580-587.
- [Google Scholar]
- Comparison of nanoscaled and bulk NiO structural and environmental characteristic by XRD, XAFS and XPS. Chem. Mater.. 2012;24:4483-4490.
- [Google Scholar]
- D. Zhao, Y. Wan, W. Zhou, Ordered Mesoporous Materials, Wiley Publication, 10th Jan, 2013, pp. 55–116.
- Preparation of nickel oxide and carbon nanosheet array and its applications in glucose sensing. J. Solid State Chem.. 2011;184:2738-2743.
- [Google Scholar]
- Synthesis of CuO/graphene nanocomposites for nonenzymatic electrochemical glucose biosensor application. Electrochim. Acta. 2012;82:152-157.
- [Google Scholar]
- Highly sensitive and selective glucose sensor based on ultraviolet treated nematic liquid crystals. Biosens. Bioelectron.. 2014;59:293-299.
- [Google Scholar]
- A flexible and disposable hybrid electrode based on Cu nanowires modified graphene transparent electrode for non enzymatic glucose sensor. Electrochim. Acta. 2013;109:602-608.
- [Google Scholar]
- Non-enzymatic glucose biosensor based on copper-oxide reduced-graphene oxide nanocomposites synthesized from water-isopropanol solution. Electrochim. Acta. 2014;130:253-260.
- [Google Scholar]
- A sensitive nonenzymatic glucose sensor in alkaline media with a copper nanocluster/multiwall carbon nanotube-modified glassy carbon electrode. Anal. Biochem.. 2007;363:143-150.
- [Google Scholar]
- Nonenzymatic glucose sensor based on glassy carbon electrode modified with a nonocomposite composed of nickel hydroxide and graphene. Microchim. Acta. 2012;177:103-109.
- [Google Scholar]
- Nonenzymatic biosensor based on CuxO nanoparticles deposited on polypyrrole nanowires for improving detection range. Biosens. Bioelectron.. 2013;42:141-147.
- [Google Scholar]
- Nickel/Copper nanoparticles modified TiO2 nanotubes for non-enzymatic glucose biosensors. Sens. Actuators, B. 2013;181:501-508.
- [Google Scholar]
- One-step electrochemical synthesis of PtNi nanoparticle-graphene nanocomposites for nonenzymatic amperometric glucose detection. ACS Appl. Mater. Interfaces. 2011;3:3049-3057.
- [Google Scholar]
- The non-enzymatic determination of glucose using an electrolytically fabricated nickel microparticle modified boron-doped diamond electrode or nickel foil electrode. Sens. Actuators, B. 2010;147:642-652.
- [Google Scholar]


