

Translate this page into:
Fabrication of zinc/silver binary nanoparticles, their enhanced microbial and adsorbing properties
⁎Corresponding author. zoya.zaheer@gmail.com (Zoya Zaheer) zzkhan@kau.edu.sa (Zoya Zaheer)
-
Received: ,
Accepted: ,
This article was originally published by Elsevier and was migrated to Scientific Scholar after the change of Publisher.
Peer review under responsibility of King Saud University.
Abstract
Monometallic ZnO nanoparticles were prepared by hydrolysis of zinc acetate with ammonium hydroxide solution. Bimetallic zinc-silver nanoparticles (ZnO-AgNPs) were prepared using metal displacement galvanic cell reaction in presence of cetyltrimethylammonium bromide (CTAB). The optical and photo-physical properties of both NPs were determined. Surface plasmon resonance (SPR) intensity of ZnO-AgNPs depends on the ratio of metal salt precursors and other experimental conditions. The optical band gap (2.98 eV), agglomeration number (26819.92), and molar concentration (1.14 × 10⁻⁴ mol/liter) of ZnO-AgNPs were determined. Langmuir adsorption monolayer, Freundlich, intraparticles diffusion and multilayer adsorption isotherms used for the determination of maximum adsorption efficiency and adsorption isotherm parameters to the removal of safranin dye from an aqueous solution. The kinetics of safranin removal has also been discussed with pseudo-first order, pseudo-second order, intraparticle diffusion and multilayer kinetic models. The antibacterial and antifungal activities of ZnO, Ag and ZnO-AgNPs were determined against human pathogens using growth kinetic and disk diffusion methods. The concentrations of ZnO-AgNPs have significant effect on the bacterial growth kinetics. The death rate constants increase with increasing the NPs concentrations. It has been found that the ZnO-AgNPs hold higher microbial activities than that of monometallic counterpart, ZnO and AgNPs. Mechanism of bacterial growth and death was discussed.
Keywords
Zinc/Silver
Metal displacement
Safarnin
Adsorption
Microbial

1 Introduction
The optical, electrical, adsorbing, and microbial properties of nanoscale metal oxides semiconductor and their composites depend on the size and band gap (Kudo and Miseki, 2009). Due to the wide optical band gap, low cost, large surface area, excellent photosensitivity, and high excitation binding energy, the synthesis and characterization of ZnONPs have been the interest of various investigators for industrial, medicinal, photocatalytic and solar cell applications (Wang, 2008; Zeng et al., 2008; Sirelkhatim et al., 2015; Lu et al., 2017). Zinc is an essential trace element for human body (Pedersen et al., 2017) and possesses antibacterial and anti-inflammatory activates against human pathogens (Raguvaran et al., 2017; Liu and Kim, 2012). In addition, ZnONPs extensively used for the removal of toxic heavy metals and non-biodegradable water contaminants (Ghaedi et al., 2013; Salehi et al., 2010; Zhang et al., 2013). For example, Ghaedi et al. used monometallic Pd, Ag and ZnNPs for the removal of bromophenol red and reported that the all three adsorbents followed Langmuir adsorption isotherm (Ghaedi et al., 2013). Zhang and his coworkers studied the removal of toxic methylene blue with ZnO from aqueous water and discussed the adsorption kinetics by using pseudo-second-order kinetics (Zhang et al., 2013). Sakthivel and his coworkers reported the photo catalytic degradation of acid brown 14 azo dye by using transition metals oxides NPs of titanium, zinc, tin, zirconium, iron, tungsten, and cadmium and suggested that the ZnO acted as a most effect catalyst in presence of UV irradiation and showed low photocatalytic efficiency (Sakthivel et al., 2003). Solvothermal and hydrothermal methods were used for the fabrication of Bi-MoO6 of different molar ratio (Cao et al., 2020; Liu et al., 2019; Wang et al., 2020ab), Bi-WO6 (Wang et al., 2020a,b) and Cu2O-AgNPs (Wang et al., 2019) for the enhancement of photocatalytic and hydrogen production activities with TiO2 and CTAB.
Silver NPs are ecofriendly, nontoxic, and safe inorganic antimicrobial agent and has capability to killing diseases causing microorganisms from centuries. They have sharp well defined surface resonance plasmon (SPR) band in the UV–visible region (from 350 to 500 nm) and extensively used in antimicrobial activities (Ocsoy et al., 2017a, 2017b, water purification (Khan et al., 2018; Zaheer, 2018), catalysis (Alzahrani et al., 2018: Hayelom et al., 2017), drug-delivery (Sharma et al., 2009), antibacterial (Sondi and Salopek-Sondi, 2004), bio-sensing (Haes and Duyne, 2002), products (Eby et al., 2009) and protein interaction (Al-Thabaiti et al., 2017). Henglein prepared colloidal AgNPs using UV illumination technique in presence of different polymers and reported that the optical and physical property of AgNPs depends on the nature of stabilizer, presence of molecular oxygen, organic solvent, and chemisorbed metal cations such as Hg2+, Cd2+, Ni2+ and Ag+ (Henglein, 1998). Amino acid, DNA and graphene oxide were used as a capping agent to the preparation of AgNPs for molecular recognition, antimicrobial and photothermal activities (Ocsoy et al., 2013a, 2013b; Chen et al., 2012; Shankar and Rhim, 2015). Silver, gold and coper NPs were fabricated using the green extract of different fruits as reducing agent (Dogru et al., 2017; Demirbas et al., 2019; Duman et al., 2016). Ocsoy and his coworkers incorporated biomolecules into the metal NPs to increases their biomedical efficiencies (Ocsoy et al., 2018). Silver based nanocomposites with graphene oxide were used to detect the growth of bacterial spot on tomato and reported that the silver composites were the potential alternative of copper-based composites as an antibacterial agent (Strayer et al., 2016). Staphylococcus aureus cells was used to determine the antibacterial activities using DNA aptamer drugs (Turek et al., 2013).
Synthetic dyes were used in various industries such as cosmetics, textile, leather, and plastic to color their products and classified as anionic, cationic and nonionic. They contained toxic non-biodegradable organic materials and prevents the light penetration into the water due to aesthetic aspects, which affect the photosynthetic activity of living plants in aquatic life (Aldegs et al., 2008). Literature contained abundant reports regarding the use of transition metal NPs as a catalyst for the degradation of toxic dyes under photocatalytic and solar irradiation. For example, aptamer drug capped magnetic graphene oxide conjugates loaded with indocyanine green was prepared for the estimation of photothermal and photodynamic therapies against the membrane of cancer cell lines (Ocsoy et al., 2016). Monometallic ZnO, bimetallic (Ag/ZnO, La-doped ZnO and Sn-doped ZnO) NPs were used as a catalyst for the photocatalytic degradation of toxic and non-biodegradable dyes such as methylene blue (Jang et al., 2006; Sun et al., 2011; Whang et al., 2012; Saravanan et al., 2013; Bomila et al., 2018). ZnONPs were also used for the solar photocatalytic degradation of acid brown 14 azo dye (Sakthivel et al., 2003). Safranin is a cationic non-biodegradable dye and used in textile industries for dying purposes. It is harmful to human begins and affected the respiratory, skin and digestive system (Fayazi et al., 2015). The removal of safranin from wastewater could be considered as a big challenge due to its harmful impacts. The adsorption, photocatalytic, optical and microbial properties of bimetallic NPs have been enhanced significantly due to the combined effect of both metals. For example, bimetallic NPs of silver and gold with ZnO oxide increased the degradation of organic pollutants under UV and visible (Fageria et al., 2014; Zheng et al., 2007). Various methods such as seed growth, co-reduction, sol–gel, and precipitation were used for the incorporation of second method (silver and gold) into the monometallic ZnONPs (Liu et al., 2012). The synthesis of bimetallic ZnONPs with visible light sensitive NPs via galvanic cell reaction is lacking. To the best of our knowledge, the removal of safranin by using ZnO-AgNPs as an adsorbent has not been reported in the literature.
Our goal in this study was to fabricate the ZnO-AgNPs bimetallic by using metal displacement galvanic cell reaction in presence of CTAB as stabilizing agent. For this purpose, ZnONPs were prepared with thermal hydrolysis of zinc acetate by adding ammonium hydroxide solution. The ZnO-AgNPs used as an adsorbent to the adsorption of safranin (azonium biological strain, used in histology, cytology and as redox indicator in analytical chemistry) from an aqueous solution. The safranin adsorption on the surface of ZnO-AgNPs was discussed with different adsorption isotherms, kinetic models and thermodynamic parameters. The antibacterial and antifungal activities of Zn, Ag and ZnO-AgNPs were determined against Gram positive Staphylococcus aureus (S. aureus MTCC#3160) and Candida albicans ATCC 10231. The bacteria growth kinetics experiments were modeled to establish the role of NPs concentrations on the antimicrobial properties.
2 Experimental section
2.1 Chemicals
Zinc acetate (Zn(CH3COO)2, molar mass = 183.48 g/mol), silver nitrate (AgNO3, molar mass = 169.87 g/mol) were purchased from Sigma-Aldrich and used as metal salt precursors for the synthesis of ZnO and ZnO-Ag NPs without further purification. Sodium hydroxide (NaOH, molar mas = 40 g/mol), cetyltrimethylammonium bromide (C19H42NBr, molar mass = 364.45 g/mol), inorganic electrolytes (all reagent grade) were used as received. Distilled water (deionized and CO2 free) was used as solvent to the preparation of all reactants. Stock solution of NaOH was standardized against standard oxalic acid solution using phenolphthalein as in indicator. Ammonium hydroxide solution was used to maintain the pH adjustment. Silver nitrate solution was kept in an amber glass bottle to protect from photochemical reduction of Ag+ ions.
2.2 Synthesis of ZnONPs
The colloidal ZnO was prepared by using hydrolysis method as reported in the literature with slight modification (Pesika et al., 2003). The stock solution of Zn (CH3COO)2 (0.01 mol/liter) and CTAB (0.01 mol/liter) was prepared in required volume of deionized water. In a typical experiment, the solutions of Zn(CH3COO)2 (5.0 ml) and CTAB (10 ml) was mixed in a reaction vessel containing 100 ml water and then placed in a hot water bath at 353 K for 2 h. The pH was maintained constant ca. 10.0 by adding the ammonium hydroxide solution. As a result, the colorless reaction solution became cloudy immediately due to the formation of Zn(OH)2. Finally, the white precipitate of ZnONPs was formed and deposited in the reaction flask. The white color powder was collected, washed with deionized water, dried in air at room temperature and annealing was performed at 673 K for 2 h. The resulting ZnO powder was used for the synthesis of ZnO-AgNPs.
2.3 Synthesis of ZnO-AgNPs
Galvanic metal displacement cell reaction was used to the synthesis of Zn-AgNPs by using colloidal solution of as prepared ZnO (Niu et al., 2012). Reduction potentials of Zn2+/Zn0 and Ag+/Ag0 redox couples were −0.76 V and +0.799 V, respectively. The Ag+ ions were reduced on the surface of metallic Zn (Eq. (1)).
Therefore, Ag0 was deposited on the surface of ZnO in presence of CTAB. In a typical experiment, as prepared ZnO NPs (20 mg) was dispersed a reaction flask containing 50 CTAB and stirred with continuous magnetic stirrer. The solution of AgNO3 (2.0 × 10⁻³ mol/ liter) was also prepared in CTAB and was added drop-wise into the reaction mixture under constant stirring. The resulting suspension was heated at 333 K for 24 h. The brown–red precipitate of Zn-AgNPs was collected using filtration, washed with distilled water followed by ethanol, and dried in open atmosphere for 5 h at 323 K.
2.4 Characterization of NPs
The optical properties of Zn-AgNPs were determined with using UV–visible spectrophotometer (UV–Vis, Perkin Elmer, Lambda 35v). The spectra were recorded from 200 to 800 nm at different time intervals with quartz cells and deionized water was used as reference. The surface morphology was determined by using scanning electron microscope, and transmission electron microscope. For TEM measurements, the dew drop of aqueous suspension was deposited on the carbon coated copper grid (50 mesh) and dried under open atmosphere at room temperature prior to use. The electrophoresis experiments were performed to determine the zeta potential and stability of NPs. The X-ray diffractometer was employed to determine the crystalline structure of ZnO-AgNPs with scanning range from 100 to 800, scanning rate of 2theta angles min−1, with monochromatic CuKα radiation at 40 kV and 30 mA current. The Debye-Scherrer formula (Eq. (2)) was used to determine the crystallite of ZnO-AgNPs.
2.5 Batch experiments
The as prepared ZnO-AgNPs was used as an adsorbent for the removal of safranin form an aqueous solution. In a typical experiment, the ZnO-AgNPs (0.02 g) was added in different reaction vessel containing the required amount of deionized water for dilution for the preparation of suspension. The different amount of safranin (ranging from 35.0 mg/liter to 105.2 mg/liter) was added into each reaction vessel and the resulting reaction mixture was stirred for 1 h with constant shaking speed at 298 K. For the evaluation of adsorbent effect on the removal of safranin, the different amount of ZnO-AgNPs was added in a series of reaction vessel containing a constant amount of safranin (35.0 mg/g) at 298 K. The amounts of adsorbed safranin at equilibrium (qe; mg/g) and as a function of time (qt; mg/g) were as calculated with Eqs. (3) and (4) (Kosa and Zaheer, 2019).
The effect of temperature (from 298 K to 335 K) was also studied to determine the nature of adsorption and their associated thermodynamic parameters were also calculated by using the following relations (Eqs. (9)–(12)).
2.6 Reusability of ZnO-Ag
In order to determine the stability of ZnO-AgNPs, the adsorbent was separated from the reaction mixture after the first adsorption experiment, wash with water and dried at room temperature. For desorption, adsorbent was treated with sodium hydroxide (0.1 M) and acetic acid (0.1 M) separately to the removal of dye in acidic and basic media. The resulting mixture was stirred for 30 min at 303 K. The generated adsorbent with acetic acid was used again for next batch experiment for the estimation of durability and stability.
2.7 Microbial activities
Antibacterial and antifungal assay of ZnO, Ag and ZnO-Ag were tested against Gram positive (Staphylococcus aureus (S. aureus MTCC#3160) and Candida albicans (C. albicans ATCC#90028) human pathogens strains by using dilution disk diffusion technique according to the guidelines reported in the literature (Zaheer et al., 2019). The required size of Whatman filter paper discs were prepared, sterilized, impregnated with the known sample concentrations, placed on the cultured plates, incubated at 37 °C for 48 h, and determined the diameter of zone of inhibition. The gentamicin and fluconazole were used as inhibition control and the test was performed on a separate disc. The minimum inhibitory concentration (MIC = no growth and/or turbidity were observed by necked eye) was estimated by the reported method (Gutierrez et al., 2018). For the growth of bacterial (killing kinetics), the cultured bacterial cells were transferred into a reaction flask containing the required amount of NPs. The progress of killing rates was monitored by recording the absorbance of reaction mixture at 600 nm and 490 nm for S. aureus and Candida albicans with definite different time intervals respectively (Chatterjee et al., 2015). Sondi and Salopek-Sondi method was used for the calculation of bacterial concentration (Sondi and Salopek-Sondi, 2004). The minimum bactericidal concentration (MBC = no visual growth of bacteria) was determined for both human pathogens.
3 Results and discussion
3.1 Optical properties and morphology of ZnO, Ag, and ZnO-AgNPs
The aqueous sols of transition metals NPs produced different color from pale yellow, yellow, orange, and brown, red to blue due to the collective resonance oscillation and exhibited an intense SPR band in the UV–visible region. The position of SPR band and their intensity depends on the method of preparation, nature of capping agent, pH and ageing with temperature. The aqueous suspension of as prepared ZnONPs was milky. Fig. 1A shows the UV–visible spectra of ZnONPs, which exhibits a sharp absorption band at 355 nm indicating the formation of ZnONPs. The hypsochromic (from 315 to 390 nm) and bathochromic (from 390 to 350–355 nm) shift depends on the experimental conditions (Shvalagin et al., 2007). To determine the stability of ZnONPs, UV–visible spectra were recorded at two different time intervals (60 and 120 min) after dispersing in water. The position of absorption peak at 355 nm and absorption intensity remains constant with increasing time, indicating that the ZnONPs was stable at room temperature under our experimental conditions (Fig. 1A). Our absorption peak at 355 nm is in excellent agreement to the absorption peak of ZnONPs reported by various investigators at 355, 369, 364, 365 and 378 nm (Shvalagin et al., 2007; Fageria et al., 2014; Mittal et al., 2014; Sun et al., 2011; Pudukudy and Yaakob, 2014). From the absorption spectrum, the optical band gap of ZnO with using classical Tauc relation (Eq. (13)).
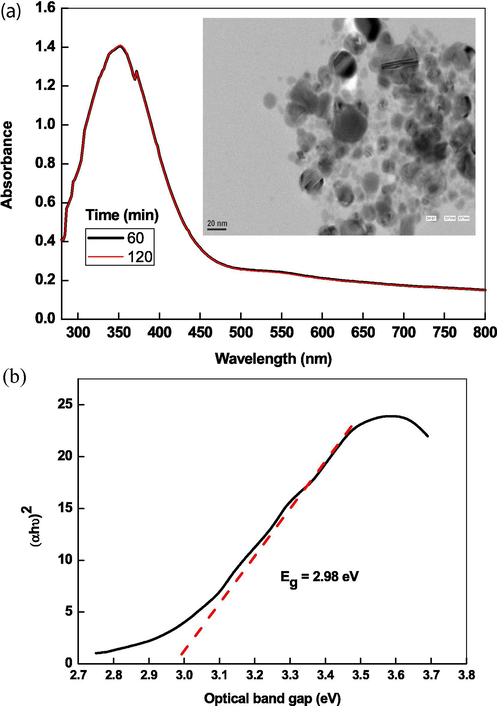
UV–visible spectra of ZnONPs and their TEM images prepared by hydrothermal hydrolysis in presence of CTAB (A) and Tauc plot for the calculation of optical band gap.
The agglomeration number of ZnO NPs (NZnO) and average number of atoms per particles (Naverage) were calculated with Eqs.14 and 15, respectively (Table 1).
Parameters
ZnO
Ag
ZnO-Ag
Color
White
Orange
Yellowish orange
Position of peak
354 nm
440 nm
354 and 440 nm
Aggregation
21728.83
30684.57
26819.92
C (mol/liter)
1.38 × 10⁻⁵
9.78 × 10⁻⁶
1.14 × 10⁻⁴
Size
5–25 nm
4–20 nm
2–30 nm
Shape
Spherical; irregular
Spherical
Flower-like; irregular
Zone of inhibition
12 mm
15 mm
24 mm
S. aureus activity
Active
Active
Active
C. albicans
Active
Active
Active
Fig. 2A shows the UV–visible spectra of AgNPs as a function of time, which was prepared by using ascorbic acid (2.0 × 10⁻² mol/liter), AgNO3 (1.0 × 10⁻³ mol/liter), and CTAB (10.0 × 10⁻⁴ mol/liter) as a reducing, oxidizing and stabilizing agent, respectively. The resulting silver sols exhibit a sharp SPR band at ca. 440 nm, which was the characteristic of spherical NPs. Reaction-time profile indicates that the nucleation and growth process were completed within 40 min of reaction time (Fig. 2B). The agglomeration number (NAg) and molar concentration of AgNPs were calculated by using Eqs. (14) and (15) and these values were found to be 30684.57 and 9.78 × 10⁻⁶ mol/liter with density of Ag (10.5 g/cm3), atomic mass of Ag (107.86) diameter of AgNPs (10 nm), and volume of the reaction solution (0.01 mol/liter). TEM images shows that the AgNPs were spherical (size ranging from 4 nm to 22 nm) and poly-dispersed Table 1). The resulting silver sol has dark orange color, which is the characteristic of spherical NPs.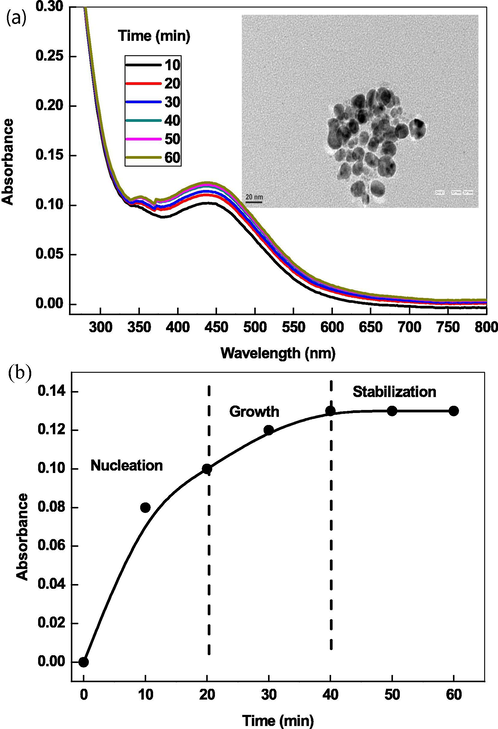
UV–visible spectra of AgNPs and their TEM images prepared by ascorbic acid in presence of CTAB (A) and reaction-time profiles (B).
For the preparation of ZnO-AgNPs, aqueous suspension of ZnONPs was prepared in water (10 ml) containing CTAB (10 ml of 0.01 mol/liter). The AgNO3 solution (10 ml of 0.01 mol/liter) was added into the reaction flask and the resulting solution was stirred with magnetically at room temperature. The milky reaction mixture became yellow to orange like with increasing reaction time, indicating the reduction of Ag+ ions and formation of AgNPs. The reduced Ag0 was simultaneously deposited onto the surface of ZnO, which leads to the formation of ZnO-AgNPs (Fig. 3). The intensity of SPR band depends on the reaction time and concentration of AgNO3. Optical images of ZnONPs, AgNO3 and ZnO-AgNPs clearly indicates the formation of orange color like ZnO-AgNPs, which might be due to the reduction of Ag+ ions by ZnO with metal displacement reaction (Scheme 1). Visual observations also indicate that the reaction time and concentration of Ag+ ions have significant impact on the stability of resulting ZnO-Ag nano sols in water. At higher concentration of Ag+ ions, yellowish white precipitates were appeared due to the uncontrolled nucleation and growth processes.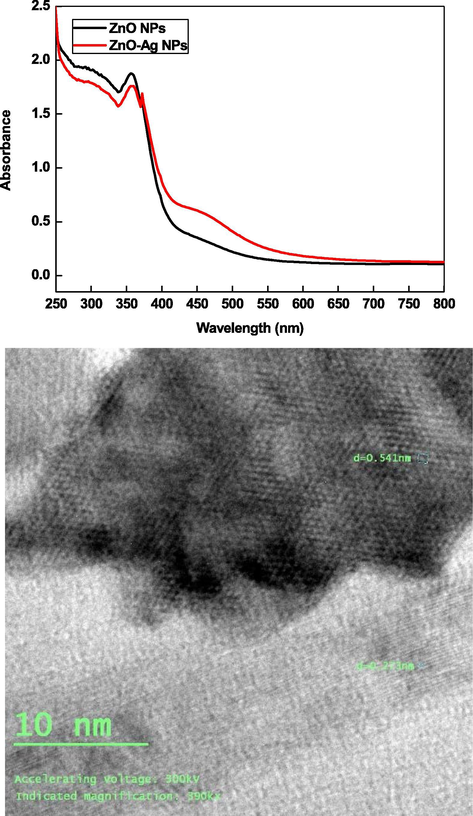
UV–visible spectra of ZnO and ZnO-AgNPs and TEM images of ZnO-AgNPs prepared by hydrothermal hydrolysis and metal displacement reaction, respectively.
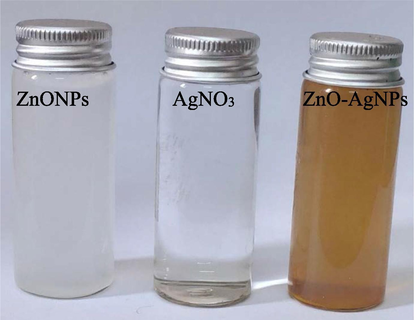
Optical images of ZnO, AgNO3 and ZnO-AgNPs at room temperature.
The standard reduction potentials of Ag+/Ag0 couple (Eq. (18)) were enough to oxidize the metallic Zn surface into Zn2+ ions (Eq.19). Finally, ZnO-AgNPs were formed by metal displacement galvanic cell reaction (Eq. (1)).
The presence of two types of absorption peaks at 355 nm and 450 nm, characteristic peak of pure zerovalent ZnO and AgNPs, respectively, confirms that the as-prepared NPs are composed of metallic ZnO and Ag (Shvalagin et al., 2007; Zheng et al., 2007). TEM images shows that the ZnO-Ag NPs were spherical (size ranging from 2 nm to 30 nm) and poly-dispersed. The resulting sols has orange color like turbidity. The agglomeration number of ZnO-AgNPs = 26819.92 and molar concentration of ZnO-AgNPs = 1.14 × 10⁻⁴ mol/liter were calculated by using Eqs. (14) and (15) with density of ZnO + Ag (=16.11 g/cm3), atomic mass of ZnO-AgNPs (189.24), diameter of ZnO-AgNPs (10 nm), and volume of the reaction solution (0.01 mol/liter). Scheme 2 shows the oxidation of metallic ZnO by Ag+ ions.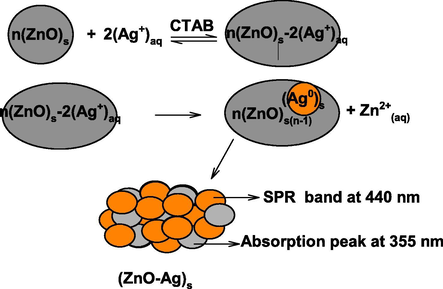
Oxidation of ZnO NPs by Ag+ ions.
XRD spectra of ZnO, Ag, ZnO-AgNPs were recorded to determine the crystalline and purity of as prepared NPs. XRD spectra of ZnO shows the presence of many Bragg peak at 2θ values of 31.20 (1 0 0) , 34.30 (0 0 2), 37.520 (1 0 1), 46.90 (1 0 2), 56.20 (1 1 0), 62.50 (1 0 3), 67.20 (1 1 2), and 78.60 (2 0 2) (JCPDS NO: 36–1451) corresponding crystal planes miller indices to the hexagonal wurtzite structure of ZnO (Fig. 4A) (Zhang, et al., 2004). The presence of four characteristic peaks at 2θ = 38.20 (1 1 1), 44.30 (2 0 0), 64.50 (2 2 0), and 77.50 (3 1 1) (JCPDS file NO: 89-3722) crystal plane indicates that the face-centered-cubic metallic AgNPs are pure crystalline in nature. XRD pattern of ZnO-Ag exhibited a clear peak at 2θ = 38.20 (1 1 1), indicating the presence of (1 1 1) plane of metallic silver on the surface of ZnO. For ZnO-AgNPs, the peaks at 2θ = 64.5 and 77.5 correspond to the diffraction peaks of silver. We did not observe any remarkable shift of all diffraction peaks of ZnO and Ag, suggesting that the solid solution of ZnO-AgNPs was not formed. The average size of Zn, Ag and ZnO-AgNPs was calculated using (Eq. (2)). The calculated average particle of Zn, Ag, and Zn are found to be 16 nm, 25 nm and 18 nm, respectively, for the width of (1 0 1), (1 1 1) and (1 0 1) Bragg’s refraction, which are in close agreement of the size determined from the TEM images. EDX spectrum of ZnO-Ag NPs for selected area was also recorded. The metallic Zn and Ag generally show the strong signals at 1.0, 8.8, 9.6 keV and 3.0 keV, respectively. Fig. 4B indicates the presence of presence of Zn, O and Ag along with C. The ZnO-Ag contained zinc (weight % = 41.12; atomic% = 21.76), oxygen (weight % = 32.43; atomic% = 69.77), and silver (weight % = 26.45; atomic% = 8.46). EDX spectrum shows signal of carbon, which might de due to the TEM grid coated with carbon.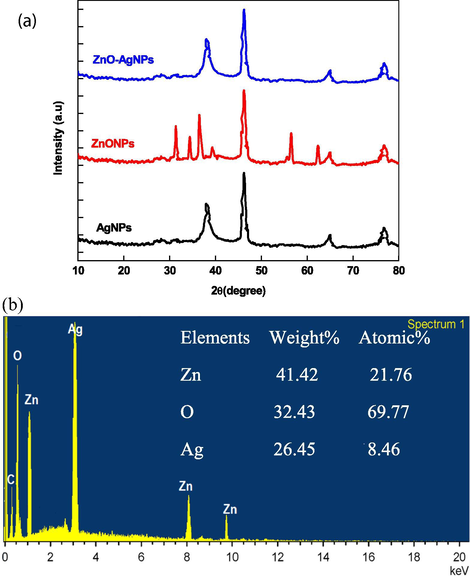
XRD spectra of ZnO, Ag, and ZnO-Ag NPs (A) and EDX of ZnO-Ag NPs (B).
3.2 Adsorption of safranin
Contact time and pH were the main important parameters to determine the adsorption efficiency of any adsorbent. A series of adsorption batch experiments were performed with three different dye concentrations (35.0, 70.2 and 105.2 mg/liter) at a fixed loaded amount of adsorbent (0.02 g) and 298 K temperature. Fig. 5A shows that the adsorption of dye onto the surface of increased with contact time, reached the saturation point an became constant after ca. 50 min. As the time increases, the binding sites of adsorbent became saturated due to the maximum adsorption of safranin. The pH of the reaction mixture changed the structural properties of dye due to the presence of pH sensitive groups. Therefore, the role of pH was studied over the pH ranging from 2.0 to 12.0 with 35.0 mg/L safranin and 0.02 g absorbent. Interestingly, the percentage of dye adsorption increases with pH from 2.0 to 8.0 (Fig. 5B) and became constant at higher pH. Maximum adsorption of safranin occurred at pH = 8.0. The pH of the reaction mixture undoubtedly affected the surfaces properties of ZnO-AgNPs. In alkaline media, hydroxide layer was formed on the surface of adsorbent, which hinder the adsorption of dye. As the pH increases, the number of hydroxyl groups, which leads to decrease the cationic dye adsorption on the surface of adsorbent.![Reaction-time profiles (A), effect of pH (B) and lnKad versus time plots (C) to the adsorption of safranin. Reaction conditions: [adsorbent] = 0.02 g, Temperature = 298 K, pH = 8.0 (A).](/content/184/2020/13/11/img/10.1016_j.arabjc.2020.09.023-fig7.png)
Reaction-time profiles (A), effect of pH (B) and lnKad versus time plots (C) to the adsorption of safranin. Reaction conditions: [adsorbent] = 0.02 g, Temperature = 298 K, pH = 8.0 (A).
Generally, rate of adsorption increased with rising temperature of the reaction bath. In order to establish the exothermic and endothermic nature of dye adsorption on the adsorbent, the effect of temperature was evaluated under optimum experimental conditions. It was observed that the adsorption efficiency increases with rising temperature from 298 to 318 K, indicating that adsorption is an endothermic process (Table 2). Thermodynamic parameters (adsorption equilibrium constant, Kad, ΔG0, ΔH0, and ΔS0 were calculated with Eqs. (9 and 12). From Eq. (9), Kad was calculated at different temperature ranging from 298 to 318 K for three different concentrations of dye (35.0, 70.2 and 105 mg/liter) at fixed amount of ZnO-Ag (0.02 mg). The ΔS0 and ΔH0 were calculated from the slope and intercept of Fig. 5C (Van’t Hoff plot; lnKad versus 1/T; Eq. (10)). Table 3 shows that the ability of adsorbent to the adsorption of dye increases with temperature. The ΔG0 were calculated from Eqs. (11) and (12). The ΔG0 became more negative with temperature, indicating the higher spontaneity of the dye removal at higher temperature. The positive values of ΔH0 (13.26, 16.54 and 11.60 kJ/mol) indicates that the adsorption on safranin process is endothermic in nature and disorder of dye molecules was increased by the adsorption process. The positive value of ΔS0 (55.70, 67.34 and 52.79 J/mol/K) also confirmed shows that the increased randomness at the ZnO-Ag-dye interface (Xiong et al., 2001).
[Safranin]
Temperature
Kad
ΔG0
ΔS0
ΔH0
R2
(mg/liter)
(K)
(KJ/mol)
(J/K/mol)
(KJ/mol)
35.0
298
3.80
−0.88
55.7
13.3
0.998
308
4.70
−1.3
318
5.51
−1.6
328
6.62
−1.9
70.2
298
4.21
−3.5
67.3
16.5
0.999
308
5.32
−4.2
318
6.50
−4.9
328
7.51
−7.5
105.2
298
5.31
−3.3
52.7
11.6
0.989
308
6.42
−3.9
318
7.10
−4.5
328
8.24
−5.7
Kinetic models
Kinetic parameters
[safranin] (mg/liter)
35.0
70.2
105.2
Pseudo-first order
Intercept
0.32
0.39
0.39
Slope
−0.013
−0.008
−0.004
102 k1 (min−1)
2.9
1.9
0.92
R2
0.965
0.997
0.999
qc, cal (mg/g)
2.08
2.47
2.45
Pseudo-second order
Intercept
7.3
21.0
43.6
Slope
0.350
0.200
0.150
103 k2 (min−1)
16.8
1.90
0.52
R2
0.986
0.999
0.928
qc, cal (mg/g)
2.85
5.0
6.6
Intraparticle diffusion
Intercept
−0.10
−0.51
−0.33
Slope
0.326
0.298
0.173
kdif (min−1)
0.326
0.298
0.173
R2
0.972
0.994
0.986
I
−0.10
−0.51
−0.33
Elovich
Intercept
−0.67
−1.00
−0.16
Slope
0.678
0.617
0.355
α
0.26
0.12
0.06
R2
0.994
0.999
0.957
β
1.47
1.62
2.81
The adsorption rate constant such as pseudo-first-order (k1 min−1), pseudo-second-order (k2 g/mg. min), intraparticle diffusion (kdiff mg/g.min), boundary of thickness (I mg/g), initial adsorption rate constant (α mg/g. min), and activation energy of chemical adsorption (β mg/g) were determined by using Lagergren pseudo-first-order, pseudo-second order, intraparticle diffusion, and Elovich kinetic models (Ghaedi et al., 2015; Zaheer et al., 2019). Initial linear part was utilized to determine the adsorption rate and other associated parameters. i.e., 50 min. Lagergren pseudo-first-order kinetic equation (Eq. (5)) was used. The first-order rate constant was calculated from the slope and intercept of pseudo-first-order plot (Fig. 6A). The pseudo-second order rate law (Eq. (6)) employed for the estimation of rate constant at three different dye concentrations. Table 3 shows that the qe, cal (2.85, 6.0, and 6.6 mg/g) obtained from the pseudo-second order plots (Fig. 6B), indicating that the these qe values are much closer to the experimental qe and corresponding R2 (0.986, 0.999, and 0.928) are higher than pseudo-first-order R2. Thus, removal of safranin obeyed pseudo- second-order kinetics.![Various kinetic plots to the adsorption of safranin on adsorbent. Reaction conditions: [adsorbent] = 0.02 g, pH = 8.0, Temperature = 298 K. Pseudo-first-order (A), Pseudo second-first-order (B), intraparticle diffusion (C) and Elovich (D).](/content/184/2020/13/11/img/10.1016_j.arabjc.2020.09.023-fig8.png)
Various kinetic plots to the adsorption of safranin on adsorbent. Reaction conditions: [adsorbent] = 0.02 g, pH = 8.0, Temperature = 298 K. Pseudo-first-order (A), Pseudo second-first-order (B), intraparticle diffusion (C) and Elovich (D).
Thickness of surface boundary of adsorbent has significant impact on the removal of dye. Therefore, Weber and Morris kinetic rate law (intraparticle particle diffusion) was also used. From the intercept and slope of Weber and Morris plot (Fig. 6C), the value of diffusion rate constant and thickness of surface layer were calculated. Weber and Morris plot (qt against t1/2) is not passing through the origin. They have negative intercept on the y-axis (−0.10, −0.51, and −0.33). Table 3 shows that the value of I is also negative, which provides about the surface layer thickness. The safranin adsorption does not obey an intraparticle diffusion kinetic rate law (Eq. (7)). Elovich plot was constructed between qt and lnt (Fig. 6D) to establish the nature of dye adsorption (Eq.8). The values of associated parameters (β and α) calculated from the slope and intercept (Table 3). The obtained R2 (0.994, 0.999, and 0.957) of this model shows that safranin adsorption onto ZnO-Ag adsorbent can be followed by formation of multilayer and physisorption adsorption dominating with chemisorption (Elovich and Larinov, 1962).
Langmuir proposed an isotherm to explain the formation of monolayer around the adsorbate on the outer surface of adsorbent during the equilibrium distribution (Eq. (20)) (Langmuir, 1916).
The values of Q0max and KL were computed (Table 4) from the Langmuir plot (1/qe versus 1/Cc; Fig. 7A). Equilibrium constant (RL = dimensionless constant and an essential feature of the Langmuir isotherm was also calculated from Eq. (22).
Isotherms
Parameters
Langmuir
Intercept
0.0055
KL (liter/mg)
0.020
Slope
0.269
RL
0.39
Q0max (mg/g)
181.8
R2
0.986
Freundlich
Intercept
1.68
1/n
0.354
Slope
0.354
n
2.8
logKF (mg/g)
1.68
R2
0.969
Temkin
Intercept
32.47
AT (liter/mg)
2.5
Slope
35.09
bT
70.6
RT/bT
35.09
R2
0.984
Dubinin-Radushkevich Intercept
4.798
KDR (mol2 J−2)
1.12 × 10⁻⁶
Slope
− 1.21 × 10⁻⁶
Efree (kJ/mol)
0.64
lnqDR
2.798
R2
0.938
BET
Intercept
5.79 × 10⁻⁴
KBET
16.57
Slope
0.009
qm (mg/g)
71.94
R2
0.982
![Adsorption isotherm plots (Langmuir (A), Freundlich (B), Temkin (C), Dubinin–Radushkevich (D), and BET (E)) for the removal of safranin. Reaction conditions: [adsorbent] = 0.02 g, pH = 8.0, Temperature = 298 K.](/content/184/2020/13/11/img/10.1016_j.arabjc.2020.09.023-fig9.png)
Adsorption isotherm plots (Langmuir (A), Freundlich (B), Temkin (C), Dubinin–Radushkevich (D), and BET (E)) for the removal of safranin. Reaction conditions: [adsorbent] = 0.02 g, pH = 8.0, Temperature = 298 K.
The RL value provides the information about the nature of adsorption. For unfavorable, linear, favorable, and irreversible adsorption process, the RL value should be RL > 1, RL = 1, 0 < RL < 1 and RL = 0, respectively. Table 4 shows that the RL is greater than 0 but less than 1, suggesting that adsorption of safranin on adsorbent is favorable under our conditions.
Freundlich adsorption isotherm is oldest isotherm, which employed to explain the adsorption characteristics (Eq. (23)). These data often fit the empirical equation proposed by Freundlich (Freundlich, 1906).
KF: Freundlich isotherm constant (mg/g), n: adsorption intensity. Linear form of Eq. (23) can be written as:
Isotherm parameters were calculated by Freundlich isotherm plot (log qe versus log Cc; Fig. 7B). The logKF = 1.684, 1/n = 0.354, n = 2.8 were found with R2 = 0.969. These data indicate that the adsorption is favorable (0 < 1/n < 1). R2 = 0.969 is lower than that of Langmuir I R2 (0.986), suggesting that the safranin adsorption on ZnO-AgNPs surface followed Langmuir isotherm.
To see insight into the adsorption nature (physical or chemical), Temkin isotherm was employed (Temkin and Pyzhev, 1940). The linear and non-linear forms of this isotherm were as follows:
To establish the mechanism of dye adsorption, Dubinin–Radushkevich isotherm model was also applied, which expressed the adsorption mechanism on the heterogeneous surface of the adsorbent (Eqs. (27)–(29)) (Dubinin and Radushkevich, 1947).
For physisorption adsorption, the Efree should be 1 to 8 kJ/mol according to the Dubinin–Radushkevich isotherm. The Efree was found to be 0.64 kJ/mol, indicating that the adsorption of safranin proceeds through the physisorption adsorption followed by chemisorption.
The BET isotherm was also employed to fit the adsorption date (Eq. (31)), which assumes that layers of adsorbate molecules are adsorbed on upper side of the previously adsorbed molecules.
The values of KBET = 15.57 and qm = 10.42 mg/g was calculated from BET isotherm plot (Fig. 7E; Ce/qe (C0-Ce) versus Ce/C0) with R2 = 0.982 (Table 4).
3.3 Adsorption mechanism
The pH of batch experiment played in important role during the adsorption of dye onto surface of adsorbent. Safranin is a basic biological azonium dye. The adsorption of dye depends on the various factors (pH, surface charges and ion-exchange). ZnO-Ag surface is positive due to the complex formation between the metallic silver and adsorbed silver ions (Henglein, 1993). ZnO-Ag was not stable in strong acidic and basic media due to the oxidation of metallic zinc into Zn2+ ions and oxidative dissolution of metallic silver via formation of hydroxyl layer), respectively (Wang, 2008; Liu and Hurt, 2010). As the pH increases, the number of negative charge increases on the surface of adsorbent, which leads to the maximum adsorption of safrnin in pH ranging from 6 to 8 (Scheme 3).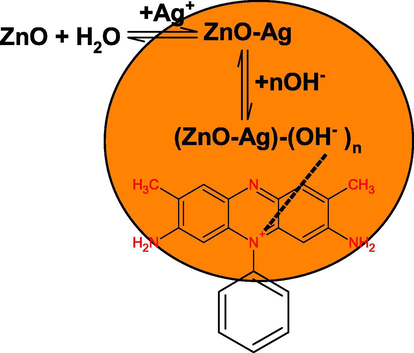
Probable adsorption mechanism of safranin onto the ZnO-AgNPs.
Scheme 3 shows the adsorption of safranin onto the surface of adsorbent. Isotherms data (Dubinin–Radushkevich and Temkin) indicates that the both physisorption and chemisorption adsorption processes operates simultaneously during the dye adsorption. Surface of ZnO-Ag is positive due to the presence of silver on the ZnO, and OH– formed hydroxide layer in alkaline media. On the other hand, safranin is basic azonium dye carrying positive nitrogen. Safranin adsorption on the surface of adsorbent through electrostatic interactions between the dye and ZnO-Ag and van der Walls forces would also be involved in the dye adsorption processes.
3.4 Stability of adsorbent
Desorption of dye from the surface of an adsorbent provides significant information and helps to establish the mechanism of dye adsorption. For desorption, the safranin loaded ZnO-AgNPs was separated from the reaction mixture after adsorption experiment, dried, washed and weighted. In a typical experiment, the same amount of dye-adsorbent was agitated with required amount of water having different pH values ranging from 2 to 12 and stirred in a shaker for 50 min (Fig. 8A), maximum adsorption time of safranin adsorption on adsorbent (Arami et al., 2006). The desorbed safranin concentration was calculated (vide supra). The effect of pH on the safranin dye desorption from the surface of adsorbent is depicted graphically in Fig. 8A. The percentage desorption decreased with increasing the pH from 2.0 to 12.0 at safranin concentration of 35.0 mg/liter. The number of negatively charged sites on the adsorbent increased due to the hydroxide layer formation on the surface of adsorbent. At higher pH (≥8.0), negatively charged adsorbent has strong adsorption efficiency towards cationic safranin dye due to electrostatic interactions, which hindered desorption of adsorbed dye from the surface of adsorbent. As a result, the percentage of dye desorption decreased from 90 to 40 at pH 2.0 to 12.0 respectively (Fig. 8A).![Effect of pH (A), desorption of dye (B) and reusability of adsorbent (C) on the removal of safranin. Reaction conditions: [safranin] = 35.0 mg/L, Temperature = 298 K.](/content/184/2020/13/11/img/10.1016_j.arabjc.2020.09.023-fig11.png)
Effect of pH (A), desorption of dye (B) and reusability of adsorbent (C) on the removal of safranin. Reaction conditions: [safranin] = 35.0 mg/L, Temperature = 298 K.
The desorption of safranin was also performed by using sulphuric acid (0.1 M), acetic acid (0.1 M), NaOH (0.1 M), water, methanol and acetonitrile. Desorption efficiency was summarized in Fig. 8B. The desorption ability of NaOH (10%) was found lower than that of sulphuric acid (80%), and acetic acid (60%). On the other hand, methanol has higher desorption efficiency than that of acetonitrile and water. Thus, we may state confidently that desorption of safranin dye was inversely correlated with the pH effect of the adsorption process and adsorption of dye occurred via ion-exchange mechanism (Reddy et al., 2012).
The reusability of adsorbent was also studied by using desorption of safranin with acetic acid for six consecutive cycles. The removal percentage of safranin was estimated and found to be 95%, 93%, 90%, 89%, 87% and 85% for cycle1, cycle2, cycle3, cycle4, cycle5 and cycle 6, respectively (Fig. 8C). These results indicated that the removal percentage was decreased by 10% for cycle6 as compared to cycle1, which might be due to the slow oxidative dissolution of AgNPs in an aqueous solution during the consecutive steps (Adamczyk et al., 2016). Thus, we may state confidently that the ZnO-Ag possess excellent stability and higher dye removal efficiency.
3.5 Microbial activities of ZnO, Ag, and ZnO-AgNPs
Antibacterial and antifungal activities of ZnO, Ag and ZnO-Ag NPs were determined through kinetic growth method at 600 nm and 490 nm, respectively, against Gram positive (S. aureus MTCC#3160) and Candida albicans ATCC 10,231 for 48 h. The results of bacterial and fungus kinetic studies are summarized in Fig. 9 A and B, respectively. Inspection of these results shows that the absorbance increases with increasing the bacteria as well as fungus growth (Chatterjee et al., 2015). The growth kinetics curves are sigmoidal in nature, which showed that the bacteria growth proceeds through an induction period (time required for nucleation) followed by autoaccleration and reaches a constant value. It was observed that the ZnO-Ag NPs were the most effect than that of monometallic ZnO and Ag NPs, which can be ascribed due to the synergistic effect of Zn and silver metals (Table 5). To determine the effect of ZnO-Ag on the growth kinetics, various kinetic experiments were performed with increasing concentration of ZnOAg from 10.0 × 10⁻⁵ to 50.0 × 10⁻⁵ mol/liter at fixed S. aureus and C. albicans. The ZnO-Ag NPs concentrations have significant effect on the bacterial growth kinetics and shape of the growth curves drastically changed with increasing ZnO-Ag concentration (Fig. 10). The sigmoidal behavior was observed for both S. aureus and C. albicans in absence of ZnO-Ag NPs (negative control). Lag, growth, stationary, and death phases depends on the NPs concentrations (Fig. 10 A). As the NPs concentrations increases, the sigmoidal shape became non-monotonic nature, reached a maximum value and then decreased with time. At higher concentration (≥40.0 mol/liter), all phases were not observed. The growth rate constant (r) was calculated by using first-order rate law (Eq. (33)).
![Growth profile of S. arueus (A) and C. albicans strains (B) in presence of different NPs. Reaction conditions: [NPs] = 10.0 × 10⁻⁵ mol/L, Temperature = 298 K.](/content/184/2020/13/11/img/10.1016_j.arabjc.2020.09.023-fig12.png)
Growth profile of S. arueus (A) and C. albicans strains (B) in presence of different NPs. Reaction conditions: [NPs] = 10.0 × 10⁻⁵ mol/L, Temperature = 298 K.
Sample
Concentration (mol/L)
Zone inhibition (mm)
102Growth rate (h−1)
S. aureus
C. albicans
S. aureus
C. albicans
ZnO-AgNPs
5
4
3
10.2
12.2
10
9
7
7.3
9.4
15
12
11
6.8
7.3
20
15
13
6.2
6.9
30
18
15
4.0
4.7
40
20
18
2.2
4.7
50
24
21
0.8
2.3
60
0.0
0.5
80
0.0
0.0
Standarda
5
22
28
11.0
16.5
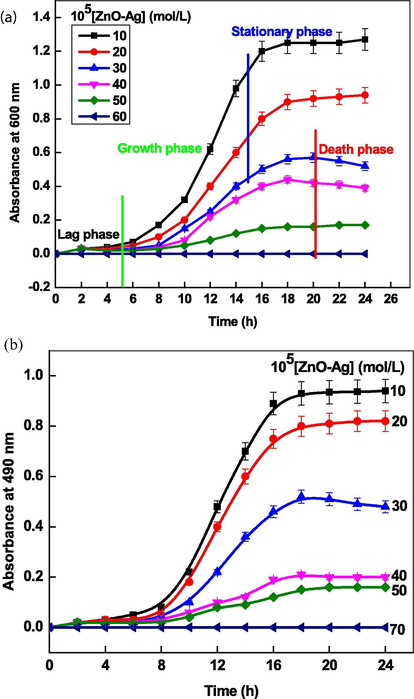
Growth profile of S. arueus (A) and C. albicans strains (B) as a function of ZnO-Ag NPs concentrations at 298 K.
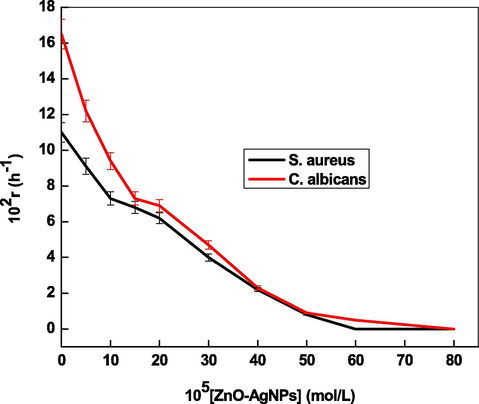
Effect of ZnO-AgNPs concentrations on the bacterial growth rates at 298 K.
Disk-diffusion method was also used to determine the antibacterial and antifungal activities of ZnO-AgNPs against S. aureus and C. albicans human pathogens. Fig. 12 shows that the inhibition zone increases with increasing the concentration of ZnO-AgNPs at fixed concentration of human pathogens (Table 5).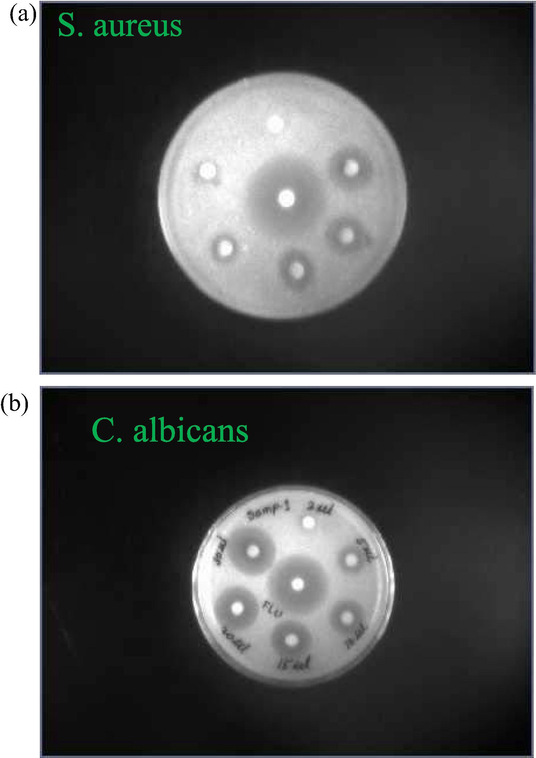
Disk showing the effect of ZnO-AgNPs concentrations on the bacterial growth at 298 K.
It has been reported that the metal ions are essentials for the living organisms and involved in over 40% of enzymatic reactions. Metal ions formed complex with protein, DNA and other ligands present in the human body. Excess of metal ions are toxic, which damaged the structure of protein well wall due to the higher reduction potentials. Proteins are also known as building block and essential for the growth of living organisms (Anastassopoulou and Theophanides, 1995). The AgNPs formed complex with bacterial protein, released Ag+ ions from the surface of AgNPs and changed the membrane permeability due to the strong electron gaining tendency of sulphur (Sondi and Salopek-Sondi, 2004). The Ag+ also oxidized the cysteine (sulphur containing amino acid) and cysteine changes to cystine. On the other hand, ZnONPs kills bacteria due to the generation of reactive oxygen species as well as Zn2+ ions and damaged the mitochondrial activity. The Ag+ ions has strong affinity to coordinates with basic amino group (–NH2) of bacterial cell protein than that of Zn2+ ions. On the other hand, wide optical band gap of ZnO (=2.99 eV) facilitates the generation of reactive oxygen species in the bacterial cell wall. Finally, the activity of ZnO-Ag enhanced significantly due to the work function of both metals (ZnO and Ag) simultaneously (Scheme 4).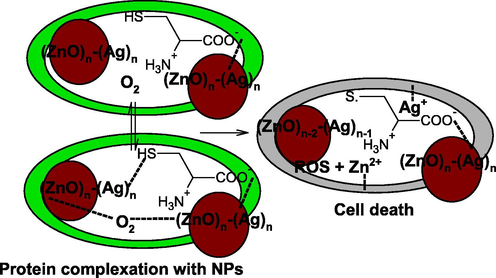
Mechanism of bacterial cell death.
AgNPs formed complex with bacteria cell well proteins and undergoes redox reactions with pH sensitive amine acids. As a results cysteine converted into the cystine (dimer of cysteine) and silver ions were released from the surface of metallic silver due to the oxidative dissolution. The Ag+ ions formed complex with protein cell wall and inhibited their physiological activities. At the same time, ZnO reacts with molecular oxygen and generated various reactive oxygen species, which reacts with protein cell wall and blocked the enzymatic and other biological activities of bacteria cell wall. Mechanism of microbial activities towards metal NPs depends on the standard reduction potential and complex forming tendency of each metals present in the bimetallic NPs, which shows higher antibacterial activities against human pathogens due to the synergistic effect of both metals.
4 Conclusion
Monometallic ZnO and Ag and bimetallic ZnO-AgNPs were prepared by simple hydrothermal, chemical reduction and metal displacement method in presence of CTAB. UV–visible data indicates that the optical properties of ZnO-AgNPs was dominated by the metallic silver. ZnO-AgNPs was used as an adsorbent for the removal of safranin dye. The observed results fitted into Langmuir, Frundlich, Temkin and Dubunin-Radushkevich isotherms out of these Langmuir model has the highest regression value. Temkin and Dubunin-Radushkevich isotherms suggest that the safranin adsorption proceeds through the physisorption dominating chemisorption. The kinetics of safranin adsorption studied by using pseudo-first order, pseudo-second order, intraparticle diffusion and Elovich multilayer models. Microbial activity of Zn, Ag, and ZnO-AgNPs was evaluated with S. aureus and C. albicans human pathogens. ZnO-AgNPs exhibited higher antibacterial activities than that of Zn and Ag NPs.
Acknowledgment
This project was funded by the Deanship of Scientific Research (DSR) at King Abdulaziz University, Jeddah, under grant No. (D-157-247-1441). The authors, therefore, acknowledge with thanks DSR for technical and financial support.
Declaration of Competing Interest
The authors declare that they have no known competing financial interests or personal relationships that could have appeared to influence the work reported in this paper.
References
- Oxidative dissolution of silver nanoparticles: a new theoretical approach. J. Colloid Interface Sci.. 2016;469:355-364.
- [Google Scholar]
- Size-controlled silver nanoparticles synthesized over the range 5–100 nm using the same protocol and their antibacterial efficacy. RSC Adv.. 2014;4:3974-3983.
- [Google Scholar]
- Effect of solution pH, ionic strength, and temperature on adsorption behavior of reactive dyes on activated carbon. Dyes Pigm.. 2008;77:16-23.
- [Google Scholar]
- Protein interactions with silver nanoparticles: Green synthesis, and biophysical approach. Int. J. Biol. Macromol.. 2017;95:421-428.
- [Google Scholar]
- Alzahrani1, S.A., Malik, M.A., Al-Thabaiti, S.A., Khan, Z., 2018. Seedless synthesis and efficient recyclable catalytic activity of Ag@Fe nanocomposites towards methyl orange. Appl. Nanosci. 8, 255–271.
- Anastassopoulou, J., Theophanides, T., 1995. The Role of Metal Ions in Biological Systems and Medicine. Bioinorganic Chemistry, D.P. Kessissoglou (ed.), Kluwer Academic Publishers. pp. 209–218.
- Equilibrium and kinetics studies for the adsorption of direct and acid dyes from aqueous solution by soy meal hull. J. Hazard. Mater.. 2006;B135:171-179.
- [Google Scholar]
- Preparation and characterization of quantum size zinc oxide: A detailed spectroscopic study. J. Phys. Chem.. 1987;91:3789-3798.
- [Google Scholar]
- Enhanced photocatalytic degradation of methylene blue dye, opto-magnetic and antibacterial behaviour of pure and La-doped ZnO nanoparticles. J. Superconductivity Novel Magnetism. 2018;31:855-864.
- [Google Scholar]
- Solvothermal synthesis and enhanced photocatalytic hydrogen production of Bi/Bi2MoO6 co-sensitized TiO2 nanotube arrays. Sep. Purif. Technol.. 2020;250
- [Google Scholar]
- Antibacterial effect of silver nanoparticles and the modeling of bacterial growth kinetics using a modified Gompertz model. BBA. 2015;1850:299-306.
- [Google Scholar]
- One-step facile surface engineering of hydrophobic nanocrystals with designer molecular recognition. J. Am. Chem. Soc.. 2012;134:13164-13167.
- [Google Scholar]
- Synthesis of long-term stable gold nanoparticles benefiting from red raspberry (Rubus idaeus), strawberry (Fragaria ananassa), and blackberry (Rubus fruticosus) extracts-gold ion complexation and investigation of reaction conditions. ACS Omega. 2019;20:18637-18644.
- [Google Scholar]
- Formation of matricaria chamomilla extract-incorporated Ag nanoparticles and size-dependent enhanced antimicrobial property. J. Photochem. Photobiol., B. 2017;174:78-83.
- [Google Scholar]
- Equation of the characteristic curve of activated Charcoal. Chem Zentr. 1947;1:875.
- [Google Scholar]
- Chamomile flower extract-directed CuO nanoparticle formation for its antioxidant and DNA cleavage properties. Mater. Sci. Eng., C. 2016;60:333-338.
- [Google Scholar]
- Hybrid antimicrobial enzyme and silver nanoparticle coatings for medical instruments. ACS Appl. Mater. Interfaces. 2009;1:1553-1560.
- [Google Scholar]
- Elovich, S.Y., Larinov, O.G., 1962. Theory of adsorption from solutions of non electrolytes on solid (I) equation adsorption from solutions and the analysis of its simplest form, (II) verification of the equation of adsorption isotherm from solutions. Izv Akad Nauk SSSR Otd Khim Nauk 2, 209–216.
- Synthesis of ZnO/Au and ZnO/Ag nanoparticles and their photocatalytic application using UV and visible light. RSC Adv.. 2014;4:24962-24972.
- [Google Scholar]
- Removal of safranin dye from aqueous solution using magnetic mesoporous clay: Optimization study. J. Mol. Liq.. 2015;212:675-685.
- [Google Scholar]
- Palladium, silver, and zinc oxide nanoparticles loaded on activated carbon as adsorbent for removal of bromophenol red from aqueous solution. J. Ind. Eng. Chem.. 2013;19:1209-1217.
- [Google Scholar]
- Modeling of competitive ultrasonic assisted removal of the dyes - methylene blue and safranin-O using Fe3O4 nanoparticles. Chem. Eng. J.. 2015;268:28-37.
- [Google Scholar]
- High antifungal activity against candida species of monometallic and bimetallic nanoparticles synthesized in nanoreactors. ACS Biomater. Sci. Eng.. 2018;4:647-653.
- [Google Scholar]
- A nanoscale optical biosensor: Sensitivity and selectivity of an approach based on the localized surface plasmon resonance spectroscopy of triangular silver nanoparticles. J. Am. Chem. Soc.. 2002;124:10596-10604.
- [Google Scholar]
- Colloidal silver nanoparticles: Photochemical preparation and interaction with O2, CCl4, and some metal ions. Chem. Mater.. 1998;10:444-450.
- [Google Scholar]
- Henglein, A., 1997. Nanoclusters of semiconductors and metals. Colloidal nanoparticles of semiconductors and metals: Electronic structure and processes. Ber Bunsenges Phys. Chem. 101, 1562–1569.
- Physicochemical properties of small metal particles in solution: “Microelectrode” reactions, chemisorption, composite metal particles, and the atom-to-metal transition. J. Phys. Chem.. 1993;97:547-5471.
- [Google Scholar]
- Synthesis paradigm and applications of silver nanoparticles (AgNPs), a review. Sustainable Mater. Technol.. 2017;13:18-23.
- [Google Scholar]
- Comparison of zinc oxide nanoparticles and its nano-crystalline particles on the photocatalytic degradation of methylene blue. Mater. Res. Bull.. 2006;41:67-77.
- [Google Scholar]
- CTAB capped synthesis of bioconjugated silver nanoparticles and their enhanced catalytic activities. J. Mol. Liquids. 2018;258:133-141.
- [Google Scholar]
- Betanin assisted synthesis of betanin@silver nanoparticles and their enhanced adsorption and biological activities. Food Chem.. 2019;298 125014
- [Google Scholar]
- Heterogeneous photocatalyst materials for water splitting. Chem. Soc. Rev.. 2009;38:253-278.
- [Google Scholar]
- Langmuir, I., 1916. The constitution and fundamental properties of Solids and Liquids. PART I. Solids. J. Am. Chem. Soc., 38, 2221–2295.
- Worm-like Ag/ZnO core–shell heterostructural composites: fabrication, characterization, and photocatalysis. J. Phys. Chem. C. 2012;116:16182-16190.
- [Google Scholar]
- Ion release kinetics and particle persistence in aqueous nano-silver. Colloids. Environ. Sci. Technol.. 2010;44:2169-2175.
- [Google Scholar]
- Characterization and antibacterial properties of genipin- crosslinked chitosan/poly(ethylene glycol)/ZnO/Ag nanocomposites. Carbohydr. Polym.. 2012;89:111-116.
- [Google Scholar]
- Solvothermal fabrication and construction of highly photoelectrocatalytic TiO2 NTs/Bi2MoO6 heterojunction based on titanium mesh. J. Colloid Interf. Sci.. 2019;556:92-101.
- [Google Scholar]
- Enhanced antibacterial and wound healing activities of microporous chitosan-Ag/ZnO composite dressing. Carbohydr. Polym.. 2017;156:460-469.
- [Google Scholar]
- UV–Visible light induced photocatalytic studies of Cu doped ZnO nanoparticles prepared by co-precipitation method. Sol. Energy. 2014;110:386-397.
- [Google Scholar]
- Galvanic replacement reactions of active-metal nanoparticles. Chem. Eur. J.. 2012;18:4234-4241.
- [Google Scholar]
- Nanotechnology in plant disease management: DNA-directed silver nanoparticles on graphene oxide as an antibacterial against xanthomonas perforans. ACS Nano. 2013;7:8972-8980.
- [Google Scholar]
- DNA-guided metal-nanoparticle formation on graphene oxide surface. Adv. Mater.. 2013;25:2319-2325.
- [Google Scholar]
- ICG-Conjugated magnetic graphene oxide for dual photothermal and photodynamic therapy. RSC Adv.. 2016;6:30285-30292.
- [Google Scholar]
- A green approach for formation of silver nanoparticles on magnetic graphene oxide and highly effective antimicrobial activity and reusability. J. Mol. Liq.. 2017;227:147-152.
- [Google Scholar]
- Green synthesis with incorporated hydrothermal approaches for silver nanoparticles formation and enhanced antimicrobial activity against bacterial and fungal pathogens. J. Mol. Liq.. 2017;227:147-152.
- [Google Scholar]
- Biomolecules incorporated metallic nanoparticles synthesis and their biomedical applications. Mater. Lett.. 2018;212:45-50.
- [Google Scholar]
- Does the antibacterial activity of silver nanoparticles depend on the shape of the nanoparticle? A study of the gram-negative bacterium Escherichia Coli. Appl. Environ. Microbiol.. 2007;73:1712-1720.
- [Google Scholar]
- Quantification of multiple elements in dried blood spot samples. Clin. Biochem.. 2017;50:703-709.
- [Google Scholar]
- Relationship between absorbance spectra and particle size distributions for quantum-sized nanocrystals. J. Phys. Chem. B. 2003;107:10412-10415.
- [Google Scholar]
- Facile synthesis of quasi spherical ZnO nanoparticles with excellent photocatalytic activity. J. Clust. Sci.. 2014;25:1187-1201.
- [Google Scholar]
- Sodium alginate and gum acacia hydrogels of ZnO nanoparticles show wound healing effect on fibroblast cells. Int. J. Biol. Macromol.. 2017;96:185-191.
- [Google Scholar]
- The use of an agricultural waste material, jujuba seeds for the removal of anionic dye (Congo red) from aqueous medium. J. Hazard. Mater.. 2012;203–204:118-127.
- [Google Scholar]
- Solar photocatalytic degradation of azo Dye: Comparison of photocatalytic efficiency of ZnO and TiO2. Sol. Energy Mater. Sol. Cells. 2003;77:65-82.
- [Google Scholar]
- Novel biocompatible composite (Chitosan–zinc oxide nanoparticle): Preparation, characterization and dye adsorption properties. Colloids Surf. B: Biointerfaces. 2010;80:86-93.
- [Google Scholar]
- Comparative study on photocatalytic activity of ZnO prepared by different methods. J. Mol. Liqs.. 2013;181:133-141.
- [Google Scholar]
- Amino acid mediated synthesis of silver nanoparticles and preparation of antimicrobial agar/silver nanoparticles composite films. Carbohydr. Polym.. 2015;130:353-363.
- [Google Scholar]
- Silver nanoparticles: Green synthesis and their antimicrobial activities. Adv. Colloid Interface Sci.. 2009;145:83-96.
- [Google Scholar]
- Organic-capped ZnO nanocrystals: Synthesis and n-type character. J. Am. Chem. Soc.. 2001;123:11651-11654.
- [Google Scholar]
- Photochemical synthesis of ZnO/Ag nanocomposites. J. Nanoparticle Res.. 2007;9:427-440.
- [Google Scholar]
- Review on zinc oxide nanoparticles: Antibacterial activity and toxicity mechanism. Nano-Micro Lett.. 2015;7:219-242.
- [Google Scholar]
- Silver nanoparticles as antimicrobial agent: a case study on E. coli as a model for Gram-negative bacteria. J. Colloid Interface Sci.. 2004;275:177-182.
- [Google Scholar]
- low concentrations of silver- based nanocomposite to manage bacterial spot on tomato in green house. Plant Dis.. 2016;100:1460-1465.
- [Google Scholar]
- Enhanced sunlight photocatalytic performance of Sn-doped ZnO for methylene blue degradation. J. Mol. Catal. A. 2011;335:145-150.
- [Google Scholar]
- Temkin, M.J., Pyzhev, V., 1940. Kinetics of ammonia synthesis on promoted iron catalysts. Acta Physiochim URSS 12, 327–356.
- Molecular recognition of live methicillin-resistant staphylococcus aureus cells using DNA aptamers. World J. Transl. Med.. 2013;2:67-74.
- [Google Scholar]
- Nanometer-sized semiconductor clusters: Materials synthesis, quantum size effects and photophysical properties. J. Phys. Chem.. 1991;95:525-532.
- [Google Scholar]
- CTAB-assisted solvothermal construction of hierarchical Bi2MoO6/Bi5O7Br with improved photocatalytic performances. Sep. Purif. Technol.. 2020;242 116775
- [Google Scholar]
- Morphology regulated Bi2WO6 nanoparticles on TiO2 nanotubes by solvothermal Sb3+ doping as effective photocatalysts for wastewater treatment. Electrochim. Acta. 2020;330 135167
- [Google Scholar]
- Hydrothermal deposition of Cu2O-Ag nanoparticles co-sensitized TiO2 nanotube arrays and their enhanced photoelectrochemical performance. Sep. Purif. Technol.. 2019;211:866-872.
- [Google Scholar]
- Splendid one-dimensional nanostructures of zinc oxide: a new nanomaterial family for nanotechnology. ACS Nano. 2008;2:1987-1992.
- [Google Scholar]
- Visible-light photocatalytic degradation of methylene blue with laser-induced Ag/ZnO nanoparticles. Appl. Surf. Sci.. 2012;258:2796-2801.
- [Google Scholar]
- Treatment of dye wastewater containing acid orange II using a cell with three-phase three-dimensional electrode. Water Res.. 2001;35:4226-4230.
- [Google Scholar]
- Biogenic synthesis, optical, catalytic, and in vitro antimicrobial potential of Ag-nanoparticles prepared using palm date fruit extract. J. Photochem. Photobiolo. B: Biol.. 2018;178:584-592.
- [Google Scholar]
- Adsorption, equilibrium isotherm, and thermodynamic studies to the removal of acid orange 7. Mater. Chem. Phys.. 2019;232:109-120.
- [Google Scholar]
- Adsorption behavior and mechanism of methyl blue on zinc oxide nanoparticles. J. Nanopart. Res.. 2013;15:2034. (10 pages)
- [Google Scholar]
- Controllable Pt/ZnO porous nanocages with improved photocatalytic activity. J. Phys. Chem. C. 2008;112 19620–1962
- [Google Scholar]
- Low temperature synthesis of flowerlike ZnO nanostructures by cetyltrimethylammonium bromide-assisted hydrothermal process. J. Phys. Chem. B. 2004;108:3955-3958.
- [Google Scholar]
- Ag/ZnO heterostructure nanocrystals: synthesis, characterization, and photo catalysis. Inorg. Chem.. 2007;46:6980-6986.
- [Google Scholar]


