

Translate this page into:
Facile fabrication of PF-540-Eu@TOCNF films with hydrophobic and photoluminescent properties
⁎Corresponding author at: College of Chemical and Material Engineering, Quzhou University, Quzhou, Zhejiang 324000, China. liuguoqingmr@126.com (Guoqing Liu)
-
Received: ,
Accepted: ,
This article was originally published by Elsevier and was migrated to Scientific Scholar after the change of Publisher.
Abstract
Based on the biodegradable natural polymer compound TEMPO-oxidized cellulose nanofibrils, and using EuCl3·6H2O, 3-aminopropyltrimethoxysilane and 1H,1H,2H,2H-perfluorooctyltrimethoxysilane as functional reagents, a novel type of cellulose nanofibril composite films with hydrophobic and photoluminescent properties was fabricated by a simple solvothermal method. The effects of reaction time, reaction temperature, Vol.% C2H5OH, solvents dosage, and n (Eu3+: COOH) on the photoluminescence and hydrophobicity of the films were investigated, while the films were characterized by using UV meter, fluorescence spectrometer, contact angle meter, FT-IR, XPS, SEM, EDS, TEM, XRD and TG. The results demonstrate that the surface of the film is uniformly loaded with Eu3+ and emits bright red light under UV irradiation, which has excellent photoluminescence, hydrophobicity (water contact angle 137.6°) and higher thermal stability. And high-value applications of nanocellulose in the fields of bioimaging, anti-counterfeiting and sensing detection in the low-temperature and high-humidity environment will be expanded.
Keywords
TEMPO-oxidized cellulose nanofibrils
Eu3+
Photoluminescence
Hydrophobicity

1 Introduction
With the gradual decrease of petroleum resources and the progressive deterioration of the ecological environment, the rational development and utilization of environment-friendly and renewable resources has become particularly urgent. Cellulose, as a biodegradable, non-polluting and renewable natural polymer, can be processed to produce nanocellulose with a particle size of less than 100 nm by a variety of methods, such as chemical, biological, physical, chemical–mechanical, and electrostatic spinning method (Oleksandr et al., 2016; Youssef et al., 2010). Based on the morphology and size, cellulose nanofibrils can be classified into two main groups (Youssef et al., 2010; Zhai et al., 2022): cellulose nanocrystals (CNC) and cellulose nanofibrils (CNF). Nanocellulose retains the original basic structure and properties of cellulose, and has the characteristics of nanomaterials, such as small size effect, surface effect and other characteristics, which show a very high specific surface area, excellent surface properties, as well as optical, electrical, mechanical and thermal properties (Zhai et al., 2022). Therefore, nanocellulose-based composites have become one of the most important research hotspots in recent years, and have been made into various forms (film, paper, aerogel and hydrogel), which are applied in many fields such as food packaging (Ahankari et al., 2021), energy storage and conductivity (Tümay et al., 2020; Wu et al., 2021), catalysis and adsorption (Luo et al., 2021; Geurds et al., 2021), environmental remediation (Kingshuk et al., 2021), oil–water separation (Mohammed et al., 2021), medical engineering (Ning et al., 2021; Raghav et al., 2021), and many other fields (Yu et al., 2021).
Nanocellulose-based fluorescent materials, as a new type of nanocellulose composites, are considered to be highly promising and environment-friendly fluorescent materials, which replace the traditional fluorescent materials with petroleum-based derivatives as the substrates and have significant research value (Zhai et al., 2022). Nanocellulose fluorescent materials are mainly produced by combining nanocellulose and luminescent materials through physical and chemical methods, which not only have the characteristics of nanocellulose, but also have photoluminescent properties. There are five types, including carbon quantum dots/nanocellulose fluorescent composites (Wu et al., 2019; Yu et al., 2019), fluorescent dyes/nanocellulose fluorescent composites (Otavio et al., 2021; Rana et al., 2021), rare-earth upconversion luminescent nanomaterials/nanocellulose fluorescent composites (Erdman et al., 2016; Fedorov et al., 2019), lanthanide metal complex/nanocellulose fluorescent composites (Skwierczyńska et al., 2019; Zhang et al., 2019), metal–organic framework/nanocellulose fluorescent composites (Wang et al., 2020; Lu et al., 2022; Wang et al., 2022). Nanocellulose fluorescent materials are mainly fabricated by physical doping through hydrogen bonding, van der Waals forces, and adsorption, as well as by chemical modification through in situ synthesis, covalent bonding, and graft polymerization (Zhai et al., 2022; Yao and Wang, 2018; Zhong et al., 2022; Chen et al., 2020), which have been widely used in many fields, such as fluorescent sensors for heavy metal ion detection (Wang et al., 2020; Zhang et al., 2018; Guo et al., 2019), bio-imaging (Rana et al., 2021; Zhang et al., 2020), and medical detection (Julien et al., 2015; Wang et al., 2018). Compared with physical doping method, the nanocellulose fluorescent materials fabricated by chemical modification have better stability and stronger loading of luminescent functional bodies. However, the preparation process is relatively complicated, and meanwhile, nanocellulose has ultra-high hydrophilicity due to the presence of a large number of hydroxyl groups on its surface, which restricts its application in low-temperature, humid and other environments. Therefore, the fabrication of a novel nanocellulose composite with dual functions of fluorescence and hydrophobicity can greatly expand its application field and has significant research value.
To this purpose, a novel method for the fabrication of nanocellulose composite membranes with dual functions of fluorescence and hydrophobicity is herein proposed. 2,2,6,6-tetramethylpiperidine-1-oxyl (TEMPO)-oxidized cellulose nanofibrils (TOCNF) (Zhou et al., 2018) were used as substrates, and the carboxyl groups in the TOCNFs were modified through solvothermal complexation with EuCl3·6H2O to obtain fluorescence. And then the hydroxyl groups in TOCNF were modified with 3-aminopropyltrimethoxysilane and 1H,1H,2H,2H-perfluorooctyltrimethoxysilane as hydrophobic functionalization reagents to obtain hydrophobic properties. Finally, the nanocellulose composite membranes emitting red light under UV excitation and having hydrophobic properties were obtained by filtration, drying and curing. The fabricated nanocellulose composite films have the dual functions of photoluminescence properties and hydrophobicity, which will open up a broader space for the high-value application of nanocellulose in low-temperature and high humidity environments in the fields of bio-imaging, anti-counterfeit signage, and sensor detection.
2 Experimental section
2.1 Reagents
TEMPO-oxidized cellulose nanofibrils (TOCNF, solid content is 1.78 wt% and carboxyl group content is 2.0 mmol/g) were purchased from Jinjiahao Green Nanomaterials Co. Ltd.; C2H5OH (AR) was purchased from Xilong Scientific Company; EuCl3·6H2O (AR), 3-aminopropyltrimethoxysilane (KH540, AR), and 1H,1H,2H,2H-perfluorooctyltrimethoxysilane (PFOTMS, AR) were purchased from Shanghai Macklin Biochemical Technology Co. Ltd.
2.2 Fabrication of hydrophobic and photoluminescent PF-540-Eu@TOCNF films
A certain amount of EuCl3·6H2O was dissolved in a certain volume of C2H5OH-H2O mixed solvents and then added to a three-necked flask, which was heated to a certain temperature with stirring. Meanwhile, 10 g TOCNF was diluted with a certain volume of C2H5OH-H2O mixed solvents and made into a homogeneous TOCNF emulsion using a hand-held homogenizer, which was added dropwise to EuCl3 solution and reacted at a constant temperature for a period of time (Step 1). Then a certain amount of PFOTMS and KH540 were added dropwise for a continuous thermostatic reaction over a period of time (Step 2). After the reaction, the liquid was cooled to room temperature, and then a certain amount of the reaction liquid was vacuum-filtered to form a film, which was then placed in an electro-thermostatic blast oven at 120 °C to dry and cure for 4 h to obtain hydrophobic and photoluminescent PF-540-Eu@TOCNF films. The schematic diagram for the fabrication of hydrophobic and photoluminescent PF-540-Eu@TOCNF films was shown in Scheme 1.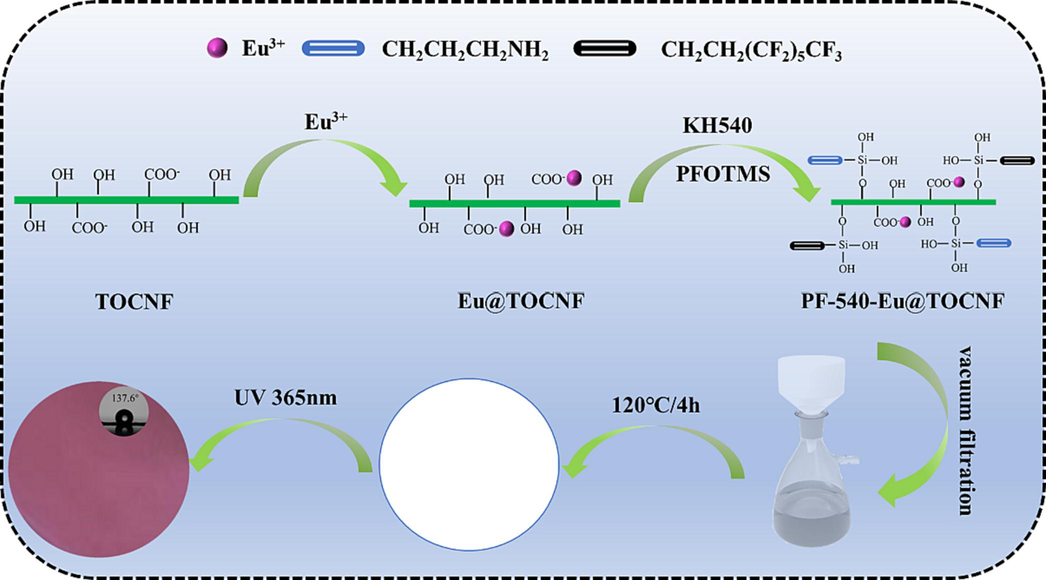
Schematic diagram for the fabrication of hydrophobic and photoluminescent PF-540-Eu@TOCNF films.
2.3 Characterization
The Fourier transform infrared spectra (FTIR-ATR) of samples was tested using an infrared spectrometer (Nicolet Is50, Thermo Fisher Scientific Ltd.) with a wave number range of 4000–400 cm−1, while the resolution is 4 cm−1 and the number of scans is 32; X-ray photoelectron spectroscopy (XPS) was detected using an X-ray photoelectron spectrometer (Thermo SCIENTIFIC ESCALAB 250Xi, Thermo Fisher Scientific Ltd.); X-ray diffraction (XRD) patterns of samples were obtained using an X-ray diffractometer (Smart Lab 9KW of Rigaku) at a scanning speed of 5°/min over a 2θ range of 5-90°; A field emission scanning electron microscope with an energy spectrum detector (FEI-Quanta FEG 250 & EDAX Element)is used to characterize samples for morphology and elemental analysis, while a layer of gold is sputtered on the sample before observation; The ultrastructural features of the samples were observed using a high-resolution transmission electron microscope (JEM-2100 from JEOL, Japan); The thermal stability of samples was examined using a simultaneous thermal analyzer (SDT650 of TA Instruments) in a nitrogen atmosphere at a temperature increase rate of 10 °C/min and over a temperature range of 30 ∼ 600 °C; A fluorescence spectrometer (Hitachi F-4600) was used to obtain emission spectra by scanning the samples in the range of 395–720 nm at an excitation wavelength of 375 nm with a scanning speed of 1200 nm/min; The water contact angle (WCA) of samples was measured using a contact angle tester (DSA30S, Kruss Scientific Instrument Co., Ltd.) with a water droplet volume of 2 μL, and the average value of the WCA was taken as the test result while testing the same sample at three different positions; A simple three-purpose UV analyzer (ZF-1, Shanghai Gucun Electro-Optical Instrument Factory) was used to initially observe the photoluminescence of samples.
3 Results and discussion
3.1 Effect of reaction time on photoluminescence and hydrophobicity of PF-540-Eu@TOCNF films
According to the preparation method of 2.2, the reaction time of the two steps is adjusted to 2 h + 3 h, 3 h + 4 h and 4 h + 5 h with other preparation conditions unchanged, and the photoluminescence and hydrophobicity of samples fabricated are shown in Fig. 1 and Table 1, respectively. As can be seen from Fig. 1, the emission spectra of all the samples shows obvious Eu3+ characteristic emission peaks at 595 nm, 620 nm, and 703 nm, which corresponds to the energy level transition of 5D0→7F1, 5D0→7F2, and 5D0→7F4, respectively. The intensity of the fluorescence produced by the energy level transition of 5D0→7F2 is the strongest, which is the red characteristic fluorescence of Eu3+, and the intensity of which is mainly affected by the coordination environment (Zhao et al., 2019; Canisares et al., 2022; Anuj et al., 2022; Park et al., 2022). There are also relatively weak emission peaks at 582 nm and 655 nm, corresponding to the energy level transition of 5D0→7F0 and 5D0→7F3. The energy level transitions of 5D0→7F1 and 5D0→7F2 are magnetic dipole transition and electric dipole transition, respectively. When Eu3+ is at the asymmetric center, there are both magnetic and electric dipole transitions, but the intensity of the electric dipole transition is significantly greater than the magnetic dipole transition. While Eu3+ is at the symmetric center, there is mainly magnetic dipole transition, and the electric dipole transition is generally not present (Zhao et al., 2019). Thus, the symmetry of Eu3+ can be inferred from the intensity of the magnetic and electric dipole transitions. The intensity of electric dipole transition of all the samples are much greater than that of magnetic dipole transition in Fig. 1, which shows that the Eu3+ is at the asymmetric center. When the reaction time was 3 h + 4 h, the characteristic emission peak of Eu3+ is the strongest. Instead, the intensity of the characteristic emission peak of Eu3+ is weakened when the reaction time is prolonged, which may be related to the phenomenon of fluorescence quenching. As can be seen from Table 1, the highest WCA of sample is 125.1° while the reaction time is 3 h + 4 h. Thus, in summary, 3 h + 4 h is regarded as a more desirable reaction time.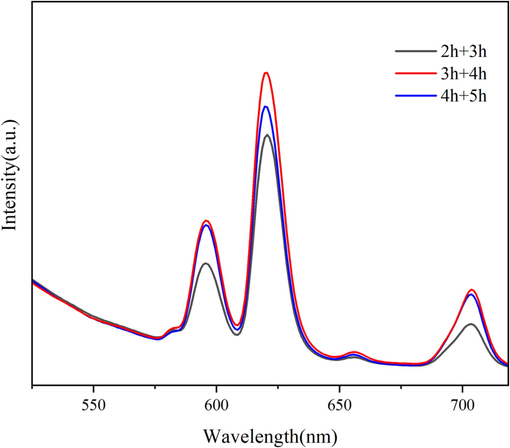
Emission spectra of samples fabricated with different reaction time.
NO.
Step 1 reaction time /h
Step 2 reaction time /h
WCA/°
1
2
3
122.5 ± 0.3
2
3
4
125.1 ± 0.2
3
4
5
118.7 ± 0.3
3.2 Effect of reaction temperature on photoluminescence and hydrophobicity of PF-540-Eu@TOCNF films
According to the preparation method of 2.2, while the reaction time of the two steps is 3 h + 4 h, the reaction temperature is adjusted to 70 °C, 80 °C and 90 °C, and the photoluminescence and hydrophobicity of samples fabricated are shown in Fig. 2 and Table 2, respectively. As can be seen from Fig. 2, the emission spectra of all the samples shows obvious Eu3+ characteristic emission peaks at 582 nm, 595 nm, 620 nm, 655 nm and 703 nm, which corresponds to the energy level transition of 5D0→7F0, 5D0→7F1, 5D0→7F2, 5D0→7F3 and 5D0→7F4, respectively. When the reaction temperature increases from 70 °C to 80 °C, the characteristic emission peak of Eu3+ enhances significantly. While the reaction temperature is raised to 90 °C, the characteristic emission peak at 620 nm does not change significantly, but the characteristic emission peaks at 595 nm and 703 nm weakens instead, which may be related to the phenomenon of fluorescence quenching. It can be seen from Table 2 that the WCA of samples prepared at the reaction temperatures of 70 °C, 80 °C, and 90 °C were 115.5°, 125.1°, and 121.4°, respectively. Therefore, 80 °C is considered to be an ideal reaction temperature.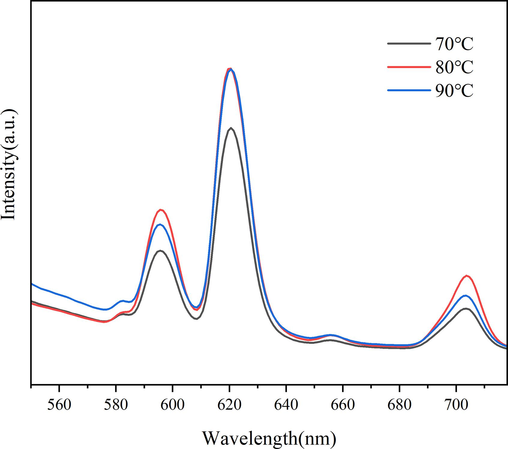
Emission spectra of samples fabricated at different reaction temperature.
NO.
reaction temperature/℃
WCA/°
1
70
115.5 ± 0.4
2
80
125.1 ± 0.2
3
90
121.4 ± 0.2
3.3 Effect of Vol.% C2H5OH of solvents on photoluminescence and hydrophobicity of PF-540-Eu@TOCNF films
According to the preparation method of 2.2, while the reaction time of the two steps is 3 h + 4 h and the reaction temperature is 80 °C, the Vol.% C2H5OH of solvents is adjusted to 0 %, 10 %, 20 %, 30 %, 35 %, and the photoluminescence and hydrophobicity of samples fabricated are shown in Fig. 3 and Table 3, respectively. As can be seen from Fig. 3, the emission spectra of all the samples shows obvious Eu3+ characteristic emission peaks at 582 nm, 595 nm, 620 nm, 655 nm and 703 nm, which corresponds to the energy level transition of 5D0→7F0, 5D0→7F1, 5D0→7F2, 5D0→7F3 and 5D0→7F4, respectively. When Vol.% C2H5OH increases from 0 % to 30 %, the characteristic emission peak of Eu3+ gradually enhances. While the Vol.% C2H5OH increases to 35 %, the characteristic emission peak of Eu3+ weakens instead, which may be related to the phenomenon of fluorescence quenching. It can be seen from Table 3 that the WCA of the sample increases from 118.5° to 127.7° when the Vol.% C2H5OH increases from 0 % to 10 %. While the Vol.% C2H5OH increases further, the WCA of the sample decreases slightly. Therefore, considering the fluorescence and hydrophobicity of the sample, 30 % is considered to be a more desirable Vol.% C2H5OH.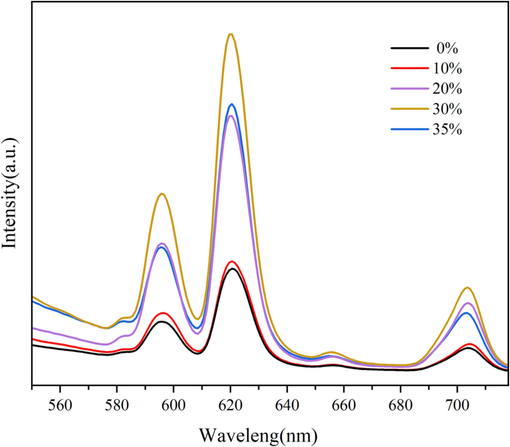
Emission spectra of samples fabricated with different Vol.% C2H5OH.
NO.
Vol.% C2H5OH
WCA/°
1
0
118.5 ± 0.2
2
10
127.7 ± 0.4
3
20
125.1 ± 0.2
4
30
124.8 ± 0.3
5
35
124.3 ± 0.1
3.4 Effect of C2H5OH-H2O mixed solvents dosage on photoluminescence and hydrophobicity of PF-540-Eu@TOCNF films
According to the preparation method of 2.2, while the reaction time of the two steps is 3 h + 4 h, the reaction temperature is 80 °C, and the Vol.% C2H5OH of solvents is 30 %, the C2H5OH-H2O mixed solvents dosage is adjusted to 30, 40, 50, 60, 70 mL, and the photoluminescence and hydrophobicity of samples fabricated are shown in Fig. 4 and Table 4, respectively. As can be seen from Fig. 4, the emission spectra of all the samples shows obvious Eu3+ characteristic emission peaks at 582 nm, 595 nm, 620 nm, 655 nm and 703 nm, which corresponds to the energy level transition of 5D0→7F0, 5D0→7F1, 5D0→7F2, 5D0→7F3 and 5D0→7F4, respectively. When the solvents dosage increases from 30 mL to 60 mL, the characteristic emission peak of Eu3+ gradually enhances. While the solvents dosage increases to 70 mL, the characteristic emission peak of Eu3+ weakens instead, which may be related to the phenomenon of fluorescence quenching. It can be seen from Table 4 that when the solvents dosage increases from 30 mL to 60 mL, the WCA of the sample gradually increases up to 135.7°. And while the solvents dosage increases further, the WCA of the sample decreases greatly. In summary, the solvent effect has a significant impact on the fluorescence and hydrophobicity of the sample. Therefore, 60 mL is considered to be an ideal solvents dosage.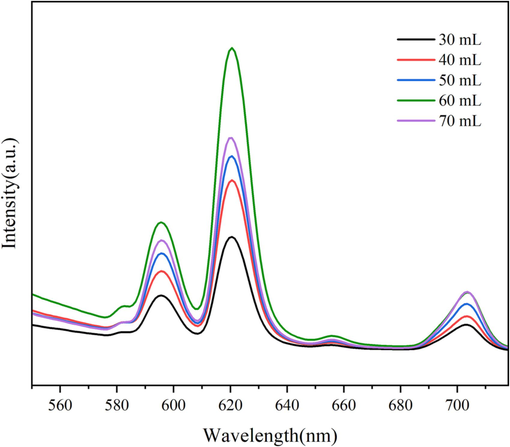
Emission spectra of samples fabricated with different solvents dosage.
NO.
solvents dosage/mL
WCA/°
1
30
100.2 ± 0.5
2
40
104.4 ± 0.6
3
50
111.9 ± 0.5
4
60
135.7 ± 0.3
5
70
124.8 ± 0.3
3.5 Effect of n(Eu3+:COOH) on photoluminescence and hydrophobicity of PF-540-Eu@TOCNF films
According to the preparation method of 2.2, while the reaction time of the two steps is 3 h + 4 h, the reaction temperature is 80 °C, and the Vol.% C2H5OH of solvents is 30 %, the C2H5OH-H2O mixed solvents dosage is 60 mL, the n(Eu3+:COOH) is adjusted to 1:3, 1:2, 1:1, 2:1, 3:1, 4:1, and the photoluminescence and hydrophobicity of samples fabricated are shown in Fig. 5a and Table 5, respectively. As can be seen from Fig. 5a, the emission spectra of all the samples shows obvious Eu3+ characteristic emission peaks at 582 nm, 595 nm, 620 nm, 655 nm and 703 nm, which corresponds to the energy level transition of 5D0→7F0, 5D0→7F1, 5D0→7F2, 5D0→7F3 and 5D0→7F4, respectively. When n(Eu3+:COOH) increases from 1:3 to 3:1, the characteristic emission peak of Eu3+ gradually enhances. While n(Eu3+:COOH) increases to 4:1, the characteristic emission peak of Eu3+ weakens instead, which may be related to the phenomenon of fluorescence quenching. It can be seen from Table 5 that when n(Eu3+:COOH) increases from 1:3 to 1:2, the WCA of the sample increases significantly, from 128.4° to 135.3°. And while the n(Eu3+:COOH) increases further, the WCA of the sample does not change much and the maximum WCA is 137.6°. In summary, compared with the effect on the hydrophobicity, the effect of the amount of Eu3+ on the photoluminescence of sample is more significant. Therefore, 3:1 is considered to be a more desirable n(Eu3+:COOH). The sample prepared under this desirable condition is analyzed through the detection methods in 2.3, and the photoluminescence illuminated by a three-purpose UV analyzer at 365 nm and WCA diagram of the sample are shown in Fig. 5b.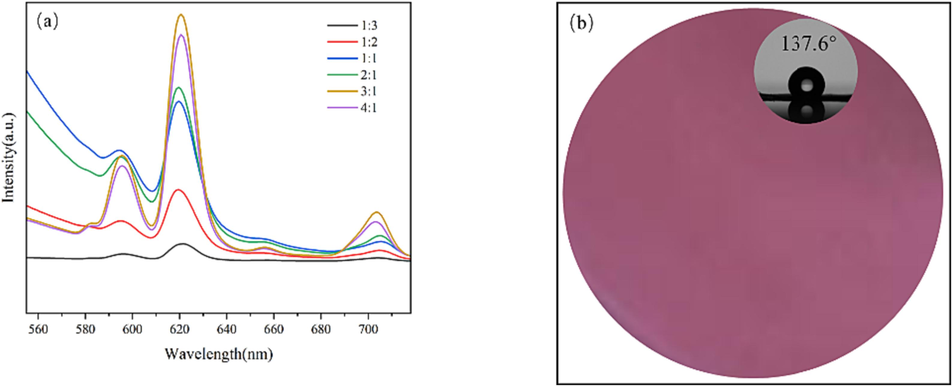
Emission spectra of samples fabricated with different n (Eu3+: COOH) (a) and photoluminescence and WCA diagram (b).
NO.
n (Eu3+: COOH)
WCA/°
1
1:3
128.4 ± 0.4
2
1:2
135.3 ± 0.5
3
1:1
135.5 ± 0.3
4
2:1
136.1 ± 0.2
5
3:1
137.6 ± 0.2
6
4:1
135.7 ± 0.3
3.6 FT-IR spectra analysis
The structural changes in the functional groups of TOCNF and PF-540-Eu@TOCNF are characterized by infrared spectroscopy, and the results are shown in Fig. 6. It can be seen from Fig. 6 that the FT-IR spectra of TOCNF and PF-540-Eu@TOCNF have obvious differences. The FT-IR spectra of TOCNF shows a characteristic peak of –OH stretching vibration at 3335 cm−1, characteristic peaks of stretching vibration of carbonyl group in carboxylate and carboxylate at 1600 cm−1 and 1753 cm−1, respectively (Wang et al., 2020), and an absorption peak of C—O—C stretching vibration at 1016 cm−1 (Zuo et al., 2019), in which the characteristic peaks between 1600 cm−1 and 1016 cm−1 are mainly attributed to the stretching vibration of C—OH, C—C and the bending vibration of —OH, C—H (Le et al., 2016). While the FT-IR spectra of PF-540-Eu@TOCNF shows a significant weakening of the —OH stretching vibration peak at 3335 cm−1, which suggests that the —OH in TOCNF undergoes a chemical reaction. In addition, the C—O—C stretching vibration absorption peak blue-shifts from 1016 cm−1 to 1050 cm−1, which is mainly due to the introduction of electron-withdrawing fluorinated group to reduce the electron density of the TOCNF framework (Liu et al., 2022). Meanwhile, due to the complexation and synergy between Eu3+ and —COOH (Wang et al., 2020; Wang et al., 2020), the characteristic stretching vibration peak of carbonyl group in the carboxyl group red-shifts from 1753 cm−1 to 1740 cm−1, and the characteristic peak of EuOOC appears at 895 cm−1 and 418 cm−1. The characteristic peaks in the range of 1050–1600 cm−1 are attributed to the stretching vibration of CF2 and CF3 (Gao et al., 2020), which partially overlap with the characteristic peaks of TOCNF. The emerging characteristic peaks in the range of 564–845 cm−1 are mainly attributed to the stretching vibration of Si—C and Si—O—C (Jiang et al., 2021). The above results indicate that Eu3+ successfully complexes on the free carboxyl groups of TOCNF while PFOTMS and KH540 successfully modify the hydroxyl groups of TOCNF.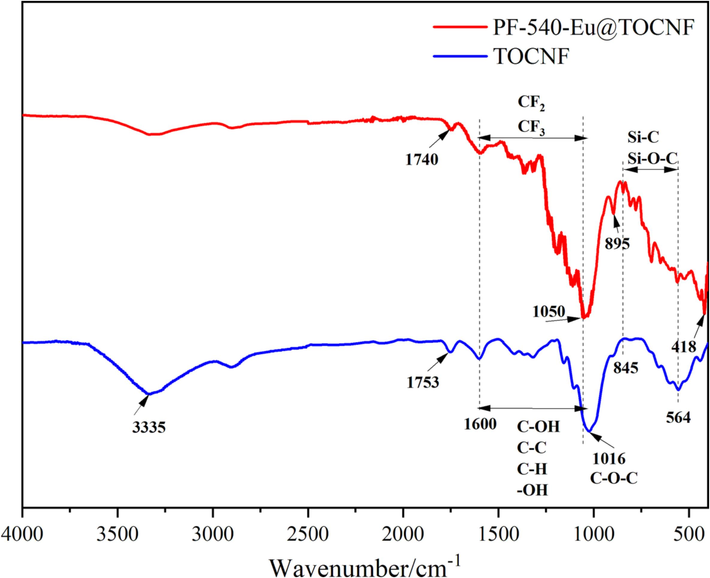
FT-IR spectra of PF-540-Eu@TOCNF and TOCNF.
3.7 EDS and XPS analysis
The chemical element composition of the sample is characterized by EDS and XPS, and the results are shown in Fig. 7. The EDS spectrum (Fig. 7a) shows characteristic peaks of C, N, F, Si, and Eu, and the weight%, atomic% of the elements, which indicates that the prepared sample is mainly composed of C, N, F, Si, Eu. The XPS spectra of TOCNF and PF-540-Eu@TOCNF (Fig. 7b) shows that PF-540-Eu@TOCNF has emerging characteristic peaks of Eu3d3, Eu3d5, F1s, Si2s, and Si2p at the binding energies of 1165ev, 1135ev, 688ev, 154ev, and 103ev, respectively. Fig. 7c, d, e, and f show the high-resolution XPS spectra of Eu3d, C1s, Si2p, and O1s, respectively. The five characteristic peaks at 292.8ev, 290.6ev, 289.3ev, 285.2ev, 284.2ev in Fig. 7d are attributed to CF3, CF2, C⚌O, C—O, C—C/C—Si/C—H (Piłkowski et al., 2021; Chen et al., 2021). The two characteristic peaks at 102.7ev, 102.0ev in Fig. 7e are attributed to Si—O, Si—C (Liu et al., 2022). The three characteristic peaks at 533ev, 532ev, 531ev in Fig. 7f are attributed to C—O/C—O—C, C⚌O/Si—O, EuOOC (Wang et al., 2020). The above results further indicates that Eu3+ successfully complexes on the site provided by the free carboxyl group of TOCNF, while PFOTMS and KH540 also successfully modify the hydroxyl groups of TOCNF.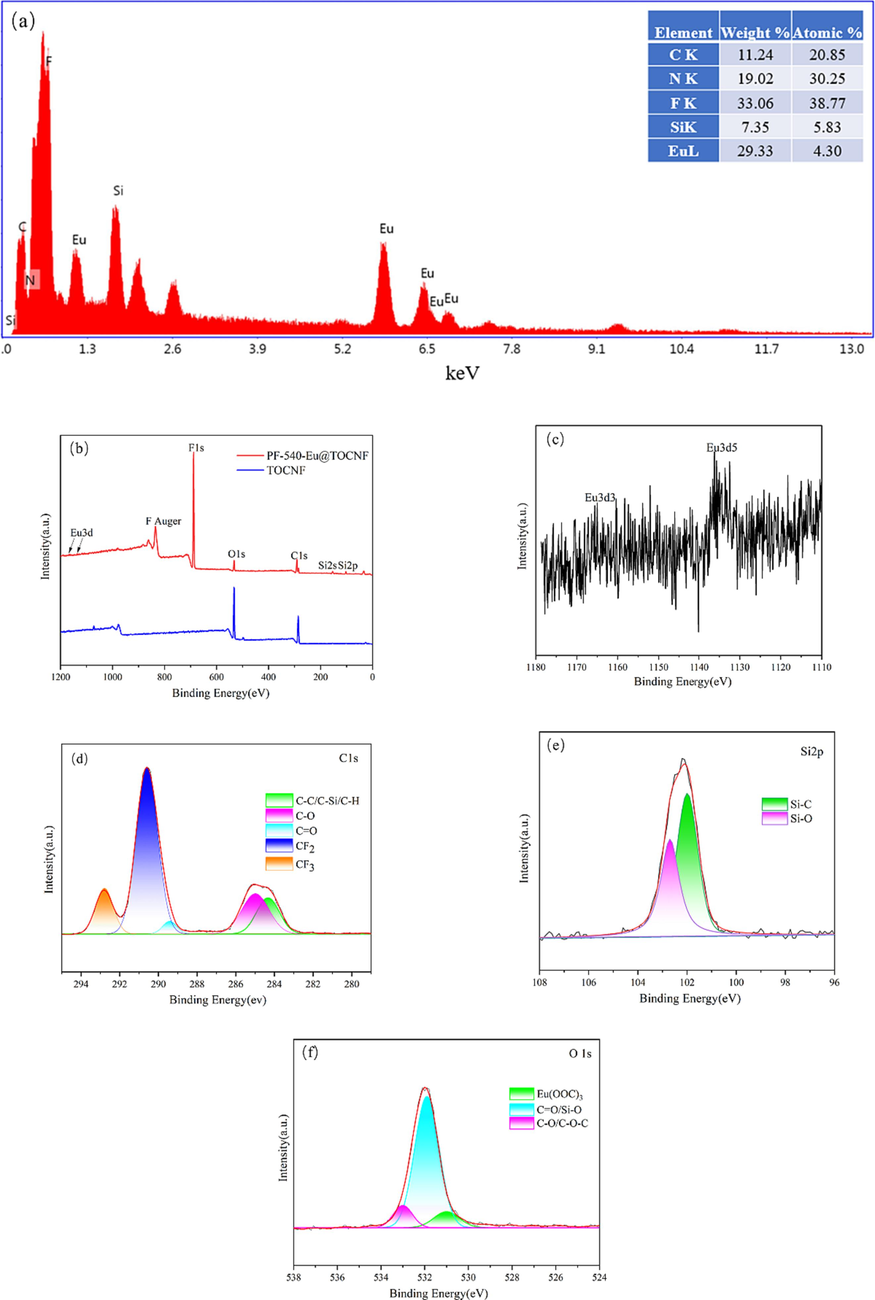
EDS spectrum(a), XPS spectra of TOCNF and PF-540-Eu@TOCNF (b), high-resolution XPS spectra of Eu3d (c), C1s (d), Si2p (e), O1s (f).
3.8 XRD analysis
The crystal structure changes of TOCNF and PF-540-Eu@TOCNF are characterized by an X-ray diffractometer and the results are shown in Fig. 8. It can be seen from Fig. 8 that TOCNF has characteristic diffraction peaks at 2θ = 15.26° (crystalline plane 110) and 22.63° (crystalline plane 200) (Feng and Hsieh, 2016; Zhou et al., 2023). PF-540-Eu@TOCNF has a new characteristic diffraction peak at 2θ = 7.25°, which is the characteristic peak of EuOOC (Wang et al., 2020). While the characteristic diffraction peaks at 2θ = 15.26° and 22.63° have a certain degree of weakening, which is mainly due to the in situ growth of Eu3+ on the carboxyl groups of TOCNF and the cross-linking reaction of PFOTMS and KH540 with TOCNF.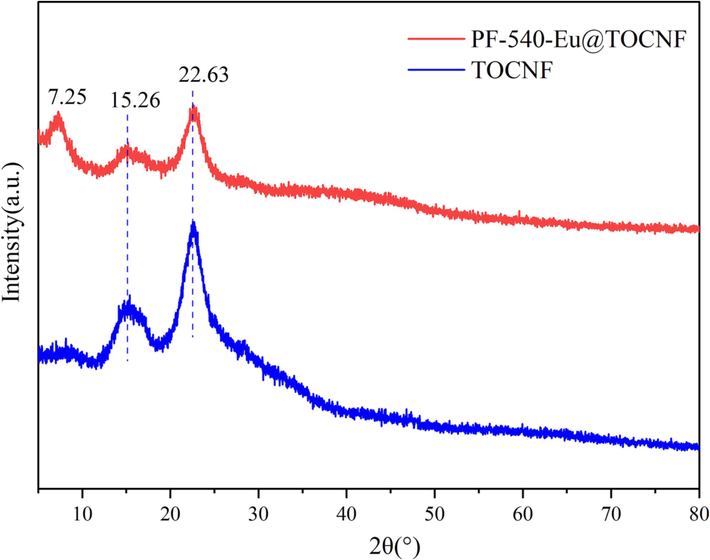
XRD patterns of PF-540-Eu@TOCNF and TOCNF.
3.9 SEM and TEM analysis
The surface microscopic morphology of TOCNF and PF-540-Eu@TOCNF is characterized by scanning electron microscopy, and the results are shown in Fig. 9a/b. The SEM image (Fig. 9a) of TOCNF shows a flat and smooth surface, while the SEM image (Fig. 9b) of PF-540-Eu@TOCNF shows a large number of uniformly distributed nanoparticles (Eu), forming a rough surface with micro-nano structure, and meanwhile, due to the low surface energy modification of TOCNF by PFOTMS and KH540, which both ensure good hydrophobicity of PF-540-Eu@TOCNF. The ultrastructure of TOCNF and PF-540-Eu@TOCNF is further characterized by transmission electron microscopy, and the results are shown in Fig. 9c/d, e/f. The TEM images (Fig. 9c/d) of TOCNF are still smooth and flat. The TEM image (Fig. 9e) of PF-540-Eu@TOCNF shows a large number of uniform nanoparticles, and Fig. 9f shows obvious lattice fringes with a crystal plane spacing of 0.313–0.315 nm, which is 110 crystal plane of Eu (JCPDS:02–0501). The above results show that it is precisely because of the site-complexation effect between Eu3+ and carboxyl groups on TOCNF that the agglomeration phenomenon of physical doping can be effectively avoided to obtain PF-540-Eu@TOCNF film with uniform Eu loading on the surface.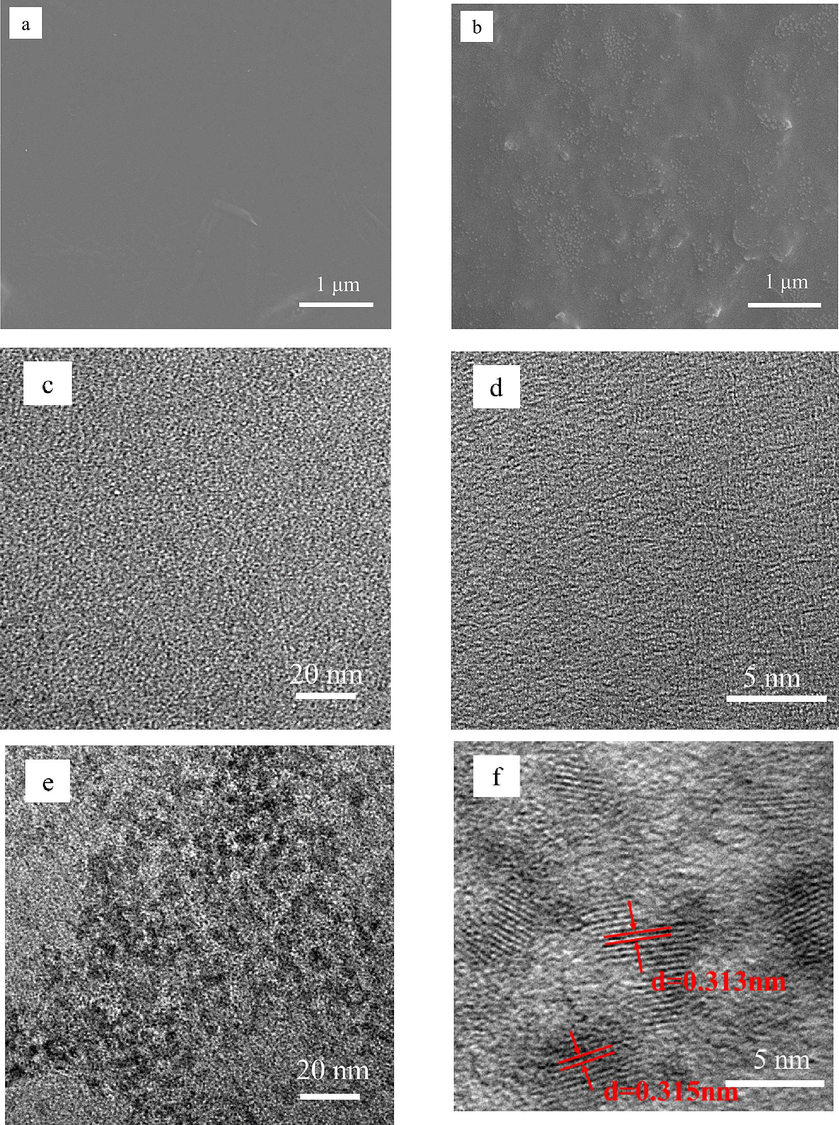
SEM images of TOCNF (a) and PF-540-Eu@TOCNF (b), TEM images of TOCNF (c/d) and PF-540-Eu@TOCNF (e/f).
3.10 TG analysis
The thermal stability of TOCNF and PF-540-Eu@TOCNF is characterized by a thermogravimetric analyzer, and the results are shown in Fig. 10. As can be seen from the TG curves (Fig. 10 a), the thermal decomposition process of PF-540-Eu@TOCN and TOCNF is divided into initial thermal decomposition, rapid thermal decomposition and slow thermal decomposition. The initial rapid thermal decomposition temperature and residual rate of PF-540-Eu@TOCN are higher than that of TOCNF. DTG curves (Fig. 10b) shows that there are two weight loss peaks of TOCNF, corresponding to the maximum weight loss rate temperatures of 246 °C and 315 °C, respectively, while PF-540-Eu@TOCNF has three weight loss peaks, corresponding to the maximum weight loss rate temperatures of 305 °C, 393 °C, and 490 °C, respectively. The maximum weight loss rate temperatures of PF-540-Eu@TOCNF increase significantly, and there was still a rapid thermal decomposition process after 450 °C. These results above indicate that the thermal stability of PF-540-Eu@TOCNF is higher than that of TOCNF.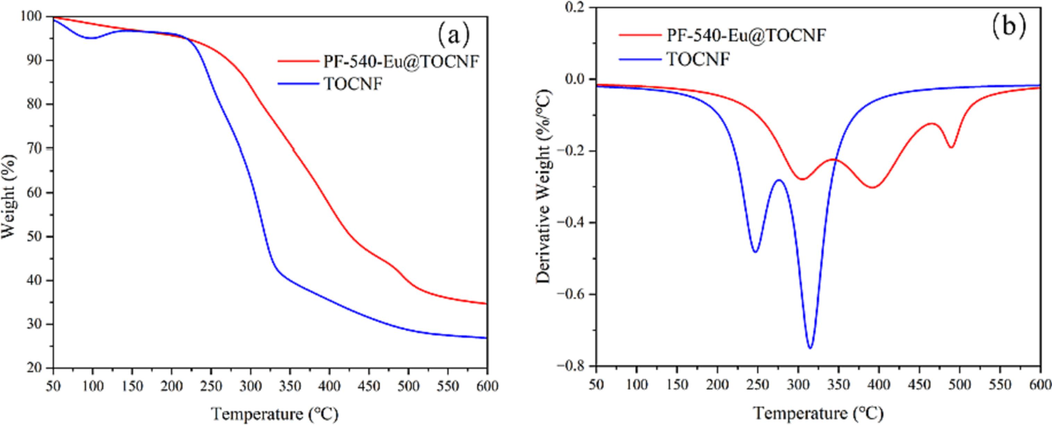
TG (a) and DTG (b) of PF-540-Eu@TOCNF and TOCNF.
4 Conclusion
In summary, a kind of novel hydrophobic and photoluminescent cellulose nanofibril films were successfully fabricated by a simple solvothermal method using TOCNF as the substrate, EuCl3·6H2O, PFOTMS and KH540 as the functional reagents, and ethanol–water as the solvent. The effects of reaction time, reaction temperature, Vol.% C2H5OH, solvents dosage, and n(Eu3+:COOH) on the photoluminescence and hydrophobicity of materials were studied, and the more desirable experimental conditions were finally determined to be as follows, reaction time (3 h + 4 h), reaction temperature (80 °C), Vol.% C2H5OH (30 %), solvents dosage (60 mL), and n(Eu3+:COOH) = 3:1. The materials prepared in the work have excellent photoluminescence and hydrophobicity (WCA 137.6°), and also have higher thermal stability. Taking advantage of the excellent properties of the materials, we can develop more high-tech technologies such as biological imaging, anti-counterfeiting and sensing detection that are applicable to low-temperature and humid environments, which will be of great significance.
Acknowledgments
This work was supported by Basic Public Welfare Research Project of Zhejiang Province (LGG21B060001).
Declaration of competing interest
The authors declare that they have no known competing financial interests or personal relationships that could have appeared to influence the work reported in this paper.
References
- Red emissive ternary europium complexes: synthesis, optical, and luminescence characteristics. Luminescence. 2022;37(8):1309-1320.
- [Google Scholar]
- Luminescence and cytotoxic study of red emissive europium(III) complex as a cell dye. J. Photoch. Photobio. A.. 2022;422:113552
- [Google Scholar]
- Research progress of biomass-based optical materials. J. Forestry Eng.. 2020;5(3):1-12.
- [Google Scholar]
- Feasibility study of dielectric barrier discharge jet-patterned perfluorodecyltrichlorosilane-coated paper for biochemical diagnosis. ECS J. Solid State SC.. 2021;10:037005
- [Google Scholar]
- Preparation of multicolor luminescent cellulose fibers containing lanthanide doped inorganic nanomaterials. J. Lumin.. 2016;169:520-527.
- [Google Scholar]
- Composite up-conversion luminescent films containing a nano-cellulose and SrF2: Ho particle. Cellul.. 2019;26:2403-2423.
- [Google Scholar]
- Self-assembling of TEMPO oxidized cellulose nanofibrils as affected by protonation of surface carboxyls and drying methods. ACS Sustain. Chem. Eng.. 2016;4(3):1041-1049.
- [Google Scholar]
- Preparation and characterization of hydrophobic cellulose nanofibril aerogels. J. Funct. Mater.. 2020;51(2):02107-02112.
- [Google Scholar]
- Tailored nanocellulose-grafted polymer brush applications. J. Mater. Chem. A. 2021;9(32):17173-17188.
- [Google Scholar]
- A novel fluorescent nanocellulosic hydrogel based on carbon dots for efficient adsorption and sensitive sensing in heavy metals. J. Mater. Chem. A. 2019;7(47):27081-27088.
- [Google Scholar]
- Preparation of the temperature-responsive superhydrophobic paper with high stability. ACS Omega. 2021;6:16016-16028.
- [Google Scholar]
- Multicolor fluorescent labeling of cellulose nanofibrils by click chemistry. Biomacromolecules. 2015;16(4):1293-1300.
- [Google Scholar]
- A review of nanocellulose as a new material towards environmental sustainability. Sci. Total Environ.. 2021;775:145871
- [Google Scholar]
- Preparing hydrophobic nanocellulose-silica film by a facile one-pot method. Carbohyd. Polym.. 2016;153:266-274.
- [Google Scholar]
- Facile preparation and properties of superhydrophobic nanocellulose membrane. Arab. J. Chem.. 2022;15:103964
- [Google Scholar]
- Recent advances in metal organic framework and cellulose nanomaterial composites. Coordin. Chem. Rev.. 2022;461:214496
- [Google Scholar]
- Wood-derived nanocellulose hydrogel incorporating gold nanoclusters using in situ multistep reactions for efficient sorption and sensitive detection of mercury ion. Ind. Crops. Prod.. 2021;173:114142
- [Google Scholar]
- Selective adsorption and separation of organic dyes using functionalized cellulose nanocrystals. Chem. Eng. J.. 2021;417:129237
- [Google Scholar]
- Polydopamine loaded fluorescent nanocellulose–agarose hydrogel: a pH-responsive drug delivery carrier for cancer therapy. Compos. Commun.. 2021;26:100739
- [Google Scholar]
- Production of cellulose nanofibrils: a review of recent advances. Ind. Crop. Prod.. 2016;93:2-25.
- [Google Scholar]
- One-pot fabrication of flexible and luminescent nanofilm by in-situ radical polymerization of vinyl carbazole on nanofibrillated cellulose. Carbohyd. Polym.. 2021;262(1):117934
- [Google Scholar]
- Red-Emitting latex nanoparticles by stepwise entrapment of β-diketonate europium complexes. Int. J. Mol. Sci.. 2022;23(24):15954.
- [Google Scholar]
- Environmental testing of hydrophobic fluorosilane-modified substrates. Surf. Interfaces. 2021;23:100987
- [Google Scholar]
- Nanocellulose: a mini-review on types and use in drug delivery systems. Carbohydr. Polym. Technol. Appl.. 2021;2:100031
- [Google Scholar]
- Cellulose nanocrystals: pretreatments, preparation strategies, and surface functionalization. Int. J. Biol. Macromol.. 2021;182:1554-1581.
- [Google Scholar]
- Modification of cellulose fibers with inorganic luminescent nano-particles based on lanthanide(III) ions. Carbohydr. Polym.. 2019;206:742-748.
- [Google Scholar]
- Fluorescence determination of trace level of cadmium with pyrene modified nanocrystalline cellulose in food and soil samples. Food Chem. Toxicol.. 2020;146:111847
- [Google Scholar]
- All-biomass fluorescent hydrogels based on biomass carbon dots and alginate/nanocellulose for biosensing. ACS Appl. Bio Mater.. 2018;1(5):1398-1407.
- [Google Scholar]
- Eu-metal organic framework @TEMPO-oxidized cellulose nanofibrils photoluminescence film for detecting copper ions. Carbohydr. Polym.. 2020;236:116030
- [Google Scholar]
- Research progress on metal-organic framework/cellulose composite. Trans. China Pulp Paper. 2022;37(1):104-110.
- [Google Scholar]
- Facile fabrication of superhydrophobic and photoluminescent TEMPO-oxidized cellulose-based paper for anticounterfeiting application. ACS Sustainable Chem. Eng.. 2020;8(35):13176-13184.
- [Google Scholar]
- A thermally engineered polydopamine and bacterial nanocellulose bilayer membrane for photothermal membrane distillation with bactericidal capability. Nano Energy. 2021;79:105353
- [Google Scholar]
- Fluorescent aerogels based on chemical crosslinking between nanocellulose and carbon dots for optical sensor. ACS Appl. Mater. Interfaces. 2019;11(17):16048-16058.
- [Google Scholar]
- Research progress of cellulose self-assembly materials. Chem. Ind. Eng. Prog.. 2018;37(2):599-609.
- [Google Scholar]
- Cellulose nanocrystals: chemistry, self-assembly, and applications. Chem. Rev.. 2010;110(6):3479-3500.
- [Google Scholar]
- Fluorescent spherical sponge cellulose sensors for highly selective and semiquantitative visual analysis: detection of Hg2+ and Cu2+ ions. ACS Sustain. Chem. Eng.. 2019;7(23):19157-19166.
- [Google Scholar]
- Nanocellulose from various biomass wastes: its preparation and potential usages towards the high value-added products. Environ. Sci. Ecotechnol.. 2021;5:100077
- [Google Scholar]
- Nanocellulose: a promising nanomaterial for fabricating fluorescent composites. Cellulose. 2022;29:7011-7035.
- [Google Scholar]
- Optical haze nanopaper enhanced ultraviolet harvesting for direct soft-fluorescent emission based on lanthanide complex assembly and oxidized cellulose nanofibrils. ACS Sustain. Chem. Eng.. 2019;7(11):9966-9975.
- [Google Scholar]
- Design and synthesis of fluorescent nanocelluloses for sensing and bioimaging applications. ChemPlusChem. 2020;85(3):487-502.
- [Google Scholar]
- Fabrication of fluorescent cellulose nanocrystal via controllable chemical modification towards selective and quantitative detection of Cu (II) ion. Cellulose. 2018;25:5831-5842.
- [Google Scholar]
- Facile fabrication of thermal stable Eu(HCOO)3 red-emitting crystals with high color purity for near-ultraviolet chip triggered white light-emitting diodes. J. Lumin.. 2019;213:409-414.
- [Google Scholar]
- Research progress of nanocellulose-based luminescent materials. Acta Materiae Compositae Sinica. 2022;39(1):39-47.
- [Google Scholar]
- The synthesis and properties of PANI/(TOCNF-SMWCNT) supercapacitor electrode materials by in situ polymerization. J. Disper. Sci. Technol.. 2023;44(8):1516-1525.
- [Google Scholar]
- A study on the transmission haze and mechanical properties of highly transparent paper with different fiber species. Cellulose. 2018;25(3):2051-2061.
- [Google Scholar]
- Superamphiphobic nanocellulose aerogels loaded with silica nanoparticles. Cellulose. 2019;26:9661-9671.
- [Google Scholar]


