

Translate this page into:
Facile one-pot green solvent synergized fluorescence reaction for determination of doxorubicin in presence of paclitaxel; co-administered drug, application to stability study and analysis in bulk, vial and biological fluids
⁎Corresponding author. ahmedabdulhafezhamad@yahoo.com (Ahmed A. Hamad)
-
Received: ,
Accepted: ,
This article was originally published by Elsevier and was migrated to Scientific Scholar after the change of Publisher.
Peer review under responsibility of King Saud University.
Abstract
A green, fast, simple, economical, ultra-sensitive and accurate spectrofluorimetric method was described in the article for the estimation of Doxorubicin hydrochloride (DOX), a type II topoisomerase enzyme inhibitor either alone and in the presence of co- administered drug; paclitaxel as adjuvant chemotherapy combination in bulk, pharmaceutical dosage form and biological fluids. The proposed method was based on studying the fluorescence demeanor of DOX in different organized media and solvents. The intrinsic fluorescence was found to be greatly enhanced in acidic ethanolic solution. The maximum intensity of fluorescence was observed at 590 nm after excitation at 475 nm. Different experimental parameters were examined and adjusted involving various organized media, solvent, and pH. The methods was validated according to ICH guidelines. The linearity of the method was accomplished in the range of 7 × 10⁻⁴–4.0 µg ml−1. The values of LOD and LOQ were 0.2 and 0.6 ng ml−1 respectively. The present method is extremely sensitive enough for determination of traces of the drug in various biological fluids with excellent % recovery. The proposed method was extended to investigate the stability of DOX following various induced degradation protocols including: acidic, alkaline, oxidative and photolytic. In addition, the kinetics of the degradation of DOX was investigated and the apparent first-order rate constant, half-life times and Quantum yield were calculated.
Keywords
Fluorescence
Doxorubicin
Paclitaxel
Stability study
Biological fluids
Eco-scale

1 Introduction
Doxorubicin (DOX, Fig. 1) is a cytotoxic anthracycline antibiotic isolated from fungus Streptomyces peucetius var. caesius cultures. It is widely used in cancer therapy for different types of testicular cancer, leukemia, Ewing’s sarcoma, Hodgkin’s disease, Kaposi’s sarcoma hematological malignancies, many types of carcinomas, breast cancer and soft tissue sarcomas (Jouyban et al., 2019). Chemically, DOX is: 5,12-Naphthacenedione,10- [(3-amino-2, 3, 6-trideoxy-a-Llyxo-hexopyranosyl) oxy]-7, 8, 9, 10-tetrahydro-6, 8, 11-trihydroxy −8-(hydroxyacetyl)-1-methoxy, hydrochloride and is official in the United States Pharmacopoeia (Sastry and Rao, 1996). DOX act pharmacologically by intercalation of the anthracycline moiety into the DNA double helix, resulting in inhibition of replication and transcription of DNA in cancer cells, this inhibits the progression of topoisomerase II, an enzyme which relaxes supercoils in DNA for transcription, Doxorubicin stabilizes the topoisomerase II complex after it has broken the DNA chain for replication, hindering the release of DNA double helix, and thereby preventing the replication process. (Guo et al., 2011; Pommier et al., 2010; Tacar et al., 2013). Although DOX has acquired wide clinical uses in anticancer chemotherapy, its clinical application is slenderly due to cardio toxicity dose-dependent, myelosuppression and drug resistance development. Anthracyclines and taxanes are the most effective drugs in the treatment of some solid tumors, with the purpose of enhancing the outcomes accomplished with each agent Among these combination, paclitaxel and doxorubicin are most frequently used, The different drug action mechanism provides synergism of combination of the two drugs Actually, paclitaxel and doxorubicin combination was a favorable and active regimen in the first-line treatment of many solid tumors. Moreover, for surgically unresectable cancers, systemic combination chemotherapy is the only option for patients (Wang et al., 2014). From the above, monitoring of DOX during treatment is necessary to cure patients (Li et al., 2016; Xu et al., 2017). Therefore, it is of particular importance to determine quantitatively DOX for both drug analysis and clinical assay.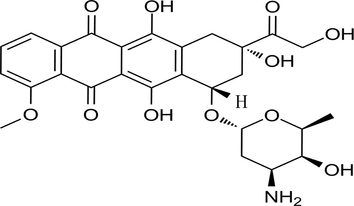
Chemical structure of the investigated drug; DOX.
Literature survey revealed several methods concerned with analysis of DOX in bulk or in pharmaceutical preparations. Different techniques were published mostly high performance liquid chromatography (HPLC) (Al-Abd et al., 2009; Hofer et al., 2006; Ahmed et al., 2009). In addition, capillary electrophoresis (CE) (Deng et al., 2011; Lu et al., 2009), chemiluminescence (CL) (Yao et al., 2013; Amjadi and Jalili, 2016; Iranifam, 2014), electrochemistry (Guo et al., 2011; Fei et al., 2009; Ghanbari and Norouzi, 2020), immunoassay (Liang et al., 2018; Hu et al., 2006), nanoparticles strategy (Souto et al., 2016; Pérez-López and Merkoçi, 2011) were also reported in the literature. However, few spectral methods were reported including spectrophotometry (Sastry and Rao, 1996; Manasa et al., 2013) and Raman scattering methods (Yan et al., 1997; Eliasson et al., 2001; Lee et al., 2015). Most of these spectral methods suffered from low sensitivity and bad specificity. It is notable that chromatographic strategies require huge volumes of organic solvents of high grade of purity, devour long time in sample preparation, use complex instrument and in some cases need very costly detectors. Although spectrofluorimetric methods have enhanced selectivity, inherent simplicity in operation and sample preparation and high sensitivity, no spectrofluorimetric methods was reported concerning the determination of DOX; anthracycline agent in presence of paclitaxel; a diterpene taxane chemotherapeutic agent. It is therefore of the utmost importance to develop further fast, sensitive, specific and simple and still profoundly touchy logical procedure for the determination of DOX. This objective could be achieved through utilizing spectrofluorimetric strategy after enhancement of the original very weak fluorescence of DOX through studying the influence of different solvents and/or micellar media. The present method is considered the first simple spectrofluorimetric method for DOX determination. The proposed method is completely validated according to ICH guidelines (Guideline, 2005), and successfully applied for rapid determination of DOX in pharmaceutical dosage form and biological fluids (human plasma and urine) without requiring tedious sample pretreatment, and there was no interference from excipients or plasma components. In addition, the procedure of the proposed method is green since the use of toxic reagent or organic solvent was expunged. Moreover, the drug was subjected to different hard conditions such as alkaline, acidic, oxidative and photolytic degradation and the proposed method was employed to explore the intrinsic stability of DOX under these conditions. Furthermore, the kinetics of the alkaline and oxidative degradations was studied.
2 Experimental
2.1 Apparatus
A SCINCO Fluorescence spectrometer (FS-2, Korea), equipped with 150 W Xe-arc lamp, PMT detector for excitation & emission and 1 cm matched quartz cells was used for spectrofluorimetric measurements (slit widths adjusted at 10 nm).
MLW type thermostatically controlled water bath (Memmert GmbH, Schwabach, Germany) was used for heating purposes. All weighing were performed on an electronic single pan balance (Precisa XB 220A, Switzerland). Distilled water was prepared by water distiller (TYUMEN-MIDI-A0-25 MO, Russia). Super-mixer (GEMMY industrial CORD, Taiwan, R.O.C), pH-meter, model AD11P (Adwa, Romania), bath sonicator (SONICOR SC-101TH) and laboratory centrifuge (Bremsen ECCO, Germany) were also used.
2.2 Chemicals and materials
All chemicals and reagents used during this work were of analytical grade. DOX and PTX were obtained from Hikma specialized pharmaceutical (Badr City, Cairo, Egypt). Tween-80 (prepared as 1% v/v aqueous solution), sodium carboxymethyl cellulose (CMC Na, as 1% w/v), sodium dodecyl sulphate (SDS, as 1.0% w/v), β-cyclodextrine (β-CD, as 1.0% w/v), polyethylene glycol 400 (PEG 400, as 1% v/v) polyethylene glycol 6000 (PEG 6000, as 1% w/v), polyvinylpyrrolidone (PVP, as 1% w/v), were purchased from Sigma-Aldrich (St. Louis, MO, USA).
Methanol, ethanol, acetonitrile, acetone, dimethyl formamide, dioxane, hydrochloric acid, sodium hydroxide and hydrogen peroxide (30% v/v) was purchased from El-Nasr chemical Co., (Abo-Zaabal, Cairo, Egypt).
Britton-Robinson buffer solution (Britton and Robinson, 1931), in the pH range 2.0–12.0, consisting of a mixture of 0.04 M boric acid, 0.04 M phosphoric acid and 0.04 M acetic acid that has been titrated to the desired pH with 0.2 M sodium hydroxide. Plasma samples were taken from healthy volunteers (35 years old man) and stored in refrigerator until used for analysis. Adricin® vial labeled to contain 50 mg of DOX per vial (10 mg/5 mL), and Unitaxel® vial labeled to contain 100 mg/16.67 mL, were provided by Hikma specialized pharmaceutical (Badr City, Cairo, Egypt)..
2.3 Standard solutions
Stock solution of DOX was prepared by transferring 10 mg of DOX powder to a 100 mL calibrated flask and dissolving in suitable amount of ethanol, then completing to the mark with the same solvent. Working standard solution of 10.0 µg mL−1 was prepared by appropriate dilution of the stock solution with the same solvent. A stock solution of paclitaxel was prepared in the same manner as DOX. Solutions were kept in dark and in refrigerator to ensure their stability.
2.4 General procedure for construction of calibration graph
Aliquots of DOX working solutions were transferred into series of 5 mL volumetric calibrated flasks to obtain final concentrations in the range of 7 × 10⁻⁴–4.0 µg ml−1 of DOX, then 0.5 mL of 0.5 M hydrochloric acid was added. The volume was completed to the mark with ethanol and mixed well, A blank was also prepared in the same manner omitting the drug, and the fluorescence intensity was measured at λem 590 nm after excitation at λex 475 nm. The final concentrations of DOX were plotted against corresponding fluorescence intensity in order to construct the calibration curve and the corresponding regression equation was derived.
2.5 Assay of DOX in synthetic combination with paclitaxel
The general procedure was applied for combination to determine DOX at three concentration levels (0.5, 1 and 2 µg ml−1) in presence of PTX at fixed concentration of 1 µg ml−1. Aliquots of ethanolic DOX and PTX solutions in a linear range (as mentioned above) were transferred to a series of calibrated flasks marked to 10 mL. One milliliter of 0.5 M hydrochloric acid was added and the volume was totaled with ethanol and the fluorescence intensity was checked at 590 nm. The concentrations of DOX were calculated from the corresponding regression equation.
2.6 Assay procedure for pharmaceutical preparation
An accurately measured volume of the adricin® vial solution equivalent to 10 mg DOX was transferred into 100 mL volumetric flask and about 60 mL of ethanol were added. The contents of the flask were sonicated for 5 min, mixed well and completed to the mark with the same solvent to give working solution of 100 μg/mL of the cited drug. The solution was filtered if necessary, and the first portion of the filtrate was decanted. Further dilution with the same solvent was carried out to obtain final concentrations of 0.5, 1 and 2 µg ml−1 for DOX alone and in presence of 1 µg ml−1 of PTX, at each concentration level for the proposed method and subjected to analysis by the previously described analytical procedure in three replicates, The content of each concentration used was calculated using the corresponding regression equation.
2.7 Analysis of DOX in biological fluids
2.7.1 Analysis of DOX in human plasma
The authors got the permission for using plasma sample of human volunteers from Minia Hospital according to the guidelines of the Commission on the Ethics of Scientific Research, Faculty of Pharmacy, Minia University. Code number for the approval of the Project is14/2020. In all cases, informed written consent was obtained from all participants. Into series a heparinized tubes, 5.0 mL of human blood free from the drug were centrifuged for 30 min. at 4000 rpm. 2 mL aliquots of supernatant plasma were transferred into a series of centrifugation tubes. Aliquots of standard solution of DOX were added so that the final concentration is in the range of 0.05–4 µg ml−1. The tubes were mixed well and then suitable amount of acetonitrile was added to precipitate the protein (Derayea et al., 2018). The tubes were swirled for 60 s, and then centrifuged at 4000 rpm for 10 min. One milliliter of the clear supernatant was then quantitatively transferred into 5-mL calibrated volumetric flasks, and the previously mentioned procedure under “General analytical procedure” was applied. A blank experiment was performed simultaneously. Samples of human plasma spiked with different amounts of DOX in the working concentration range, were treated similarly, and the found contents of each added concentration of the drug were determined using its corresponding regression equation.
2.7.2 Analysis of DOX in human urine
Fresh urine sample from healthy people was filtrated and the filtrate was treated in the same manner as plasma, then aliquots of treated filtrate was pipetted into a 5-mL calibrated volumetric flask, and general procedure was followed for determination of DOX.
2.8 Calibration standard and quality control samples in human plasma and urine
A calibration standard and quality control were prepared by spiking human plasma and urine separately with different amounts of DOX standard solution. Stock DOX-spiked plasma and urine solutions were further diluted to prepare the calibration standard (CS) and quality control (QC). CS and QC samples for plasma and urine were prepared by diluting the corresponding working solution of the supernatant. The final DOX concentrations in the plasma and urine calibration standards were in the range of 0.05 to 4 μg ml−1.
2.9 Procedures for stability study
2.9.1 Alkaline and acidic degradation
Aliquots of DOX stock solutions containing 100 μg DOX were transferred into a series of 10-mL calibrated volumetric flasks, followed by the addition of 2 mL of 0.1 M HCl or 0.1 M NaOH. The solutions were incubated at 80 °C in a thermostatically controlled water bath for different time intervals (15–135 min). At each time interval, the content of each flask was neutralized to pH 7.0 using 0.1 M NaOH or 0.1 M HCl, respectively, and the volume was completed to the mark with ethanol. The induced degradation in both alkaline or acidic medium was carried out in a dark place to exclude the possible interfering from the light degradation effect. Accurate portions of 0.5 mL of the final solutions were transferred into 5-mL calibrated volumetric flasks and procedure was completed as mentioned under ‘General analytical procedure’.
2.9.2 Oxidative degradation
The solution for oxidative degradation study was prepared by precisely transferring 5 mL of DOX stock solution (100 μg ml−1) into 50 mL calibrated volumetric flask, and the volume was reached to mark with aqueous H2O2 (3.0% v/v) solution. The solution was incubated at 80 °C in a thermostatically controlled water bath. A suitable volume of this solution containing 10 μg ml−1 of DOX was quantitatively added to a 5-ml volumetric flask at different particular time intervals every 15 min. for 135 min. The general analytical procedure was applied to assay the remaining intact undamaged DOX.
2.9.3 Photo-degradation
UV Degradation: At a distance of 15 cm., a 10 mL well fitted stoppered glass tube containing DOX working solution (10 μg ml−1) was holed in a metal box and exposed to UV emitting Lamp (254 nm) for 10 hrs., blank samples were prepared similarly but protected from light by being wrapped in aluminum foil, and the procedure was completed as mentioned in ‘General analytical procedure’.
Degradations with direct sunlight: A well fitted stoppered glass tube (10 mL) containing DOX working solution (10 μgml−1) was exposed to direct sunlight for 4 hrs. Blank samples were prepared in the same manner but protected from light by being wrapped with aluminum foil, and the procedure was completed as mentioned in ''General analytical procedure“ at each time interval of 1 h to assay the remaining intact drug in presence of degraded molecules.
Daylight degradation: A volume of DOX solution was exposed to daylight (not exposed to direct sunlight) for 10 hrs., blank was prepared in similar manner but protected from daylight by being rolled in aluminum foil, and the general procedure was carried out.
3 Results and discussion
As mentioned before, the literature survey revealed very few reported fluorimetric methods and no simple and fast fluorimetric method for the estimation of DOX in any matrices. However, the analysis of this drug in bulk, commercial pharmaceutical forms and biological fluids, was performed mostly through chromatographic techniques. These techniques are expensive, time consuming, cumbersome and not environmental friendly. Therefore, it was of utmost great importance to setup an ecological friendly and non-pollutant simple, sensitive and cheap method for the determination of DOX in bulk and the commercial pharmaceutical dosage forms.
Through the virtues of the advantages of spectrofluorimetry including simplicity, selectivity and sensitivity in addition to its availability in most quality control laboratories, it has been applied in the present study. Because of the presence of conjugated anthracycline nucleus in its chemical structure, the solution of DOX has an orange coloration and an intrinsic fluorescence. However the native fluorescence of the drug is relatively weak in aqueous solution at λem590 nm when excited at λex 475 nm, as illustrated in Fig. 2. Therefore, different solvents and micellar media was tried in order to enhance the intrinsic emission of the cited drug. Thus the method sensitivity would increase and consequently detection limit should be lowered. It was observed that using ethanol as intrinsic medium resulted in the highest improvement of the fluorescence intensity of DOX compared to aqueous solution (about 3.36 folds enhancement). The spectra illustrated in Fig. 2 show the emission and excitation of DOX (1.0 µg mL−1) in the water and in 0.05 M ethanolic hydrochloric acid solution. The fluorescence intensity was immediately developed after the completion of general procedure and remained without noticed changes for more than 2 h. Consequently, a spectrofluorimetric method was created for the assay of the cited drug.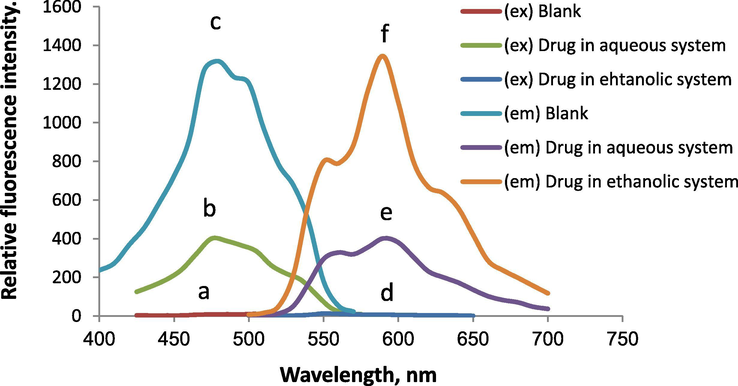
The fluorescence spectra of DOX (1.0 µg mL−1); (a), (b) & (c), are excitation spectra of blank in ethanol, buffered drug in aqueous system and in ethanolic system, respectively; (d), (e) & (f), are emission spectra of blank in ethanol, buffered drug in aqueous system and in ethanolic solution respectively, (slit widths adjusted at 10 nm).
3.1 Optimization of experimental parameters
The influence of the different experimental parameters on the fluorescence characters of the DOX (abbreviated as “RFI” relative fluorescence intensity, which is relative to that of standard Quinine sulphate solution) were inspected and adjusted. The inspected factors included pH, buffer volume, type of surfactant or organized media, diluting solvent and time (stability). The general analytical procedure was carried out by making variations in each factor individually, while keeping the others unchanged.
3.1.1 Effect of different surfactant media
In attempt to intensify the fluorescence characters of DOX solution, a numerous micellar media were tried including; anionic surfactant (SDS), cationic surfactant (HTAB), non-ionic surfactants, (PEG 6000, and Tween-80), anionic polysaccharide (CMC Na) and others macromolecules as β-cyclodextrine and PVP. It was found that the anionic polysaccharide, CMC Na, has no significant effect while slight increase in the fluorescence was observed in the case of PEG 6000, PVP and β-CD. However, tween-80 and SDS and HTAB system yielded approximately two folds increase on the native fluorescence intensity of the drug compared with water (Fig. 3.).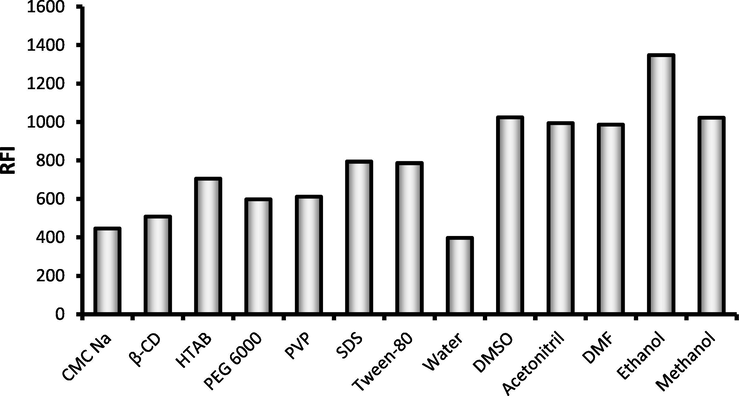
The effect of different media and solvent on the fluorescence intensity of DOX (1.0 µg mL−1).
3.1.2 Effect of diluting solvent
Many solvents were used for final dilution, including; methanol, ethanol, acetonitrile, distilled water, dimethylsulfoxide; (DMSO) and dimethylformamide (DMF). It was observable that there was a marked increase in the fluorescence intensity of DOX with all of the investigated organic solvents in comparison with the obtained effect from the previously studied micellar media (Fig. 3). From all of the tested solvents, ethanol achieved the highest intensity of the intrinsic fluorescence. The obtained fluorescence intensity was inversely propositional with the polarity of the solvent in the following order; ethanol (1347), methanol (1022), DMF (986), acetonitrile (994), DMS (1024) and water (397). The values of dielectric constants of tested solvents were: 24.5, 32.7, 36.7, 37.5, 46.7 and 80.1 for ethanol, methanol, DMF, acetonitrile, DMSO and water respectively. A good linear correlation coefficient (r = 0.9134) was obtained between the fluorescence intensity and the dielectric constants of the diluting solvent. Consequently, ethanol was the sensitizing solvent of choice in the present study for quantification of DOX, which gave a higher fluorescence enhancement even than those achieved with any other solvent or organized media.
3.1.3 Effect of pH and volume
The effect of pH on the fluorescence intensity was examined over a wide pH range of 1.0–10.0 using hydrochloric acid (pH 1.0–2.0) and Britton-Robinson buffer solutions (2.0–10.0). It was found that, fluorescence activity of the drug was highly pH dependent. The highest enhancement in the measured fluorescence intensity was obtained in the acidic media (pH 1.0–2.0). Increasing or decreasing the pH apart from this range produced a distinct decrease in the intensity of fluorescence as shown in Fig. 4a. The same result was concluded from varying the volume of 0.5 M HCl where the best results were attained by using volumes of 0.5 M hydrochloric acid between 0.5 and 1.5 mL as shown in Fig. 4b. Therefore the optimum pH was 1.5 which was adjusted by using 1.0 mL of 0.5 M hydrochloric acid solution.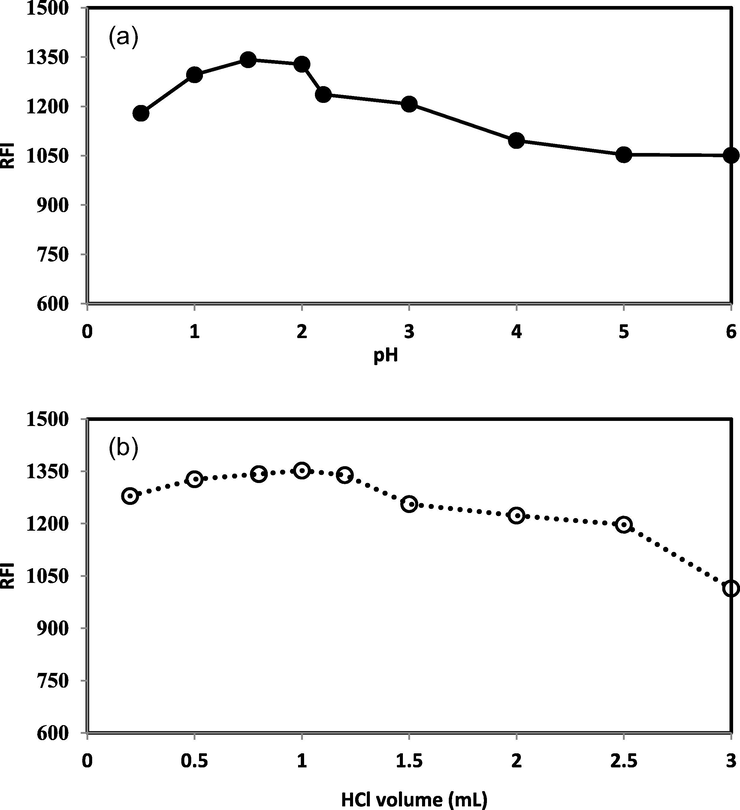
Effect of pH (a) and volume of 0.5 HCl (b) on fluorescence intensity of 1.0 µg mL−1 DOX.
3.2 Validation of the method
In accordance with the International Conference on Harmonization (ICH) guidelines (Guideline, 2005); Validation procedure was carried out. The validated items were: linearity, sensitivity, precision, accuracy and robustness.
3.2.1 Range and linearity
By analyzing a series of different concentrations of the standard solution covering the linear range of DOX (3 replicates for each concentration); the linearity of the developed method was estimated. After plotting the intensity of fluorescence against the corresponding drug concentration; a linear relationship was obtained, over the range of 7 × 10⁻⁴–4.0 µg mL−1. The determination coefficient (r2), and correlation coefficient (r) were 0.9998 and 0.9999, respectively, indicating the excellent linearity of the developed method. Table 1 summarized the calculated statistical parameters for determination of DOX by the proposed method. Calibration was also performed in biological samples. The calibration curves in plasma and urine samples were constructed using six different concentration levels. In this case, the lower limit of quantitation (LLOQ) was defined as the lowest concentration on the calibration curve that can be determined with acceptable accuracy (80–120%) and precision (within 20%). The upper limit of quantitation (ULOQ) was identical to the highest calibration curve point that could be determined with accepted sensibility. The linear range for tested biological fluids was ranged from 0.05 to 4.0 µg mL−1. The resulted regression equation for plasma analysis was y = 1257.2x + 13.6 with the 0.999 and 0.998 for r and r2 respectively. For urine analysis the equation was y = 1289.2x + 23.28 with the 0.998 and 0.997 for r and r2 respectively.
Parameter
Value
Linear range (µg mL−1)
7 × 10⁻⁴–4.0
Slope
1342.4
SD of slope (Sb)
0.054
Intercept
9.219
SD of intercept (Sa)
0.081
Determination coefficient (r2)
0.9998
Correlation coefficient (r)
0.9999
SD of the residuals (Sy/x)
0.2479
Limit of quantitation (ng mL−1)
0.6
Limit of detection (ng mL−1)
0.2
3.2.2 Quantitation (LOQ) and detection (LOD) limits
Through applying the equations: LOQ = 10Sa/b and LOD = 3.3Sa/b; and according to the recommendation of ICH Q2 (R1) (Guideline, 2005), the LOD and LOQ were calculated. In these equation; b is the slope of calibration curve, and Sa is the standard deviation of the intercept. The values of LOD and LOQ were 0.2 and 0.6 µg mL−1, respectively, which indicate the high sensitivity of the present method for DOX estimation.
3.2.3 Accuracy
For an accuracy checking, five standard drug solutions with different concentration levels (0.05, 0.5, 1.0, 2.0 and 3.0 μg mL−1) were analyzed by the proposed method in three replicates. The percentage recovery and standard deviation were calculated as shown in Table 2. The values of found recoveries percent were close to 100% with very low percentage error (Er.% < ± 0.5) which impart the high accuracy of developed methods. This is an acceptable level for the routine analysis of the studied drug.
Amount taken (µg mL−1)
A mount found (µg mL−1)
% Recovery
Er%
SD*
RSD%
0.05
1.497
99.50
−0.50
1.490
1.497
0.5
0.835
99.34
−0.66
0.830
0.835
1.0
0.749
99.56
−0.44
0.746
0.749
2.0
0.714
99.88
−0.12
0.713
0.714
3.0
0.826
99.68
−0.32
0.824
0.826
3.2.4 Precision
The precision of the present method was tested at two levels; intra-day and inter-day levels. Intra-day precision was examined by performing the general analytical procedure to determine three concentrations of standard DOX solution (0.05, 0.5 and 1.0 µg mL−1) during the same day. The same three previous drug concentrations were also estimated in the inter-day level, but by carrying out the analytical procedure over a period of three successive days. The analysis was done in three replicates at each concentration for both precision levels. The results were displayed in the form of percentage recovery and relative standard deviation (RSD) as illustrated in Table 3. The found data reflected the high precision of the present method as imparted by the low values of RSD. *Mean value of three determinations, Er is the relative error, SD standard deviation, and RSD relative standard deviation.
Precisions level
Conc. (µg mL−1)
% Recovery
SD
Er%
RSD%
Inter-day precision
0.05
100.49
1.72
0.49
1.71
0.5
100.58
1.49
0.58
1.48
1.0
99.51
0.66
−0.49
0.67
Intra-day precision
0.05
99.50
2.58
−0.50
2.59
0.5
100.78
0.99
0.78
0.98
1.0
99.41
0.93
−0.59
0.94
3.2.5 Robustness
Minor variations in the experimental conditions that may influence the analytical performance were intentionally done to check the robustness of the presented method. As the method was very simple, only two parameters needed to be examined; pH, volume of HCl solution. As shown in Table 4, the changes have no significant effect on either the percentage recovery or standard deviation and the obtained values were within the recommended concentration. This implies an evidence for the excellent degree of robustness of the established method, and its reliability. *Mean value of three determinations, SD standard deviation and Eris the relative error.
Parameter
Parameter value
% Recovery
Er%
SD
pH of buffer
1.7
99.71
−0.29
0.45
1.3
99.43
−0.57
0.61
HCl. Vol., mL
1.2
99.53
−0.47
0.53
0.8
99.71
−0.02
0.15
3.2.6 Selectivity
The selectivity of the present procedure was investigated by determination of cited DOX drug in the presence of paclitaxel (PTX); which is an adjuvant drug used in the chemotherapy course as first line for treatment of many solid tumors. The method appeared very acceptable results in different mixtures without any notable influence of PTX in quantification of DOX. It is noteworthy that, the analysis was made in both bulk powder and pharmaceutical dosage form. As shown in Table 5, the calculated recovery were 97.4–100.57, while the values of RSD were 0.28–2.12; These results imply that there is no interference observed in the determination of DOX at the studied concentrations. Therefore, the present procedure could selectively and effectively determine DOX in the presence of PXT. *Mean value of three determinations, Er is the relative error, SD standard deviation, and RSD relative standard deviation.
matrix
DOX+PXT (µg mL−1)
DOX found (µg mL−1)
% Recovery
SD
Er%
RSD%
Bulk powder
0.5 + 1
0.490
97.95
1.204
−2.049
1.2290
1.0 + 1
0.976
97.69
0.77
−2.305
0.79
2.0 + 1
1.960
98.012
0.465
−1.98
0.475
Dosage form
0.5 + 1
0.490
98.00
2.085
−1.99
2.128
1.0 + 1
0.991
99.13
0.859
−0.86
0.866
2.0 + 1
1.966
98.348
0.270
−1.165
0.284
3.2.7 Application to pharmaceutical formulations
The commercially available dosage form of DOX; adricin® vial (as a representative example) was subjected for quantification of its drug content by the proposed method and the reported one (Sastry and Rao, 1996). The student's t- and F-tests were applied to statistically compare the results obtained from both methods (Table 6). The calculated values of both tests are less than the tabulated one which point out that the results of both the proposed and reported methods don't differ significantly. However, the proposed procedure has the merit over the reported one in being more sensitive, simple, less time consuming utilizing no harmful or staining reagents and having very small detection limits. The results confirm that the developed procedure is suitable for the cited drug quantification with high recoveries, and the absence of interference from considerably involved dosage form additives. Therefore, the method is a proper choice for the analysis dosage forms containing the cited drug and for the routine analysis in quality control and quality assurance (see Table 5). *The value is the mean of three replicates measurement, SD is the standard deviation, RSD is the relative standard deviation and Er % is the relative error percentage.
Parameter
Proposed methods
Reported method
% Recoverya
99.68
99.55
Standard deviation (SD)
0.81
0.41
Number of determinations
5
5
t- valueb
0.30
–
F-valueb
3.79
–
Matrix
Conc. (µg mL−1)
% Recovery
Er%
SD
RSD%
Plasma
0.1
98.85
−1.15
2.00
2.03
0.5
99.05
−0.95
1.12
1.13
1.0
99.48
−0.52
0.61
0.61
Urine
0.1
97.52
−2.48
2.33
2.39
0.5
99.35
−0.65
1.14
1.15
1.0
98.93
−1.07
0.87
0.88
3.2.8 Application to spiked human plasma and urine
Because of the sufficient sensitivity of the presented method, it could be used to determine DOX in biological fluids such as human plasma and urine. The result for the application of the proposed method, are shown in Table 7. The percentage recoveries for plasma and urine analysis were in the range of 97.52–99.48% with a relative standard deviation of 0.88–2.03. These results indicate the ability of the current method for the quantitative measurement of the cited drug in human plasma and urine without any significant interference from the matrix of these biological samples.
3.3 Stability-indicating studies
The cited drug, DOX, was exposed to different harsh conditions such as high acidity, alkalinity, oxidation and light. After performing the degradation procedure, the present spectrofluorimetric method was applied to find out the remaining unchanged drug content.
3.3.1 Alkali induced degradation
The study revealed that the drug showed a high liability for alkaline degradation, represented by the significant decrease in the fluorescence intensity when heated with 0.1 M NaOH solution at 80 °C for more than 2 h. in thermostatically controlled water bath. Under the previously mentioned conditions, about 87.8% of the drug was degraded after the first hour. Four degradation products were separated and identified by mass spectroscopy in a previously reported study (Štenglová Netíková et al., 2017); however, the main and more stable one is shown in Fig. 5. A proposal for degradation of DOX under the different conditions is shown in Fig. 5.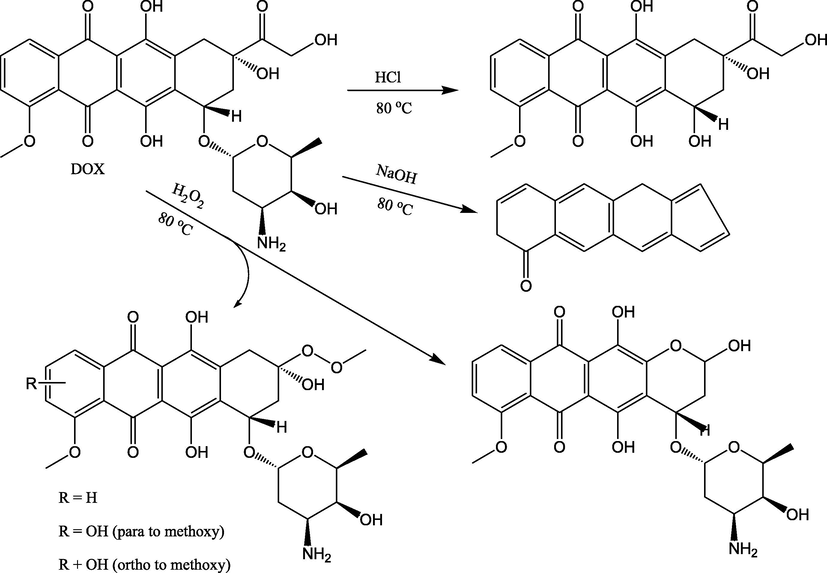
Suggested alkaline (Štenglová Netíková et al., 2017), acidic (Wassermann and Bundgaard, 1983) and oxidative degradation (Kaushik and Bansal, 2015) pathways for the DOX.
3.3.2 Acid induced degradation
Studying the influence of induced acidic condition on the stability of DOX showed moderate liability when the drug was incubated in 0.1 M HCl for more than 2 h at 80 °C in thermostatically controlled water bath (about 19.9% degradation after 1 h.). DOX is consists of tetracyclic quinoid aglycone; linked to amino sugar together through a glycosidic bond. Like other glycosides, doxorubicin is susceptible to undergo hydrolytic degradation in acidic solution with formation of the aglycone and the amino sugar as shown in Fig. 5 (Wassermann and Bundgaard, 1983).
3.3.3 Induced oxidative degradation
DOX undergone slight breakdown under oxidative conditions as confirmed by the slight decrease in fluorescence intensity after heating with 3% v/v H2O2 solution at 80 °C for 2 h. Only about 9.7% degradation was recorded upon exposing DOX solution to the mentioned oxidative condition for 1 h. As shown in Fig. 5, the oxidation could yield four degradation products as previously confirmed in a previous study (Kaushik and Bansal, 2015). The degradation occur through peroxide formation of the aliphatic side chain followed by either the complete removal of this side chain or further hydroxylation of the benzene ring at ortho- or para- position with respect to the methoxy group (Kaushik and Bansal, 2015).
3.3.4 Photolytic degradation
There is a wide variation about the photo-degradation of DOX in many of the previously published studies. Some of these studies have shown that the drug is resistant to photolytic degradation (Kaushik and Bansal, 2015). While there are other studies that prove that the drug is light sensitive (Wood et al., 1990; Bandak et al., 1999; Le Bot et al., 1987).
According to the present study, DOX showed a considerable degree of instability in daylight. When an aqueous solution of DOX was exposed to daylight for 10 h. about 62.4% degradation was observed. However, a similar solution stored in the dark for the same period showed 44.1% degradation. In addition, when the ethanolic solution of the drug was exposed to daylight for the same time experienced, only 22.4% degradation of the drug was observed. Based on these results, one could conclude that the daylight degradation in an aqueous solution is a mixed pathway including the photo-degradation and the hydrolytic effect. The same behavior was also observed when the drug solution was exposed to direct sunlight. However, sunlight produced a severe degradation and the drug was completely broken within two hours. To exclude the effect of hydrolysis, sun light degradation was carried out in absolute ethanol where about 76.03% of the drug was degraded within 4 h. On the other hand, DOX drug solution showed good stability to UV radiation. The observed degradation with UV-irradiation for 10 h, was 37.7% which was very close to the degree of degradation (32.9%) that occurred upon storing the drug in the dark for the same period.
The current study gives an indication of the relative stability of DOX towards oxidizing agents and UV degradation. While it was found that the drug is highly sensitive to hydrolysis, especially in the alkaline medium and photolysis with direct sunlight. A summary for the degradation profile of DOX under different condition is presented in Table 8.
Degradation type
Condition
Exposure time, h.
% Degradation product
Acidic
0.1 M HCl, 80 °C
1 h.
19.9
Alkaline
0.1 M NaOH, 80 °C
1 h.
87.8
Oxidative
3% (v/v) H2O2, 80 °C
1 h
9.7
Photo-degradation
UV radiation (ethanol)
10 h
7.50
Direct sunlight (ethanol)
4 h
76.03
Daylight (ethanol)
10 h
22.39
3.3.5 Kinetics study of the degradation
The acidic, alkaline and oxidative degradations were noticed to be time-related, Fig. 6. The apparent first-order degradation rate constants were calculated using the equation: log Ao/A = kt/2.303, where Ao and A are the initial and remaining concentrations of DOX, respectively k is the reaction rate constant and t is the time of degradation. The value of k would equal the slope/2.303 and the half lifetime t1/2 = 0.693/k. The calculated rate constants (k) were 0.0038, 0.021 and 0.0019 K h−1 and half times (t1/2) were 3.05, 0.56 and 6.26 h for acidic, alkaline and oxidative degradations, respectively .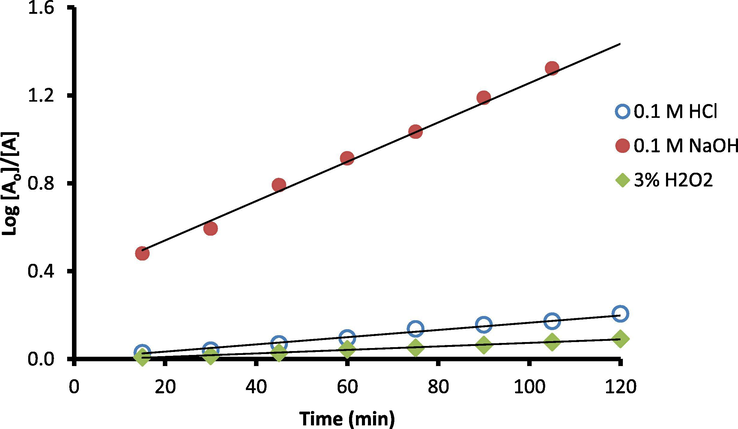
Influence of different incubation times with 0.1 M HCl, 0.1 M NaOH and 3.0% v/v H2O2 on the DOX degradation rate (1 μg ml −1).
Item
Word sign
Item PP score
Reagent
HCl
Less sever hazard
1
Solvent
Ethanol
Less sever hazard
1
Temperature
room temp
0
pH
1.5
5
Energy
≤0.1 KWh/sample
0
Waste
3
Occupational hazards
0
Total penalty points (TPP)
10
Eco-scale total score
= 100 − TPP
90
3.4 Calculation of the quantum yield
The fluorescence quantum yield of DOX was estimated utilizing the comparative method. Dilute crystal violet solution was used as reference reagent which has a fluorescence quantum yield of 0.54 (Magde et al., 1979). In this method, the quantum yield was estimated from the slope of the regression line obtained from plotting the absorbance versus the fluorescence intensity. The following equation (Williams et al., 1983) was applied to calculate the fluorescence quantum yield of DOX, where; Q is the quantum yield, S is the slope of the straight line; n is the refractive index of used solvent and the subscript letters “cv” refers to crystal violet (the utilized reference standard fluorophore). In order to reduce the re-absorption effect in the sample, the absorbance values of all prepared solutions always kept below 0.1 (Williams et al., 1983). The quantum yield of an aqueous DOX solution and the ethanolic medium were 0.02 and 0.062, respectively, meaning that the quantum yield in ethanolic solution was also enhanced 3 times compared to the original value in an aqueous solution.
3.5 Evaluation of the greenness of the proposed method
There is a great part of responsibility on the analysts, to protect both the environment and human from dangerous solvents and organic waste produced as a result of their use in chemical and pharmaceutical applications. The regular development and updating of green analytical chemistry must be taken into consideration. Recent metrics for example: the analytical eco scale score (Gałuszka et al., 2012) and National Environmental Methods Index labeling (De La Guardia and Armenta, 2010) were applied to discretion the ‘greenness’ of an analytical method. We applied the eco-scale (Gałuszka et al., 2012) for rating the greenness of proposed method. An analytical eco-scale evaluation result is the resultant number representing a penalty points granted which were subtracted from 100; a number recorded for ' ideal green analysis'. These points indicates the hazards used during the analytical procedure. The elevated the value (expressed in high number), the greener the analysis would be. Because ethanol was used in the developed method, no extraction step was used, and heating or energy consuming procedure was below 0.1 kW h per sample, the eco-scale score for the developed procedure was 90 (Table 9). This value implied a good greenness of our method.
4 Conclusion
The present work describes the development of simple and economic spectrofluorimetric method for DOX determination. The developed procedure is rapid and reproducible. The methodology does not involve various tedious sample pre-treatment steps, heating or tedious extraction steps. Moreover, the present method is environmentally safe since toxic or carcinogenic solvents are omitted and ethanol is the used solvent which is one of the green solvents with low hazards. The greenness of presented method is confirmed by the high eco-scale total score (90/100). These advantages make the proposed method is superior over many of the previously reported spectrophotometric and spectrofluorimetric methods for DOX determination. The very high sensitivity and very low LOQ of the method permit the determination of the cited drug in human plasma and urine with good accuracy and precision. Meanwhile, the proposed method is selective enough to tolerate the presence of common excipients, which may exist in the dosage forms and matrix components of the biological fluids. Additionally, the method has high specificity and could be applied for the analysis of DOX in the presence of PXT; a taxane chemotherapeutic agent without any interference.
CRediT authorship contribution statement
Sayed M. Derayea: Conceptualization, Writing - review & editing. Ramadan Ali: Participation in statistical analysis and helping draft the manuscript. Ahmed A. Hamad: Carrying out the experimental work, data analysis and drafting the original manuscript.
Declaration of Competing Interest
The authors declare that they have no known competing financial interests or personal relationships that could have appeared to influence the work reported in this paper.
References
- Selective determination of doxorubicin and doxorubicinol in rat plasma by HPLC with photosensitization reaction followed by chemiluminescence detection. Talanta. 2009;78:94-100.
- [Google Scholar]
- A simple HPLC method for doxorubicin in plasma and tissues of nude mice. Arch. Pharmacal. Res.. 2009;32:605-611.
- [Google Scholar]
- Molecularly imprinted polymer-capped nitrogen-doped graphene quantum dots as a novel chemiluminescence sensor for selective and sensitive determination of doxorubicin. RSC Adv.. 2016;6(89):86736-86743.
- [Google Scholar]
- Reduced UV-induced degradation of doxorubicin encapsulated in polyethyleneglycol-coated liposomes. Pharm. Res.. 1999;16:841-846.
- [Google Scholar]
- CXCVIII.—Universal buffer solutions and the dissociation constant of veronal. J. Chem. Soc.. 1931;0(0):1456-1462.
- [Google Scholar]
- Green Analytical Chemistry: Theory and Practice. Elsevier; 2010.
- Analysis of doxorubicin uptake in single human leukemia K562 cells using capillary electrophoresis coupled with laser-induced fluorescence detection. Anal. Bioanal. Chem.. 2011;401(7):2143-2152.
- [Google Scholar]
- Improved spectrofluorimetric determination of mebendazole, a benzimidazole anthelmintic drug, through complex formation with lanthanum (III); Application to pharmaceutical preparations and human plasma. J. Mol. Liq.. 2018;272:337-343.
- [Google Scholar]
- Multivariate evaluation of doxorubicin surface-enhanced Raman spectra. Spectrochim. Acta Part A Mol. Biomol. Spectrosc.. 2001;57(9):1907-1915.
- [Google Scholar]
- Voltammetric determination of trace doxorubicin at a nano-titania/nafion composite film modified electrode in the presence of cetyltrimethylammonium bromide. Microchim. Acta. 2009;164(1-2):85-91.
- [Google Scholar]
- Analytical Eco-Scale for assessing the greenness of analytical procedures. TrAC, Trends Anal. Chem.. 2012;37:61-72.
- [Google Scholar]
- A new nanostructure consisting of nitrogen-doped carbon nanoonions for an electrochemical sensor to the determination of doxorubicin. Microchem. J.. 2020;157:105098.
- [Google Scholar]
- Validation of analytical procedures: text and methodology Q2 (R1) In: International Conference on Harmonization, Geneva, Switzerland. 2005.
- [Google Scholar]
- Electrochemical sensor for ultrasensitive determination of doxorubicin and methotrexate based on cyclodextrin-graphene hybrid nanosheets. Electroanalysis. 2011;23:2400-2407.
- [Google Scholar]
- A method to determine RNA and DNA oxidation simultaneously by HPLC-ECD: greater RNA than DNA oxidation in rat liver after doxorubicin administration. Biol. Chem.. 2006;387:103-111.
- [Google Scholar]
- Development of a competitive ELISA for the quantification of F5 conjugate in HER2-targeted STEALTH immunoliposome doxorubicin in plasma samples. Anal. Bioanal. Chem.. 2006;386(6):1657-1664.
- [Google Scholar]
- Analytical applications of chemiluminescence methods for cancer detection and therapy. TrAC, Trends Anal. Chem.. 2014;59:156-183.
- [Google Scholar]
- A microscale spectrophotometric method for quantification of doxorubicin in exhaled breath condensate. Anal. Methods. 2019;11:648-653.
- [Google Scholar]
- Four new degradation products of doxorubicin: An application of forced degradation study and hyphenated chromatographic techniques. J. Pharm. Anal.. 2015;5(5):285-295.
- [Google Scholar]
- Study of doxorubicin photodegradation in plasma, urine and cell culture medium by HPLC. Biomed. Chromatogr.. 1987;2(6):242-244.
- [Google Scholar]
- In vitro study of a pH-sensitive multifunctional doxorubicin–gold nanoparticle system: therapeutic effect and surface enhanced Raman scattering. RSC Adv.. 2015;5(81):65651-65659.
- [Google Scholar]
- Doxorubicin blocks cardiomyocyte autophagic flux by inhibiting lysosome acidification. Circulation. 2016;133:1668-1687.
- [Google Scholar]
- Simple and rapid monitoring of doxorubicin using streptavidin-modified microparticle-based time-resolved fluorescence immunoassay. RSC Adv.. 2018;8(28):15621-15631.
- [Google Scholar]
- Rapid analysis of anthracycline antibiotics doxorubicin and daunorubicin by microchip capillary electrophoresis. Microchem. J.. 2009;92(2):170-173.
- [Google Scholar]
- Absolute luminescence yield of cresyl violet. A standard for the red. J. Phys. Chem.. 1979;83(6):696-699.
- [Google Scholar]
- Method development and validation of doxorubicin HCL in API and its formulation by spectrophotometry. Int. J. Pharm. Chem. Biol. Sci.. 2013;3:1006-1009.
- [Google Scholar]
- Nanoparticles for the development of improved (bio)sensing systems. Anal. Bioanal. Chem.. 2011;399(4):1577-1590.
- [Google Scholar]
- DNA topoisomerases and their poisoning by anticancer and antibacterial drugs. Chem. Biol.. 2010;17:421-433.
- [Google Scholar]
- Determination of doxorubicin hydrochloride by visible spectrophotometry. Talanta. 1996;43:1827-1835.
- [Google Scholar]
- Evaluation of cytotoxicity profile and intracellular localisation of doxorubicin-loaded chitosan nanoparticles. Anal. Bioanal. Chem.. 2016;408(20):5443-5455.
- [Google Scholar]
- A new possible way of anthracycline cytostatics decontamination. New J. Chem.. 2017;41(10):3975-3985.
- [Google Scholar]
- Doxorubicin: an update on anticancer molecular action, toxicity and novel drug delivery systems. J. Pharm. Pharmacol.. 2013;65:157-170.
- [Google Scholar]
- A synergistic combination therapy with paclitaxel and doxorubicin loaded micellar nanoparticles. Colloids Surf., B: Biointerfaces. 2014;116:41-48.
- [Google Scholar]
- Kinetics of the acid-catalyzed hydrolysis of doxorubicin. Int. J. Pharm.. 1983;14(1):73-78.
- [Google Scholar]
- Relative fluorescence quantum yields using a computer-controlled luminescence spectrometer. Analyst. 1983;108(1290):1067-1071.
- [Google Scholar]
- Stability of doxorubicin, daunorubicin and epirubicin in plastic minibags and plastic syringes. J. Clin. Pharm. Ther.. 1990;15:279-289.
- [Google Scholar]
- Molecularly imprinted fluorescent probe based on FRET for selective and sensitive detection of doxorubicin. Mater. Sci. Eng., B. 2017;218:31-39.
- [Google Scholar]
- Interaction of doxorubicin and its derivatives with DNA: Elucidation by resonance Raman and surface-enhanced resonance Raman spectroscopy. Biospectroscopy. 1997;3(4):307-316.
- [Google Scholar]
- Determination of doxorubicin in pharmaceutical preparation and rat plasma with luminol-K3Fe(CN)6 chemiluminescence system. J. Food Drug Anal.. 2013;21(3):279-285.
- [Google Scholar]
Appendix A
Supplementary material
Supplementary data to this article can be found online at https://doi.org/10.1016/j.arabjc.2020.09.032.
Appendix A
Supplementary material
The following are the Supplementary data to this article:Supplementary data 1
Supplementary data 1


