

Translate this page into:
Feasibility of near-infrared spectroscopy and chemometrics analysis for discrimination of Cymbopogon nardus from Cymbopogon citratus
⁎Corresponding author at: Department of Chemistry, Faculty of Mathematics and Natural Sciences, IPB University, Jalan Tanjung Kampus IPB Dramaga, Bogor 16680, Indonesia. mra@apps.ipb.ac.id (Mohamad Rafi)
-
Received: ,
Accepted: ,
This article was originally published by Elsevier and was migrated to Scientific Scholar after the change of Publisher.
Peer review under responsibility of King Saud University.
Abstract
The authenticity of essential oils has become an important issue in supplying essential oil raw materials for the pharmaceutical, perfume, and cosmetic industries. Citronella oil is one of the essential oils used in those industries. Cymbopogon nardus is one of the lemongrass species that can produce citronella oil. However, with the high price of citronella oil from C. nardus, there is a possibility of being substituted or adulterated with closely related plants, namely Cymbopogon citratus. This paper described the feasibility of near-infrared (NIR) spectroscopy combined with chemometrics analysis for rapid identification and authentication of C. nardus from C. citratus essential oil. NIR spectra of both essential oils and their mixture (10 % and 25 % v/v of C. citratus in C. nardus) showed a similar spectral profile, so we cannot easily discriminate them and need help from chemometrics analysis. For chemometrics analysis, we used absorbance data from the preprocessed NIR spectra at wavenumbers 4000–6500 cm−1. Using PCA, we could separate each essential oil from C. nardus and C. citratus but cannot discriminate between 10 % and 25 % of CC in CN. While using OPLS-DA with R2X(cum) = 0.88, R2Y(cum) = 0.859 and Q2(cum) = 0.723, we could group each sample. The OPLS-DA score plot clearly shows the difference between C. nardus and C. citratus essential oils and their mixtures. The combination of NIR and OPLS-DA could provide a suitable method for identifying and authenticating C. nardus from C. citratus essential oil.
Keywords
Cymbopogon nardus
Cymbopogon citratus
Identification
Authentication
NIR
OPLS-DA

1 Introduction
Lemongrass (Cymbopogon) is a plant genus comprising more than 140 species distributed in tropical and subtropical regions of Asia, Africa, and America. Lemongrass is famous for its essential oil and is widely used for medical purposes, perfume, and cosmetics. Several biological activities come from this plant genus such as antiprotozoal, anti-inflammatory, antimicrobial, antidiabetic, antifungal, and larvicidal activity (Avoseh et al., 2015; Capoci et al., 2015; Arpiwi et al., 2020).
In Indonesia, two species of lemongrass are known, namely Cymbopogon nardus and Cymbopogon citratus. The morphology of the two plants can be distinguished with C. nardus has a slender stem shape with a reddish to purple stem color, while C. citratus has a larger stem shalpe and is white at the base of the stem. C. citratus has a distinctive lemon aroma and comes from the citral, the main metabolite of C. citratus essential oil. According to Vyshali et al. (2015), the primary metabolite in the essential oils of C. citratus are α -citral, β -citral, nerol, geraniol, citronellal, terpinolene, and myristicin. While in C. nardus volatile oil, citronellal, geraniol and citronellol are mainly found (Weng et al., 2015).
Citronella oil from C. nardus has been extensively used in the pharmaceutical, perfume, and cosmetic industries. This is related to the essential oil's excellent quality compared to other citronella oil types because it contains 18–48 % geraniol, 6–12 %% citronellol, and 4–39 % citronellol (Weng et al., 2015). These three components determine the quality that impacts the price of C. nardus essential oil, although purity plays an important role in the price. In the market, C. nardus essential oil is at a relatively higher price than essential oil from C. citratus. So, C. nardus essential oil may be substituted or added with C. citratus essential oil, which is cheaper. The addition of other oils to the essential oil of C. nardus causes the quality of the essential oil to decrease, so to maintain its quality, an analytical method is needed to be developed to determine the authenticity of the C. nardus essential oil.
Authenticating essential oil can use several chemical analysis methods ranging from simple ones such as organoleptic and physical tests to chromatographic and spectroscopic instruments (Boren et al., 2015; Dubnicka et al., 2020; Fahmi et al., 2020). Near-infrared (NIR) spectroscopy offers a fast, low-cost, and usually no sample preparation method of analysis and holds promise for essential oil authentication analysis based on fingerprint analysis (Luyangi et al., 2017). NIR has the working principle of using electromagnetic waves with a wavelength of 780–2500 nm or a wave number of 4000–12800 cm−1 with the absorption of infrared radiation by the molecules that make up the material causing the single bonds to vibrate (vibrate). Often the resulting spectral bands give rise to overlapping peaks so that the determination of a single spectral band becomes difficult, so it needs to be combined with other analytical techniques, namely chemometrics. This technique can extract spectral information and facilitate data analysis (Gad et al., 2012). Chemometric methods have been widely applied in analyzing food analysis for authentication and detecting an adulteration, also for the standardization of medicinal plants using spectroscopic methods (Bansal et al., 2014; Huang et al., 2014; Granato et al., 2018; Rafi et al., 2020).
Applying NIR spectral fingerprint in combination with chemometric analysis is getting much attention for quality evaluation of raw material and finished products from plants, such as identification and authentication of essential oils (Basri et al., 2017; Fahmi et al., 2020). However, a quality control method for identifying and detecting adulterating C. nardus essential oil from C. citratus essential oil is still limited. So, we would like to take this opportunity by performing a feasibility study of NIR spectra combined with chemometric analysis to identify and authenticate C. nardus essential oil from C. citratus. From the result obtained, the developed method was successfully applied to identify and authenticate C. nardus from C. citratus.
2 Materials and methods
2.1 Materials and instruments
The materials used in this study were C. nardus and C. citratus leaves collected in September 2021 from Sukabumi (570 M, −6.77324, 106.80688), Bandung (1262 M, −6.80866, 107.61374), Magelang (571 M, −7.38314, 110.27757), Tawamangu (836 M, −7.66307, 111.11007), and Bogor (140 M, −6.54761, 106.71584), Java Island, Indonesia. Mr. Taopik Ridwan from Tropical Biopharmaca Research Center (TropBRC), IPB University, identified the samples. The voucher specimen was stored in TropBRC, IPB University. One set steam distillation apparatus was used to obtain essential oil and NIR spectrophotometer FT-NIR N-500 Fiber Optic Solid with Transflectan Adapter (Buchi, Switzerland) to measure NIR spectra.
2.2 Sample preparation and distillation
Samples of C. nardus and C. citratus leaves were dried for 1–2 days and then cut into 5–8 cm sizes. The prepared sample was then put into a decoction bag and placed on a retainer of the flute pot filled with 6 L of water. Furthermore, the distillation apparatus is assembled and heated at 100 °C. Each sample was added about 1 kg and carried out three replications of the distillation process on each sample 5 h after turning on the heater. At the end of the distillation, two phases were observed, the aqueous phase (aromatic water) and the organic phase (essential oil), which were less dense than water. Essential oils were collected. For authentication purposes, the C. nardus essential oil was mixed with a ratio of 90:10 and 75:25 (v/v) with C. citratus essential oil until homogeneous.
2.3 NIR spectra measurement
The individual essential oil and their mix were pipetted approximately 0.1 mL and dripped directly on the NIR probe. NIR with a wavenumber range of 4000–10,000 cm−1 and a resolution of 4 cm−1 was used for spectral readings. Indium gallium arsenide (InGaAs) was used as the detector. Serial port communications by ethernet wire are used as the computer's instrument connection. NIR spectra raw data processing was performed using NIRWare software (BUCHI, Switzerland).
2.4 Chemometric analysis
The Unscrambler X 10.1 (Camo, Oslo, Norway) software was used for preprocessing the NIR spectra data. Principal component analysis (PCA) and orthogonal partial least square-discriminant analysis (OPLS-DA) was performed using SIMCA version 14 (Umetrics, Umeå, Sweden) software. We performed PCA and OPLS-DA for clustering individual C. nardus and C. citratus essential oil and their mixture. There are four groups of a sample, namely 100 % C. nardus: 100 % C. citratus, adulterated C. nardus with C. citratus (10 % and 25 % v/v).
In the PCA and OPLS-DA, we used absorbance data of NIR spectra as the variables in 4000–6500 cm−1. PCA was performed to cluster C. nardus and C. citratus essential oil. In the PCA, many variables are reduced into so-called principal components (PCs) that contain the most information in the data. In the OPLS-DA, we clustered pure C. nardus essential oil from adulteration with C. citratus essential oil. The OPLS-DA method can be applied to visualize variation between sample groups and determine the performance of differentiating variables. Ellipses on the plots define Hotelling's T2 confidence region, a generalization of multivariate t-tests and provides a 95 % confidence interval for observations (Uncu and Ozen, 2019).
3 Results and discussion
3.1 NIR spectra analysis
As shown in Fig. 1, the NIR spectra of C. nardus and C. citratus essential oil and their mixture exhibit a similar profile. It can be observed that the spectra of all essential oil are almost identical, which is made more challenging to identify and authenticate C. nardus essential oil from C. citratus essential oil only by visualizing the NIR spectra. The similarity in the NIR spectral profiles of essential oil from C. nardus and C. citratus can indicate the similarity in the metabolite compositions in each essential oil. However, differences are obtained in the NIR spectra, like their intensities. This arises since the samples collected come from various regions with different geographical conditions affecting metabolite composition. Various genetic, ontogenetic, morphogenic, and environmental factors can affect secondary metabolites biosynthesis and accumulation. Literature reports indicate that secondary metabolites accumulation is highly dependent on environmental factors such as light, temperature, soil moisture, soil fertility, and salt, with most plants having a single factor change (Yang et al., 2018).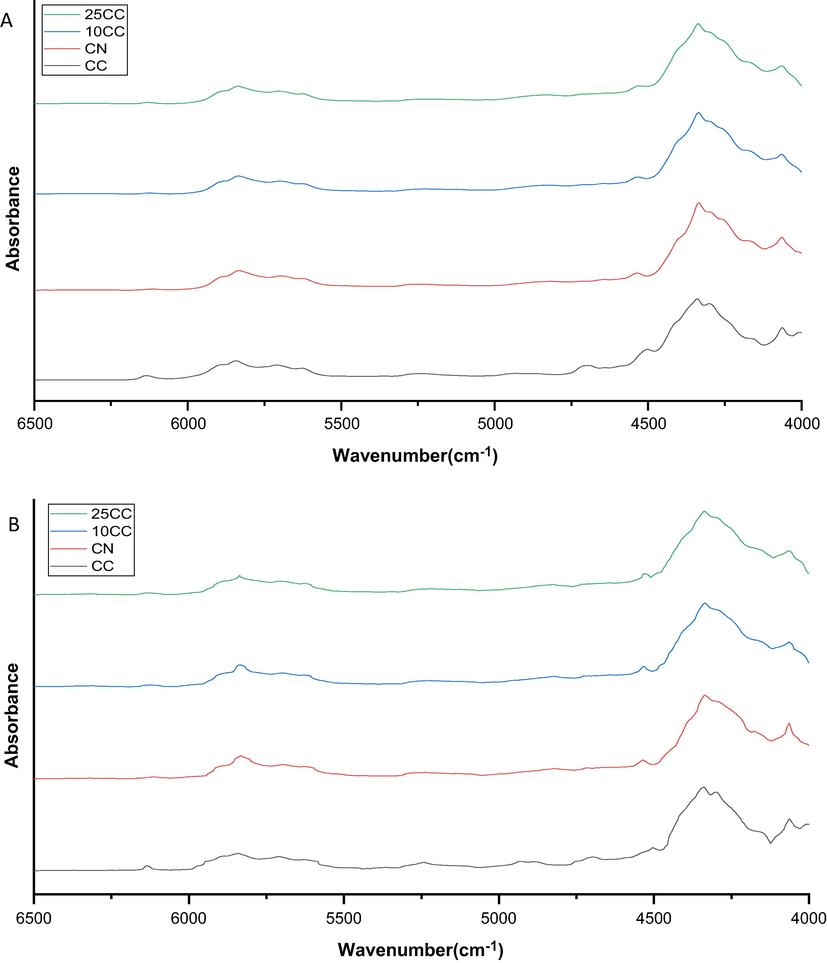
NIR Spectra before (A) and after preprocessing (B); (
 ) C. citratus, (
 ) C. nardus, (
 ) 10%-, and (line black) 25% C. citratus in C. nardus.
The peaks at wavenumbers 4064, 4336, 4504, 5248, 5836, and 6136 cm−1 are detected in most samples. However, there is a difference at the wavenumber of 4700 cm−1. Such as, in the C. citratus essential oil, this peak is detected, but in C. nardus essential oil and their mixture with C. citratus does not appear. We deduced that this wavenumber's peak comes from the NH functional group (Sheng et al., 2022). A peak detected at 4336 cm−1 is a stretching and bending from CH functional group, at 4504 cm−1 is a combined CH and OH functional group, at 5248 cm−1 comes from the C⚌O, and at a wavenumber of 6136 cm−1 identified as CH (Eldin, 2011).
The resulting NIR spectra with similar patterns will make it difficult to detect any adulterant in the essential oil of C. nardus. The overlapping spectrum will cause the loss of specific information regarding the functional groups. According to previous studies, the NIR spectrum of the analyzed essential oil samples was dominated by overtones and different combinations of CH strain and bending vibrations between 1000 and 2498 nm (Kuriakose et al., 2015). Further investigation is needed to determine the wavenumbers with important information for identifying and authentication of C. nardus essential oil. We found that absorbance data in the range 4000–6500 cm−1 could be used for clustering C. nardus, C. citratus, and their mixtures. Selection of the NIR range based on the wavenumber that generated the signal. in the area of 4000–6500 cm−1 produces a signal while outside that range does not give a signal. The choice of this wavenumber is due to the significant differences between the observed C. nardus and C. citratus essential oil NIR spectra. This selection also aims to reduce the number of insignificant variables and the complexity of the model. Therefore, more emphasis is placed on obtaining the required information through the optimal calibration model. Preprocessing of NIR data is also needed to clarify the differences in the spectra of each sample.
3.2 Clustering of C. nardus, C. citratus, and their mixture
Preprocessing of NIR spectra was performed before analyzing with multivariate analysis. Preprocessing helps reduce variations in data that do not affect information. It aims to get good results because the initial data's quality affects the final data's quality in the resulting analysis (Purwakusumah et al., 2014). Preprocessing performed on NIR spectra data is quantile normalized. Quantile normalized serves to push all observation data or data matrices into identical distributions. Quantile normalized is generally used for data that has thousands of variables, such as genomics and metabolomics data.
The PCA scores plot (Fig. 2) shows that the C. nardus and C. citratus essential oil could be distinguished, but the data is spread out. The PCA model gives an R2X(cum) of 0.956 and Q2 = 0.877. Based on those values, the resulting PCA is good because all values are above 0.5, and the difference between R2X(cum) and Q2(cum) is about 0.079 because it is lower than 0.2–0.3. Other parameters observed were the main components of PC-1 and PC-2. PC-1 is the axis that describes the highest variability among the data used in the test. At the same time, PC-2 is the second axis to explain more variability not described by PC1 and so on. PC-1 and PC-2 contributed about 50 % and 18 %, respectively. If the cumulative percentage of PC-1 and PC-2 from the two data is more than 70 %, the score plot could visualize the two dimensions well (Esteki et al., 2018).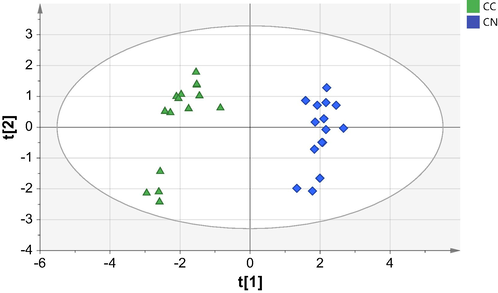
PCA score plot of essential oil from C. nardus (
 ) and C. citratus (
 ).
).
This study identified and authenticated C. nardus from C. citratus using NIR spectra combined with chemometrics analysis such as PCA and OPLS-DA. The PCA score plot obtained shows that the adulterated C. nardus essential oil is positioned between the two pure samples (Fig. 3). Each group could be distinguished, but the resulting data is spread out in its area and adulterated samples more closely to C. nardus pure essential oil. So, it will be challenging to authenticate C. nardus because pure and adulterated C. nardus is in a close position. Therefore, OPLS-DA multivariate analysis can be used for developing a precise and accurate authentication method to increase the separability of each group.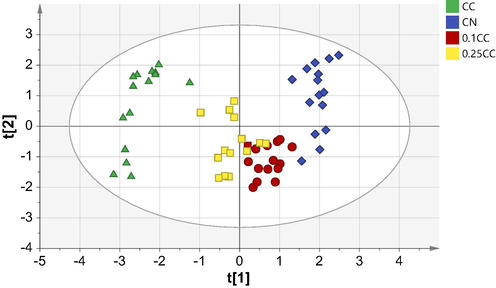
PCA score plot of essential oil from C. nardus (
 ), C. citratus (
 ), mixture of 10%- (
 ) and 25% of C. citratus in C. nardus (
 ).
).
Furthermore, the OPLS-DA model is formed, as shown in Fig. 4. The OPLS-DA method is a very efficient method for discrimination purposes. No outlier samples were detected in both PCA and OPLS-DA models; thus, C. citratus and C. nardus samples can be distributed in Hotelling's T2 ellipse. The OPLS-DA model produces a coefficient value of R2X(cum) = 0.88, R2Y(cum) = 0.859 and Q2(cum) = 0.723 and said to be good result. The OPLS-DA score plot describes a significant grouping where the groups are close to each other, distributed by the variables, and form a pattern of similarity within the group itself. Each sample does not deviate much from each group as in the PCA model. The OPLS-DA score plot shows cluster scattering as pure and adulterated samples. C. nardus can be distinguished well from C citratus. Also, adulteration of C. nardus with C. citratus can be separated from the pure essential oil of C. nardus.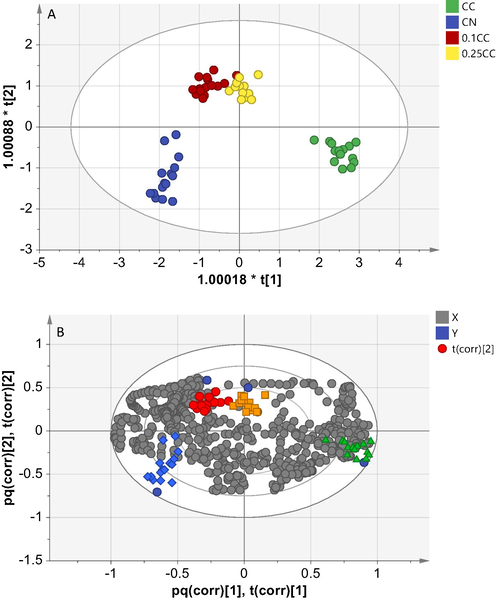
OPLS-DA score plot (A) and loading plot (B) of essential oil from C. nardus (
 ), C. citratus (
 ), mixture of 10 %- (
 ) and 25 % of C. citratus in C. nardus (
 ), variable X as wavenumber range (
 ) and variable Y as group of samples (
 ).
).
According to the OPLS-DA score plot (Fig. 4A), C. citratus is located on the right side of the score plot, and on the left side is C. nardus essential oil. Adulterated sample (10 % and 25 % C. citratus in C nardus) was also separated from the pure essential oil of C. nardus by the first latent variable explaining 36 % of the total variation. Furthermore, the variable important for the projection (VIP) was also evaluated to determine the most significant wavenumber in pure and adulterated C. nardus essential oil differentiation. The VIP parameter is increasingly preferred in the model evaluation because it provides the most concise model interpretation than loading weights and regression coefficients. VIP values greater than or close to 1 are considered influential in explaining the classification and prediction models (Uncu and Ozen, 2019). The highest VIP values for the constructed model were around 4000–4200 cm−1 and corresponded to the CH group's presence. This wavenumber is a marker for the adulterated samples (Fig. 4B). The grouping results show that all samples can be grouped into each group and the percentage of clustering using OPLS-DA is 100 % (Table 1).
Group
Members
Correct
C. nardus
C. citratus
10 % C. citratus in C. nardus
25 % C. citratus in C. nardus
C. nardus
15
100 %
15
0
0
0
C. citratus
15
100 %
0
15
0
0
10 % C. citratus in C. nardus
15
100 %
0
0
15
0
25 % C. citratus in C. nardus
14
100 %
0
0
0
14
No class
0
0
0
0
0
Total
59
100 %
15
15
15
14
Fisher prob.
7.3 × 10⁻²⁰
4 Conclusions
In this feasibility study, NIR spectroscopy combined with PCA and OPLS-DA using absorbance data from the wavenumber region of 4000–6500 cm−1 has been successfully applied to identify an authentic C. nardus from C. citratus essential oil. The developed method is fast, accurate, and reliable for detecting adulteration and can assist in essential oil quality. Based on the above findings, NIR spectra combined with chemometrics analysis can be used as a tool for qualitative analysis of adulteration in C. nardus essential oils. This technique can be an alternative in determining the counterfeit of C. nardus. Given that C. nardus essential oil is traded worldwide, a fast, inexpensive, and easy-to-use surveillance method is needed for fraud detection of C. nardus more efficiently.
CRediT authorship contribution statement
Mohamad Rafi: Conceptualization, Methodology, Investigation, Funding acquisition, Writing – review & editing. Antonio Kautsar: Investigation, Formal analysis, Writing – original draft. Dewi Anggraini Septaningsih: Investigation, Formal analysis, Writing – original draft. Puput Melati: Investigation, Formal analysis, Project administration. Rudi Heryanto: Conceptualization, Methodology, Funding acquisition, Writing – review & editing. Irmanida Batubara: Conceptualization, Methodology, Funding acquisition, Writing – review & editing. Utami Dyah Safitri: Conceptualization, Methodology, Validation, Visualization, Writing – review & editing. Zulhan Arif: Conceptualization, Methodology, Writing – review & editing. Nancy Dewi Yuliana: Methodology, Validation, Visualization, Writing – review & editing. Tohru Mitsunaga: Conceptualization, Writing – review & editing. Erni Susanti: Methodology, Investigation, Writing – review & editing.
Acknowledgment
The authors gratefully acknowledged the Ministry of Education, Culture, Research, and Technology of the Republic of Indonesia through Penelitian Program Flagship Prioritas Riset Nasional Research Grant for this research (No: 7468/IT3.L1/PT.01.03/M/B/2021). Also PT Buchi Indonesia for the NIR spectra measurement using FT-NIR N-500 Fiber Optic Solid with Transflectan Adapter.
Declaration of Competing Interest
The authors declare that they have no known competing financial interests or personal relationships that could have appeared to influence the work reported in this paper.
References
- Essential oil from Cymbopogon nardus and repellant activity against Aedes aegypti. Biodiversitas.. 2020;21(8):3873-3878.
- [CrossRef] [Google Scholar]
- Cymbopogon species; ethnopharmacology, phytochemistry and the pharmacological importance. Molecules. 2015;20:7438-7453.
- [CrossRef] [Google Scholar]
- Chemometrics: a new scenario in herbal drug standardization. J Pharm Anal.. 2014;4:223-233.
- [CrossRef] [Google Scholar]
- Classification and quantification of palm oil adulteration via portable NIR spectroscopy. Spectrochim. Acta - A: Mol. Biomol. Spectrosc.. 2017;173:335-342.
- [CrossRef] [Google Scholar]
- Detecting essential oil adulteration. J. Environ. Anal. Chem.. 2015;2(2):132.
- [CrossRef] [Google Scholar]
- Antifungal activity of Cymbopogon nardus (l.) Rendle (citronella) against Microsporum canis from animals and home environment. Rev Inst Med Trop Sao Paulo.. 2015;57(6):509-511.
- [CrossRef] [Google Scholar]
- Investigation of the adulteration of essential oils by GC-MS. Curr. Anal. Chem.. 2020;16(8):965-969.
- [CrossRef] [Google Scholar]
- Near Infra Red Spectroscopy. In: Akyar I., ed. Wide Spectra of Quality Control. London: Intechopen; 2011. p. :237-248.
- [Google Scholar]
- A review on the application of chromatographic methods, coupled to chemometrics, for food authentication. Food Control. 2018;93:165-182.
- [CrossRef] [Google Scholar]
- Attenuated total reflectance-FTIR spectra combined with multivariate calibration and discrimination analysis for analysis of patchouli oil adulteration. Indones. J. Chem.. 2020;20:1-8.
- [CrossRef] [Google Scholar]
- Application of chemometrics in authentication of herbal medicines: A review. Phytochem. Anal.. 2012;24:1-24.
- [CrossRef] [Google Scholar]
- Use of principal component analysis (PCA) and hierarchical cluster analysis (HCA) for multivariate association between bioactive compounds and functional properties in foods: A critical perspective. Trends. Food. Sci. Technol.. 2018;72:83-90.
- [CrossRef] [Google Scholar]
- Nondestructive measurement of total volatile basic nitrogen (TVB-N) in pork meat by integrating near infrared spectroscopy, computer vision and electronic nose techniques. Food Chem.. 2014;145:228-236.
- [CrossRef] [Google Scholar]
- Detection and quantification of adulteration in sandalwood oil through near infrared spectroscopy. Analyst.. 2010;135(10):2676-2681.
- [CrossRef] [Google Scholar]
- Development of a qualitative near infrared screening method for quality consistency assessment of virgin sunflower oil. Spectr. Anal. Rev.. 2017;5:25-36.
- [CrossRef] [Google Scholar]
- Identification and authentication of jahe merah using combination of FTIR spectrocopy and chemometrics. Agritech.. 2014;34:82-87.
- [CrossRef] [Google Scholar]
- Discrimination of cassava, taro, and wheat flour using near infrared spectroscopy and chemometrics. J. Sci. Appl. Chem.. 2020;23(10):360-364.
- [CrossRef] [Google Scholar]
- Near-Infrared Spectroscopy and Mode Cloning (NIR-MC) for In-Situ Analysis of Crude Protein in Bamboo. Remote Sens.. 2022;14:1302.
- [CrossRef] [Google Scholar]
- A comparative study of mid-infrared, UV–Visible and fluorescence spectroscopy in combination with chemometrics for the detection of adulteration of fresh olive oils with old olive oils. Food Control.. 2019;105:209-218.
- [CrossRef] [Google Scholar]
- Chemical composition of the essential oils of Cymbopogon citratus (DC.) Stapf grown in three locations in South India. J. Essent. Oil-Bear. Plants.. 2015;18230–235
- [CrossRef] [Google Scholar]
- Optimal extraction and evaluation on the oil content of citronella oil extracted from Cymbopogon nardus. Malaysian J. Anal. Sci.. 2015;19(1):71-76.
- [Google Scholar]
- Response of plant secondary metabolites to environmental factors. Molecules.. 2018;23(4):762-787. 10.3390/molecules23040762
- [Google Scholar]


