

Field method for estimation of fluoride in drinking groundwater by photometric measurement of spot on aluminium quinalizarin reagent paper
⁎Corresponding author. Address: Institute of Chemistry, Karl-Franzens University, Universitaetsplatz 1, 8010 Graz, Austria. zaher_bar@hotmail.com (Zaher Barghouthi)
-
Received: ,
Accepted: ,
This article was originally published by Elsevier and was migrated to Scientific Scholar after the change of Publisher.
Peer review under responsibility of King Saud University.

Abstract
A simple field method for determination of fluoride in drinking water using handmade fluoride reagent paper impregnated by aluminium quinalizarin complex was developed. Fluoride reacts with the impregnated reagent paper to release the free ligand with new colour, orange different from that of the complex. The change in the colour, which is proportional to the amount of fluoride, was measured by the Arsenator. The functionality of the Arsenator which is based on a photometric measurement of spot on the reagent paper is expanded to analyse fluoride. The method allows a reliable determination of fluoride in the range 0.0–2.0 mg L−1.
Further spectrophotometric determinations of fluoride showed that Beer’s law is obeyed in the range of 0.3–5.0 mg L−1 at 553 nm. Sensitivity, detection limit, quantitation limit, and the percentage recovery of 1.5 mg L−1 fluoride were found to be 0.117 μg mL−1, 0.1 mg L−1, 0.3 mg L−1, and 101.2 respectively.
Keywords
Fluoride analysis
Field method
Drinking water
Aluminium quinalizarin complex
Impregnated paper
Arsenator

1 Introduction
Fluoride is a natural element found at varying concentrations in all drinking water (Winston and Bhaskar, 1998). WHO (2006) has considered fluoride as one of the very few chemicals that have been shown to cause significant effects on people’s health through drinking water. There is a narrow margin between the desired and harmful doses of fluoride (Czarnowski et al., 1996; Barghouthi and Amereih, 2012a). WHO has set a limit value of 1.5 mg L−1 for fluoride in drinking water (WHO, 2004). The major health problems caused by fluoride when it is exceeding the limit value are dental fluorosis, teeth mottling, skeletal fluorosis and deformation of bones in children as well as in adults (Sunitha et al., 2004). Approximately 62 million people including 6 million children suffer from fluorosis (Singh, 2007; Meenakshi et al., 2004; UNICEF, 1999).
Most of the countries suffering from fluoride health problems are located in hot climate zone and belong to the third world (Barghouthi and Amereih, 2013). In some of these countries such as India people use their own water source (Rao et al., 2002). In such cases, testing the fluoride content at every water source is practically impossible by government laboratories. This illustrates the need for fast, simple, and effective field method which will eliminate the problems associated with the storage and transportation of the samples on the way to the lab (Barghouthi and Amereih, 2012b, 2013).
Determination of fluoride by test kits which are available in the market is based on the reaction between fluoride and fluoride coloured complex reagent solution, then measuring the change in the colour using colorimeter, simple photometer, or by comparing the colour intensity with the colour scale. This needs some previous preparation such as the adjustment of the pH, dilution of the sample, and measuring of the volume of the reagent sample. When the concentration of fluoride is determined by comparing the colour intensity with the colour scale, the accurate and reproducible results are limited by the eyesight of the analyst in addition to his experience. On the other hand, fluoride test kits based on ion selective electrode (ISE) are more expensive due to the need of the instrument. Moreover, the calibration of the electrode, and using of solutions such as fluoride standard solution limited its uses by non-skilled person (Barghouthi and Amereih, 2013).
The present work aimed to develop a simple field method for the determination of fluoride in drinking water in the range of 0.0–2.0 mg L−1 by using handmade fluoride reagent paper impregnated by aluminium quinalizarin complex and by expanding the functionality of the Arsenator to analyse fluoride. Therefore, the change in the colour due to the reaction of fluoride with the coloured complex on the impregnated paper is measured by the Arsenator, which is a portable digital photometer driven by a battery, blue diode as a source of light, and photodiode detector.
2 Experimental
2.1 Instrumentation
Beckman DU-7500 single beam spectrophotometer with 1.0 cm quartz cells was used for wavelength scanning and for spectral studies. Hitachi U-1500 UV/Vis single beam spectrophotometer with 1.0 cm quartz cells was used for the absorbance measurements at fixed wavelength. Arsenator is the first portable arsenic testing device in the field which has been developed by Prof. Walter Kosmus at the University of Graz and introduced to the world by Wagtech (WAG-WE10500) (Barghouthi and Amereih, 2013). In the present work, Arsenator is used for the determination of fluoride by measuring the changes in the colour due to the reaction between fluoride and the impregnated paper containing the fluoride reagent. Orion’s Portable 210A pH Metre with Orion Triode electrode was employed for the pH measurements. Heraeus T 5042 EK Heating Oven was used for drying the impregnated reagent paper.
2.2 Reagents
Quinalizarin (1,2,5,8-tetrahydroxyanthraquinone) provided by Merck, and aluminium chloride hexahydrate provided by Fluka were used without any further purification. All the chemicals were of analytical reagent grade except where stated otherwise. Solutions were prepared using double distilled water. Quinalizarin ligand solution and the aluminium complex solution were prepared using ethanol from Merck (reagent 96%). Standard fluoride stock solution was prepared by dissolving 0.1382 g of sodium fluoride provided by Merck in 250 mL water. The stock solution was further diluted as needed. Macherey–Nagel chromatography paper (MN 827) was used as impregnated reagent paper.
2.3 Preparation of the metal complexes solutions
Job’s method of continuous variation was adopted for determination of the composition of the coloured complex (Werner and Boltz, 1971a,b). Aluminium to quinalizarin ratio was also studied by preparing complexes with the most common molar ratios (1:1, 1:2, 1:3, 2:1, 3:1, 2:3, and 3:2) to enable comparison between the spectra of these different complexes. The blank is prepared by the same procedure using the solvent instead of the aluminium ionic solution. Aluminium to ligand ratio was found to be 2:1. Thus, the complex solutions for the spectrophotometric measurements were prepared as 2:1 ratios from aluminium and ligand of 1 × 10⁻³ M in ethanol solutions, and the solutions were then diluted to the concentration (≈2 × 10⁻⁴ M) suitable for the spectrophotometric measurements.
2.4 Reaction of the fluoride with the aluminium complex solutions
Various amounts of fluoride were added in the range 0–2 mg L−1 to 25 mL volumetric flask containing aluminium complex solution of quinalizarin in ethanol (2 × 10⁻⁴ M, 24.5 mL). The solution was completed to volume with water. The absorbance was measured using Hitachi U-1500 UV/Vis spectrophotometer at the wavelength of the maximum difference in the electronic spectra between the ligand and the complex (553 nm). The spectra for the reaction of different amounts of fluoride with the complex were compared.
2.5 Preparation of the fluoride handmade reagent paper
The impregnated paper was prepared by immersing the whole paper horizontally in the complex solution (5 × 10⁻³ M). The paper was immersed three times (each 30 s) and dried between every procedure in air at room temperature. Finally, the used solvent (ethanol) was evaporated by drying the paper in the oven for 20 min at 80 °C. The dried paper was cut into small strips (2 × 8 cm) to produce homogeneous impregnated strips. The stability of the impregnated papers was examined by measuring the Arsenator response at different time intervals during 4 weeks and the papers were stable.
2.6 Determination of fluoride using fluoride handmade reagent paper
The impregnated strips that contain fluoride reagent were immersed in 25 mL of water containing different fluoride concentrations (0.00, 0.50, 0.75 1.00, 1.25, 1.50, 1.75, 2.00 mg L−1). The changes in the colour of the strips due to the reaction between fluoride and the complex releasing free ligand (quinalizarin) were measured by inserting the impregnated strips into the Arsenator for 20 s and recording the Arsenator reading where non-impregnated white chromatography paper was used as the blank.
To minimize the differences between batches due to the using of handmade impregnated papers four labelled strips from different four batches were immersed in each fluoride concentration. The Arsenator reading was calculated as the average readings of four strips from four different batches.
2.7 Determination of fluoride in real drinking water samples
The method under investigation was tested using three real drinking water samples which had been collected and analysed by the Central Public Health Laboratory of the Ministry of Health, Palestine, which is responsible for managing water quality.
Samples were collected in September 2012 from two groundwater wells in Jenin District (Yamoon well and Saadeh well) and one groundwater well in Tulkarm District (Tulkarm well). Fluoride was analysed colourimetrically using SPADNS as fluoride reagent and Hack–DR/2010 as spectrophotometer. Nitrate, sulphate, chloride, and other characteristic data of the three samples are given in Table 1. According to the Ministry of Health, fluoride ranged between 0.2 and 0.8 mg L−1 in the West Bank groundwater resources (Salem, 2011). Fluoride was measured using the proposed spectrophotometric method and the proposed field method in real water samples after spiking the samples by 0.5 mg L−1 of fluoride. Therefore, fluoride was measured in the spiked water samples by immersing the prepared impregnated strip in the water sample for 2 s, waiting for one minute, then inserting the strip into the Arsenator for 20 s and recording the Arsenator reading. Finally, the obtained results were compared with that reported by the Central Public Health Laboratory using SPADNS method (Tables 1 and 2).
| Well | pH | Conductivity μS cm−1 | Fluoride mg L−1 | Nitrate mg L−1 | Chloride mg L−1 | Sulphate mg L−1 | TDS Mg L−1 | |
|---|---|---|---|---|---|---|---|---|
| Sample 1 | Yamoon | 7.28 | 841.00 | 0.46 | 4.50 | 186.00 | 54.00 | 420.00 |
| Sample 2 | Saadeh | 7.52 | 636.00 | 0.38 | 10.68 | 101.77 | 37.30 | 318.00 |
| Sample 3 | Tulkarm | 7.30 | 648.00 | 0.26 | 14.66 | 89.44 | 41.00 | 401.97 |
| Sensitivity [μg mL−1] | 0.117 ± 0.006 |
|---|---|
| Spectrophotometric method | |
| Detection limit [mg L−1] | 0.1 |
| Quantification limit [mg L−1] | 0.3 |
| Recovery of 1.0 mg L−1 % | 104.7 ± 4.9 |
| Recovery of 1.5 mg L−1 % | 101.2 ± 4.4 |
| Recovery of 2.0 mg L−1 % | 99.8 ± 3.8 |
| Recovery of sample 1 + 0.5 mg L−1 Fluoride % | 101.1 ± 3.1 |
| Recovery of sample 2 + 0.5 mg L−1 Fluoride % | 96.3 ± 4.7 |
| Recovery of sample 3 + 0.5 mg L−1 Fluoride % | 95.6 ± 3.7 |
| Field method using Arsenator | |
| Recovery of sample 1 + 0.5 mg L−1 Fluoride % | 78.4 ± 4.8 |
| Recovery of sample 2 + 0.5 mg L−1 Fluoride % | 74.3 ± 4.1 |
| Recovery of sample 3 + 0.5 mg L−1 Fluoride % | 72.1 ± 4.9 |
3 Results and discussion
High fluoride levels in water are found in different parts of the world, especially in the developing countries. In Kenya and South Africa, the levels can exceed 25 mg L−1 (UNICEF, 1999). In India, where concentrations up to 38.5 mg L−1 have been reported, endemic fluorosis has emerged as one of the most alarming public health problem all over the country (Singh, 2007; Meenakshi et al., 2004; UNICEF, 1999). Available statistics indicates that throughout China more than 42 million people are seriously afflicted by fluorosis and another 330 million are exposed to it (Wang et al., 2004). Fluorosis is highly prevalent to the high content of fluoride in drinking water in Sri Lanka (Dissanayake, 2005), Senegal (Brouwer et al., 1988), drilled wells in the Rift Valley in Ethiopia (Reimann et al., 2003), Central and Northern Mexico (Dozal et al., 2005), Eastern Turkey (Kilicalp et al., 2004; Güven and Kaya, 2005), and Estonia (Enn and Kadri, 2005). Combined arsenic and fluoride poisoning through drinking water also occurs and causes more severe toxicity, especially in India, China, and Bangladesh (Chinoy et al., 2004; Nair et al., 2004). Field methods are of high importance in countries such as India and Bangladesh where the source of drinking water is millions of shallow tubewells (Kinniburgh and Kosmus, 2002; Rao et al., 2002).
In light of the above, WHO guidelines recommended making mandatory the determination of fluorine and arsenic in drinking water. Because most of the countries with health problems related to these two elements belong to the third world, simple field methods are favoured. To determine arsenic a small handheld instrument called Arsenator based on a photometric measurement of reagent paper was developed and is now available. There is an urgent need to expand the functionality of this small instrument to analyse fluoride too. In order to achieve this the following constraints were taken into consideration: the analytical range (0–2 mg L−1) of the suggested method can allow sensitive and repeatable measurement of fluoride in drinking water compatible to WHO limit value of 1.5 mg L−1; a reddish colour for the reagent to get maximum sensitivity for the blue diode; minimum solubility of the reagent in water to avoid bleeding in the sample; simple usability of the method; stable under different climatic conditions like higher temperature and humidity; suitable for mass production; and the reagent should be non-toxic.
3.1 Selection of dye
Alizarin is an anthraquinone dye commonly used as spectrophotometric reagent for determination of fluoride (Jacobson and Weinstein, 1977; Cholak, 1959). Thus, searching for new fluoride reagent was started through this group of ligands with members containing functional groups capable of holding metals in stable combination. In the present work, these anthraquinone dyes were examined: Chrysazin (1,8-dihydroxyanthraquinone); 4,5-dinitrochrysazin; disperse blue 3; 1,4-diaminoanthraquinone; alizarin blue S; carmine; and quinalizarin. The maximum difference in the absorption spectra between that of examined anthraquinone dye and its aluminium complex were obtained with quinalizarin.
3.2 Quinalizarin and its aluminium complexes
An important member of the hydroxyanthraquinone group of dyes is 1,2,5,8-tetrahydroxyanthraquinone which is commonly known as quinalizarin (Fig. 1). It characterized by its tendency of forming colour chelates with various metal ions (Srivastava and Banerji, 1967). Therefore, it was the subject of study in hundreds of publications as very important analytical reagent and indicator for determination of many metals (Kumar et al., 2001). Quinalizarin is soluble in alkali hydroxide solutions, very slightly soluble in ethanol and even less soluble in water (Green, 1990; Newman, 1958).
- The chemical structure of quinalizarin (1,2,5,8-tetrahydroxyanthraquinone).
Quinalizarin exhibits orange colour in ethanol. Fig. 2 showed its electronic absorption spectra in the visible region where it displays one broad band with heads at 497 and 515 nm related to the hydroxyl groups. The high intensity of the broad peak suggests it to be π → π⁎ band and n → π⁎ weak transition band is obscured by the former band (Banerjie and Dey, 1981; Banerjie and Dey, 1979).
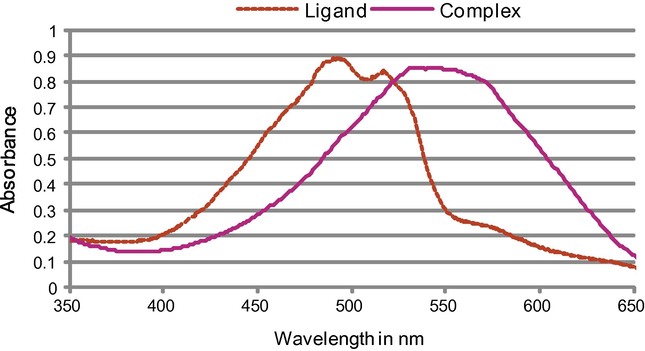
- Electronic spectra of quinalizarin and its aluminium 2:1 complexes in ethanol at 2 × 10⁻⁴ M.
The obtained results indicated that aluminium to quinalizarin ligand ratio can be 1:1, 1:2, 1:3, or 2:1. The presence of quinoid oxygen atoms, together with the hydroxyl groups in the 1-, 2-, 5-, and 8-positions, is resulting in two alternative positions where the chelation might occur. Either the chelation takes place between the phenolic oxygens or between quinoid oxygen and adjacent phenolic oxygen (Saxena and Saxena, 1978; Srivastava and Banerji, 1967). The reaction of aluminium quinalizarin 1:1, 1:2, 1:3, or 2:1 complexes with fluoride showed that the maximum difference in the absorption spectra occurred with the complex of 2:1 ratio. Therefore, further discussion will be focused on this complex.
The absorption spectra of the aluminium quinalizarin 2:1 complex in ethanol have one high intensive broad band in the visible region at 553 nm (Fig. 2). There is a bathochromic shift of about 56 nm after complexation with aluminium due to ligand to metal charge transfer, this leads to a change in the colour from the colour of quinalizarin, orange to the colour of the complex, pink. Moreover, there is a hyperchromic effect in the right side of the spectrum (Fig. 2) that leads to an increase in the absorbance. The molar absorptivity at 553 nm is 4405 ± 78 L mol−1 cm−1. The stability of the complex in ethanol solution was examined by measuring the absorbance of the solution at different time of intervals during 20 days and the complex is stable.
3.3 Reaction of aluminium quinalizarin complex with fluoride
Fluoride reacts with the pink aluminium quinalizarin 2:1 complex to produce a colourless aluminium fluoride complex by replacement of the quinalizarin by fluoride and liberating of the free orange quinalizarin ligand (Fig. 3) according to the equation below.

- Reaction of fluoride in the range 0.0–3.0 mg L−1 with 2 × 10⁻⁴ M of fluoride reagent.
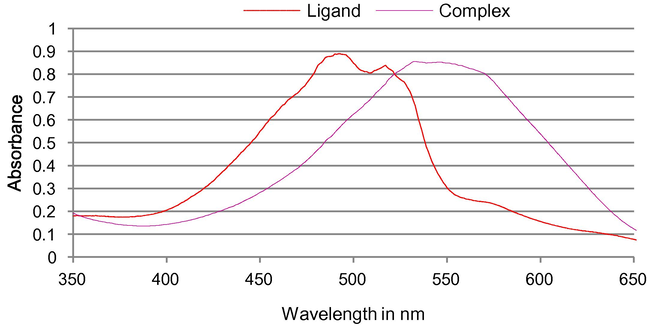
- Changes in the absorption spectra of the complex due to the addition of various amounts of fluoride.
The proposed spectrophotometric method was tested by measuring fluoride contents in water samples which had been already analysed by the Central Public Health Laboratory. The recovery of fluoride by the proposed method (Table 2) is in good agreement with fluoride values determined by the Central Public Health Laboratory using SPADNS colourimetric method (Table 1).
The sensitivity, detection limit, limit of quantification, and the recovery of 1.0, 1.5, and 2.0 mg L−1 F of the Al quinalizarin 2:1 complexes for the spectrophotometric determination of fluoride at 553 nm are given in Table 2. The sensitivity was taken as the average of the slope of the calibration curve for five replicates. The detection limit and the limit of quantification were calculated as 3.3 σ/S and 10 σ/S respectively, where σ is the standard deviation of response and S is the slope of the calibration curve. The recovery was measured as the average of 10 replicate.
3.4 Interferences
The interference studies were done by measuring the influence of the anions such as chloride, nitrate, and sulphate in such concentration commonly found in the natural water on the determination of 1.0 and 1.5 mg L−1 fluoride. Chloride and nitrate which were added in the range of 100–500 and 5–100 mg L−1 respectively do not interfere with the determination of fluoride. Sulphate interferes with the most visual and photometric methods for the determination of fluoride by its competition with fluoride to form a complex with the metal and therefore it results in higher concentrations (Ruzicka et al., 1966; Price and Walker, 1952). In the present work, sulphate up to 100 mg L−1 does not interfere with the determination of fluoride. However, when the amount of sulphate is higher than 100 mg L−1, it interferes with the determination of fluoride by causing a positive error of about 25%. This can be overcome by immersing the impregnated paper in barium nitrate solution (Dixon, 1970).
Interference may also be referred to the presence of metal ions that give a colour with the dye or to the presence of cations e.g. iron, zirconium, magnesium which form complexes with fluoride in competition with aluminium (Nishimoto et al., 2001; Dixon, 1970). However, metal ions from scarce sources are not expected in drinking water. The stability constants of the metal fluoride complexes are increased in this order: [CuFn]2−n < [MgFn]2−n [FeFn]3−n < [AlFn]3−n < [ZrFn]3−n (Ikens and Reilly, 1963). When the sample solution is expected to contain a large amount of these cations, and because of the high tendency of quinalizarin to form colour chelates with various metal ions (Snell, 1978; Srivastava and Banerji, 1967), it is recommended to mask the metal interferences by adding complexing agents such as DCTA (trans-1,2-aminocyclohexane-N,N,N′,N′-tetraacetic acid) (Nishimoto et al., 2001) or EDTA (ethylenediaminetetraacetic acid (Snell, 1978).
3.5 Determination of fluoride by handmade reagent paper
Fluoride test kits available in the market were discussed in our previous article (Barghouthi and Amereih, 2013), including using of fluoride coloured complex reagent solution; using of ion selective electrode (ISE); or comparing the colour intensity with colour scale, in addition to the few fluoride reagent papers which are mentioned in the literature for different purposes.
In the present work, the reagent paper impregnated by pink aluminium quinalizarin 2:1 complex was prepared as mentioned previously (experimental section). Fluoride, in the water sample, interacts with impregnated reagent paper to cause a change in the colour due to the formation of the colourless aluminium fluoride complex and the releasing of the orange free quinalizarin ligand. The change in the colour was measured using the Arsenator. The relationship between the Arsenator reading of the impregnated paper response and fluoride in mg L−1 was best described by a third-order polynomial function (Fig. 5), where the Arsenator response is directly proportional to the fluoride concentration, and the squared correlation coefficient R2, is 0.9977. Fluoride in the range 0.0–2.0 mg L−1 interacts with the aluminium 2:1 complex of quinalizarin to cause a bathochromic shift of about 0–56 nm depending on the fluoride concentration. The corresponding Arsenator response range is 25–43.

- Reaction between fluoride and impregnated reagent paper where the Arsenator number is the average of the readings of four strips from different batches.
Fluoride was measured using the proposed field method in three real water samples, and because of the low fluoride content in the West Bank’s groundwater, the samples were spiked by 0.5 mg L−1 of fluoride. The recovery of fluoride by the proposed field method is given in Table 2. The results in Table 2 are promising ones. It is recommended to provide the user by the range of safe (<40), doubtable (40–43), and unsafe (>43) fluoride content. Samples with questionable Arsenator reading (40–43) can be transferred to the lab to achieve an accurate fluoride determination. Moreover, it is better to provide 1.5 mg L−1 of fluoride solution as fluoride standard to enable the user to compare the Arsenator reading of the investigated water sample with the reading of the recommended WHO value.
Using a reagent paper instead of reagent solution, and with minimum previous preparation such as adjustment of the pH, dilution of the sample, or measuring of the volume of the reagent sample, the proposed method can be used easily in comparison with the available field methods. However, the widespread commercial use of this method in the future depends on the ability to overcome the limitations from which it suffers (Barghouthi and Amereih, 2013).
4 Conclusions
A simple field method for determination of fluoride in drinking water was developed by preparing new fluoride paper impregnated by aluminium quinalizarin 2:1 complex which has suitable solubility for preparing the impregnated paper. Fluoride reacts with the impregnated reagent paper to release the free ligand with new colour different from that of the complex. The change in the colour, which has been measured by the Arsenator, is proportional to the amount of fluoride in the water sample in the range 0.0–2.0 mg L−1 compatible to WHO limit value of 1.5 mg L−1. This might help to control the amount of fluoride in the countries suffering from the lack of laboratories, and to reduce the problems associated with transportation and storage of the samples in the hot zone area. By using a reagent paper instead of reagent solution, and with minimum previous preparation, the proposed method can be used in the field easily.
Acknowledgments
The author (ZB) thanks Professor Walter Kosmus from the Analytical Chemistry Institute in the University of Graz – Austria for his advices, suggestions, ideas, comments, helpful discussions, generous help with instruments & references, and for his supervision through the Ph. D research. The authors thank the director (Mr. Ibrahim Salem) and the staff of the Central Public Health Laboratory, Ramallah, for their cooperation and for sharing their data. The Austrian Exchange Service (ÖAD) is highly acknowledged for the scholarship (ZB).
References
- Coordination polymers of 1,2,5,8-tetrahydroxyanthraquinone. Die Makromol. Chem.. 1979;180:2133-2137.
- [Google Scholar]
- Visible spectrum of 1,2,5,8-tetrahydroxyanthraquinone. J. Nepal Chem. Soc.. 1981;1:100-102.
- [Google Scholar]
- Spectrophotometric determination of fluoride in drinking water using aluminium complexes of triphenylmethane dyes. Water SA. 2012;38:543-548.
- [Google Scholar]
- Field determination of fluoride in drinking water using a polymeric aluminium complex of 5-(2-carboxyphenylazo)-8-hydroxyquinoline impregnated paper. Int. J. Environ. Anal. Chem.. 2013;93:565-577.
- [CrossRef] [Google Scholar]
- Spectrophotometric determination of fluoride in groundwater using resorcin blue complexes. Am. J. Anal. Chem.. 2012;3:650-654.
- [CrossRef] [Google Scholar]
- Unsuitability of World Health Organization for fluoride concentration in drinking water in Senegal. Lancet. 1988;331:223-225.
- [Google Scholar]
- Arsenic and fluoride induced toxicity in gastrocnemius muscle of mice and its reversal by therapeutic agents. Fluoride. 2004;37:243-248.
- [Google Scholar]
- Fluorides: a critical review. II. Analysis of fluorides. J. Occup. Med.. 1959;1:648-654.
- [Google Scholar]
- Fluoride in drinking water and human urine in Northern and Central Poland. Sci. Total Environ.. 1996;191:177-184.
- [Google Scholar]
- Determination of micro amounts of fluoride with zirconium and solochrome cyanine R. Analyst. 1970;95:272-277.
- [Google Scholar]
- Dental fluorosis in rural communities of Chihuahua, Mexico. Fluoride. 2005;38:143-150.
- [Google Scholar]
- K-bentonites as a possible source of fluoride-rich groundwater in Estonia: first leaching experiments. Fluoride. 2005;38:236-237. Abstract number 23 XXXVIth ISFR Conference
- [Google Scholar]
- The Sigma–Aldrich handbook of stains, dyes and indicators. Milwaukee: Aldrich Chemical Company; 1990. pp. 604–605
- Effect of fluoride intoxication on lipid peroxidation and reduced glutathione in tuj sheep. Fluoride. 2005;38:139-142.
- [Google Scholar]
- Formation Constants of Metal Complexes. In: Meites L., ed. Handbook of Analytical Chemistry. New York: McGraw-Hill Book Company; 1963. p. :1-40.
- [Google Scholar]
- Sampling and analysis of fluoride: method for ambient air, plant, and animal tissues, water, soil and foods. J. Occup. Med.. 1977;19:79-87.
- [Google Scholar]
- Effects of chronic fluorosis on electrocardiogram in dogs. Fluoride. 2004;37:96-101.
- [Google Scholar]
- Arsenic contamination in groundwater: some analytical consideration. Talanta. 2002;58:165-180.
- [Google Scholar]
- Quinalizarin anchored on amberlite XAD-2. A new matrix for solid-phase extraction of metal ions for flame atomic absorption spectrometric determination. Fresen J. Anal. Chem.. 2001;370:377-382.
- [Google Scholar]
- The determination of microgram quantities of fluoride: the use of aluminium–eriochromecyanin complex. Anal. Chim. Acta. 1956;14:368-380.
- [Google Scholar]
- Groundwater quality in some villages of Haryana, India: focus on fluoride and fluorosis. J. Hazard Mater.. 2004;106 B:85-97.
- [Google Scholar]
- Beneficial effects of certain antidotes in mitigating fluoride and/or arsenic induced hepatotoxicity in mice. Fluoride. 2004;37:60-70.
- [Google Scholar]
- A spectrophotometric investigations of the reaction between fluoride and the complex of sodium quinalizarin sulphonate with aluminium. Anal. Chim. Acta. 1958;19:581-586.
- [Google Scholar]
- Solvent extraction and fluorometric determination of fluoride ion at ppb level in the presence of large excess of aluminum(III) and iron(III) by using an expanded porphyrin, sapphyrin. Anal. Chim. Acta. 2001;428:201-208.
- [Google Scholar]
- A simple field method for the estimation of fluoride in ground waters for common man’s use. Newsl. 2002;219:6-10.
- [Google Scholar]
- Drinking water quality in the Ethiopian section of the East African Rift Valley I-data and health aspects. Sci. Total Environ.. 2003;311:65-80.
- [Google Scholar]
- Determination of fluoride in bones and teeth with xylenol orange. Talanta. 1966;13:1341-1344.
- [Google Scholar]
- Salem, 2011, Personal Communication, 30 May 2011. Mr. Ibrahim Salem, Director, Central Public Health Laboratory, Ministry of Health, Ramallah, Palestine.
- Spectrophotometric studies on tributyl tin chloride and butyl tin trichloride with PNA [1-(2-pyridyl azo)-2-nabhthol], quinalizarin (1,2,5,8-tetrahydroxyanthraquinone), and alizarin red S (sodium salt of 1,2-dihydroxy-3-anthraquinone) sulphonic acid. J. Indian Chem. Soc.. 1978;55:79-83.
- [Google Scholar]
- National scenario of fluorosis: The visible villain. Indian J. Environ. Protection. 2007;27:740-750.
- [Google Scholar]
- Snell, F.D., 1978. Photometric and Fluorometric methods of analysis metals. John Willy & Sons, New York. pp. 41, 467, 659, 693, 1179, 1344, 1412, 1857, 1887, & 1916.
- Chelate formation between lead (II) and 1,2,5,8-tertahydroxyanthraquinone (quinalizarin): spectrophotometric studies of the composition and stability. Aust. J. Chem.. 1967;20:1385-1394.
- [Google Scholar]
- Luoride in ground water of Anantapur town, Anantapur District, Andhra Pradesh, India. J. Appl. Geochem.. 2004;6:368-372.
- [Google Scholar]
- Antagonistic effect of selenium on oxidative stress, DNA damage, and apoptosis induced by fluoride in human hepatocytes. Fluoride. 2004;37:107-116.
- [Google Scholar]
- Theory of continuous variations plots and a new method for spectrophotometric determination of extraction and formation constant. Anal. Chem.. 1971;43:1265-1272.
- [Google Scholar]
- Spectrophotometric determination of extraction constants of certain metal 1-pyrrolidinecarbodithioates. Anal. Chem.. 1971;43:1273-1277.
- [Google Scholar]
- Guidelines for Drinking-Water Quality. Recommendation (second ed.). Geneva: World Health Organization; 2004. pp. 375-377
- Fluoride in Drinking-Water. London: IWAPublishing; 2006. pp. 1–3, 83–95


