

Translate this page into:
Flow accelerated corrosion of X65 steel gradual contraction pipe in high CO2 partial pressure environments
⁎Corresponding author. zenglichaoting@163.com (Hanxin Chen)
-
Received: ,
Accepted: ,
This article was originally published by Elsevier and was migrated to Scientific Scholar after the change of Publisher.
Peer review under responsibility of King Saud University. Production and hosting by Elsevier.
Abstract
Flow accelerated corrosion (FAC) behavior of X65 steel gradual contraction pipe in high CO2 partial pressure environments was investigated by in situ dynamic high pressure electrochemical measurements with Ag/AgCl reference electrode in FAC loop and microscopic characterization analysis. The corrosion rates in dynamic high CO2 partial pressure environments are obviously enhanced compared with those in dynamic atmospheric pressure and static high pressure environments. The FAC mechanism at gradual contraction pipe in high pressure environments exhibits significant distinction from that in atmospheric pressure environments. The variation of corrosion rates is associated with the hydrodynamics at gradual contraction pipe. The presence of high CO2 partial pressure under fluid flowing accelerates rupture of corrosion product scales.
Keywords
Carbon steel
Flow accelerated corrosion
Gradual contraction pipe
High CO2 partial pressure

1 Introduction
With oil and gas exploitation in high-quality oil fields entering the middle and late stages, the increased water content and Cl- in produced water as well as the high partial pressure of corrosive gases such as CO2 and H2S in the transmission pipeline lead to extremely severe corrosion damage, thus resulting in wall thinning and even perforation of the pipelines, causing huge economic losses, serious environmental pollution and heavy casualties (Liu et al., 2014; Zhang et al., 2012; Ortega-Toledo et al., 2011). Especially under flowing environments, the interactions of flowing fluid and high pressure expedite the failure of pipelines (Nesic, 2007). The flowing fluid promotes the mass transfer process and worsens the corrosion product films. The CO2 partial pressure condition speeds up the cathodic depolarization before the film formation while enhances the film formation process when ferrous carbonate films have been formed on carbon steel substrates (Nesic and Lee, 2003; Elgaddafi et al., 2021).
Presently, three major methods are utilized to investigate high pressure corrosion mechanism under flowing conditions, i.e., high pressure impingement jet system (Hassani et al., 2012; Feyerl et al., 2008; Cai et al., 2013), high pressure rotor rotation system (Zhang et al., 2017; Wei et al., 2016; Li et al., 2019) and high pressure pipe loop system (Shadley et al., 1998). In both high pressure impingement jet system and high pressure rotor rotation system, the mass transfer process and hydrodynamic characteristics of species cannot be accurately reflected. In present study, a high pressure pipe loop system was established to realistically simulate the flow field under high pressure environments.
Traditionally, the CO2 corrosion researches under flowing condition in a high pressure pipe loop system were principally performed via weight-loss method combined with surface characterization analysis. In situ electrochemical measurements were seldomly adopted due to the enormous challenge of excellent sealing performance for the electrochemical testing device in dynamic high pressure environments. Nevertheless, FAC under high CO2 partial pressure condition is closely related to the electrochemical process. Even though in situ electrochemical measurements were used in a minority of researches (Hong and Jepson, 2001), corrosion electrochemical behavior cannot be reliably reflected by using so-called reference electrode such as stainless steel electrode during in situ electrochemical tests. Consequently, in situ electrochemical measurements with real reference electrode in a high pressure pipe loop system are absolutely essential to determine the FAC mechanism of the pipelines under high pressure condition.
In oil and gas pipeline transportation, pipes with different internal diameters might be applied to adjust the flow fluxes and production rates of transmission medium, thus optimizing production parameters and improving the economic efficiency. Furthermore, a threaded connection would also induce the variation in the internal diameters of the pipes. The contraction or expansion, which is generally designed to connect pipes with different sizes, is one of the indispensable components in pipeline configurations (Darihaki et al., 2019; Li et al., 2021). The fluid velocity and flow pattern experience dramatic variation when the fluid flows through the gradual contraction pipe, resulting in the gradual contraction pipe being extremely sensitive to the dynamic high pressure corrosion, thus leading to premature failure of pipelines with colossal security risk (Li et al., 2017). Consequently, it is of great significance to elucidate the high pressure FAC mechanism at the gradual contraction pipe for the safe operation of the oil and gas production. Zhong et al. (Zhong et al., 2020) studied the FAC behavior and its inhibition of a N80 steel gradual contraction tube under atmospheric pressure condition. The distribution of the corrosion rates at different locations of the gradual contraction pipe is associated with flow fields. However, the FAC mechanism as well as the evolution and destruction of corrosion product films under high pressure condition are obviously differential from that under atmospheric pressure condition.
In this paper, in situ electrochemical measurement device with Ag/AgCl reference electrode was set up in a high pressure pipe loop to ascertain FAC mechanism of X65 steel gradual contraction pipe in high pressure dynamic oilfield formation water environment. Scanning electron microscopy (SEM), X-Ray diffraction (XRD), and X-ray photoelectron spectroscopy (XPS) were utilized to ascertain morphology and composition of the corrosion product films. Computational fluid dynamics (CFD) was conducted to render the flow field distribution at the gradual contraction pipe.
2 Experimental
2.1 Specimens
In this work, cylindrical samples with diameter of 8 mm and height of 5 mm were machined from API X65 pipeline steel. The chemical composition (wt.%) of X65 pipeline steel is C 0.04%, Si 0.2%, Mn 1.5%, P 0.011%, S 0.003%, Mo 0.02%, and Fe balance. The area of each electrode exposed to corrosive fluid was 0.5 cm2. The back of each electrode was soldered to iron wire to guarantee electrical connection for realization of in situ electrochemical measurements. Before electrochemical measurements, the samples were firstly wet-ground with 800 grit SiC paper, then cleaned with deionized water and rinsed with alcohol, and finally air-dried.
2.2 Solution
The experimental solution in this study was made up from analytical grade reagent and deionized water, which contained 17.24 g/L NaCl, 0.54 g/L KCl, 0.43 g/L CaCl2, 0.37 g/L Na2SO4, 0.50 g/L MgCl2·6H2O and 3.98 g/L NaHCO3. The solution was prepared according to the composition of formation water produced in an oil field. Before the implementation of electrochemical measurements, the solution was de-aerated by continuously purging pure CO2 gas for 12 h to ensure CO2 saturation level. The ultimate pH was 6.38. During the electrochemical measurements, a continuous CO2 gas purge into the solution was preserved to guarantee the experimental pressure and CO2 saturation.
2.3 High pressure pipe loop apparatus
A high pressure pipe loop apparatus as shown in Fig. 1 was established to investigate FAC behavior at gradual contraction pipe under dynamic high pressure condition. The main components constituting the experimental apparatus include a high-pressure centrifugal pump, a liquid storage tank, a pressure gauge, a temperature control system, a flowmeter, pipes and a gradual contraction test section. The solution with the volume of 126 L was circulated by the high-pressure centrifugal pump. By altering the frequency of a speed controller to adjust revolution speed of the pump, a desired flow rate was obtained. Flow rate was measured by ultrasonic flowmeter after the gradual contraction test section. The high pressure pipe loop apparatus was machined from 316L stainless steel materials. The configuration of the gradual contraction test section with the length of 600 mm is schematically shown in Fig. 2. The inner diameters of the straight pipe before inclination segment and straight pipe after inclination segment were 70 mm and 40 mm, respectively. The lengths of both straight pipes were 267.5 mm. The inclination segment with an inclination angle of 13° connects the straight pipe with diameter of 70 mm and the straight pipe with diameter of 40 mm together. There were 2 electrodes in straight pipe before inclination segment, 4 electrodes in inclination segment, and 2 electrodes in straight pipe after inclination segment. Among them, electrode 1, 2, 3, and 4 were at the top of the gradual contraction test section, while electrode 5, 6, 7, and 8 were at the bottom of the gradual contraction test section. Electrode 1 and 5, 2 and 6, 3 and 7, 4 and 8 were symmetrical relative to the central plane of gradual contraction pipe, respectively.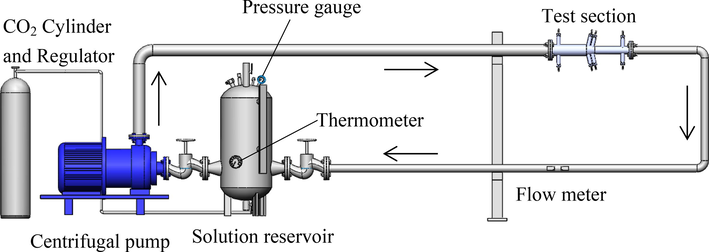
Schematic diagram of the high pressure flow accelerated corrosion loop system.
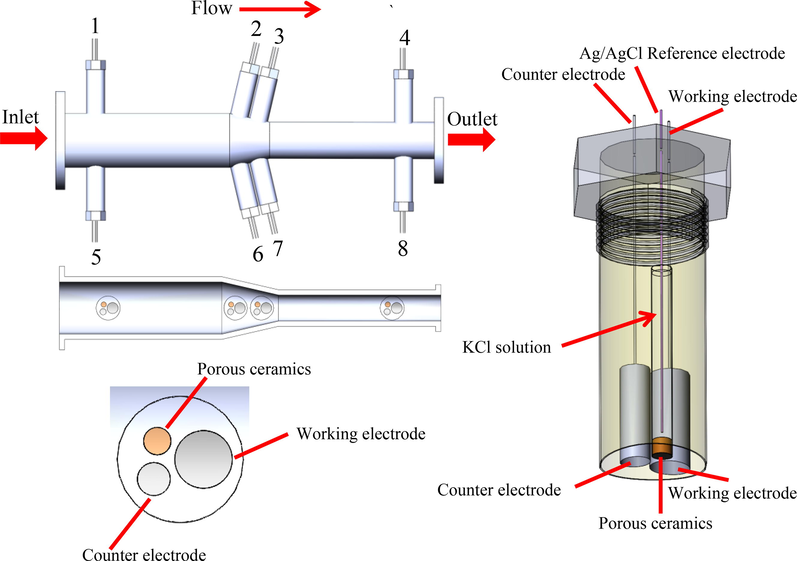
Schematic diagram of in situ electrochemical measurement device at gradual contraction test section under dynamic high CO2 pressure environments.
2.4 Electrochemical measurements of specimens
To precisely actualize in situ electrochemical measurements in high CO2 partial pressure FAC environments, an in situ electrochemical measurement device with Ag/AgCl reference electrode as shown in Fig. 2 was built in high pressure pipe loop apparatus. The device was a Teflon cylinder holder with a curved surface at the bottom to match with the internal surface of pipes. A three-electrode electrochemical cell was set up to conduct electrochemical measurements, where X65 carbon steel electrodes were utilized as working electrode, a Ag/AgCl electrode (filled with 1 mol/L KCl solution) was utilized as reference electrode, and a platinum cylinder was utilized as auxiliary electrode. For the reference electrode, a porous ceramics cap were squeezed in a Teflon cylinder fixture with epoxy resin, a home-made Ag/AgCl electrode was immersed into KCl solution at the other end. All the as-obtained potentials in the study were relative to Ag/AgCl reference electrode (1 mol/L KCl). Working electrodes and counter electrode were also squeezed into the Teflon cylinder fixture to ensure the exposed surfaces were flush with the internal surface of pipes. The distance between working electrode, reference electrode and counter electrode was 1 mm. Prior to the electrochemical measurements, the Teflon cylinder holder was mounted into the high pressure pipe loop system and the solution was quickly added by a submersible pump for FAC test. One more hour of CO2 gas flow was purged to eliminate oxygen in the loop system during the pretreatment process. Then the solution was rapidly heated to 60℃ and pressurized to 1 MPa. In present FAC environment, since the water vapor pressure at 60℃ is 0.02 MPa, which could be ignored compared with total pressure value, the total pressure was assumed to the CO2 partial pressure (Nor et al., 2011; Lin et al., 2006).
As electrochemical impedance spectroscopy (EIS) measurements at the frequency range from 100,000 Hz to 0.01 Hz for the 8 electrodes would take about 2 h, during which the surface state of electrodes would be altered. Therefore, EIS measurements at the frequency range from 10,000 Hz to 0.1 Hz were conducted at the tenth hour to obtain the corrosion rates, thus shortening the testing time to reduce experimental errors caused by differences in testing time-points among electrodes at different locations as much as possible. The testing time was about 25 min for total 8 electrodes. The measurements were performed under a sinusoidal alternating excitation signal of 10 mV at open circuit potential (OCP). Then the Stern-Geary equation was utilized to calculate corrosion rate. EIS measurements in the frequency from 100,000 Hz to 0.01 Hz and potentiodynamic polarization curves swept from −250 mV vs. OCP to 250 mV vs. OCP were performed to better understand the electrochemical corrosion mechanism. The sweeping rate of polarization curves was 1 mV/s. The FAC tests lasted for 12 h. The flow velocity at steady flow field region of the straight pipe with diameter of 40 mm was 4 m/s. For reference, experiments under dynamic atmospheric pressure (4 m/s, 0 MPa), static high pressure (0 m/s, 1 MPa) and static atmospheric pressure (0 m/s, 0 MPa) were also conducted.
2.5 Surface characterization of corrosion products
Special high pressure FAC tests were conducted for the characterization of the corrosion products on the sample surface. When high pressure FAC tests are completed, the samples that utilized for surface characterization analysis were quickly dismantled from loop apparatus, and the surface were washed with deionized water and anhydrous ethanol, and then dried with cold air. The surface morphologies of samples were determined by SEM. The chemical composition of corrosion products was ascertained by XRD and XPS. Cu Kα were utilized as irradiation source with sweep rate of 4°/min to determine XRD patterns. For XPS analysis, a monochromatic Al Kα was utilized as X-ray source. Prior to XPS measurement, the sample surface was sputtered by the depth of 20 nm with argon ion (Ar+) bombardment to remove the adventitious species adsorbed on the sample surface.
2.6 CFD simulation
The distribution of flow velocity and wall shear stress at gradual contraction pipe was simulated via CFD simulation with ANSYS FLUENT 15.0 software. Three-dimensional geometric model of gradual contraction pipe, which was determined according to the practical high pressure loop system, was built by DesignModeler software. Structured volume meshes of 0.004 m in size were utilized to construct girds. By an assumption that the fluid was incompressible, a k-ε turbulence model was adopted for numerical solution since Reynolds number of liquid (186668), which was noticeably higher than 4000, manifested a turbulence pattern in loop apparatus (Kaushik et al., 2012; Hu et al., 2017). Boundary conditions were velocity-inlet at the entrance and outflow at the exit of the pipe. The operating pressure was set as 1 MPa. The simulation was conducted under a single phase flow, which is the same with the condition of dynamic high pressure experiments. The convergence criterion of the residual by iterative computation was set as 1 × 10⁻¹⁰. During the computation of hydrodynamic characteristics, continuity equation, Navier-Stokes equations, k equation and equation are solved to obtain the desired hydrodynamic parameters. These equations are expressed as follows:
continuity equation:
k equation:
The grid independence verification as shown in Fig. 3 is implemented to ensure the reliability of CFD numerical simulation. It can be seen that there was no significant difference in the maximum wall shear stress when the number of grids reaches 3.62 × 10⁴. Consequently, the quantity of grids is selected as 3.62 × 10⁴ during the simulation. The computation will be converged at a stable level after 4000 steps iteration.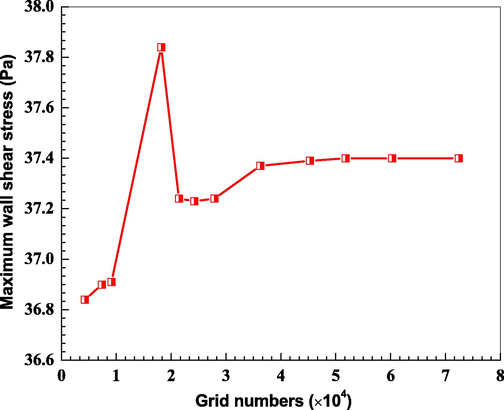
Relationships between the maximum wall shear stress and the grid numbers.
3 Results
3.1 Distribution of corrosion rate
Fig. 4 shows the Distribution of polarization resistance of X65 carbon steel electrodes at gradual contraction pipe obtained via EIS measurements by three experiments. It can be seen that the polarization resistances at the top of the gradual contraction test section are symmetrical with those at the bottom under both dynamic high pressure and dynamic atmospheric pressure conditions. The polarization resistances decrease along the gradual contraction pipe at 4 m/s and 1 MPa, with the highest value presented at the straight pipe before inclination segment and the lowest value presented at the straight pipe after inclination segment. However, the polarization resistances increase along the gradual contraction pipe at 4 m/s and atmospheric pressure, with the maximum value presented at the straight pipe after inclination segment and the minimum value presented at the straight pipe before inclination segment. The polarization resistances at 4 m/s and 1 MPa are much smaller than those at 4 m/s and atmospheric pressure by comparison. The polarization resistances at static and 1 MPa are higher than those at 4 m/s and 1 MPa, but is much lower than those at static and atmospheric pressure.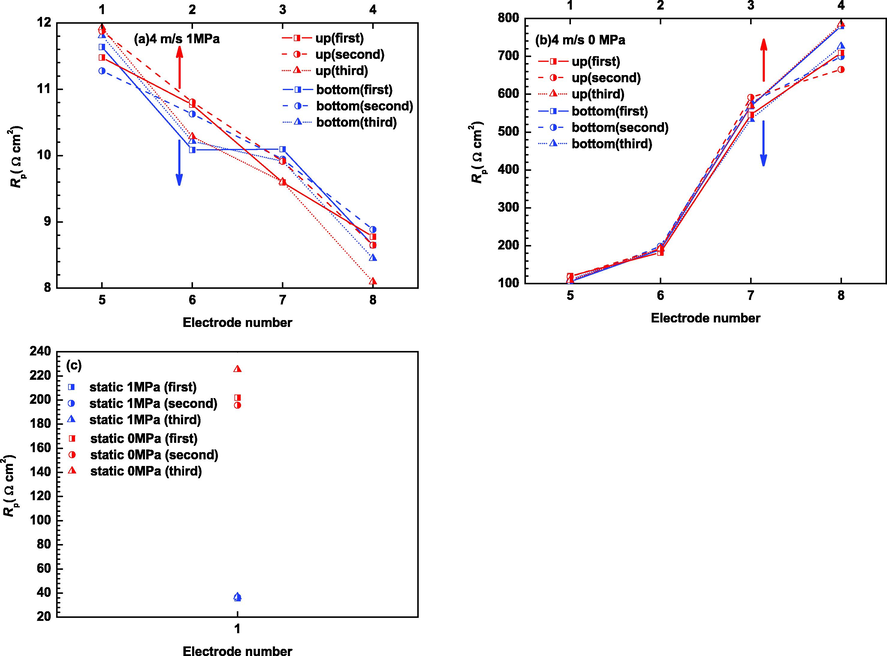
Distribution of polarization resistance of X65 carbon steel electrodes at gradual contraction pipe obtained by EIS measurements: (a) 4 m/s, 1 MPa; (b) 4 m/s, 0 MPa and (c) static, 1 MPa and static, 0 MPa.
Fig. 5 shows distribution of corrosion rates of X65 carbon steel electrodes (obtained through EIS measurements) at gradual contraction test section. The fitting error for Rct and Rf was ensured to be less than 3 %. Additionally, the error of Tafel fit between the fitting data and measured data of polarization curves was ensured to be less than 1%. The quite low error of EIS fitting and polarization curves fitting indicate a high accuracy of the corrosion rate values calculated according to Stern-Geary equation. The corrosion rate at top and bottom of the gradual contraction test section is nearly symmetrical relative to the central plane of pipe under dynamic condition, and almost no differences in corrosion rate between top and bottom were noticed. The corrosion rate ascends along the fluid flow direction under dynamic high pressure condition. The highest corrosion rate of 5613.0 µg/(cm2 h) appears at the straight pipe after inclination segment and lowest corrosion rate of 3993.4 µg/(cm2 h) appears at the straight pipe before inclination segment. Nevertheless, the corrosion rate decreases along the fluid flow direction in dynamic atmospheric pressure condition. The maximum corrosion rate (303.2 µg/(cm2 h)) occurs at the straight pipe before inclination segment while the minimum corrosion rate (44.0 µg/(cm2 h)) occurs at the straight pipe after inclination segment. The corrosion rate distribution in dynamic high pressure environments is quite different from that in dynamic atmospheric pressure environments. Moreover, the corrosion rate of X65 carbon steel at gradual contraction test section is considerably high under high pressure condition, which is one and even two order of magnitude higher than atmospheric pressure condition in both dynamic and static environment. In high pressure CO2 environment, the corrosion rate in dynamic environments is obviously higher than that (1149.4 µg/(cm2 h)) in static state. Nevertheless, in atmospheric pressure environment, the corrosion rate under static condition (157.0 µg/(cm2 h)) is between the range from the minimum corrosion rate and maximum corrosion rate under flow condition. The enhanced CO2 partial pressure ascends the concentration of H+, H2CO3 and HCO3−, thus expediting cathodic corrosion process of X65 carbon steel.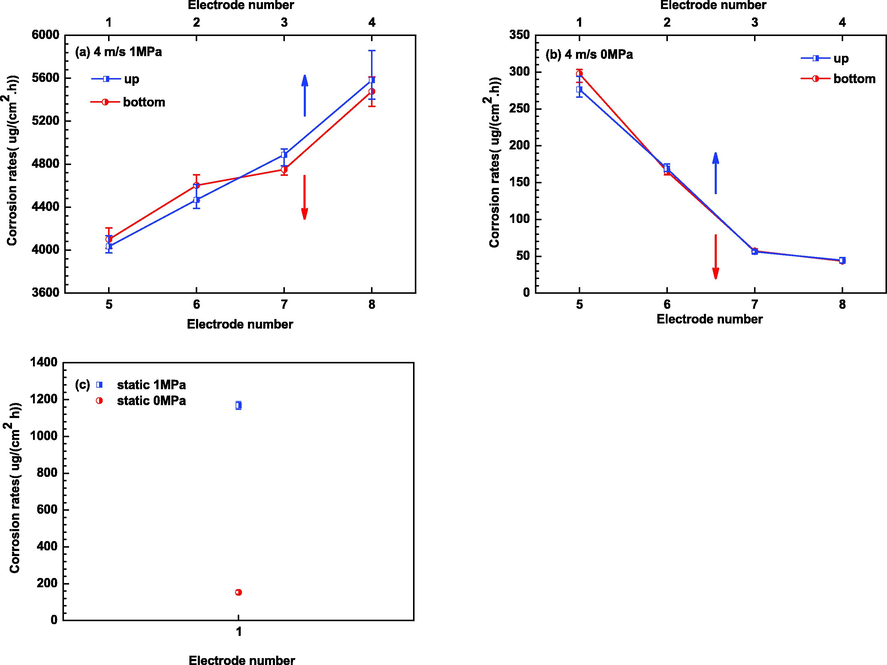
Distribution of corrosion rates of X65 carbon steel electrodes at gradual contraction pipe: (a) 4 m/s, 1 MPa; (b) 4 m/s, 0 MPa and (c) static, 1 MPa and static, 0 MPa.
3.2 Electrochemical impedance spectroscopy measurements
EIS measurements were conducted to obtain the corrosion rate at higher frequency range (10,000 Hz to 0.1 Hz) and the electrochemical corrosion mechanism at wider frequency range (100,000 Hz to 0.01 Hz). The EIS of electrode 5, the representative electrode, are presented in Fig. 6. There is no difference between EIS measurements with frequency from 10,000 Hz to 0.1 Hz and EIS measurements with frequency from 100,000 Hz to 0.01 Hz since the charge transfer resistances would be same after fitting. EIS of X65 carbon steel electrodes at gradual contraction pipe is shown in Fig. 7 under high CO2 partial pressure condition, the Nyquist plots of X65 carbon steel are featured by two time constants, i.e., a capacitive arc in high frequency and an inductive arc in low frequency at 4 m/s. The capacitive arc in high frequency should be related to interfacial charge transfer reaction during FAC tests, the inductive arc in the fourth quadrant at low frequency should be correlated with the adsorbed intermediate product (FeOH)ads on the steel surface. However, the Nyquist plots are featured by three time constants, i.e., a capacitive arc in high frequency, an inductive arc in intermediate frequency and a capacitive arc in low frequency under static condition. The capacitive arc in high frequency should be ascribed to interfacial charge transfer reaction during FAC tests, the inductive arc should be associated with the adsorption of intermediate product (FeOH)ads on the electrode surface, and the capacitive arc in low frequency should be related to the formation of corrosion product film (Henriquez et al., 2013; Zhang et al., 2012). In dynamic atmospheric pressure environments, the Nyquist plots of electrode 1, 2, 5 and 6 are featured by one time constants with a capacitive arc in the full frequency range. While the Nyquist plots of electrode 3, 4, 7 and 8 are featured by squashed capacitance arc with a capacitance arc in high frequency and a capacitance arc in low frequency merging together. In static atmospheric pressure state, the Nyquist plots are featured by double capacitive arcs. Under high pressure conditions, the cracks formed by the high inner stress within scales serve as a tunnel for the transportation of corrosive species from the bulk solution to the steel surface. The dissolution of Fe follows consecutive reaction mechanisms with adsorption of intermediate product (FeOH)ads on the bare steel parts. Therefore, inductive arc could be observed under high pressure conditions. However, under atmospheric pressure conditions, corrosion products without cracks provide better protection for the steel substrates, thus no inductive arc could be observed on the steel surface. The consecutive reaction mechanisms are described by Eqs. (7-9) (Guo et al., 2012; Farelas et al., 2010):
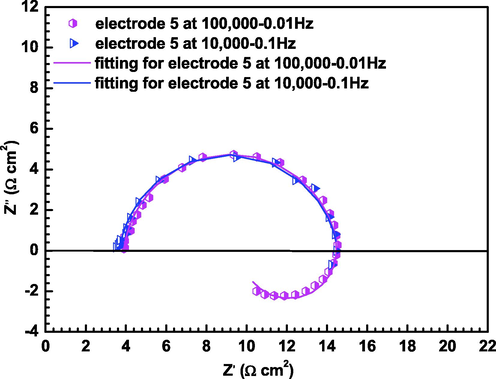
Nyquist plots for electrode 5 at the frequency range from 10,000 Hz to 0.1 Hz and the frequency range from 100,000 Hz to 0.01 Hz at 4 m/s and 1 MPa.
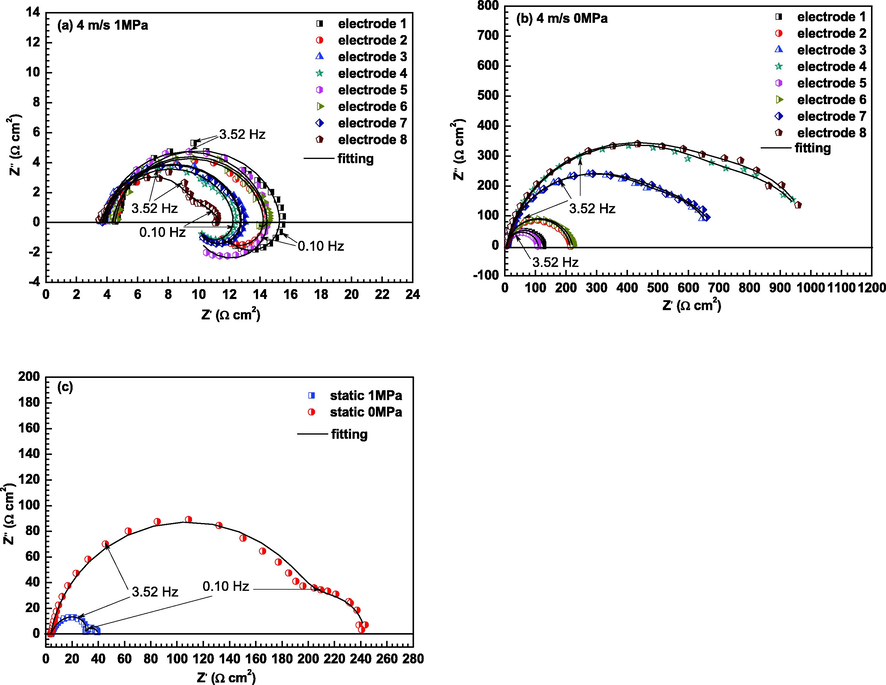
EIS of X65 carbon steel electrodes at gradual contraction pipe under different conditions: (a) 4 m/s, 1 MPa; (b) 4 m/s, 0 MPa and (c) static, 1 MPa and static, 0 MPa.
The electrochemical equivalent circuits shown in Fig. 8 are utilized for EIS parameter fitting, where Rs is solution resistance, CPE is constant phase element, Rct is charge transfer resistance, RL is inductance resistance, L is inductance, Rf is resistance of corrosion product film.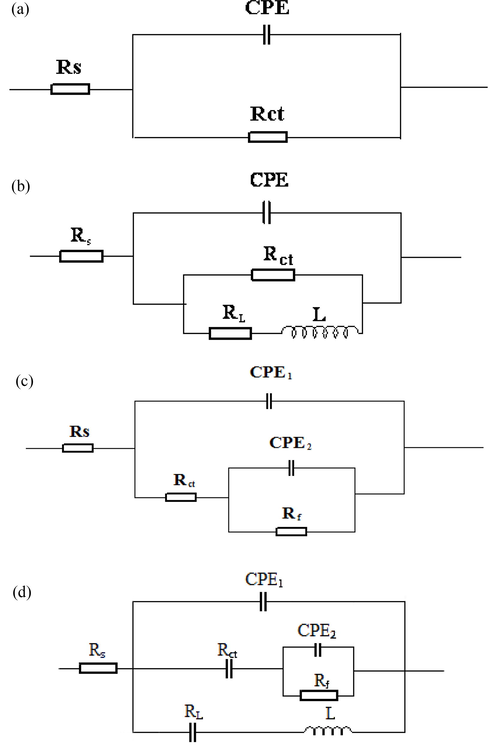
Electrochemical equivalent circuits for EIS fitting: (a) for the EIS measured at the frequency range from 10,000 Hz to 0.1 Hz (except on the electrode 4 and 8 with 4 m/s, 0 MPa) and the EIS measured on electrode 1, 2, 5 and 6 with 4 m/s, 0 MPa at the frequency range from 100,000 Hz to 0.01 Hz, (b)for the EIS measured with 4 m/s, 1 MPa at the frequency range from 100,000 Hz to 0.01 Hz, (c) for the EIS measured on electrode 4 and 8 with 4 m/s, 0 MPa at the frequency range from 10,000 Hz to 0.1 Hz, the EIS measured on electrode 3, 4, 7 and 8 with 4 m/s, 0 MPa at the frequency range from 100,000 Hz to 0.01 Hz and the EIS measured with static, 0 MPa at the frequency range from 100,000 Hz to 0.01 Hz, (d) for the EIS measured with static, 1 MPa at the frequency range from 100,000 Hz to 0.01 Hz.
The fitted EIS parameters of X65 carbon steel electrodes are illustrated in Table 1. The polarization resistance (Rct + Rf) in high pressure environments is much smaller (one and even two order of magnitude smaller) than that in atmospheric pressure environments, indicating a remarkable higher corrosion rate in high pressure environments. Furthermore, in high CO2 partial pressure environments, the polarization resistance in flow environments is smaller than that in static state. It is noticed that the polarization resistance of electrode 3, 4, 7 and 8 is quite high compared with that electrode 1, 2, 5 and 6 under dynamic atmospheric pressure condition, which indicates a significant low corrosion rate attributed to the formation of protective corrosion product film on the surface of electrode 3, 4, 7 and 8.
Electrodes
Qdl(×10-6
Ω-1 cm-2 sn1)n1
Rct
(Ω cm2)
Qf(×10-3
Ω-1 cm-2 sn2)n2
Rf
(Ω cm2)
RL
(Ω cm2)L (H/cm2)
4m/s 1MPa
1
6049+230 -197
0.90+0.01 -0.01
10.91+0.12 -0.20
19.64+1.56 -0.93
178.1+8.5 -4.6
2
8040+277 -305
0.90+0.01 -0.01
10.08+0.24 -0.30
20.68+2.78 -1.67
164.9+5.8 -7.6
3
9035+333 -376
0.89+0.01 -0.01
9.31+0.16 -0.06
18.73+1.77 -2.34
154.6+7.6 -6.5
4
9847+362 -298
0.89+0.01 -0.01
8.48+0.16 -0.27
19.93+2.55 -2.17
141.4+8.2 -4.9
5
5524+185 -253
0.92+0.01 -0.01
10.72+0.19 -0.25
12.92+1.25 -1.46
135.9+8.3 -5.6
6
2506+134 -101
0.91+0.02 -0.01
10.14+0.26 -0.18
149.9+9.7 -6.8
608.9+30.3 -23.4
7
8634+279 -342
0.89+0.01 -0.01
9.15+0.10 -0.07
18.56+1.56 -1.01
151.5+11.7 -8.8
8
5404+225 -268
0.80+0.02 -0.01
7.06+0.18 -0.17
10.48+1.11 -1.53
0.3+0.05 -0.05
4m/s 0MPa
1
871.8+40.7 -35.4
0.90+0.01 -0.01
120.5+3.9 -5.8
2
514.3+28.5 -20.8
0.90+0.01 -0.01
207.9+3.6 -3.5
3
190.7+5.4 -6.8
0.91+0.01 -0.01
552.5+22.1 -23.0
4.589+0.177 -0.138
1+0.00 -0.00
125.2+2.3 -3.1
4
137.0+3.9 -2.4
0.80+0.01 -0.02
804.6+63.2 -52.5
3.408+0.151 -0.181
1+0.00 -0.00
191.4+3.2 -3.6
5
959.9+39.2 -46.7
0.91+0.01 -0.01
105.0+3.2 -1.8
6
511.4+32.9 -23.7
0.89+0.01 -0.01
215.6+4.8 -2.9
7
176.1+6.6 -3.7
0.90+0.01 -0.01
548.1+17.1 -23.7
3.762+0.167 -0.155
0.88+0.01 -0.01
150.7+2.8 -4.2
8
155.0+4.1 -6.2
0.89+0.01 -0.01
811.9+42.5 -32.8
2.929+0.135 -0.140
1+0.00 -0.00
189.1+3.8 -3.4
Static 1MPa
1
2407+151 -137
0.80+0.02 -0.01
27.50+0.54 -0.62
464.7+25.3 -19.7
1+0.00 -0.00
8.20+0.15 -0.20
16.42+0.98 -1.52
0.8+0.10 -0.06
Static 0MPa
1
688.8+20.8 -14.5
0.89+0.01 -0.01
207.2+13.6 -9.6
87.43+3.1 -2.2
1+0.00 -0.00
32.1+0.45 -0.52
3.3 Potentiodynamic polarization curves
The polarization curves of X65 carbon steel electrodes at gradual contraction pipe under different conditions are shown in Fig. 9. Both anodic and cathodic process are principally under activation control under all the condition (Tang et al., 2017; Liu et al., 2014). Under dynamic high pressure condition, the anodic current densities increase while there is no significant variation in cathodic current densities along fluid flow condition. The increase of anodic current density promotes the enhancement of corrosion current density along fluid flow direction. However, under dynamic atmospheric pressure condition, both the anodic current densities and cathodic current densities decrease remarkably along fluid flow condition. As a consequence, corrosion current densities become smaller along fluid flow condition. By fitting the experimental data, the corresponding electrochemical parameters are tabulated in Table 2. Under dynamic high pressure condition, a slight negative shift of corrosion potential and a rise of corrosion current density are obtained along fluid flow direction. While under dynamic atmospheric pressure condition, a slight positive shift of corrosion potential and a fall of corrosion current density are obtained along fluid flow direction. The corrosion potential under high CO2 partial pressure condition exhibits apparent positive shift compared with those under atmospheric pressure condition. Besides, the anodic Tafel Slopes (corresponding to the values of ba) under high CO2 partial pressure condition are larger than those under atmospheric pressure condition, which demonstrates that the anodic processes are strengthened with worse protection of corrosion products film in high CO2 partial pressure environments. The corrosion current density in dynamic high pressure environments is obviously higher than that (9.91 × 10⁻⁴ A/cm2) in static high pressure state. Nevertheless, the value under static atmospheric pressure condition is within the range of corrosion current density under dynamic atmospheric pressure condition. The variation of corrosion current density is consistent with the result of distribution of corrosion rates of X65 carbon steel electrodes at gradual contraction pipe.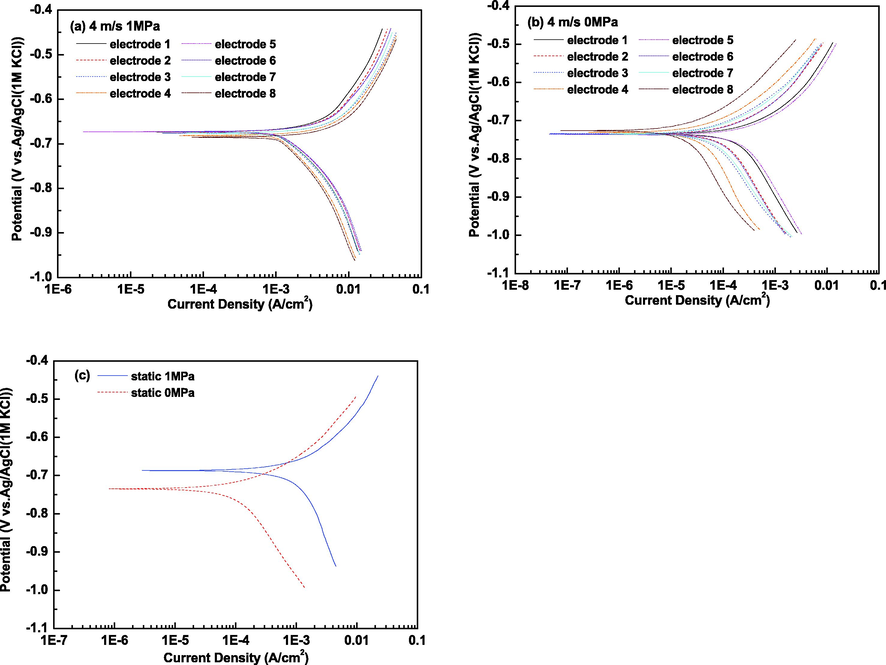
Polarization curves of X65 carbon steel electrodes at gradual contraction pipe under different conditions: (a) 4 m/s, 1 MPa; (b) 4 m/s, 0 MPa and (c) static, 1 MPa and static, 0 MPa.
Electrodes
Ecorr(Vvs. Ag/AgCl
(1M KCl))
Icorr(A/cm2)
ba(mV/dec)
bc(mV/dec)
4m/s 1MPa
1
-0.673+0.003 -0.005
(3.99+0.14 -0.09)×10-3
224+4 -6
-198+5 -5
2
-0.674+0.003 -0.003
(4.49+0.12 -0.11)×10-3
214+5 -3
-200+7 -4
3
-0.676+0.002 -0.003
(6.01+0.09 -0.08)×10-3
216+3 -4
-199+4 -6
4
-0.682+0.004 -0.003
(6.16+0.11 -0.10)×10-3
218+5 -6
-212+3 -5
5
-0.673+0.005 -0.003
(4.44+0.13 -0.15)×10-3
195+7 -4
-196+5 -4
6
-0.673+0.002 -0.002
(4.45+0.07 -0.10)×10-3
197+7 -5
-194+4 -3
7
-0.676+0.002 -0.003
(6.13+0.04 -0.07)×10-3
234+4 -4
-201+6 -4
8
-0.684+0.003 -0.003
(7.10+0.10 -0.09)×10-3
235+5 -7
-217+3 -3
4m/s 0MPa
1
-0.735+0.005 -0.003
(3.29+0.03 -0.02)×10-4
116+3 -2
-215+8 -6
2
-0.735+0.004 -0.003
(1.54+0.03 -0.03)×10-4
108+4 -3
-212+3 -4
3
-0.734+0.002 -0.002
(7.66+0.01 -0.02)×10-5
96+5 -3
-192+6 -4
4
-0.730+0.004 -0.003
(4.96+0.02 -0.01)×10-5
95+4 -5
-234+7 -8
5
-0.737+0.002 -0.003
(3.93+0.02 -0.02)×10-4
117+6 -4
-207+3 -4
6
-0.736+0.002 -0.003
(1.58+0.03 -0.02)×10-4
111+3 -5
-210+5 -5
7
-0.735+0.005 -0.004
(9.81+0.01 -0.01)×10-5
101+3 -4
-192+7 -4
8
-0.726+0.002 -0.001
(2.70+0.01 -0.01)×10-5
102+4 -4
-224+8 -5
Static 1MPa
1
-0.688+0.003 -0.003
(9.91+0.03 -0.03)×10-4
141+2 -3
-278+6 -7
Static 0MPa
1
-0.735+0.003 -0.003
(1.51+0.02 -0.02)×10-4
103+5 -4
-216+5 -3
3.4 SEM, XRD and XPS microscopic characterization analysis
The SEM surface morphologies of representative X65 steel electrodes at gradual contraction pipe under different conditions are shown in Fig. 10, where electrode 1 locates at the straight pipe before inclination segment and electrode 4 locates at the straight pipe after inclination segment, respectively. It can be seen that relatively discrete crystals are scattered on the underlying amorphous scales with rough and cracked surface at the straight pipe before inclination segment (electrode 1) under dynamic high pressure condition. The formation of cracks should be attributed to high inner stress within scales (Gao et al., 2008). However, porous and loose corrosion products, which are non-protective, are uniformly spread on the steel substrates at the straight pipe after inclination segment (electrode 4) under dynamic high pressure condition. The surface morphology under dynamic atmospheric pressure condition is apparently distinctive from that under dynamic high pressure condition. It can be seen that the surface were covered with elongated crystals under dynamic atmospheric pressure condition. The scales are composed of separated crystals at the straight pipe before inclination segment (electrode 1) while the scales at the straight pipe after inclination segment (electrode 4) are comprised of relatively dense crystals. The surface morphology in static high pressure state is similar with that in dynamic high pressure environments with crystal grains being distributed on cracked amorphous scales. However, the crystal grains are finer and denser and less cracks with smaller size are observed on the surface in static high pressure environments, which will afford better protection to steel substrates (Kinsella et al., 1998; Elgaddafi et al., 2015). In static atmospheric pressure environments, lamellar scales are homogeneously covered on the surface.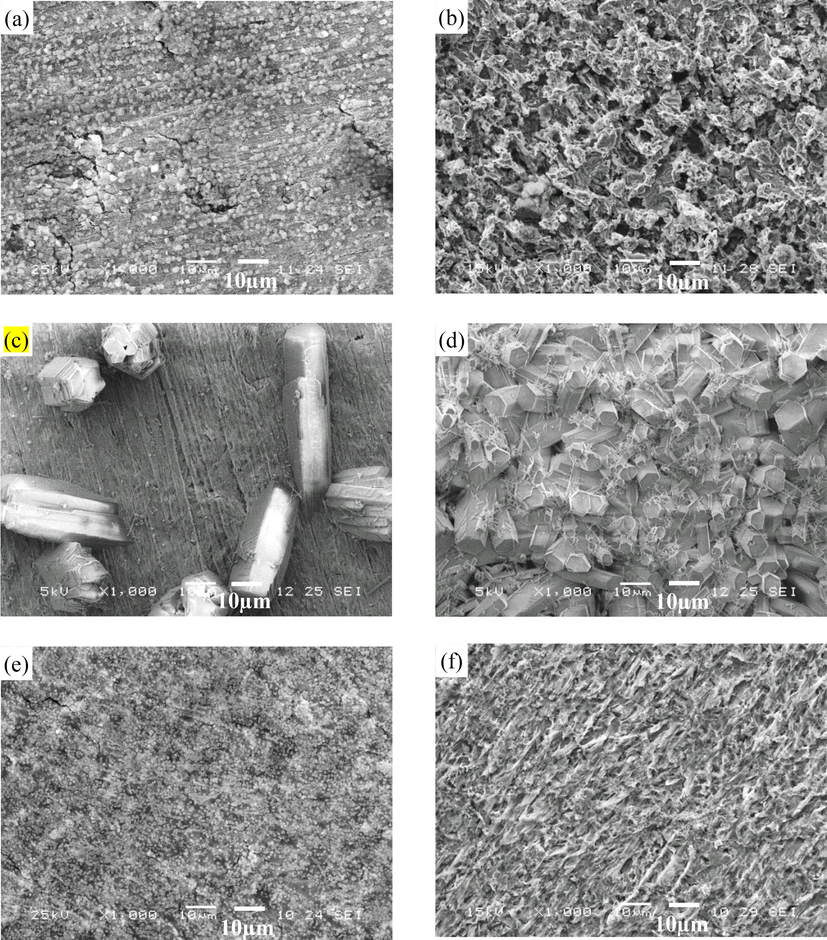
SEM surface morphologies of representative X65 carbon steel electrodes at gradual contraction pipe under different conditions: (a) electrode 1, 4 m/s, 1 MPa; (b) electrode 4, 4 m/s, 1 MPa; (c) electrode 1, 4 m/s, 0 MPa; (d) electrode 4, 4 m/s, 0 MPa; (e) electrode 1, static, 1 MPa and (f) electrode 1, static, 0 MPa.
Fig. 11 shows XRD of representative X65 carbon steel electrodes (electrode 1 and electrode 4) under dynamic atmospheric pressure condition (4 m/s, 0 MPa). Calcium carbonate crystals with elongated structure are produced on both electrode surfaces. The Characteristic peaks of calcium carbonate crystals are more evident on the surface at the straight pipe after inclination segment (electrode 4) compared with those on the surface at the straight pipe before inclination segment (electrode 1), which corresponds to denser crystals layers on the surface at the straight pipe after inclination segment. As the components of corrosion product layer under conditions except that under dynamic atmospheric pressure condition cannot be detected by XRD, XPS analysis were performed to reveal the components of corrosion product layer.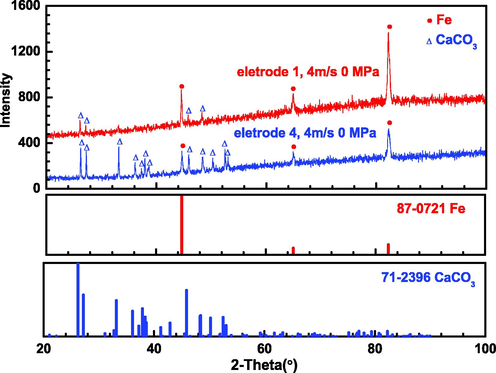
XRD of representative X65 carbon steel electrodes after corrosion at 4 m/s, 0 MPa.
The high resolution XPS spectra of C 1 s, O 1 s and Fe 2p3/2 are shown in Fig. 12. All the tested binding energy of elements is calibrated relative to C 1 s peak of 284.8 eV, which is correspondence with absorbed adventitious carbon. The valence state of each element is obtained by fitting the peaks. Under dynamic high pressure condition, the C 1 s peaks located at 284.8 eV and 288.6 eV on the surface at the straight pipe before inclination segment (electrode 1) are attributed to adventitious carbon and FeCO3, respectively. Meanwhile, the O 1 s peak at 531.5 eV and Fe 2p3/2 peak at 710.6 eV confirm the presence of FeCO3 on the surface of the electrode. The peak fitting on the surface at the straight pipe after inclination segment (electrode 4) demonstrates similar chemical composition with that on the surface of electrode 1, i.e., FeCO3 corrosion product film on the electrode 4 surface. Under the condition of static high pressure, apart from FeCO3, the other O 1 s peak at 529.2 eV and Fe 2p3/2 peak at 711.6 eV are assigned to Fe2O3. The existence of Fe2O3 should be ascribed to oxidation of FeCO3 which was exposed to the air during the post-treatment for surface analysis upon removal of samples from the high pressure flow accelerated corrosion loop (Heuer and Stubbins, 1998; Wang et al., 2014). The peaks under static atmospheric pressure also demonstrates the presence of FeCO3, which is similar to the situation that under dynamic high pressure condition. The corresponding binding energy, specification and atomic percentage for the elements are illustrated in Table 3.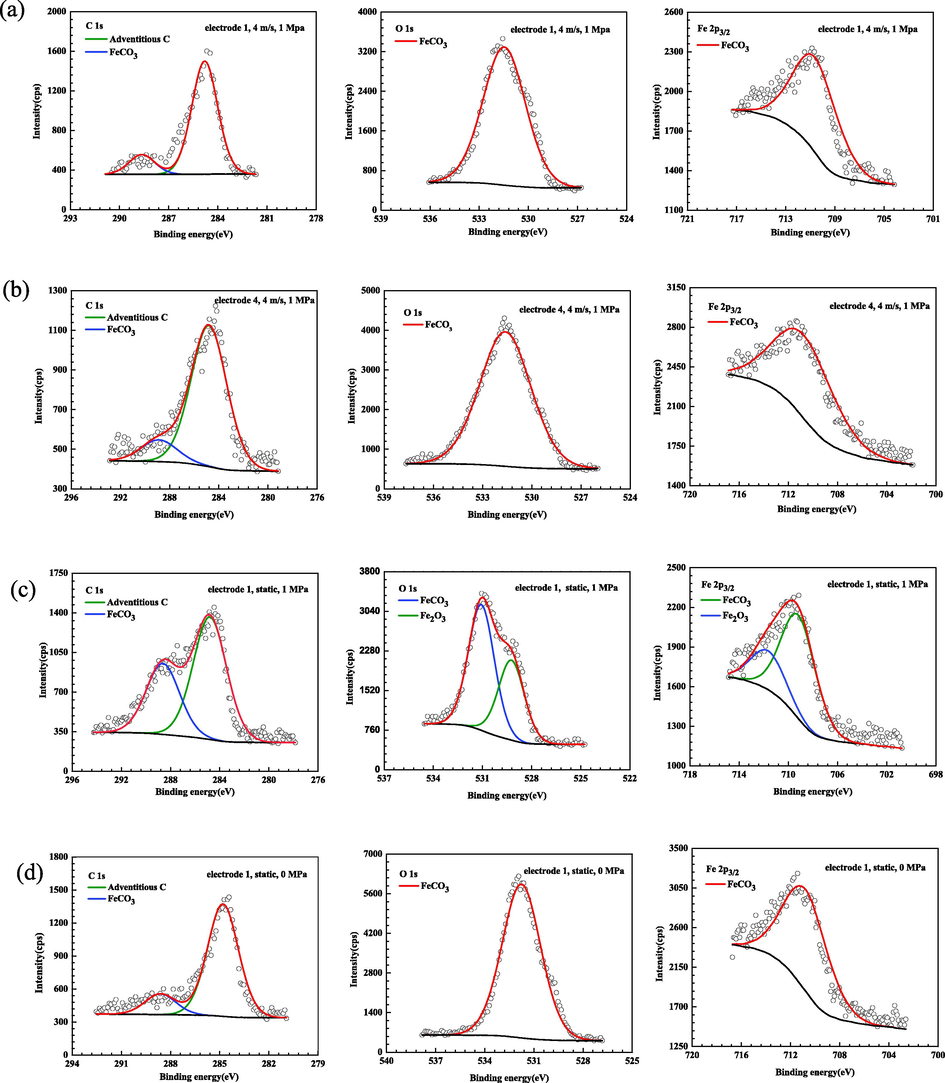
XPS of representative X65 carbon steel electrodes after corrosion under different conditions: (a) electrode 1, 4 m/s, 1 MPa; (b) electrode 4, 4 m/s, 1 MPa; (c) electrode 1, static, 1 MPa and (d) electrode 1, static, 0 MPa.
Conditions
Elements
Binding energy(eV)
Peak
At.%
4m/s 1MPa
electrode 1
C1s
284.8
Adventitious C
43.76
288.6
FeCO3
O1s
531.5
FeCO3
51.30
Fe 2p3/2
710.6
FeCO3
4.94
electrode 4
C1s
284.8
Adventitious C
37.85
288.9
FeCO3
O1s
531.6
FeCO3
57.00
Fe 2p3/2
710.7
FeCO3
5.15
Static 1MPa
electrode 1
C1s
284.8
Adventitious C
65.89
288.6
FeCO3
O1s
529.2
Fe2O3
30.16
531.1
FeCO3
Fe 2p3/2
709.2
FeCO3
3.95
711.6
Fe2O3
Static 0MPa
electrode 1
C1s
284.8
Adventitious C
32.41
288.6
FeCO3
O1s
531.8
FeCO3
62.20
Fe 2p3/2
710.8
FeCO3
5.39
3.5 CFD simulation
CFD simulation was conducted to reveal the relationship between high pressure FAC and hydrodynamics. The flow velocity and wall shear stress distribution along fluid flow direction of gradual contraction test section is shown in Fig. 13. It can be seen that both flow velocity and shear stress at the top and bottom of the gradual contraction pipes along the flow direction are symmetrically distributed with respect to the central plane of pipes. For the of flow velocity distribution (Fig. 13a and c), the flow velocity almost holds steady at straight pipe before inclination segment. However, when fluid flows through the inclination segment, the flow velocity gradually ascends along the fluid flow direction with progressively decreasing pipe diameter. It distinctly indicates that the gradual contraction of the inclination segment remarkably alters the flow field. The flow rate rapidly reaches a stable state when fluid passes through straight pipe after inclination segment. To better reveal the tendency of flow velocity at the gradual contraction test section, flow velocity in A, B, C and D cross-sections where steel electrodes are located at are respectively illustrated as showed in Fig. 13c. The flow velocity at the center positions of section A (electrode 1 and 5), B (electrode 2 and 6), C (electrode 3 and 7) and D (electrode 4 and 8) are 1.18 m/s, 2.03 m/s, 2.89 m/s and 4.18 m/s, respectively. The comparison of flow velocity at these four locations indicates an enhancement of flow velocity due to constriction of pipe when the fluid flows through gradual contraction test section. The two values of flow velocity (section B and C) at the inclination segment exhibit significant difference with the value of flow velocity at section B (electrode 2 and 6) being closer to that at straight pipe before inclination segment and the value of flow velocity at section C (electrode 3 and 7) being closer to that at straight pipe after inclination segment. The highest flow velocity appears at straight pipe after inclination segment (electrode 4 and 8) while the lowest flow velocity appears at straight pipe before inclination segment (electrode 1 and 5). The wall shear stress at gradual contraction test section displays similar distribution with the flow velocity as shown in Fig. 13b. The wall shear stress maintains stable at straight pipe before inclination segment. A gradual rise with a layer-like distribution of wall shear stress appears at the inclination segment. While the wall shear stress increases firstly and then remains almost unchanged along the straight pipe after inclination segment. The maximum value (36.2 Pa) appears at electrodes 4 and 8 at straight pipe after inclination segment, while the minimum value (2.3 Pa) appears at electrodes 1 and 5 at straight pipe before inclination segment. The distribution of wall shear stress is consistent with the flow velocity. The hydrodynamic characteristics at the gradual contraction pipe are in accordance with other researchers (Anupriya et al., 2019; Al-Rawi et al., 2020), demonstrating that accurate simulation results could be obtained by the established model of gradual contraction pipe. Consequently, the higher flow velocity and then higher wall shear stress at the straight pipe after inclination segment lead to a stronger shear effect on the pipe wall at this location.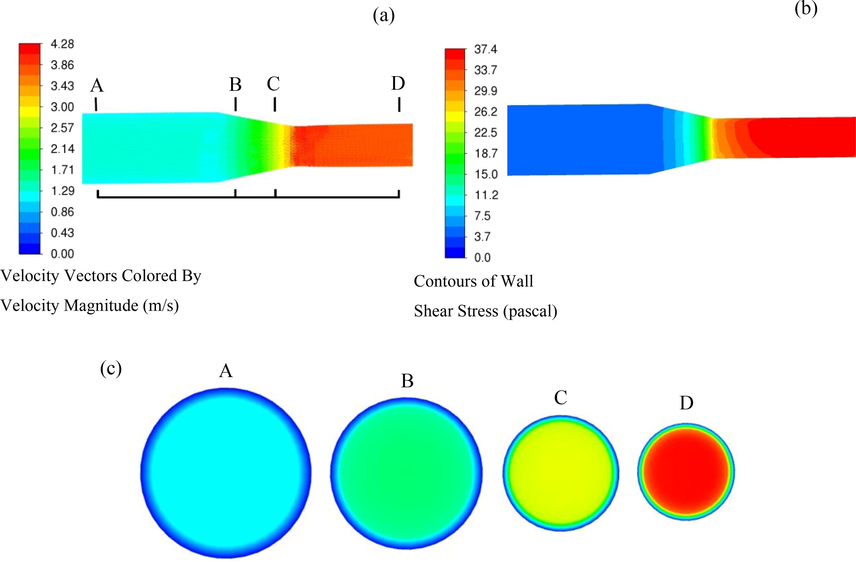
Fluid flow field distribution along the gradual contraction pipe: (a) flow velocity along the gradual contraction pipe, (b) wall shear stress along the gradual contraction pipe, and (c) variations of flow velocity in cross-section where the X65 carbon steel electrodes are located at along the gradual contraction pipe.
4 Discussion
4.1 The comparison of corrosion behavior of carbon steel gradual contraction pipe in CO2-containing formation water under flow condition in high pressure and atmospheric pressure environments
Electrochemical measurements suggests that the EIS and polarization curves in dynamic high pressure environments exhibit remarkable difference from those under dynamic atmospheric pressure condition, manifesting significantly different electrochemical corrosion mechanism under dynamic high pressure and dynamic atmospheric pressure condition.
For the corrosion process of steel in high CO2 partial pressure environment, the cathode reaction mainly includes the reduction of H+, H2CO3 and
, and the anodic reaction is principally a step-by-step dissolution process of steel accompanying with the absorption of intermediate product FeOHads (Nesic, 2007; Zhang et al., 2012). The presence of an inductive arc in low frequency as shown in Fig. 7a is correlated to the absorption of intermediate product on the carbon steel surface. The FeCO3 crystals precipitate onto the carbon steel surface and a FeCO3 protective film will be formed when the supersaturation of Fe2+ and
ions in the solution occurs and the solubility limit for FeCO3 is reached and even exceeded. The surface morphology with crystal corrosion products in Fig. 10 and the XPS analysis (Fig. 12) demonstrates the formation of FeCO3 corrosion products in dynamic high CO2 partial pressure environments. Nevertheless, the cracks on electrode surface under high pressure condition would act as a channel for the corrosive species penetrating corrosion product film, which accelerates the contact of corrosive species with the steel substrates, thus leading to a severe corrosion of carbon steel. While under dynamic atmospheric pressure condition, since the pH value of solution increases compared with that under dynamic high pressure condition, CaCO3 precipitates onto the electrode surface preferential to FeCO3 with Ca2+ originated from the experimental solution. Consequently, CaCO3 crystals rather than FeCO3 crystals are found on the carbon steel surface (Fig. 10 and Fig. 11). As intact CaCO3 film would render somewhat protection for the corrosion of steel substrate, the corrosion of electrodes in dynamic atmospheric pressure environments is apparently retarded in comparison with that in dynamic high pressure environments. A schematic diagram as shown in Fig. 14 was utilized to describe the corrosion behavior at different locations of gradual contraction pipes under dynamic high pressure and dynamic atmospheric pressure conditions. In dynamic high CO2 partial pressure environments, the presence of CO2 partial pressure generates the circumferential tensile load in the pipeline, which combines with the axial tensile load generated by wall shear stress, thus the corrosion product layer produces high strain, resulting in the brittle corrosion product film easy to fall off from the metal substrates with good ductility (Ramachandran et al., 2001). Furthermore, the presence of CO2 partial pressure increase the stress endured by steel materials, thus increasing the risk of fracture attributed to stress concentration (Song, 2009). Therefore, there are smaller capacitive arcs, higher corrosion current density and then higher corrosion rates under dynamic high pressure condition.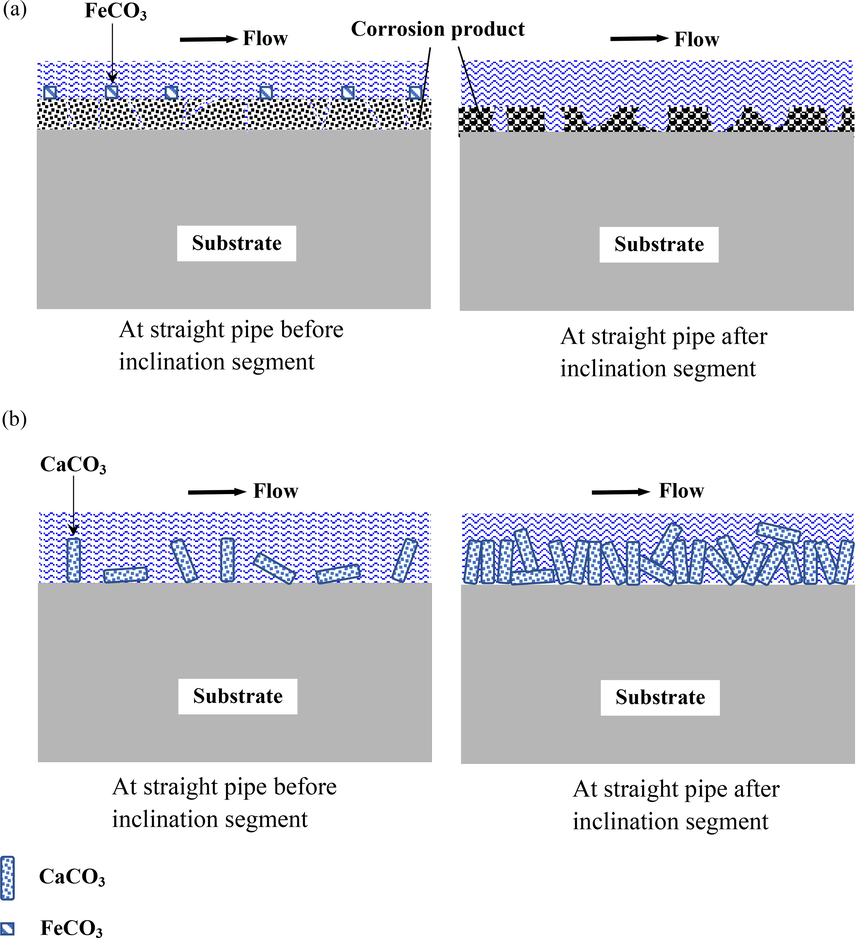
Schematic diagram of corrosion behavior at gradual contraction pipes under FAC conditions: (a) under dynamic high pressure conditions, (b) under dynamic atmospheric pressure conditions.
4.2 The effect of fluid field on the FAC behavior of carbon steel gradual contraction pipe in high pressure and atmospheric pressure environment
In current work, the electrochemical measurements indicate that different FAC behavior at different positions of the gradual contraction pipe in both dynamic high pressure and dynamic atmospheric pressure environments. The corrosion rates in dynamic high CO2 partial pressure environments increase along the fluid flow direction while the corrosion rates in dynamic atmospheric pressure environments decrease along the fluid flow direction.
CFD simulation demonstrates that the flow velocity and wall shear stress are generally enhanced along the fluid flow direction owing to the constriction of pipe with reduction of pipe diameter. Obviously, the fluid field plays a vital role in the FAC behavior of carbon steel contraction pipe. In dynamic high CO2 partial pressure environments, specially, at 1 MPa in present study, the dominated carbonic reaction is the reduction of H2CO3 since the reduction of HCO3– for hydrogen evolution is much slower than direct reduction of H2CO3 due to the kinetic hindrance of the reduction of HCO3– (Nesic, 2012). Nevertheless, the concentration of H2CO3 near wall is governed by the slow kinetics of CO2 hydration reaction (CO2 + H2O ⇌ H2CO3) and the mass transport process of corrosion species in cathodic reaction is less dominant (Nor et al., 2011; Wang et al., 2004), thus the effect of velocity on the cathodic current density is small, which could be demonstrated by no significant variation in cathodic current densities along the fluid flow direction through potentiodynamic polarization measurements. However, the high flow velocity and wall shear stress sweep the anodic corrosion product Fe2+ away from the steel surface, hindering the formation of protective corrosion product layer. Furthermore, the shear stress exerted on the wall by the fluid may destroy the already formed protective corrosion products. Additionally, dissolution of ferrous carbonate films in the acidic solution may be accelerated by fluid flow. Moreover, the corrosion potential of carbon steel electrode generally positively shifts if protective FeCO3 scale is formed on the steel surface in CO2 environment, which demonstrates that protective FeCO3 scale inhibit anodic reaction more than cathodic reaction (Tang et al., 2017). The negative shifts in corrosion potential with increased flow velocity along the fluid flow direction prevent the formation of protective FeCO3 scale. As a result, the anodic current density and then corrosion rate increase along the fluid flow direction. The SEM morphologies (Fig. 10) indicate that corrosion products formed at the straight pipe after inclination segment are looser than those formed at the straight pipe before inclination segment, accompanying with higher corrosion rate at the straight pipe after inclination segment. Concurrently, high flow velocity and wall shear stress, conjugating with high fluid turbulence over the electrode surface in dynamic high pressure environments lead to the corrosion products featured with coarser and looser crystal grains and more cracks with larger sizes compared with those in static high pressure environments, and thus a higher corrosion rate in dynamic high pressure environments.
In atmospheric pressure environments, the calcium carbonate scale is formed by the combination of Ca2+ and CO32– or HCO3– according to reaction (10) and (11):
In CO2 environments, the CO32– and HCO3– are formed by the ionization of carbonic acid. Since the concentration of HCO3– is generally much higher than that of CO32–, the CaCO3 precipitation is mainly ascribed to reaction (2). Based on Bernoulli principle, the pressure drops with increased flow velocity along the fluid flow direction, the solubility of CO2 gases is reduced and thus dissolved CO2 gases is released from the solution, prompting the formation of CaCO3 scale by shifting the reaction equilibrium toward the right side (Saifelnasr et al., 2013). SEM morphologies demonstrate that denser CaCO3 crystals are formed, which provides better corrosion protection at the straight pipe after inclination segment. Therefore, there are larger capacitive arcs, lower corrosion current density and lower corrosion rates along the fluid flow direction under atmospheric pressure condition.
5 Conclusions
In situ dynamic high pressure electrochemical measurements with real reference electrode in FAC loop are utilized to study FAC behavior of X65 carbon steel gradual contraction pipe in high CO2 partial pressure environments. It is demonstrated that the corrosion rate in dynamic high CO2 partial pressure environments is obviously enhanced compared with that in dynamic atmospheric environments. FAC mechanism in high CO2 partial pressure environments exhibits essential distinction from that in atmospheric pressure environments.
The corrosion rates in dynamic high CO2 partial pressure environments increase, with enhanced flow velocity and wall shear stress along the fluid flow direction. The variation of corrosion rates is in good agreement with the flow field at gradual contraction pipe. The corrosion rate in dynamic high CO2 partial pressure environments significantly ascends in comparison with that in static high pressure environments. The hydrodynamics at gradual contraction pipe prevents the formation of protective corrosion products scale on the steel surface, thus leading to a higher corrosion rate under dynamic high pressure condition.
Acknowledgements
This research was funded by the National Natural Science Foundation of China (Grant No. 51901164), and the National Natural Science Foundation of China (Grant No. 51775390). This work is also supported by the Funded by Open Research Fund Program of Hubei Provincial Key Laboratory of Chemical Equipment, Intensification and Intrinsic Safety (Grant No. 2021KA01).
Declaration of Competing Interest
The authors declare that they have no known competing financial interests or personal relationships that could have appeared to influence the work reported in this paper.
References
- Al-Rawi, M., Sharma, C., Zhou, H., 2020. Optimization of pipeline reducer using computational fluid dynamics (CFD) modeling. Indian J. Sci. Techn. 13(45), 4521-4531. 10.17485/IJST/v13i45.1911.
- Study of gas-liquid upward annular flow through a contraction. Ann. Nucl. Energy. 2019;129:169-180.
- [CrossRef] [Google Scholar]
- Electrochemical corrosion behavior of X70 pipeline steel in turbulence zone under jet impingement at high temperature and high pressure CO2 environment. Acta Phys-Chim Sin. 2013;29:1003-1012.
- [CrossRef] [Google Scholar]
- Solid particle erosion in gradual contraction geometry for a gas-solid system. Wear. 2019;426–427:643-651.
- [CrossRef] [Google Scholar]
- Modeling and experimental study of CO2 corrosion on carbon steel at elevated pressure and temperature. J. Nat. Gas Sci. Eng.. 2015;27:1620-1629.
- [CrossRef] [Google Scholar]
- Corrosion of carbon steel in CO2 saturated brine at elevated temperatures. J. Pet. Sci. Eng.. 2021;196:107638
- [CrossRef] [Google Scholar]
- Evolution of dissolution processes at the interface of carbon steel corroding in a CO2 environment studied by EIS. Corro. Sci.. 2010;52(2):509-517.
- [CrossRef] [Google Scholar]
- Erosion-corrosion of carbon steels in a laboratory: three-phase flow. Corrosion. 2008;64:175-186.
- [CrossRef] [Google Scholar]
- Mechanical properties of CO2 corrosion product scales and their relationship to corrosion rates. Corros. Sci.. 2008;50:2796-2803.
- [CrossRef] [Google Scholar]
- Corrosion of alloy steels containing 2% chromium in CO2 environments. Corro. Sci.. 2012;63:246-258.
- [CrossRef] [Google Scholar]
- Hassani S., Roberts K.P., Shirazi S.A., Shadley J.R., Rybicki E.F., Joia C., 2012. Flow loop study of NaCl concentration effect on erosion, corrosion, and erosion-corrosion of carbon steel in CO2-saturated systems. Corrosion 68, 026001-1-026001-9. 10.5006/1.3683229.
- Electrochemical investigation of the corrosion behavior of API 5L–X65 carbon steel in carbon dioxide medium. Corrosion. 2013;69:1171-1179.
- [CrossRef] [Google Scholar]
- Microstructure analysis of coupons exposed to carbon corrosion in multiphase flow. Corrosion. 1998;54:566-575.
- [Google Scholar]
- Corrosion inhibitor studies in large flow loop at high temperature and high pressure. Corros. Sci.. 2001;43:1839-1849.
- [CrossRef] [Google Scholar]
- Numerical simulation of gas-liquid flow through a 90° duct bend with a gradual contraction pipe. J Zhejiang Univ-Sci A. 2017;18(3):212-224.
- [CrossRef] [Google Scholar]
- CFD simulation of core annular flow through sudden contraction and expansion. J. Petrol. Sci. Eng.. 2012;86–87:153-164.
- [CrossRef] [Google Scholar]
- Electrochemical impedance spectroscopy and surface characterization techniques to study carbon dioxide corrosion product scales. Corroison. 1998;54:835-842.
- [CrossRef] [Google Scholar]
- Inhibition of CO2 corrosion of mild steel - Study of mechanical effects of highly turbulent disturbed flow. Corros. Sci.. 2017;126:208-226.
- [CrossRef] [Google Scholar]
- Galvanic corrosion between N80 carbon steel and 13Cr stainless steel under supercritical CO2 conditions. Corros. Sci.. 2019;147:260-272.
- [CrossRef] [Google Scholar]
- Synergistic effect of erosion and hydrogen on properties of passive film on 2205 duplex stainless steel. J. Mater. Sci. Technol.. 2021;67:1-10.
- [CrossRef] [Google Scholar]
- Effect of temperature and pressure on the morphology of carbon dioxide corrosion scales. Corrosion. 2006;62:501-507.
- [Google Scholar]
- Effects of chloride content on CO2 corrosion of carbon steel in simulated oil and gas well environments. Corros. Sci.. 2014;84:165-171.
- [CrossRef] [Google Scholar]
- Key issues related to modelling of internal corrosion of oil and gas pipelines-A review. Corros. Sci.. 2007;49:4308-4338.
- [CrossRef] [Google Scholar]
- Effects of multiphase flow on internal CO2 corrosion of mild steel pipelines. Energ. Fuel. 2012;26:4098-4111.
- [CrossRef] [Google Scholar]
- A mechanistic model for carbon dioxide corrosion of mild steel in the presence of protective iron carbonate films—Part 3: Film growth model. Corrosion. 2003;59:616-628.
- [CrossRef] [Google Scholar]
- Nor, A.M., Suhor, M.F., Mohamed, M.F., Singer, M., Nesic, S., 2011. Corrosion of carbon steel in high CO2 environment: Flow effect. Corrosion 2011, paper no. 11242, NACE: NACE International, Houston, Texas. https://onepetro.org/NACE CORR/proceedings-abstract/CORR11/All-CORR11/NACE-11242/119614.
- CO2 corrosion inhibition of X-120 pipeline steel by a modified imidazoline under flow conditions. Corros. Sci.. 2011;53:3780-3787.
- [CrossRef] [Google Scholar]
- The interactions and properties of corrosion inhibitors with byproduct layers. Corrosion. 2001;57:508-515.
- [Google Scholar]
- Calcium carbonate scale formation, prediction and treatment. Int. Lett. Chem. Phys. Astron.. 2013;17:47-58.
- [Google Scholar]
- Prediction of erosion-corrosion penetration rate in a carbon dioxide environment with sand. Corrosion. 1998;54:972-978.
- [Google Scholar]
- Predicting the mechanisms and crack growth rates of pipelines undergoing stress corrosion cracking at high pH. Corros. Sci.. 2009;51:2657-2674.
- [CrossRef] [Google Scholar]
- Corrosion behaviour of X65 carbon steel in supercritical-CO2 containing H2O and O2 in carbon capture and storage (CCS) technology. Corros. Sci.. 2017;118:118-128.
- [CrossRef] [Google Scholar]
- Wang, S.H., George, K., Nesic, S., 2004. High pressure CO2 corrosion electrochemistry and the effect of acetic acid. Corrosion 2004, paper no. 04375, NACE: NACE International, Houston, Texas. https://onepetro.org/NACECORR/proceedings-abstract/CORR04/All-CORR04/NACE-04375/115707.
- In situ observation of CO2 corrosion under high pressure, Corrosion engineering, science and technology. Corros. Eng. Sci. Techn.. 2014;49:352-356.
- [CrossRef] [Google Scholar]
- Effect of small amount of H2S on the corrosion behavior of carbon steel in the dynamic supercritical CO2 environments. Corros. Sci.. 2016;103:132-144.
- [CrossRef] [Google Scholar]
- The relationship between the formation process of corrosion scales and the electrochemical mechanism of carbon steel in high pressure CO2-containing formation water. J. Electrochem. Soc.. 2012;159:C393-C402.
- [CrossRef] [Google Scholar]
- Discussion of the CO2 corrosion mechanism between low partial pressure and supercritical condition. Corros. Sci.. 2012;59:186-197.
- [CrossRef] [Google Scholar]
- Electrochemical corrosion behavior of carbon steel under dynamic high pressure H2S/CO2 environment. Corros. Sci.. 2012;65:37-47.
- [CrossRef] [Google Scholar]
- Corrosion behaviour of N80 carbon steel in formation water under dynamic supercritical CO2 condition. Corros. Sci.. 2017;120:107-120.
- [CrossRef] [Google Scholar]
- In situ study of flow accelerated corrosion and its mitigation at different locations of a gradual contraction of N80 steel. J. Alloys Compd.. 2020;824:153947
- [CrossRef] [Google Scholar]


