

Translate this page into:
Flow injection analysis of some oxidants using spectrophotometric detection
⁎Corresponding author. ialzamil@ksu.edu.sa (Ibrahim Z. AL-Zamil)
-
Received: ,
Accepted: ,
This article was originally published by Elsevier and was migrated to Scientific Scholar after the change of Publisher.
Peer review under responsibility of King Saud University.
Abstract
A spectrophotometric flow-injection method has been devised for the determination of nanomole quantities of some oxidants i.e. iodate, periodate, permanganate and hydrogen peroxide. The method is based on the oxidation of iron(II) to iron(III) and the measurement of the absorbance of the red iron(III)–thiocyanate complex at 485 nm. The optimal oxidation pH and the linearity ranges of the calibration curves have been investigated. The analytical aspects of the method including the statistical evaluation of the results are discussed. The analysis of some authentic samples showed an average percentage recovery of 99%.
Keywords
Flow injection
Spectrophotometry
Iodate
Periodate
Permanganate
Hydrogen peroxide

1 Introduction
Numerous conventional methods for the determination of iodate, periodate, permanganate and hydrogen peroxide have been reported (Abdul Hug and Rao, 1984; Al-Zamil, 1984; Rahim and Bashir, 1984; Garrido et al., 1986). Iodate and periodate were spectrophotometrically determined by methods based on the oxidation of iron(II) in the presence of dipyridylglyoxal dithisemicarbazone as a spectrophotometric reagent (Garrido et al., 1986) or to form prussian blue (Rahim and Bashir, 1984). AL-Zamil consecutively determined periodate and iodate by indirect titration with EDTA at different acidic media (Al-Zamil, 1984). Permanganate, iodate and periodate have been determined by their oxidation of iron(II) and the formation of iron(III)–resacetophenone oxime red complex (Abdul Hug and Rao, 1984). However, the published flow-injection methods for the determinations of iodate (Chen et al., 1991; Oguma et al., 1993; Yagoob et al., 1991; Xie and Jingchan, 2004), periodate (Berzas-Nevado and Valiente-Gonzalez, 1989; Evmiridis, 1989) and permanganate (Al muaibed and Townshend, 1995; Thorburn-Burns et al., 1992) are few. The oxidation of tris 1,10-phenanthroline–iron(II) complex by permanganate was used for the determination of the latter by spectrophotometric flow injection analysis (Al muaibed and Townshend, 1995). Few flow injection analysis methods have been suggested for the determination of hydrogen peroxide (Olsson, 1982; Vieira and Fatibello-Filho, 1998; Mifune et al., 1998; Almuaibed and Townshend, 1994; Ishibashi et al., 1992; Chen et al., 2011; Roselyn et al., 2009) most of which are based on either the formation of a colored compound or a chemiluminescence reaction involving luminal. Hydrogen peroxide and other oxidants have been determined by potentiometric flow injection analysis methods based on a redox reaction with an iron(II)–iron(III) couple (Ishibashi et al., 1992).
The proposed work for the flow injection spectrophotometric determination of some oxidants i.e. iodate, periodate, permanganate and hydrogen peroxide is based on the oxidation of iron(II) to iron(III) and the measurement of the absorbance of the red iron(III)–thiocyanate complex at 485 nm (Al-Khulaiwi et al., 2001; AL-Zamil et al., 2001).
2 Experimental
2.1 Reagents and chemicals
All reagents used were of analytical grade. Distilled/deionized water was used throughout this work. The hydrochloric acid stock solution was prepared using HCl (AR), BDH from England. Iron(II) stock solution of 0.2 M (NH4)2Fe(SO4)2, crystals extrapure, Merck, Germany, was prepared every day in 0.5 M hydrochloric acid. The working solution was prepared just before use and passed over a Jones Reductor to eliminate air-oxidation. 1 M Thiocyanate stock solution was prepared using potassium thiocyanate crystal pure, Merck, Germany. Iodate (KIO3), periodate (KIO4), iodide (K), permanganate (KMnO4), nitrate (NaNO3) and nitrite (NaNO2) stock solutions (0.1 M of each) were all AR from BDH, England). Hydrogen peroxide stock solution was prepared using H2O2 win lab 3% and sulfuric acid stock solution was prepared from 98.0% H2SO4 (AR) BDH from England.
2.2 Instrumentation
The manifold used is illustrated in Fig. 1. The flow was produced with a Gilson Minipulse 3 peristaltic 4 channel pump and injections were made with Rheodyne 5020 injection port. The system was connected to a Helma flow cell by Teflon tubing of 0.58 mm. The absorbance was measured using LKB Biochem Ultraspec (II) 4045 single beam ultraviolet-visible spectrophotometer which was connected to a Perkin Elmer recorded 56.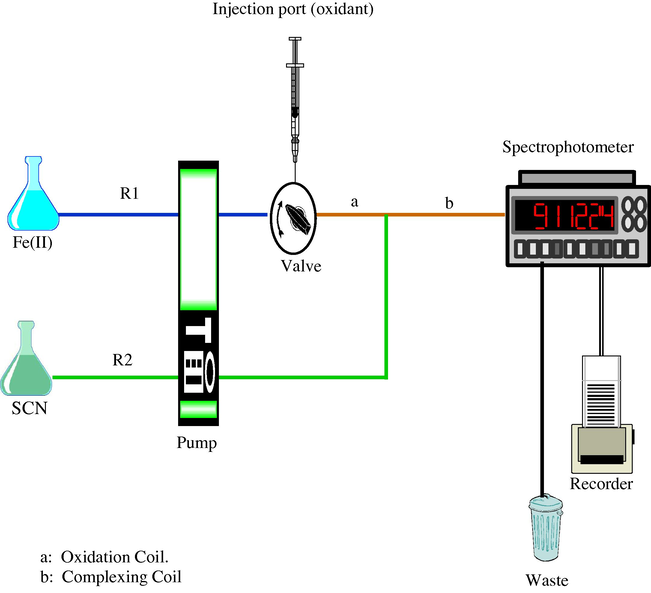
A schematic diagram of the manifold used for the presented work.
2.3 General procedures
Channel R1 in Fig. 1 was used to deliver the 0.1 M iron(II) at the required pH. The analyte (i.e. or H2O2) was injected at the injection port. A reaction coil of 150 cm long Teflon tubing (coil a in Fig. 1) was used to complete the oxidation of iron(II) by the analyte to iron(III). Then the stream R1 was merged with R2 stream which is carrying 1 M thiocyanate solution in water. The blood red thiocyanate–iron(III) complex was formed in coil b of Fig. 1 which was 70 cm long. The absorbance of this complex which was directly proportional to the analyte concentration was measured at 485 nm as a peak. Each result was an average of three replicate measurements.
3 Preliminary investigations
All the conditions that were previously optimized [17–18] were used in this work i.e. thiocyanate = 1 M in 0.5 M HCl, flow rate = 1.3 ml/min, oxidation coil length = 150 cm, iron(III)–thiocyanate complex coil length = 70 cm and sample volume = 0.41 ml. The solution of an oxidant (4 × 10⁻⁵ M) was injected into a stream of 0.1 M iron(II) prepared in different sulfuric acid solutions and the absorbance of the iron(III)–thiocyanate complex was measured at 485 nm. The results are shown in Table 1. These results indicate that 4 × 10⁻⁵ M of
,
or H2O2 oxidized iron(II) to iron(III) in both acidic media (i.e. 0.01 M and 2 M H2SO4), but the oxidation was more complete and probably faster in 2 M H2SO4 compared to that in 0.0 M H2SO4, while iodide did not show any response in both acidic media. Nitrite produced only little iron(III) in both media while 4 × 10⁻⁵ M
did not oxidize iron(II) in 0.01 M H2SO4 and only 4 × 10⁻⁴ M
show oxidation of iron(II) in 2 M H2SO4. This is probably due to the low standard potentials for both
and NO3. Therefore,
can be determined in the presence of low concentration of
< 4 × 10⁻⁵ M in 0.01 M H2SO4 by this method.
Oxidant 4 × 10⁻⁵ M
Absorbance of iron(III)–thiocyanate complex (mv)
in 0.01 M H2SO4
in 2 M H2SO4
181
261
183
194
No response
–
a
–
555
20
242
59
242
10
180
I−
No response
No response
H2O2
80
90
The results in Table 1 prove that this method can be applied to the indirect determination of and H2O2 in the 1 × 10⁻⁵ M range or may be lower and in the 1 × 10⁻⁴ M range. In this paper, the determination of some of these oxidants will be investigated.
4 Results and discussion
4.1 Determination of iodate or periodate
The results in Table 1 show that produced only small amount of iron(III) in the 0.01 M H2SO4 medium. Therefore, the effect of acidity on the oxidation of 0.1 M iron(II), prepared in different hydrochloric acid concentrations, by either or was further investigated.
The results in Table 2 indicate that the oxidation efficiency of iron(II) to iron(III) by
was increased by increasing the acidity up to pH 1.5 while
did not oxidize iron(II) at pH ⩾ 2.5, but it did at lower pH.
HCl (pH)
Absorbance of iron(III)–thiocyanate complex (mv)
4.00
No response
40
3.50
No response
70
2.50
No response
95
1.95
75
140
1.50
184
285
1.00
190
279
This fact enables the determination of in presence of at pH ⩾ 2.5 and the determination of either ions ( or ) at pH < 1.5.
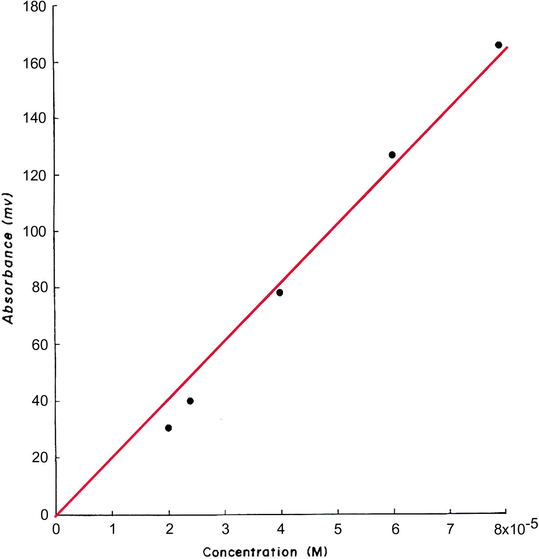
Calibration measurements for the determination of
in the 4–10 × 10−5 M range and in the presence of 10 × 10−5 M
using 0.1 M Fe(II) prepared in pH 3.5 (HCl) are shown in Fig. 2 and are plotted in Fig. 3.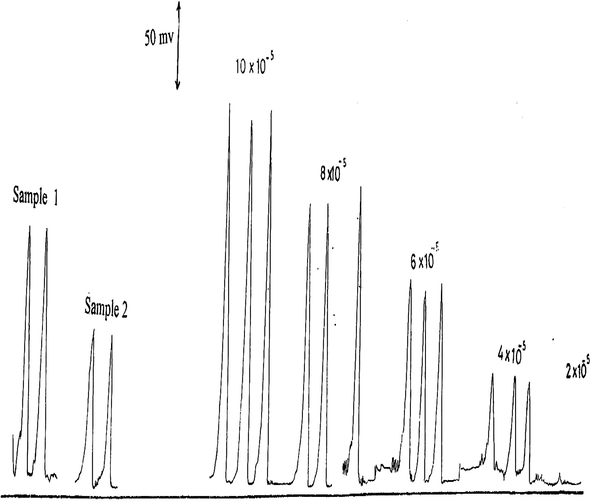
Calibration measurements of 2–10 × 10−5 M
at pH 3.5 including some authentic samples.
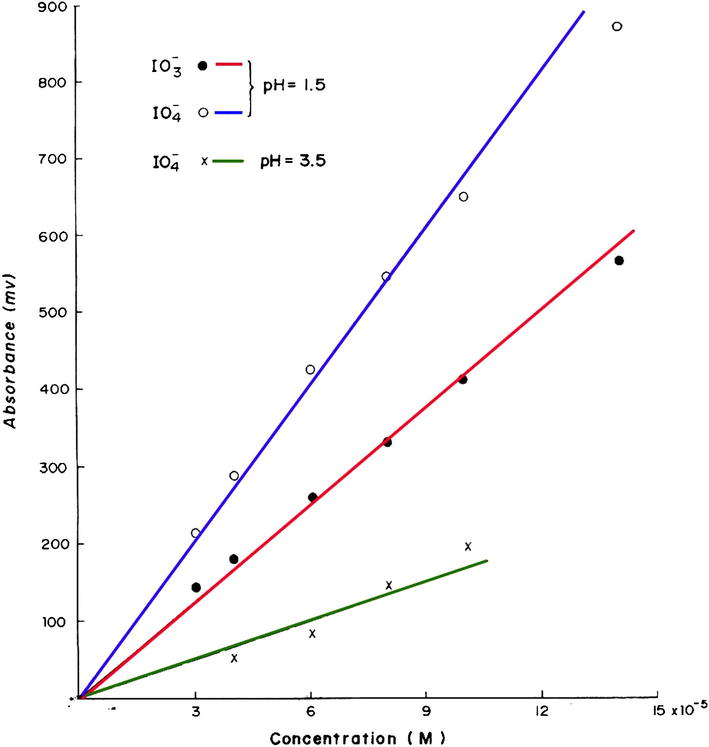
Calibration graphs for the determination of
and
in the range 3–14 × 10−5 M each at pH = 1.5 and for
in the range 4–10 × 10−5 at pH 3.5.
This calibration graph is linear in the examined range and the best straight line has a slope of 2.01 and a correlation coefficient of 0.999. The results of the analysis of some
authentic samples are shown in Table 3 and Fig. 2. The found results agree reasonably well with those expected showing an average percentage recovery of 97%.
Taken (M)
Taken (M)
Found (M)
Recovery (%)
Sample 1
5 × 10⁻⁵
4.7 × 10⁻⁵
94
Sample 2
7 × 10⁻⁵
7 × 10⁻⁵
100
The results for the calibration measurements for the determination of 3–14 × 10−5 M
at pH 1.5 are shown in Fig. 4 and are plotted in Fig. 3 with a correlation coefficient of 0.998. These results and statistical evaluations show that
can be determined more sensitively at pH 1.5 compared with that at pH 3.5, but, unfortunately
interfered at pH 1.5.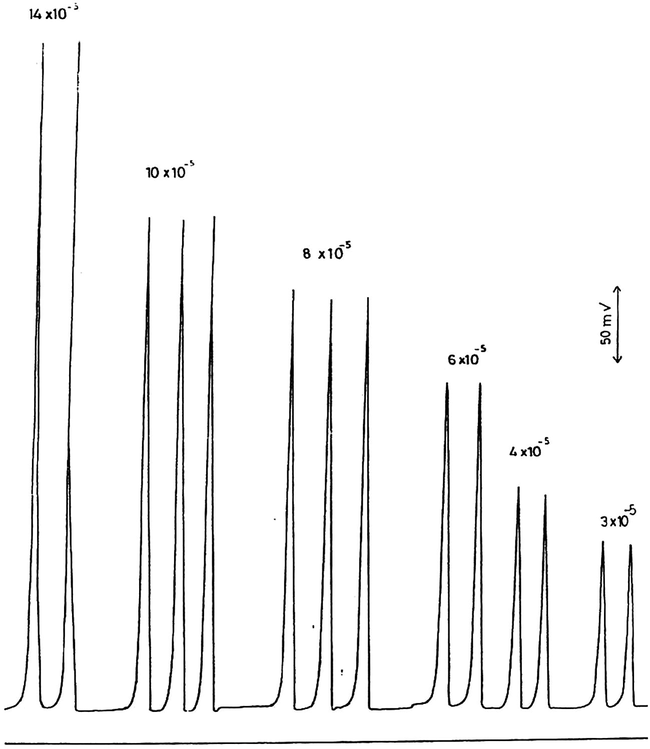
Calibration measurements of 3–14 × 10−5 M
at pH 1.5.
The calibration measurements for the determination of 3–14 × 10−5 M
at pH 1.5 (HCl) are shown in Fig. 5 and are plotted in Fig. 3. The best straight line has a slope of 3.78, an intercept of 35 and a correlation coefficient of 0.999 which indicate that this method is more sensitive for periodate compared with iodate. The results for the analysis of
authentic samples (Table 4 and Fig. 6) agree reasonably well with those expected showing an average percentage recovery of 101.6%.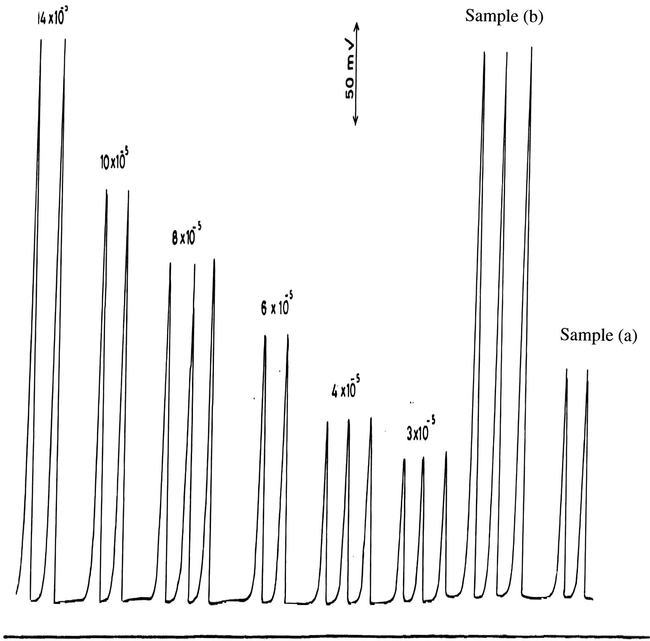
Calibration measurements of 3–14 × 10−5 M
at pH 1.5 and some authentic samples.
Sample
Taken (M)
Found (M)
Recovery (%)
Sample a
5 × 10⁻⁵
5.2 × 10⁻⁵
104
Sample b
13 × 10−5
12.9 × 10⁻⁵
99.2
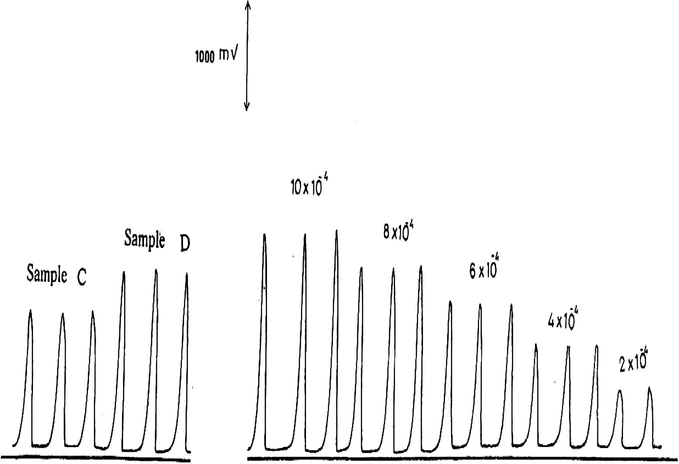
Calibration measurements of 2–10 × 10−4 M
in the presence of 10 × 10−4 M
at pH 3.5, and some authentic samples.
The results for the determination of
in higher concentration range (i.e. 2–10 × 10−4 M) and at pH 3.5 are shown in Fig. 6 and are plotted in Fig. 7. The statistical evaluation gave a best straight line with a slope of 1.91, an intercept of 0.128 and a correlation coefficient of 0.998. The results of the analysis of some authentic samples (Table 5 and Fig. 6) show a reasonable agreement between the expected results and those found with an average percentage recovery of 96.5%.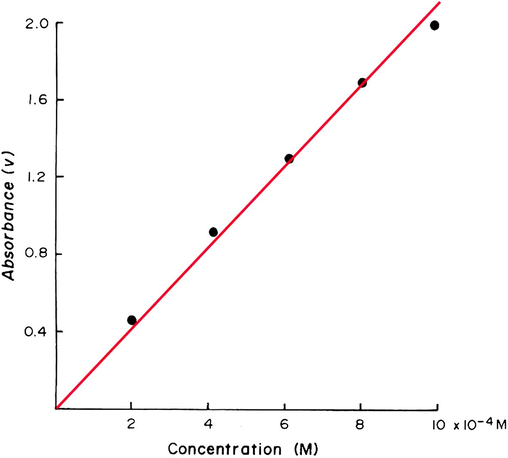
Calibration graph for the determination of 2–10 × 10−4 M
at pH 3.5.
Sample
Taken (M)
Found (M)
Recovery (%)
Sample C
6 × 10⁻⁴
5.8 × 10⁻⁴
96.7
Sample D
8 × 10⁻⁴
7.7 × 10⁻⁴
96.3
4.2 Determination of hydrogen peroxide
The effect of acidity on the oxidation of iron(II) by hydrogen peroxide was found to be not critical.
The calibration measurements for the determination of hydrogen peroxide in the range 2–8 × 10− M using 0.1 M iron(II) in 0.25 M HCl and 1 M SCN− are shown in Fig. 8 and are plotted in Fig. 9. This calibration graph is linear in the examined range with a best straight line slope of 2.56, an intercept of 28.54 and a correlation coefficient of 0.996. The results of the analysis of some authentic samples of hydrogen peroxide are shown in Table 6 and in Fig. 8. The found results agree reasonably will with those expected showing an average recovery of 98.3%.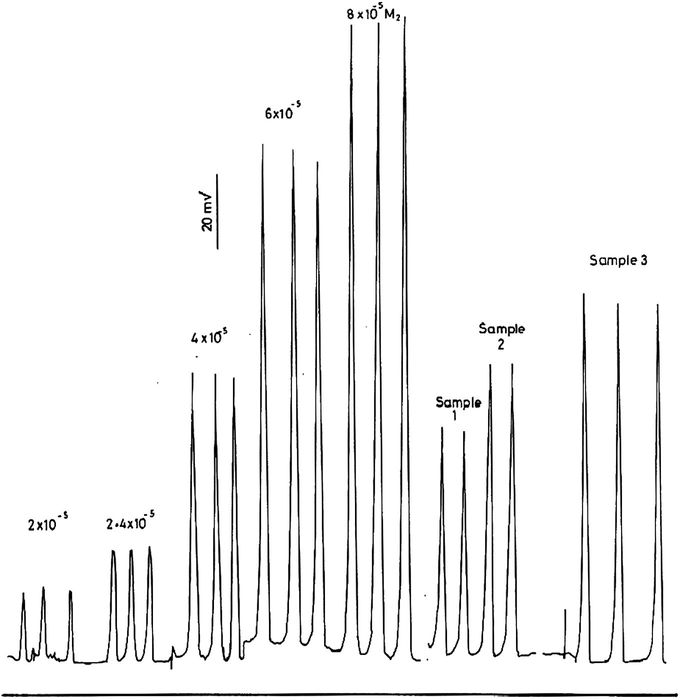
Calibration measurements of 2–8 × 10⁻⁵ M H2O2 and some authentic samples.
Calibration graph for the determination of 2–10 × 10−4 M H2O2 at pH 3.5.
Sample
Taken (M)
Found (M)
Recovery (%)
Sample 1
3 × 10⁻⁵
3 × 10⁻⁵
100
Sample 2
4 × 10⁻⁵
3.95 × 10⁻⁵
98.8
Sample 3
5 × 10⁻⁵
4.8 × 10⁻⁵
96
The precision of the method was examined by carrying out 10 replicate measurements of 6 × 10⁻⁵ M H2O2. The calculated statistical values were, standard deviation = 2.54 and the coefficient of variation = 1.97%.
4.3 Determination of permanganate
The investigation showed that there is no critical difference between the oxidation of iron(II) by permanganate either in 0.01 M or in 2 M H2SO4:
Therefore, permanganate was determined using 0.1 M iron(II) prepared in 2 M H2SO4. The calibration measurements for the determination of
in the range 1–8 × 10⁻⁵ M are shown in Fig. 1) and are plotted in Fig. 11. The calibration graph is linear in the investigated range with a best straight line equation of (Y = 4.91X − 24.19), a slope of 4.91 and a correlation coefficient of 0.999.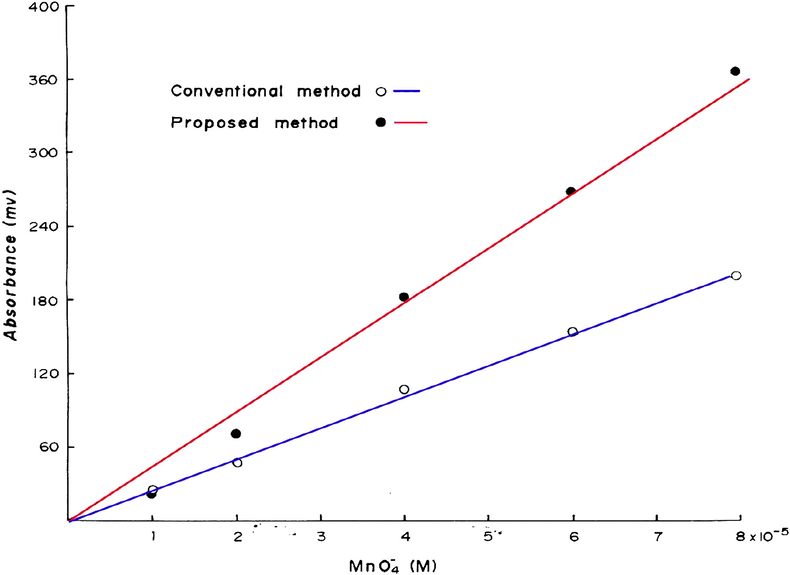
Calibration graphs for the determination of
in the range 1–8 × 10⁻⁵ M by the proposed and the conventional methods.
The analysis of some authentic samples of permanganate by this new method gave an average percentage recovery of 99.3% (Table 7 and Fig. 10) which is analytically good and acceptable.
Sample
Taken (M)
Found (M)
Recovery (%)
Sample 1
2.50 × 10⁻⁵
2.45 × 10⁻⁵
98
Sample 2
3.75 × 10⁻⁵
3.65 × 10⁻⁵
97.3
Sample 3
5.5 × 10⁻⁵
5.65 × 10⁻⁵
102.7
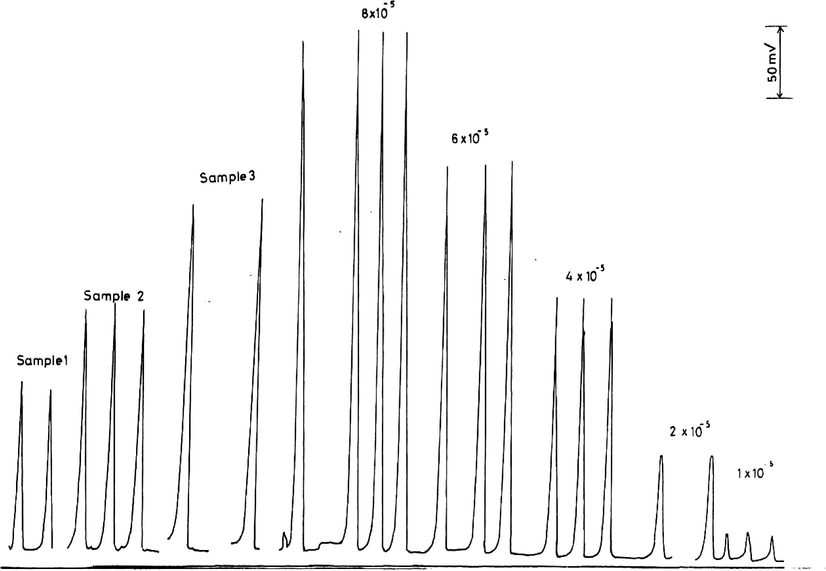
Calibration measurements of 1–8 × 10⁻⁵ M
and some authentic samples.
This new method has been compared with the conventional method that is based on the measurement of the well known permanganate color at 525 nm (Fig. 10). The calibration graph of the conventional method results shows a slope of 2.09 and a correlation coefficient of 0.999 which indicates that the proposed method is far more sensitive than the conventional method.
5 Conclusion
The statistical evaluation of the obtained results, for the calibration graphs and for the analysis of some authentic samples, proves that this proposed method is reasonably accurate, precise, simple and cheap.
Although the main disadvantage of this method, as with all oxidation methods, is the lack of selectivity, it has been shown that periodate can be determined in the presence of iodate, and nitrite in the presence of nitrate.
The sensitivity of this method, which is in the nanomole range, is better than some of the published methods that are used for the same purpose. The sampling rate was 60 injections per one hour.
References
- J. Inst. Chem. (India). 1984;54(4):167-168.
- J. Saudi Chem. Soc.. 2001;5(3):295-302.
- Anal. Chim. Acta. 1994;295(1):159-163.
- Microchem. J.. 1995;52(1):77-80.
- Anal. Chim. Acta. 1984;158(2):383-387.
- J. Saudi Chem. Soc.. 2001;5(2):139-150.
- Analyst (London). 1989;114(8):989-990.
- Analyst. 2011;136:1957-1964.
- Microchim. Acta. 1991;I(5):279-283.
- Talanta. 1989;36(3):357-362.
- Anal. Chim. Acta. 1986;184:227-234.
- Anal. Chim. Acta. 1992;261(1):404-410.
- Anal. Sci.. 1998;14(3):519-522.
- Mikrochim. Acta. 1993;110(1–3):71-77.
- Anal. Chim. Acta. 1982;136:113-119.
- Microchem. J.. 1984;29(1):87-91.
- Mikrochim. Acta. 2009;166(3–4):277-281.
- Fresenius J. Anal. Chem.. 1992;344(3):131-132.
- Analyst. 1998;123(9):1809-1812.
- Anal. Chim. Acta. 1991;248(1):219-224.
- Talanta. 2004;53(2):339-343.


