

Fluorine soil stabilization using hydroxyapatite synthesized from minerals wastes
⁎Corresponding author at: MT Nord Europe, Institut Mines-Télécom, Centre for Materials and Processes, Environnement, F-59000 Lille, France. bader.bouzar@imt-nord-europe.fr (Bader Bouzar),
-
Received: ,
Accepted: ,
This article was originally published by Elsevier and was migrated to Scientific Scholar after the change of Publisher.
Peer review under responsibility of King Saud University. Production and hosting by Elsevier.
Abstract
The objective of this study was to present a new approach to mineral waste valorization, based on the synthesis of hydroxyapatite (HAP) as an efficient and cost-effective adsorbent for the stabilization of fluorides (F-) in soil. Hydroxyapatites were synthesized from the reaction of potassium dihydrogen phosphate (KH2PO4) and waste paper fly ash (WPFA), fine limestone clay (FLC) and limestone filler (LF) rich in calcite. X-ray diffraction characterization results showed that for HAPFLC and HAPFL the main resulting phases were brushite (CaHPO5·2H2O) and for HAPWPFA was hydroxyapatite (Ca5(PO4)3OH). The FTIR spectra showed similar patterns to natural HAP containing orthophosphate groups (PO43-), hydroxylated groups (OH–) and both types A/B of carbonate apatite. SEM-EDS analysis of the individual HAP revealed a morphology consistent with phosphocalcic hydroxyapatite crystals. EDS analysis revealed a Ca/P atomic ratio equal to 1.92, 1.85 and 1.7 for HAPFLC, HAPLF and HAPWPFA respectively, which is similar to the stoichiometry of hydroxyapatites (Ca/P = 1.67). The use of HAP as an amendment to stabilize fluorides (F-) in the soil was demonstrated to be effective, the addition of 1% of the different HAP allowed the decrease of the concentration of F in the raw soil (73.8 mg/kg) to concentrations below the IWSI threshold (10 mg/kg), to 4.68 mg/kg, 5.63 mg/kg, and 0.8 mg/kg for HAPFLC, HAPFL and HAPWPFA respectively. Fluoride (F) sequential extraction results showed that it was extracted from the residual fraction (Fraction 4) after soil treatment, and was generally trapped on the hydroxyapatites (Ca5(PO4)3(OH)) by anion exchange with the hydroxides (OH–) to form the stable and insoluble fluorapatite ((Ca5(PO4)3F).
Keywords
Hydroxyapatite
Stabilization
Fluoride
Trapping mechanism
Mineral waste
Soil

- MMTE
-
Metallic and metalloid trace elements
- HAP
-
Hydroxyapatite
- WPFA
-
Waste paper fly ash
- FLC
-
Fine limestone clay
- LF
-
limestone filler
Abbreviations
1 Introduction
Soil pollution by metallic and metalloid trace elements (MMTE) and anionic compounds has become a major environmental concern today because of its impact on public health (Bader Bouzar et Mamindy-Pajany 2022; B. Bouzar et Mamindy-Pajany 2022). Soil is the main reservoir of MMTE and anionic compounds produced by natural and human activities, and it also contributes to the contamination of the food chain through absorption by plants and transfer by animals. Soil pollution by inorganic pollutants has a negative impact on soil properties, such as pH, structure, fertility and microbial activity, resulting in negative effects on soil characteristics and function. The eventual outcome of soil MMTE and anionic compounds pollution is a decrease in crop production. To reduce the risks of inorganic contaminant in soil, various remediation methods have been successfully used, including the use of cost-effective and environmentally friendly inorganic and organic amendments for in-situ immobilization of pollutants, which is becoming more common. Immobilization agents have successfully reduced the availability of metal ions through a variety of adsorption, complexation, precipitation, and redox reactions. Soil amendments can also be a source of nutrients and thus can also act as a soil conditioner, improving the soil’s physiochemical properties and fertility, resulting in enhanced plant establishment in metal contaminated soils.
Fluorine is a widespread chemical element in the environment, and its presence in soil, water, and food poses risks to human health and the environment. Toxic effects of fluorine in soil are more likely influenced by bioavailable concentrations (soluble and leachable) rather than total fluorine levels, as supported by various studies (Kang, Kim, et Park 2007; Jeong et al. 2017). Plant toxicity seems to be significantly affected by the water-soluble fluorine levels in soil (Jia et al. 2015). Research by Geretharan et al. (2017) suggests that water-soluble fluorine concentrations play a crucial role in fluorine mobility and retention in soil and are correlated with toxicity to soil microorganisms. Cronin et al. (2000) proposed that the most significant risk factors for toxicity and groundwater contamination are the bioavailable concentrations of fluorine in soil, particularly those in solution or water-soluble form. Therefore, managing the risks associated with fluorine-contaminated soil should prioritize consideration of bioavailable fluorine concentrations.
Stabilization involves a process that reduces the hazardous potential and leachability of materials like waste or soil by transforming contaminants into less soluble and less toxic forms, with the aim of safeguarding human health and the environment (Bäckström et al. 2004). Waste treatment is typically governed by regulatory requirements and may involve risk assessments when legislative standards are absent or advisory. Stabilization treatments often involve mixing or injecting treatment agents into the contaminated material, including inorganic adsorbents like clays, cements, and organic stabilizers such as bitumens or manures (Farrell et al. 2010; Bishop, Gress, et Olafsson 1982; Shively et al. 1986). Aluminum and calcium-based adsorbents are popular choices for removing fluoride due to their effective contaminant absorption abilities. However, the use of aluminum-based materials has raised concerns about potential toxicity to the nervous system and the presence of residual aluminum in treated water (Haron et Wan Yunus 2001; Y. Gan et al. 2019; Gong et al. 2012; Kim et al. 2020; Wang, Xu, et Wang 2020).
Calcium-based stabilizing agents, such as calcium hydroxide (Ca(OH)2) and hydroxyapatite (Ca10(PO4)6⋅(OH)2), are commonly used to stabilize heavy metals and fluoride (F) contamination. These agents work by converting bioavailable F into a chemically stable form, primarily through the reaction of Ca(OH)2 with F ions, resulting in the formation of insoluble calcium fluoride (CaF2) as represented by Eq. (1) (Jadhav et al. 2015). CaF2 is highly stable with low solubility (0.016 g/L), making it less soluble than other fluoride compounds like MgF2, Na3AlF6, HF, SiF4, and NaF (Pickering 1985).
Hydroxyapatite (HAp), a mineral found in bones and tissues, is known for its insolubility (Ksp = 3.16 × 10-60), biocompatibility, and non-toxicity. It has been studied as a potential adsorbent for fluoride removal, with the adsorption process involving the replacement of surface hydroxyl groups with fluoride ions within the crystal lattice, as shown in Eq. (2).
Therefore, the ability of hydroxyapatite (HAP) to adsorb fluoride is significantly influenced by particle size. Gao et al. Gao et al. (2009a; 2009b) have synthesized nano-hydroxyapatite (n-HAp) using various methods and compared its fluoride adsorption capacity to bulk hydroxyapatite. The results indicate that n-HAp defluorination performance is strongly linked to its size. Several methods have been used to produce n-HAp, including sol–gel processing, chemical precipitation, and hydrothermal processing (Sadat-Shojai et al. 2013). Most research on fluoride stabilization has focused on its presence in water, including drinking water, wastewater and groundwater (Tomar, Prasad, et Kumar 2014; Scheverin, Horst, et Lassalle 2022; Chen et al. 2016; Yapo et al. 2022; Deng et al. 2016). However, the effectiveness of fluoride stabilization in soil and its impact on human health risk have yet to be fully established. However, there are still several challenges that need to be addressed, such as synthesizing efficient sorbents locally, developing low-cost sorbents, ensuring sufficient availability of sorbents near fluoride-laden soils, and removing fluoride from groundwater effectively at natural pH levels.
The study aimed to address both soil fluoride ion concentration reduction and soil stability assessment in the presence of fluoride contamination. To achieve this, hydroxyapatite (HAP) was synthesized via a wet process using three distinct calcium-rich waste materials: waste paper fly ash (WPFA), fine limestone clay (FLC), and limestone filler (LF). This research holds significance due to its potential economic and environmental benefits, leveraging readily available and cost-effective calcium-rich waste resources, as noted by Chenorkian (1982). The conversion of these waste materials into HAP not only enhances soil quality but also stabilizes fluoride ions in the soil, all while yielding a valuable alternative material. Additionally, the synthesized HAP underwent comprehensive physicochemical characterization using various analytical techniques, including Fourier transform infrared (FT-IR), X-ray diffraction (XRD), and scanning electron microscopy (SEM), to support its suitability for the intended purposes.
The present study focused on the stabilization of fluoride (F) in soil using various soil amendments. Through laboratory experiments, the efficiency of F stabilization was assessed using different concentrations of synthesized hydroxyapatite (HAP), namely 1 wt%, 2 wt%, 3 wt%, 6 wt% and 9 wt% (mass percentage). To determine the concentration of stabilized F in the soil, we performed a modified sequential extraction. In addition, F sequential extraction was used to identify F-containing compounds formed during the stabilization process. Furthermore, the mechanisms responsible for F scavenging were investigated in order to understand the modifications in F speciation before and after the stabilization process.
2 Materials and methods
2.1 Soil
This study involved soil contaminated with fluoride from the Saint Nazaire region in France. Samples were taken from within a 1 km radius of the contaminated area, and were collected at a depth of 0–50 cm. In the laboratory, the soil was sieved through a 2 mm mesh to analyze its physicochemical properties. The initial particle size analysis of the wet process soil shows that it consists of below 30% by mass of fines (particles smaller than 63 μm), which confirms the very significant presence of sandy particles (≥63 μm) as classically found in soils. The loss on ignition at 550 °C amounts to about 8,18% and can be related to the organic matter content. Soil oxide composition is determined by X-ray fluorescence (FX). The results are reported in Table 1: According to the results of the X-ray fluorescence analysis, the raw soil contains a large proportion of silica (SiO2), and a considerable amount of iron oxide (Fe2O3) and alumina (Al2O3). According to the current regulations, the environmental analysis of the soil shows that it is considered as non-inert with regard to the release of F (73.8 mg/kg > 10 mg/kg set by the French regulations for inert waste).
| Chemical composition by XRF | wt.% | Metallic and metalloids trace elements (MMTE) | Concentration (mg.kg−1) | IWSI |
|---|---|---|---|---|
| SiO2 | 59.7 | As | 0.14 ± 0.03 | 0.5 |
| Al2O3 | 16.8 | Ba | 0.03 ± 0.01 | 20 |
| MgO | 1.5 | Cd | <0.009 | 0.04 |
| Fe2O3 | 5 | Co | <0.009 | *** |
| CaO | 2.8 | Cr | <0.05 | 0.5 |
| Na2O | 1.2 | Cu | 0.07 ± 0.01 | 2 |
| SO3 | 0.25 | Mo | 0.1 ± 0.05 | 0.5 |
| TiO2 | 0.83 | Ni | <0.047 | 0.4 |
| P2O5 | 0.23 | Pb | <0.047 | 0.5 |
| K2O | 3.5 | Sb | <0.009 | 0.06 |
| Se | <0.009 | 0.1 | ||
| Zn | <0,009 | 4 | ||
| Sulfates | 630 ± 39 | 1000 | ||
| Chlorides | 110 ± 19 | 800 | ||
| Fluorides | 73.8 ± 0.7 | 10 |
2.2 Mineral waste
The synthesis of HAPs can be performed in different methods, either in terms of processes or starting reagents. Our choices were made according to industrial considerations. The wet method was selected. The experimental device consists of a solid/liquid agitation in a batch reactor at atmospheric pressure and room temperature, thus with low energy cost compared to the synthesis processes that we have been able to reference. Most studies use soluble calcium and phosphate sources as starting reagents for wet synthesis. Our choice was to use a soluble phosphate source, potassium dihydrogen phosphate (KH2PO4), which is a product of the agricultural industry for the amendment of soils in potassium and phosphorus, and mineral waste as a source of insoluble calcium. The selection of these materials aims to valorize secondary products from industrial activities. These materials are waste paper fly ash (WPFA), fine limestone clay (FLC) and limestone filler (LF). The potential benefit is twofold: to revalue calcium-rich waste as decontamination materials. The availability of high purity LF will serve as a baseline knowledge for the valorization of these carbonate wastes. The chemical composition of WPFA, FLC and LF was determined by X-ray Fluorescence (XRF), the results are presented in Table 2 highlights the presence of Calcite (dominant phase) for WPFA, FLC and LF.
| Chemical composition by XRF |
WPFA wt.% |
FLC wt.% |
LF wt.% |
|---|---|---|---|
| O | 40,5 | 46.7 | 52.5 |
| Si | 6.8 | 7.94 | 0.22 |
| Al | 4.4 | 4.55 | 0.11 |
| Mg | 1 | 0.77 | 0.32 |
| Fe | 0.6 | 1.55 | 0.06 |
| Ca | 40.7 | 27.71 | 46.74 |
| Na | 0.3 | *** | *** |
| K | 0.6 | 0.77 | 0.01 |
| P | 0.2 | *** | *** |
| S | 0.6 | *** | *** |
| Ti | 0.4 | 0.19 | *** |
| Mn | *** | *** | *** |
| Zn | 0.1 | *** | *** |
| Cl | 0.8 | *** | *** |
| Ba | 0.1 | *** | *** |
2.3 HAP matrix synthesis
The HAP matrices were prepared by neutralization in the aqueous phase according to the following theoretical Eq. (3):
In a glass batch reactor of 1 L capacity, 163.3 g of potassium dihydrogen phosphate (KH2PO4) is dissolved in 800 mL of water. The pH of the starting phosphate solution is about 4.2. Once the reagent was completely dissolved, 200.2 g of calcium carbonate (CaCO3) was added in the form of a mineral waste selected (WPFA, FLC or LF), i.e. a liquid solid ratio (L/S) equal to 4. The introduction time was 20 min, i.e. about 5 g per minute to limit the release of CO2 caused by the dissolution of the CaCO3 at acidic pH. The introduced Ca/P atomic ratio corresponds to 1.67, i.e. a stoichiometric ratio characteristic of Ca-HA.
The pH of the solution was monitored continuously via Mettler Toledo InLab Reach Pro electrodes with an acquisition every 5 s using Labview software. The mixture was stirred at a speed of 350 rpm for 48 h. The resulting suspension was filtered at the end of the synthesis (Millipore-MCE 0.45 μm filter) and then rinsed with deionized water. The collected solid is dried in an oven at 105 °C for 24 h and then reduced to powder, by a mild grinding in a mortar. Fig. 1 presents schematically the synthesis and experimental modes used for the synthesis.
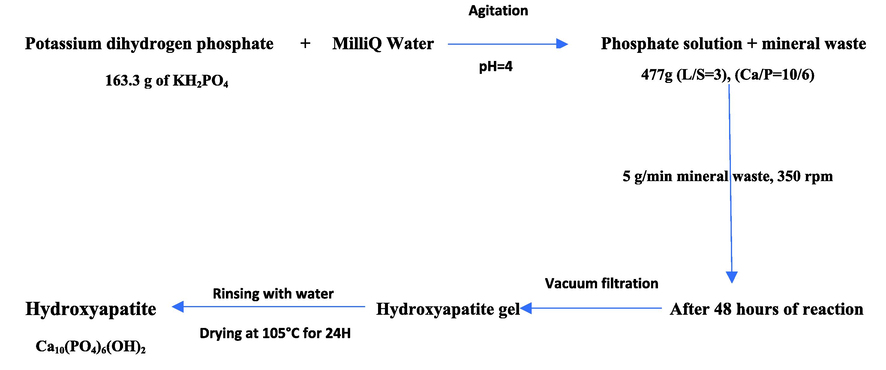
- Hydroxyapatite syntheses.
2.4 Materials characterization
The particle size distribution of HAP was determined using a dry-voice laser particle size analyzer. In this study, a Coulter LS 230 laser was used to determine the particle size between 0.04 μm and 2000 μm. The test was carried out in accordance wih NF ISO 13320–1 (AFNOR 2000). The counting of the cumulative percentages of particles is performed by analyzing the diffraction spots created by the particles when they cut the laser beam.
The specific surface area was measured by the BET method using a Micromeritics stirring analyzer (3FLEX Surface Characterization) according to NF EN ISO-18757 (AFNOR 2006). Prior to analysis, the samples were degassed from nitrogen with a Smart Prep degasser (VacPrep 061) under nitrogen at 80 °C for 8 h to remove moisture from the sample surface and pores.
The specific density of HAP was measured using a Micromeritics ACCUPYC 1330 Helium Pycnometer in accordance with standard NF EN 15326 (AFNOR 2009). The principle of which is based on the determination of the absolute volume occupied by a specific mass of material. The absolute volume of the sample is determined by sweeping the sample with helium gas at a fixed pressure. The method of calculation is based on the perfect gas relationship.
The XRF analysis was performed with a S4-PIONEER equipped with a 4 kW generator with a Rhodium anti-cathode. The instrument was capable of providing results in atomic mass percentages of the elements. The analyzed samples are ground and dried beforehand.
The mineral composition of HAP was determined by X-ray Diffraction (XRD). The analysis was performed on powders using a D8 Focus diffractometer from Bruker. The powder samples are placed on standard sample holders which are 1 to 2 mm deep, 25 mm in diameter and can hold approximately 1 g of powder. The sample is arranged to have a flat surface in order to respect the 0-plane of the wafer for diffracted ray detection. The ray source is a monochromatized Cobalt (λKα1 = 1.74 Å) with a Lynx Eye fast linear detector. The operating current is 20 mA and the voltage are 40 kV. The samples were analyzed over an angular range from 10° to 80° with an acquisition step of 0.02° and a compaction time of 5 s.
In order to quantify the formation of HAP and the decomposition of CaCO3 after synthesis, thermogravimetric (TG) and differential thermal analysis (DTA) analyses were performed on a NETZSCH STA 409C thermobalance. The analyzed samples were pre-dried in an oven at 40 °C to a constant mass. For each analysis, a quantity of 200 to 250 mg of dry powdered material is introduced into the apparatus and subjected to a linear temperature rise from ambient temperature to 1150 °C at a rate of 3 °C/minute under an inert gas (argon) with a flow rate of 75 mL/min. At the end of the test, the processing software accompanying the apparatus allows the recovery of the TG Coubes and the DTA derivative.
To study the morphology of phases present in the synthesized HAP, the Scanning electron microscope (SEM- Hitachi S-4300SE/N) and energy dispersive spectroscopy (EDS) observations were realized. The sample was introduced into the resin, then the solid powder was dispersed on a double-sided carbon tape with polishing. To ensure proper electron conduction in the SEM chamber, the samples were coated with carbon.
Fourier transform infrared spectroscopy (ATR-FTIR) measurements were performed using a Thermo Scientific Nicolet iS50 FT-IR spectrometer in a wavenumber range between 525 cm−1 and 4000 cm−1. Sample powder was directly placed on the diamond ATR crystal. The acquisition program was Pike GladiATR.
2.5 F stabilization experiment using HAP matrix synthesis
Batch leaching tests were performed according to EN 12457–2 (AFNOR 2002). The soil was sieved to 4 mm, the sample was relatively fine and therefore no crushing was necessary. For the leaching test, 90 g of soil samples was placed in a 2 L PTFE bottle, completed with adequate volume of MilliQ water to obtain a L/S (liquid to solid) ratio of 10 L/kg dry mass. This ratio has been fixed by the standard and ensures the reproducibility of the test and the comparison of the results of the test with environmental standards. The same preparation was repeated in the presence of 1%, 2%, 3%, 6% and 9% in mass of HAPWPFA, or HAPFLC, or HAPLF. Since the soil collected in the field was moist, the volume of water added for the tests was calculated by considering the initial moisture of the sample. The mixture was then stirred on a rotary shaker (Heidolph Reax 20) for 24 h at a speed of 10 rpm and ambient temperature of 25 °C. After 24 h, the pH of the suspension was measured and the leachate was decanted for 30 min and filtered through cellulose acetate membrane filters (0.45 µm). After acidification of the solutions with HNO3 (65%), the MMTE were analyzed by ICP-AES and the anions (fluorides, chlorides, sulfates) by ion chromatography (IC) (Bader Bouzar et Mamindy-Pajany 2022; B. Bouzar et Mamindy-Pajany 2022; Bader Bouzar, Mamindy-Pajany, et Hurel 2023; B. Bouzar et Mamindy-Pajany 2023).
2.6 Investigation of F removal mechanisms
The soil samples stabilized using WPFA, FLC, LF, HAPWPFA, HAPFLC, and HAPLF were subjected to four-step sequential extraction to determine the concentration of soluble F. Prior to this, the mixture underwent batch leaching tests and was subsequently dried at room temperature. To determine the concentration of stabilized F in the soil samples, the four-step sequential extraction method suggested by Xu et al. [30] was utilized. In the first step of this extraction process, 1 g of soil samples was mixed with 30 mL of distilled water and stirred for 15 h at 25 ± 0.5 °C to extract the water-soluble F fraction (fraction 1). Following this, the residue was then agitated with 30 mL of 20% (v/v) acetic acid/water for 15 h at the same temperature to extract the F fraction that was bound to carbonates (fraction 2). The subsequent step in the sequential extraction process involved determining the F fraction that was bound to sulfides (fraction 3). This was achieved by subjecting the residue obtained from the previous step to 30 mL of 15% (v/v) nitric acid/water in a covered vessel at room temperature for 1 h, followed by heating at 85 °C for an additional hour. The residual F fraction (fraction 4) was determined using microwave acid digestion. After each extraction step, the resulting sample was centrifuged at roughly 5,000 rpm and filtered through a 0.45 μm cellulose acetate membrane filter. Ion chromatography (IC) was then employed to determine the F concentrations in the extracted solutions. All experiments were conducted three times to ensure accuracy.
3 Results and discussion
3.1 pH monitoring
The evolution of pH during HAP synthesis was monitored every 5 s. The pH of the initial potassium dihydrogen phosphate solution was acidic, around 4.2. When the mineral waste rich in calcium carbonate was added, it reacted immediately with the acidic solution, releasing carbon dioxide. Fig. 2 shows the evolution of the pH during the first 60 min of the reaction. Time zero corresponds to the start of the mineral waste addition. The introduction time of mineral waste is about 20 min and the stirring of the suspension lasts 48 h.
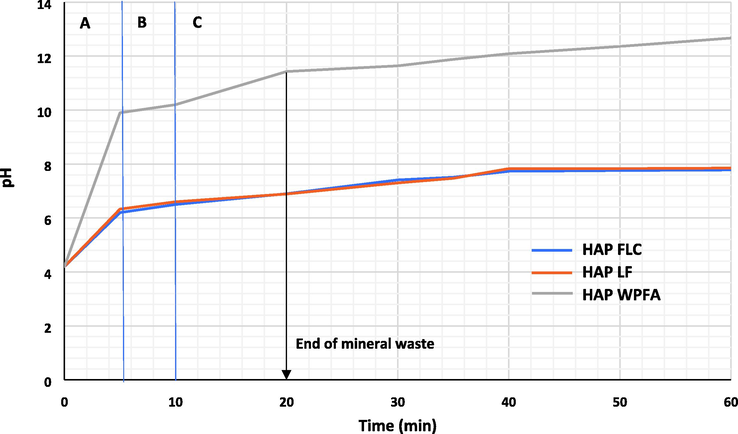
- pH evolution during the first 60 min of the synthesis reaction.
During the first 5 min of reaction, the pH increases extremely quickly to a value of 6.2, 6.3 and 9.9 for HAPFLC, HAPLF and HAPWPFA respectively (Zone A, Fig. 2). The release of carbon dioxide due to the dissolution of calcium carbonate was accompanied by a rather violent emulsion. The acid attack on the calcium carbonate powder leads to the consumption of H+ protons according to Eq. (4):
The presence of Ca2+ calcium ions in the orthophosphate solution then leads to the rapid precipitation of the first phosphocalcic species. According to the orthophosphate species distribution diagram as a function of pH (Ref), the majority of species at pH 4.2 was 98.6% H2PO42- (Pham Minh, Lyczko, et al. 2012). The formation of monocalcium phosphate monohydrate (Ca(H2PO4)2·H2O) was expected according to Eq. (5):
The continuous supply of calcium ions in solution, associated with the increase in pH, then favours the formation of a second intermediate in the formation of phosphocalcic hydroxyapatite. This is dicalcium phosphate dihydrate (CaHPO4·2H2O) or brushite. The formation of brushite leads to the release of H+ protons into solution according to Eq. (6). The result is a stagnation of the pH (zone B, Fig. 2), or even a minor increase, for a few minutes from a pH of 6.2, 6.3 and 9.9 for HAPFLC, HAPLF and HAPWPFA respectively. This can be explained by the temporary compensation between proton consumption for CaCO3 dissolution (Eq. (4) and protons release via brushite formation (Eq. (6).
After the plateau (area B, Fig. 2), the pH increases gradually to pH 7.8, 7.9 and 12.7 at 60 min of reaction (area C, Fig. 2) for HAPFLC, HAPLF and HAPWPFA respectively, the pH remained almost constant until the end of the reaction (48 h) for the different HAP. Similar observations were reported for a synthesis from calcium carbonate and other salts of ortho-phosphoric acid (Pham Minh, Lyczko, et al. 2012). The extremely basic pH observed in the synthesis of HAPWPFA was due to the presence of a large amount of calcium in the form of CaO, which hydrates to form Ca(OH)2, resulting in the basic pH (Bader Bouzar et Mamindy-Pajany 2022; Bader Bouzar, Mamindy-Pajany, et Hurel 2023).
3.2 Particle size distribution
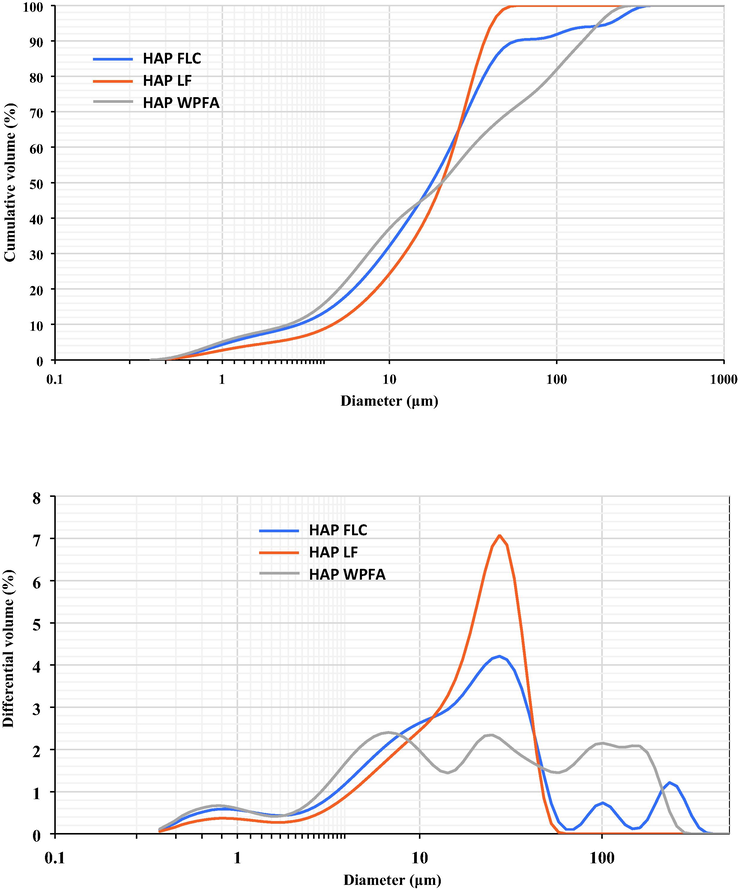
Fig. 3 provides a detailed depiction of the particle size distribution of three distinct powder forms: HAPWPFA, HAPFLC, and HAPLF. Among these samples, HAPFLC and HAPLF exhibit an intriguing tri-modal distribution pattern, spanning a size range from 0.35 to 400 µm. This distribution delineates three distinct population categories based on particle size: fine particles in the range of 0.35 to 2 μm, medium-sized particles spanning from 2 to 100 μm, and large particles extending from 100 up to 630 μm.
- Granular distributions of HAPWPFA, or HAPFLC and HAPLF.
This observation is particularly noteworthy for the clear and perceptible variation in particle size distribution among the samples. Specifically, there is a noticeable coarsening of fine particles and a concurrent reduction in the size of medium-sized particles. Remarkably, HAPLF no longer contains particles exceeding 100 μm in size, rendering its distribution bimodal in nature. In this bimodal distribution, fine particles are concentrated within the 0.35 to 1.8 μm size ranges, while medium-sized particles fall within the 1.8 to 63 μm range for both HAPLF and HAPFLC. In stark contrast, HAPWPFA exhibits a far more complex distribution pattern, characterized by a multimodal distribution. This entails the presence of smaller fine particles as well as larger coarse particles when compared to HAPFLC and HAPLF. It is worth noting that this discrepancy in particle size distribution may be attributed to the agglomeration phenomenon observed during the drying process at a temperature of 105 °C.
In summary, Fig. 3 highlights the particle size distributions of HAPWPFA, HAPFLC and HAPLF in powder form, revealing distinct patterns of coarsening, narrowing and multimodal distribution among these materials.
3.3 Thermogravimetric analysis (TGA)
Fig. 4 shows the results of thermal analysis obtained by ATG-DSC, on the synthesized HAP powders and the initial WPFA, FLC and LF. The HAP powders were first filtered, washed and then dried in an oven at 105 °C before analysis.

- The thermal characteristics of the mineral waste before and after HAP synthesis; FLC and HAPFLC (a); LF and HAPLF (b); WPFA and HAPWPFA (c).
The first mass loss observed for temperature below 100 °C, was attributed to the loss of residual water in the samples (<1 mass%). Then, only HAPWPFA shows a noticeable mass loss (1–2% mass) between 110 and 150 °C. This is attributed to the water loss of crystallization from monocalcium phosphate monohydrate (Ca(H2PO4)2·H2O). An important intermediate present HAP synthesized after 48 h of reaction was brushite, with a loss of its water of crystallization between 155 and 230 °C (3%, 4%, 6% mass for HAPWPFA HAPFLC and HAPFL respectively). The dehydration of brushite leads to the formation of anhydrous dicalcium phosphate (CaHPO4) or monetite (Eq. (7).
The monetite was then thermally transformed into calcium pyrophosphate (Ca2P2O7) by condensation (Eqs. (8) and (9). The characteristic mass loss of this transformation is between 365 and 510 °C (1%, 2% and 1% HAPFLC, HAPFL and HAPWPFA respectively).
The main mass loss observed between 550 and 950 °C on the different samples corresponds to the release of carbon dioxide following the decomposition of the remaining calcium carbonate into quicklime (CaO) (Eq. (10).
For the different raw samples WPFA, FLC and LF, the amount of calcite was significant before synthesis and varied between 16.03% (Fig. 4 c), 30.6% (Fig. 4 a) and 44.5% (Fig. 4 b) mass for WPFA, FLC and LF respectively. Regarding the samples after 48 h of reaction (HAP synthesis), it was observed that the loss of mass corresponding to the decarbonation of calcite between 550 and 950 °C decreased to reach 5% (Fig. 4 c), 12.7% (Fig. 4 a) and 23% mass (Fig. 4 b) for HAPWPFA, HAPFLC and HAPLF respectively. This proves that when the pH of the initial solution was 4, part of CaCO3 underwent dissolution, followed by the formation of Ca-P compounds. With increasing pH (up to pH > 6), CaCO3 was no longer soluble, which explains the presence of calcite even after HAP synthesis.
Between the temperature of 900 and 1000 °C, a mass loss of approximately 1.3% was detected for HAPWPFA, which could be attributed to the decarbonation of a type B carbonated apatite (Pham Minh, Sebei, et al. 2012; Elliott 2013). The temperature of decarbonation of this type of matrix can range from 550 to 1000 °C (Elliott 2013). This assumption is reinforced by the use of WPFA rich in CaCO3 as a starting reagent, which leads to the production of carbon dioxide and the presence of carbonate anions in solution. In Fig. 4 (DTG a, b and c), it can be noticed that all the mass losses referred before are endothermic and correspond properly, around 100 and 180 °C to water evaporation, and around 800 °C to CO2 loss.
3.4 X-ray diffraction analysis
Fig. 5 shows diffractograms obtained from powders subjected to a drying process at 105 °C, providing a critical overview of their structural composition and phase transformations. Three raw samples, namely FLC (Fig. 5a), FL (Fig. 5b) and WPFA (Fig. 5c), are the subject of this analysis. In the initial raw samples, diffractograms reveal the presence of intense, finely resolved peaks corresponding to calcite. The robust calcite peaks indicate the crystalline nature of calcite in these raw materials. However, the most intriguing observation comes from the transformations that occur during the subsequent synthesis of hydroxyapatite (HAP).

- X-ray diffractograms of the mineral waste before and after HAP synthesis; FLC and HAPFLC (a); LF and HAPLF (b); WPFA and HAPWPFA (c).
During HAP synthesis, the intensity of calcite peaks is significantly reduced, and in some cases disappears completely from the diffractograms. This indicates a substantial change in the structural composition of the materials during the synthesis process. Such changes are corroborated by data obtained from thermogravimetric analysis (TGA), as shown in Fig. 5. Furthermore, the X-ray diffraction (XRD) results are consistent with the findings of thermogravimetric analysis (TGA), revealing the presence of the unreacted calcite crystalline phase in the various diffractograms of synthesized hydroxyapatite (HAP), including HAPFLC (Fig. 5a), HAPFL (Fig. 5b), and HAPWPFA (Fig. 5c).
In addition, investigation of the hydroxyapatite synthesized from FLC and LF reveals a distinct phase, brushite (CaHPO5·2H2O). This phase is clearly detected by characteristic peaks in XRD patterns. In contrast, an amorphous octocalcium phosphate (Ca8H2(PO5)6·nH2O) with a Ca/P atomic ratio of 1.33 emerges as an intermediate and precursor stage in HAP formation. The presence of hydroxyapatite stoichiometric and/or carbonated was also detected, with a similar confidence index due to overlapping diffraction lines (Fig. 5c). Furthermore, analysis of the XRD data reveals the presence of other phases present in the raw material (Fig. 5a), including quartz (SiO2), dolomite ((CaMgCO3)2) and kaolinite (Al2O3. 2SiO2·2H2O).
Fig. 5c shows the XRD spectrum of WPFA and HAPWPFA, highlighting the crystallized phases and further clarifying the composition of WPFA. WPFA was composed exclusively of CaCO3. Intrinsically, it contains several minerals, including calcite (CaCO3), calcium oxide (CaO), Gehlenite (Ca2Al) and quartz (SiO2) (Bader Bouzar et Mamindy-Pajany 2022). The diffractogram of HAPWPFA (Fig. 5c) highlights hydroxyapatite (Ca5(PO4)3OH) as the dominant phase, with the presence of calcite peaks of decreased intensity compared to raw WPFA. This transformation results from the dissolution of calcium carbonate and the subsequent formation of HAP compounds, as explained in the section on thermogravimetric analysis. The brushite phase (CaHPO5·2H2O) is not detected, although its absence does not necessarily exclude its presence in HAPWPFA. In fact, the presence of CaO and Ca(OH)2 in the initial WPFA probably facilitated the morphological transformations. It is very probable that brushite (CaHPO5·2H2O) evolved into an apatitic phase, namely hydroxyapatite ((Ca5(PO4)3OH)), as detected (Elliott 2013). Altogether, the diffractograms and XRD analyses provide a comprehensive overview of the structural and phase transformations present during the synthesis of hydroxyapatite from different starting materials, highlighting the complex chemical and structural changes that occur in these materials.
3.5 FTIR
Fig. 6 shows infrared spectra obtained from an initial sample set, namely FLC, LF and WPFA, followed by an investigation of three samples after hydroxyapatite (HAP) synthesis, namely HAPFLC, HAPLF and HAPWPFA. The spectra provide valuable insights into the chemical composition and structural changes that occur during the synthesis process.
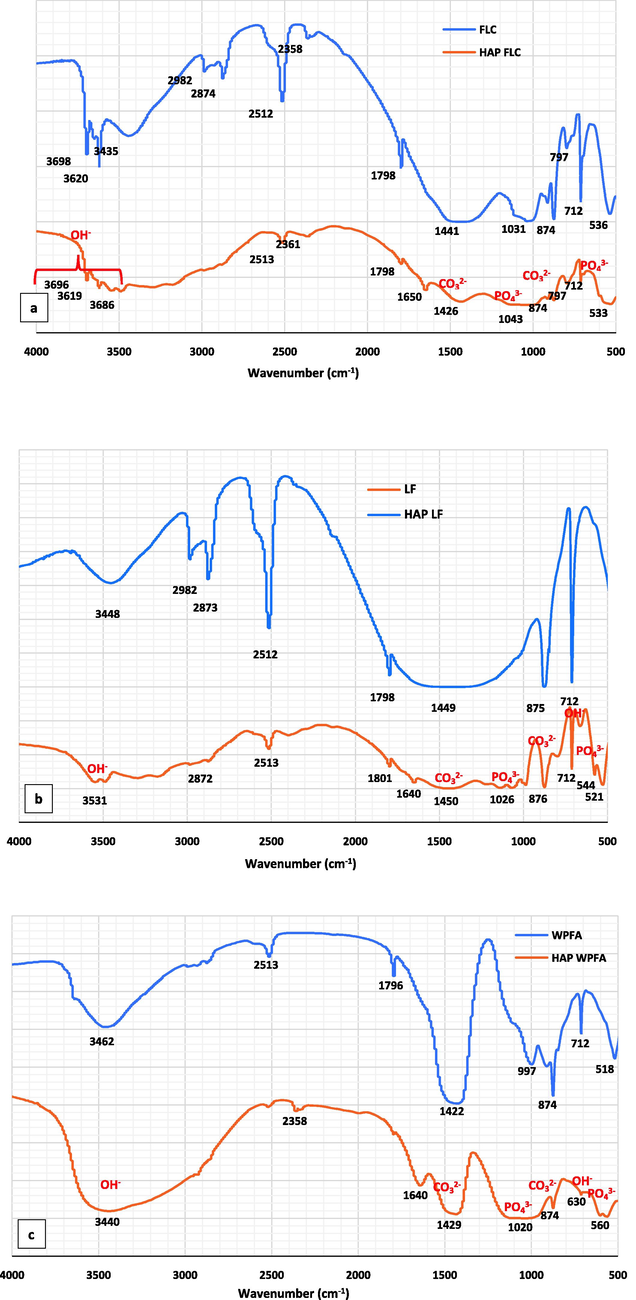
- FTIR spectra of the mineral waste before and after HAP synthesis; FLC and HAPFLC (a); LF and HAPLF (b); WPFA and HAPWPFA (c).
In the initial raw samples, distinct peaks associated with carbonate groups (CO32–) derived from calcium carbonate (CaCO3) are prominent at around 1400, 872 and 712 cm−1. Such peaks indicate the presence of CaCO3 in the material. However, as a result of the reaction and transformation of CaCO3 during HAP synthesis, the intensity of the carbonate peaks decreases significantly. This reduction is indicative of the chemical alterations that occur during the conversion of CaCO3 to hydroxyapatite. The IR spectra of the synthesized HAP samples show a number of outstanding similarities. In particular, a relatively broad peak around 1030 cm−1 emerges, attributed to the presence of orthophosphate groups (PO43-), characteristic of calcium hydroxyapatite (Ca-HA). Similar peaks are observed around 700 and 560 cm−1 in the various HAP samples, confirming the formation of hydroxyapatite. Interestingly, the peaks associated with the hydrogen phosphate groups (HPO42-) characteristic of brushite, typically present at 1020 and 1040 cm−1, are not clearly discernible in the various HAP samples. However, it should be noted that this intermediate phase in the apatite formation process has been clearly identified by thermogravimetric and XRD analyses.
Upon closer examination of the HAPFLC, HAPLF and HAPWPFA samples, there is a noticeable increase in peak intensity between 3000 and 3600 cm−1 compared to pre-synthesis materials. This increase was attributed to the presence of water of hydration molecules, which are increasingly common in synthesized HAP materials. In addition, two distinct groups of apatitic peaks (PO43-) emerge around 1090, 1020 and 960 cm−1, together with 600 and 560 cm−1, clearly identifying the formation of hydroxyapatite (Ca5(PO4)3OH) in the samples. Furthermore, peaks at around 3570 and 630 cm−1 can be attributed to the presence of OH– group characteristic of hydroxyapatite.
Especially interesting are the broadened peaks around 1430 cm−1, attributed to CO32– groups. In the literature, peaks at 1480 and 1410 cm−1 are typically associated with type B carbonate apatite, while the peak at 1450 cm−1 can be attributed to type A and B carbonate apatite (Fleet and Liu, 2005). Similarly, two peaks characteristic of carbonate groups at 875 and 858 cm−1 can be attributed to type A and B carbonate apatites, respectively. These results suggest the presence of CO32– ions in two distinct chemical environments, which could indicate the formation of a mixed A/B-type carbonate apatite. Notably, a peak characteristic of type A carbonate apatite at 1540 cm−1 is not observed (Elliott 2013). The presence of a second chemical environment, potentially corresponding to reformed CaCO3, is particularly evident in the HAPLF sample.
In short, the infrared spectra in Fig. 6 provide a comprehensive overview of the chemical composition and structural transformations occurring during hydroxyapatite synthesis. They reveal changes in carbonate groups, the emergence of orthophosphate groups characteristic of Ca-HA and the potential formation of a mixed A/B-type carbonate apatite, highlighting the complex chemical processes involved in these materials. These results are consistent with previous research in this field.
3.6 SEM-EDS analysis
SEM and EDS analyses were carried out on the initial mineral waste samples and on the solid products obtained after 48 h of synthesis for the production of hydroxyapatite (Ca-HA). Fig. 7 (a, b and c) shows SEM images of the initial powders, FLC, LF and WPFA, respectively, used as starting materials for Ca-HA synthesis. The SEM observations reveal that the particles of the raw materials exhibit a considerable degree of size heterogeneity, while retaining a constant structural homogeneity. The particles have a spherical morphology with well-defined crystalline structures.

- SEM-EDS images of the mineral waste before and after HAP synthesis; FLC(a); LF(b); WPFA(c); HAPFLC (d); HAPLF (e) and HAPWPFA (f).
Fig. 7 (d, e and f) shows SEM images of the solid products obtained after 48 h of synthesis (HAPFLC, HAPLF and HAPWPFA, respectively). The images demonstrate various morphologies in the synthesized hydroxyapatite (HAP) products. In particular, two distinct types of structure can be observed.
The first type includes large particles set out in agglomerates of spherical appearance, observed in HAPFLC (Fig. 7d) and HAPLF (Fig. 7e). Needle-shaped particles are also discernible in HAPLF (Fig. 7e) and HAPWPFA (Fig. 7f). This morphology is characteristic of phosphocalcic hydroxyapatite crystals, according to the results of XRD (Fig. 5) and FTIR (Fig. 6) analyses. The large agglomerates appear to be a mixture of small agglomerated particles associated with newly formed calcium phosphate particles, indicating complex interactions between particles during synthesis. Fig. 7 (f:HAPWPFA) highlights a lacy surface appearance, characteristic of phosphocalcic hydroxyapatite. Fig. 7 (d: HAPFLC and e: HAPLF) also reveals significant macroporous porosity, indicating the porous nature of the hydroxyapatite materials synthesized.
EDS analysis of these large particles collectively reveals Ca/P atomic ratios of 1.92, 1.85 and 1.7 for HAPFLC, HAPLF and HAPWPFA, respectively. This ratio corresponds to the stoichiometry of hydroxyapatite (Ca/P = 1.67). However, the presence of carbonate groups in the apatite structure and/or residual unreacted calcium carbonate may explain the slightly higher Ca/P ratio observed. Notably, the standard deviation in EDS analyses of these particles is low, indicating minimal variability and a relatively homogeneous surface. The second population consists mainly of small particles of a few microns in size, with a spherical morphology. EDS analyses carried out on these particles, as shown in Fig. 7 (g), reveal an average atomic ratio (Ca/P) of 2.9, 3.2 and 2.5 for HAPFLC, HAPLF and HAPWPFA, respectively. The smaller particles exhibit a more heterogeneous surface, partly due to the smaller particle size, which allows the electron beam to penetrate deeper into the particles. The presence of calcium carbonate, mainly in the core of the particles, has been demonstrated previously, leading to a high Ca/P atomic ratio, attributed to the presence of CaCO3. Consequently, Ca/P ratio variability is more pronounced in these particles.
Fig. 7 (g) shows the average atomic percentage derived from 30 EDS analyses, distinguishing between large (>20 μm) and small (<20 μm) particles. The overall mean Ca/P atomic ratio for all particles was measured at 2.4, 2.5 and 2.1 for HAPFLC, HAPLF and HAPWPFA, respectively. SEM and EDS analyses provide valuable information on the morphology, composition and structural heterogeneity of initial mineral waste samples and solid products obtained after Ca-HA synthesis. These results contribute to a comprehensive understanding of the complex processes and transformations that occur during the synthesis of hydroxyapatite from different initial materials.
3.7 Batch test: F concentration evolution
Batch leaching tests of the soil was performed according to NF EN 12457–2, and the results are presented in Fig. 8 for different mass percentages of HAPFLC, HAPLF and HAPWPFA. The resulting data in Table 1 reveal that the F-anion is the most abundant in the soil, with a concentration of 73.8 mg/kg, exceeding the threshold limits for inert waste storage installations (IWSI). Red line in the Figure represents the SETRA (SETRA, 2022) limit for L/S = 10 L/kg for fluoride.
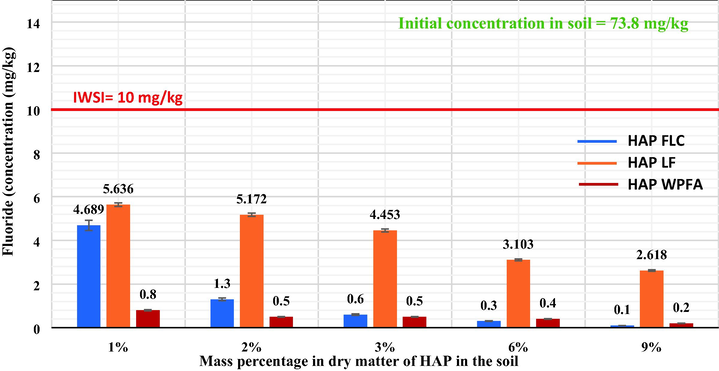
- .Leaching concentration of F- from soil after treatment with HAPFLC, HAPLF and HAPWPFA.
When the mass percentage of HAP in the medium increased by 1%, 2%, 3%, 6% to 9%, the fluoride (F) leaching decreased for a L/S = 10 L/kg ratio. The results showed that the addition of 1% HAPFLC, HAPLF and HAPWPFA provided effective stabilization of fluoride in the soil. The released amounts of fluoride were 4.68 ± 0.18 mg/kg, 5.63 ± 0.14 mg/kg, and 0.8 ± 0.1 mg/kg, respectively, compared to 73.8 ± 0.7 mg/kg for the untreated soil. In addition, the released fluoride concentrations were below the IWSI threshold set at 10 mg/kg (F-). After stabilization of the soil with 9% HAPFLC, HAPLF, and HAPWPFA, the release of fluoride (F) decreased significantly compared to the untreated soil, with concentrations reaching 0.11 ± 0.01 mg/kg, 2.61 ± 0.19 mg/kg, and 0.23 ± 0.09 mg/kg, respectively. This decrease represents a stabilization efficiency varying 99.6%, 91.8% and 96.8% compared to untreated soil, and is below the IWSI threshold for HAPFLC, HAPLF and HAPWPFA respectively.
According to the results in Fig. 8, the concentration of F released after treatment of the soil with the different HAP decreased to values below the IWSI threshold, from only 1% addition. Two possible trapping mechanisms exist to explain the decrease of fluoride release after treatment of the soil with the different HAP. The anionic exchange on the HAP seems to be realized between a hydroxide ion (OH–) of the apatite and a fluoride ion, thus forming insoluble fluoroapatite, thus decantable according to the reaction (11):
According to the FX results (Table 2), the different mineral wastes used in this study were highly rich in calcium, and after the synthesis, the characterization results whatever the XRD, FTIR, ATG and SEM-EDS showed that a considerable amount of calcium in the form of CaCO3 and or Ca(OH)2 did not react. Under these conditions, a second phenomenon may occur during the treatment of the soil with HAP, it is also possible that fluoride was trapped by precipitation of CaF2 according to reaction (1). The calcium hydroxide present in the different HAP can adsorb the fluoride and then decant.
Hydroxyapatites (Ca5(PO4)3OH), have been identified as highly effective adsorbents for labile fluoride, exhibiting strong affinity. As reported by Aoba (Aoba 1997), the reaction between soluble fluoride and HAps involves fluoride substitution in the apatite structure, where fluoride ions replace OH– ions in the mineral lattice of HAps, resulting in the formation of fluoroapatite, Ca10(PO4)6F2. This natural exchange process occurs within the typical pH range of water (6.0–7.5) and at temperatures ranging from 288 to 308 K (Nie, Hu, et Kong 2012). However, the uptake of fluoride by HAps is known to be slow, requiring equilibration times of 10–24 h (Nie, Hu, et Kong 2012; Murutu et al. 2009; Liang et al. 2011).
Several researchers have also examined the effectiveness of synthetic HAps in removing fluoride from water. For example, Larsen & Pearce (Larsen and Pearce, 2002) developed a fluoride adsorbent by reacting calcite and brushite, CaHPO4·2H2O Fluoride adsorption rates ranging from 70.5% to 98.8% were obtained from distilled water containing 5 to 20 mg/L fluoride using this adsorbent. Murutu et al. (Murutu et al. 2009) conducted a study where they synthesized hydroxyapatite (HAp) fluoride adsorbent. They achieved this by calcining limestone at a temperature of 1073 K and then reacting the resulting residues with 50% orthophosphoric acid under carefully controlled conditions at 323 K. On the other hand, MacDonald et al. (MacDonald et al. 2011) developed HAp fluoride adsorbents using a different approach. He reacted commercial quicklime (CaO) with controlled amounts of 85–90% phosphoric acid. Additionally, Liang et al. (Liang et al. 2011) prepared a glass-derived hydroxyapatite by etching sodium calcium borate glass using phosphoric acid. These studies highlight different methods for synthesizing hydroxyapatite fluoride adsorbents, showcasing the diverse approaches and techniques used in the field of material science research.
3.8 The sequential extraction of F
According to Zhou et al. (Zhu et al. 2019), the proportion of each chemical form of fluorine in soil can be used to assess its potential mobility and availability. The different forms of fluoride include a soluble form that has high mobility and can be absorbed by remediation materials, while the carbonate/calcium and sulfide-bound forms can be altered under certain conditions, and the residual fluoride fraction does not migrate. In addition, the analysis of chemical speciation of fluorine in soil provides a better understanding of its environmental dynamics.
To evaluate the impact of different HAP treatment on the mobile fractions of F in soil, F chemical extraction from soil was performed. The results of the F-sequential extractions for the raw soil along with the soils treated with 9% HAPFLC, 9% HAPLF, and 9% HAPWPFA are presented in Fig. 9. The results show that the total concentration of F in the raw soil was 85.7 mg/kg, the majority of the F was present as a soluble form in water (73.8 mg/kg in fraction 1). On average, only 2.4% and 0.46% of the F was bound to carbonates (2.1 mg/kg in fraction 2) and sulfides (0.4 mg/kg in fraction 3), respectively. These results emphasize the importance of the soluble form of F in the soil and highlight the low levels of F bound to carbonates and sulfides in the soil sample studied. Several studies have examined the correlation between the bioavailability of heavy metals and fluoride, i.e., their ability to leach or transport, and their different chemical forms in soil. It is commonly accepted that the water-soluble form (fraction 1) was the most toxic and mobile for heavy metals and fluoride (Jeong et al. 2017; Tack et Verloo 1995; Rodríguez et al. 2009; Violante et al. 2010). In this study, the concentration of leachable fluoride in the soil samples used for stabilization was 73.8 ± 0.7 mg/kg, which represents the fluoride water-soluble concentration of fraction 1. This concentration exceeded the regulatory level of IWSI fluoride, which is 10 mg/kg according to the SETRA guide (SETRA, 2022).
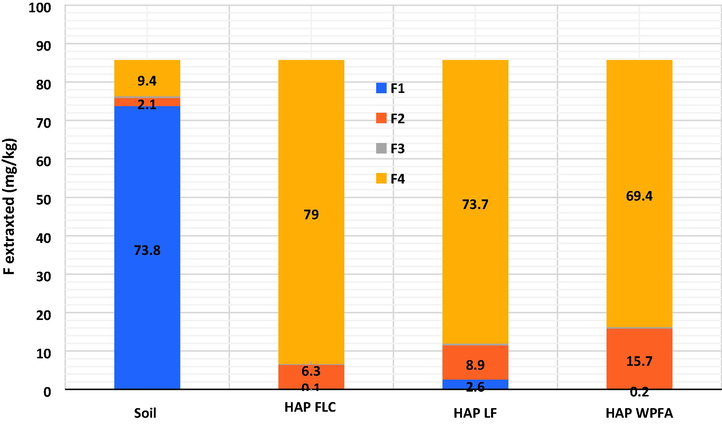
- F fraction distribution in soils before and after treatment with 9% HAPFLC, 9% HAPLF and 9% HAPWPFA.
Fig. 9 shows that the addition of 9% HAPFLC, 9% HAPLF, and 9% HAPWPFA to the soil samples changed the chemical forms of fluoride compared to the untreated soil sample. The concentration of bioavailable fluoride bound to fraction 1 decreased significantly to 0.1 mg/kg, 2.6 mg/kg, and 0.2 mg/kg for HAPFLC, HAPLF, and HAPWPFA, respectively, compared to 73.8 mg/kg in untreated soil. In contrast, the ratio of fluorine in residual form increased significantly to 92.2% (79 mg/kg), 85.9% (73.7 mg/kg), and 80.9% (69.4 mg/kg) in soil samples treated with 9% HAPFLC, 9% HAPLF, and 9% HAPWPFA, respectively, compared to only 10.9% (9.4 mg/kg) in untreated soil. These results highlight the effectiveness of these different HAPs in reducing the bioavailability of fluorine in soil by increasing its retention in residual form. The results show that the individual HAPs converted most of the leachable F into stable forms such as Ca5(PO4)3F, which resulted in effective stabilization of F in the soil. The HAP therefore acted as stabilizing agents for F. The concentrations of leachable F in the soil treated with the different HAP were within the French regulatory level for soils (i.e., 10 mg/kg). In addition, no significant differences in stabilization were observed between soil samples treated with 1%, 2%, 3%, 6% and 9% concentrations of the synthesized HAP.
Ca5(PO4)3OH was known to trap F ions by anionic exchange with hydroxides (OH–) in order to form fluorapatites (Ca5(PO4)3F), which could contribute to the stabilization of F (Fan et al. 2022; C. Gan et al., 2021). The solubility diagram of calcium and phosphorus compounds presented in the research of Cabanes (Cabanes 2006)shows that hydroxyapatite (HAP), which has a chemical composition of Ca5(PO4)3(OH), is the most stable and thermodynamically insoluble compound. Another research carried out by Bouzar et al. (B. Bouzar et Mamindy-Pajany 2022) showed that during the sequential extraction, HAP is extracted from the residual fraction (fraction 4), which confirms the results obtained in Fig. 10. Fluoride was extracted from the residual fraction after treatment with different HAP, this proves that fluoride was stabilized by the formation of fluorapatite compounds (Ca5(PO4)3F).

- Illustration of HAP trapping mechanism.
According to Sankannavar and Chaudhari (Sankannavar et Chaudhari 2019), the presence of Ca2+ has the effect of reducing the bioavailability of fluoride by promoting CaF2 precipitation in the soil. Thus, the reduction of soluble fluoride in soil water could also be explained in part by Ca2+ leaching from HAP dissolution. Thus, the reduction of soluble fluoride in soil water could also be explained in part by Ca2+ leaching from HAP dissolution. Since some of the non-reactive calcium remains as CaCO3 and/or Ca(OH)2 after HAP synthesis, formation of CaF2 precipitates may occur, this is observed more in soil treated with 9% HAPWPFA which contains a considerable amount of calcium hydroxide (Ca(OH)2) (fraction 3). Aldaco et al. Aldaco et al. (2007) also noted that the addition of calcium ions to fluoride-containing wastewater leads to the formation of an insoluble product (CaF2).
The information presented above reveals a more complex dimension of fluoride (F) ion trapping in soil, involving not only hydroxyapatite (HAP) but also calcium (Ca)-rich compounds that do not participate in the synthesis. Thus, the mechanism of fluoride retention by hydroxyapatite cannot be reduced to a simple adsorption of the F- ion on the HAP surface, as described in the study of Sundaram et al. (2008). Moreover, the anionic exchange of F- with hydroxide ions (OH–), as mentioned in the study of Sundaram et al. (2008) and that by Fan et al. (2022), represents only part of the overall process.
From this perspective, it is crucial to examine the potential mechanisms involved in the scavenging of fluoride ions by these calcium-rich minerals. Specifically, for hydroxyapatite synthesized from WPFA, it is envisaged that calcium in the form of Ca(OH)2 might have a significant influence. Similarly, for hydroxyapatite from FLC and LF, it is envisaged that calcium in the form of carbonates (Ca(CO3)) may interact with fluoride ions. These complex interactions between calcium-rich compounds and fluoride require further study to understand the underlying mechanisms and their contribution to fluoride scavenging in soil. Fig. 10 presents an illustration of the trapping mechanisms that can be envisaged by the different HAP synthesized; in general, fluoride ions can be trapped according to three mechanisms:
-
Precipitation of CaF2 in F-Ca solution (Eq. (1)
-
Adsorption of F- ion or F- complex on HAP surface,
-
Ion exchange of F- ion with OH– ion in HAP (Eq. (2)
The results of XRD, SEM-EDS and sequential extraction show that the three active elements for F-trapping are HAP together with Ca(OH)2 and CaCO3, which were not involved in the synthesis. For the different HAP synthesis (HAPWPFA, or HAPFLC and HAPLF), the dominant mechanism of F scavenging was the anionic exchange of F- with OH–. However, a study by Liang et al. (2011) reports that adsorption onto the surface of HAP is also possible, as shown in Fig. 10.
The results of XRD, SEM-EDS and sequential extraction show that the three active elements for F-trapping are HAP together with Ca(OH)2 and CaCO3, which were not involved in the synthesis. For the different HAP synthesis (HAPWPFA, or HAPFLC and HAPLF), the dominant mechanism of F scavenging was the anionic exchange of F- with OH–. However, a study by Haron et Wan Yunus (2001) reports that adsorption onto the surface of HAP is also possible, as shown in Fig. 10. The presence of calcium in the form of Ca(OH)2, or CaCO3, can progressively solubilize to precipitate CaF2 (Jeong et al., 2019) and generally fluorapatite (Deng et al. 2016) (Fig. 10).
4 Conclusion
The main objective of this study was to carry out the synthesis and subsequent characterization of hydroxyapatite, using WPFA, FLC and LF as precursor materials. The hydroxyapatite was intended for use as soil amendments to enhance the uptake of fluoride ions (F-). The synthesis process involved the reaction of waste mineral sources with KH2PO4, followed by crystallization. The results of this synthesis produced phases closely resembling natural hydroxyapatite. In particular, brushite (CaHPO5-2H2O) was observed as the primary phase of HAPFLC and HAPFL, and hydroxyapatite (Ca5(PO4)3OH) for HAPWPFA. TGA analysis revealed three decomposition stages characteristic of the different hydroxyapatite: dehydration of monocalcium phosphate monohydrate (Ca(H2PO4)2-H2O), dehydroxylation of brushite and apatitic products (CaHPO4-2H2O), and decarbonation of unreacted calcite during synthesis. Furthermore, FTIR spectroscopy demonstrated that the synthesized HAP exhibited spectra compatible with natural hydroxyapatite phases. Vibrational band analysis revealed the presence of orthophosphate groups (PO43-), hydroxyl groups (OH–) and two types of carbonated apatite (A/B). SEM-EDS analysis revealed two distinct morphologies: spherical agglomerates and needle-shaped particles. The morphology of needle-shaped particles corresponds to phosphocalcic hydroxyapatite crystals. In addition, EDS analysis revealed calcium/phosphorus atomic ratio (Ca/P) of 1.92, 1.85 and 1.7 for HAPFLC, HAPLF and HAPWPFA, respectively, which corresponds closely to hydroxyapatite stoichiometry (Ca/P = 1.67). The application of HAP as a soil amendment to stabilize F- proved effective. The amendment significantly improved soil leachate quality, resulting in a 90–99% reduction in fluoride release, depending on HAP type and percentage addition. Regardless of the specific HAP variant tested, whether HAPFLC, HAPFL or HAPWPFA, all demonstrated effectiveness in immobilizing F below the IWSI threshold of 10 mg/kg after 1% addition. The results of sequential fluoride extraction (F) indicated that fluoride was mainly extracted from the residual fraction (Fraction 4) after soil treatment. Subsequently, this fluoride was mainly sequestered on hydroxyapatite (Ca5(PO4)3(OH)) by anion exchange with hydroxides (OH–) to form the stable, insoluble fluorapatite (Ca5(PO4)3F). Consequently, the presence of unreacted calcium in the HAP synthesis process facilitated the precipitation of part of the fluoride in the form of CaF2.
Acknowledgements
The authors wish to acknowledge technical contributions of the chemistry pole of Institut Mines-Télécom. This research did not receive any specific grant from funding agencies in the public, commercial, or not-for-profit sectors.
Declaration of Competing Interest
The authors declare that they have no known competing financial interests or personal relationships that could have appeared to influence the work reported in this paper.
References
- AFNOR. 2000. « NF ISO 13320-1, Laser diffraction methods », septembre 2000.
- AFNOR. 2006. « NF EN ISO 18757, Determination of specific surface area pf ceramic powders by gas adsorption using the BET method », juin 2006.
- AFNOR. 2009. « NF EN 15326, Measurement of density and specific gravity », juillet 2009.
- AFNOR. 2002. « NF EN 12457-2, Leaching-Compliance test for leaching of granular wasre materials ans sludges », décembre 2002.
- Calcium Fluoride Recovery from Fluoride Wastewater in a Fluidized Bed Reactor. Water Res.. 2007;41(4):810-888.
- [CrossRef] [Google Scholar]
- The Effect of Fluoride On Apatite Structure and Growth. Crit. Rev. Oral Biol. Med.. 1997;8(2):136-153.
- [CrossRef] [Google Scholar]
- Mobilisation of Heavy Metals by Deicing Salts in a Roadside Environment. Water Res.. 2004;38(3):720-732.
- [CrossRef] [Google Scholar]
- Bishop, P., D. Gress, et J. Olafsson. 1982. « Cement stabilization of heavy metals: Leaching rate assessment ». In: Industrial Wastes-Proceedings of the 14th Mid-Atlantic Industrial Waste Conference. Technomics Lancaster, Pa, USA.
- Phosphorus Removal from Real and Synthetic Wastewater Using Biomass Bottom Ash. Int. J. Environ. Sci. Technol.. 2022;août.
- [CrossRef] [Google Scholar]
- Manufacture and Characterization of Carbonated Lightweight Aggregates from Waste Paper Fly Ash. Powder Technol.. 2022;juin:117583
- [CrossRef] [Google Scholar]
- Immobilization Study of As, Cr, Mo, Pb, Sb, Se and Zn in Geopolymer Matrix: Application to Shooting Range Soil and Biomass Fly Ash. Int. J. Environ. Sci. Technol.. 2023;janvier.
- [CrossRef] [Google Scholar]
- Innovative Reuse of Fly Ashes for Treatment of a Contaminated River Sediment: Synthesis of Layered Double Hydroxides (LDH) and Chemical Performance Assessments. Waste Biomass Valoriz.. 2023;février.
- [CrossRef] [Google Scholar]
- Cabanes, Frédéric. 2006. «Déphosphatation des effluents: Précipitation et valorisation du phosphore». PhD Thesis.
- Enhanced Fluoride Removal from Water by Sulfate-Doped Hydroxyapatite Hierarchical Hollow Microspheres. Chem. Eng. J.. 2016;285(février):616-624.
- [CrossRef] [Google Scholar]
- Note sur l’industrie lithique de l’amas coquillier de N’Gaty (Basse Côte-d’Ivoire) Bulletin de la Société préhistorique française. 1982;79(9):284-328.
- [CrossRef] [Google Scholar]
- Fluoride: A review of its fate, bioavailability, and risks of fluorosis in grazed-pasture systems in New Zealand. N. Z. J. Agric. Res.. 2000;43(3):295-321.
- [CrossRef] [Google Scholar]
- Fluoride Removal by Induced Crystallization Using Fluorapatite/Calcite Seed Crystals. Chem. Eng. J.. 2016;287(mars):83-91.
- [CrossRef] [Google Scholar]
- Structure and chemistry of the apatites and other calcium orthophosphates. Elsevier; 2013.
- Fan, Chuanfang, Naiyi Yin, Xiaolin Cai, Xin Du, Pengfei Wang, Xiaotong Liu, Yunpeng Li, et al. 2022. « Stabilization of Fluorine-Contaminated Soil in Aluminum Smelting Site with Biochar Loaded Iron-Lanthanide and Aluminum-Lanthanide Bimetallic Materials ». Journal of Hazardous Materials 426 (mars): 128072. https://doi.org/10.1016/j.jhazmat.2021.128072.
- Migration of Heavy Metals in Soil as Influenced by Compost Amendments. Environ. Pollut.. 2010;158(1):55-64.
- [CrossRef] [Google Scholar]
- Local Structure of Channel Ions in Carbonate Apatite. Biomaterials. 2005;26(36):7548-7554.
- [CrossRef] [Google Scholar]
- Remediation of Fluoride Contaminated Soil with Nano-Hydroxyapatite Amendment: Response of Soil Fluoride Bioavailability and Microbial Communities. J. Hazard. Mater.. 2021;405(mars):124694
- [CrossRef] [Google Scholar]
- Coagulation Removal of Fluoride by Zirconium Tetrachloride: Performance Evaluation and Mechanism Analysis. Chemosphere. 2019;218(mars):860-888.
- [CrossRef] [Google Scholar]
- Study on the Fluoride Adsorption of Various Apatite Materials in Aqueous Solution. J. Fluor. Chem.. 2009;130(11):1035-1041.
- [CrossRef] [Google Scholar]
- Size-Dependent Defluoridation Properties of Synthetic Hydroxyapatite. J. Fluor. Chem.. 2009;130(6):550-556.
- [CrossRef] [Google Scholar]
- Effects of soil properties on bioavailability of fluorine to microorganisms. Palmerston North, New Zealand: Fertilizer and Lime Research center, Massey University; 2017.
- Gong, Wen-Xin, Jiu-Hui Qu, Rui-Ping Liu, et Hua-Chun Lan. 2012. « Effect of Aluminum Fluoride Complexation on Fluoride Removal by Coagulation ». Colloids and Surfaces A: Physicochemical and Engineering Aspects 395 (février): 88‑93. https://doi.org/10.1016/j.colsurfa.2011.12.010.
- Removal of Fluoride Ion from Aqueous Solution by a Cerium-Poly(hydroxamic Acid) Resin Complex. J. Environ. Sci. Health A. 2001;36(5):727-734.
- [CrossRef] [Google Scholar]
- Importance of Chemical Binding Type between As and Iron-Oxide on Bioaccessibility in Soil: Test with Synthesized Two Line Ferrihydrite. J. Hazard. Mater.. 2017;330(mai):157-164.
- [CrossRef] [Google Scholar]
- Stabilization of fluorine in soil using calcium hydroxide and its potential human health risk. Environ. Eng. Res.. 2019;24(4):654-661.
- [Google Scholar]
- Porous 2-line ferrihydrite/bayerite composites (LFBC): fluoride removal performance and mechanism. Chem. Eng. J.. 2015;268:325-336.
- [Google Scholar]
- Fluoride Removal Capacity of Cement Paste. Desalination, Wastewater Reclamation and Reuse for Sustainability. 2007;202(1):38-44.
- [CrossRef] [Google Scholar]
- Mechanism of Simultaneous Removal of Aluminum and Fluoride from Aqueous Solution by La/Mg/Si-Activated Carbon. Chemosphere. 2020;253(août):126580
- [CrossRef] [Google Scholar]
- Defluoridation of Drinking Water by Boiling with Brushite and Calcite. Caries Res.. 2002;36(5):341-436.
- [CrossRef] [Google Scholar]
- Fluoride Removal Performance of Glass Derived Hydroxyapatite. Mater. Res. Bull.. 2011;46(2):205-209.
- [CrossRef] [Google Scholar]
- An Integrated Approach to Address Endemic Fluorosis in Jharkhand, India. J. Water Resour. Prot.. 2011;3(7):457-472.
- [CrossRef] [Google Scholar]
- Investigation on limestone-derived apatite as a potential low cost adsorbent for drinking water defluoridation. Capacit. Build. Knowl. Shar. Arm WISA 2009:1-15.
- [Google Scholar]
- Enhanced Fluoride Adsorption Using Al (III) Modified Calcium Hydroxyapatite. J. Hazard. Mater.. 2012;233–234(septembre):194-219.
- [CrossRef] [Google Scholar]
- Heavy Metal Distribution and Chemical Speciation in Tailings and Soils around a Pb–Zn Mine in Spain. J. Environ. Manage.. 2009;90(2):1106-1116.
- [CrossRef] [Google Scholar]
- Synthesis Methods for Nanosized Hydroxyapatite with Diverse Structures. Acta Biomater.. 2013;9(8):7591-7621.
- [CrossRef] [Google Scholar]
- « Novel Hydroxyapatite-Biomass Nanocomposites for Fluoride Adsorption ». Results. Engineering. 2022;16(décembre):100648
- [CrossRef] [Google Scholar]
- Leaching Tests of Heavy Metals Stabilized with Portland Cement. Journal (Water Pollution Control Federation). 1986;58(3):234-241.
- [Google Scholar]
- Chemical Speciation and Fractionation in Soil and Sediment Heavy Metal Analysis: A Review. Int. J. Environ. Anal. Chem.. 1995;59(2–4):225-238.
- [CrossRef] [Google Scholar]
- Adsorptive Removal of Fluoride from Aqueous Media Using Citrus Limonum (Lemon) Leaf. Microchem. J.. 2014;112(janvier):97-103.
- [CrossRef] [Google Scholar]
- Mobility and bioavailability of heavy metals and metalloids in soil environments. J. Soil Sci. Plant Nutr.. 2010;10(3):268-292.
- [CrossRef] [Google Scholar]
- Mechanism of Fluoride Removal by AlCl3 and Al13: The Role of Aluminum Speciation. J. Hazard. Mater.. 2020;398(novembre):122987
- [CrossRef] [Google Scholar]
- « Removal of Fluoride in Groundwater by Adsorption Using Hydroxyapatite Modified Corbula Trigona Shell Powder ». Chemical Engineering Journal. Advances. 2022;12(novembre):100386
- [CrossRef] [Google Scholar]
- Increased ZnO Nanoparticle Toxicity to Wheat upon Co-Exposure to Phenanthrene. Environ. Pollut.. 2019;247(avril):108-117.
- [CrossRef] [Google Scholar]


