

Translate this page into:
Folic acid-based carbon dots as an environmentally friendly and functional inhibitor for metal protection
*Corresponding authors: E-mail addresses: yexinyun1270@163.com (X. Ye); y_w_ye@163.com (Y. Ye); jiangqh1968@126.com (Q. Jiang)
-
Received: ,
Accepted: ,
Abstract
A green and functional inhibitor (Cu-N-CDs) was prepared by combining folic acid with copper gluconate. A series of professional testing equipment was used for structure and performance characterization. By analysis, the obtained Cu-N-CDs inhibitor displayed a super inhibition ability (over 98%) for Escherichia coli (E. coli) and Staphylococcus aureus (S. aureus). The corrosion inhibition ability of Cu-N-CDs increased with an increase in Cu doping, reaching its maximum value at Cu3.0-N-CDs, and then decreased. In this case, the corrosion inhibition efficiency of IE reached up to 92.87% at 200 mg/L. The adsorption of Cu-N-CDs on the interface was chemisorption and physisorption, following the Langmuir adsorption model. The corrosion product and simulation calculation confirmed the formation of a protective layer of inhibitor molecules on the metal surface.
Keywords
Adsorption mechanism
Cu
Cu doping ratio
Functional Inhibitor
Metal protection
N co-doped carbon dots

1. Introduction
Metal material has been widely used in industrial and biological fields because of its excellent physical and mechanical performance [1-3]. Nevertheless, metal often undergoes serious corrosion in some conditions, especially in harsh environments containing chloride ions and microorganisms (such as marine infrastructure). This tremendous corrosion could cause serious safety hazards, economic losses, and environmental pollution [4-6]. Therefore, it was necessary to improve the anticorrosion and antimicrobial ability of metals during service.
Among many protection methods, adding a functional inhibitor was one of the most cost-effective methods to protect metals [7-9]. Usually, a functional inhibitor could form a dense adsorption film on the metal surface to isolate the erosion of corrosive ions and change the environment around the metal, thereby achieving anticorrosion and antimicrobial effects. Carbon dots (CDs) have shown great potential in corrosion protection and antimicrobial fields due to their good water solubility, low toxicity, environmental friendliness, wide source of raw materials, low cost, and good biocompatibility [10-12]. For instance, CDs, as a new type of corrosion inhibitor, could avoid the environmental pollution caused by traditional inhibitors such as chromates and phosphates [13]. Meanwhile, it would also have excellent corrosion inhibition for metals in harsh environments. Long et al. [14] synthesized a type of CDs in situ using common sugars as raw materials, which achieved an IE of over 90% on Q235 carbon steel in 0.5 M H2SO4. Ye et al. [15] prepared a green and efficient N-doped carbon dot (N-CDs) using an oil bath method, and further revealed its molecular/atomic-scale protective mechanisms through molecular simulation calculation. Gu et al. [16] prepared a N-CDs/polymethyl trimethoxysilane composite coating on the surface of an AZ91D magnesium alloy using citric acid and urea. It found that the N-CDs successfully induced the formation of MgO and Al2O3 on the surface of the AZ91D magnesium alloy, finally enhancing the corrosion resistance of the coating. Thus, the CDs inhibitor played a key role in the field of corrosion protection.
The CDs also played an important role as anti-microbials. For example, Kang et al. [17] extracted a reddish-brown CDs from Artemisia argyi leaves using a smoking simulation method, which obtained selective antibacterial ability against Gram-negative bacteria. Xing et al. [18] developed an N-CDs through a simple one-step pyrolysis method, which demonstrated a better therapeutic effect than antibiotics on a wound model infected with S. aureus. Huang et al. [19] successfully prepared a kind of N-CDs inhibitor with good water solubility and achieved efficient inhibition for E. coli and S. aureus (above 95%). Yang et al. [20] prepared Cu-doped carbon dots (Cu-CDs) with excellent catalase-like and peroxidase-like activities, which could inhibit bacterial growth through the production of oxygen and reactive oxygen species.
In this research, a green and efficient functional inhibitor (Cu-N-CDs) consisting of folic acid and copper gluconate was prepared. By using Fourier transform infrared spectroscopy (FTIR), UV-Visible spectrometer (UV-Vis), X-ray photoelectron spectroscopy (XPS), Transmission electron microscope (TEM), and Atomic force microscope (AFM), the chemical structure, surface morphology and grain size of the functional inhibitors were verified. The plate coating method was utilized to illustrate the antimicrobial behavior of functional inhibitors. The electrochemical measurements and weight loss testing were employed to evaluate the anticorrosion effects of functional inhibitors. The protection mechanism of functional inhibitors was demonstrated by SEM (Scanning electron microscope), XPS, adsorption isotherm curve, and molecular simulation calculation.
2. Materials and Methods
2.1. Materials
Trichloroacetone, L-N-para aminobenzoyl glutamate, 6-hydroxy-2,4,5-triaminopyrimidine sulfate, sodium metabisulfite, potassium bromide, sodium carbonate, copper gluconate were purchased from Jiangsu Ruifeng Biochemistry Co., Ltd. Sodium chloride, sodium hydroxide, hydrochloric acid were provided by China National Pharmaceutical Group Chemical Reagent Co., Ltd. Bacteria were sourced from China bacterial preservation center. Q235 steel electrodes were manufactured by Shengxin Technology Co., Ltd.
2.2. Sample preparation
The synthesis method of functional inhibitors has been shown in Figure 1. The detailed synthetic route of folic acid was consistent with the existing report [21,22]. In short, the folic acid was obtained by the reaction between trichloroacetone, 6-hydroxy-2,4,5-triaminopyrimidine sulfate, and L-N-para aminobenzoyl glutamic acid in the presence of sodium metabisulfite and sodium carbonate at the pH range between 3.0-3.5 and the reaction temperature range between 40-45°C for 5 hrs. It is worth mentioning that the pH value of the reaction solution needs to be regularly monitored using a pH meter during the reaction process. After that, the obtained folic acids (3.0 g) with different quantities of copper gluconate (0, 1.5, 3.0, and 6.0 g) were added to distilled water. By stirring and sonication for 10 mins, these substances were fully dissolved and transferred to a high-temperature reaction axe. Then, they were placed in a drying oven to prepare for the reaction. In order to ensure sufficient reaction, the reaction temperature was set to 180 °C, and the reaction time was set to 8 hrs. After the reaction, the solution was repeatedly filtered and centrifuged until there was no precipitation. Finally, the obtained solution was transferred to a drying oven for drying treatment at the temperature of 80°C for 48 hrs, because the obtained functional inhibitor was prone to dampness. For convenience, the folic acids (3.0 g) with different quantities of copper gluconate (0, 1.5, 3.0, and 6.0 g) were denoted as N-CDs, Cu1.5-N-CDs, Cu3.0-N-CDs, and Cu6.0-N-CDs, respectively.
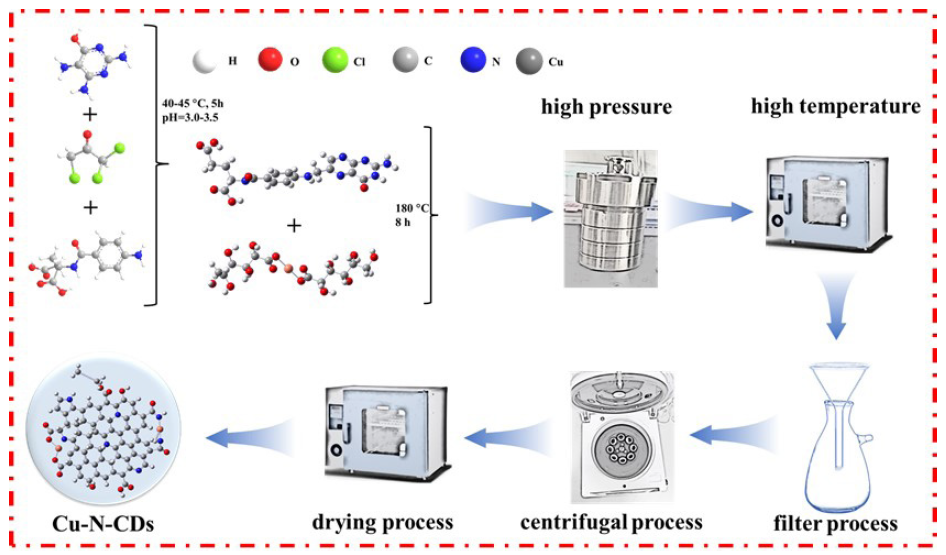
- The synthesis method of functional inhibitors.
2.3. Sample characterization
FTIR can provide information about molecular vibration and rotation, which can be used to study the structure and chemical bond of a sample. UV-Vis can be used to measure the absorption degree of ultraviolet and visible light by the sample, thereby determining its composition and structure. XPS is a surface analysis method with high sensitivity, which is mainly used for qualitative analysis, quantitative analysis, chemical state analysis, and depth analysis. TEM can provide atomic-scale resolution of the sample. AFM can provide nanoscale surface morphology images, revealing the microstructure of the sample surface. Thus, the chemical functional groups and elemental states of inhibitors were confirmed via FTIR, UV-Vis, and XPS. The micro-morphologies, distribution, and size of inhibitors were analyzed through TEM and AFM. Before FTIR and XPS testing, all inhibitor powders need to be dried first and then pressed into a certain shape. Different from FTIR and XPS, all inhibitor powders need to be formulated into a solution with a certain concentration in UV-Vis, TEM, and AFM testing. Subsequently, the inhibitor solution was dropped onto the surface of the silicon wafer and copper mesh for AFM and TEM testing, respectively.
2.4. Antimicrobial experiment
The typical representatives of Gram-negative and positive bacteria, E. coli (ATCC 35401) and S. aureus (ATCC 31890), respectively, were inoculated onto the surface of nutrient agar and cultured at a constant temperature for 1 day. Then, the bacterial strains were scraped off and transferred to a Luria Bertani agar medium. After that, the bacterial strains were sealed with sterile sealing film and incubated at a constant temperature in a shaking incubator at 160 rpm for 24 hrs. They were then centrifuged at 2000 r/min for 300s. Finally, the bacteria were rinsed twice with phosphate buffer (pH=7.4) and diluted to the concentration of 1.0×10⁻⁵ CFU/mL for later use.
The plate counting method was used to statistically analyze the bactericidal kinetics curve. In detail, the bacterial solution was mixed with 200 mg/L functional inhibitors and coated on blank nutrient agar plates. Finally, the bacteria number was calculated (0-24 hr).
2.5. Anticorrosion experiment
Q235 steel, as a common carbon structural steel, has been widely used in industrial fields, such as constructions, bridges, ships, and machinery, due to its good plasticity, weldability, and processability. Therefore, it was selected as the research object for electrochemical corrosion. Before conducting the anticorrosion experiment, the Q235 steel was carefully polished with 400-2000 grit sandpapers, then put into absolute ethanol for ultrasonic treatment, and dried in cold air. After that, the steel was welded onto the wire and packaged using AB adhesive, exposing a 1×1 cm2 surface for electrochemical testing. Subsequently, a three-electrode system was used to evaluate the anticorrosion behavior of inhibitors. The EIS was measured in a 3.5% NaCl solution at a stable open circuit potential (OCP). The frequency range was from 100000 Hz to 0.01 Hz and the excitation signal was 5 mV. The polarization range during Tafel curve test was EOCP ± 300 mV and the scan rate was 1 mV/s.
After corrosion testing, the working electrode was taken out and washed with distilled water. The corrosion morphologies and element distribution of the working electrode were obtained through SEM with energy dispersive spectroscopy (EDS). The surface profile and roughness of working electrode were measured using a 3D profilometer. The composition of the corrosion product on working electrode surface was analyzed using the aforementioned XPS.
2.6. Weight loss experiment
First, the six surfaces of steel were polished by 400-2000# SiC water sandpapers, followed by cleaning and degreasing. After the sample was processed, its quality was first weighed using an electronic scale, and then immersed in inhibitor solutions of different concentrations (0, 50, 100, 150, and 200 mg/L) for treatment. After different immersion times (2-60 hrs), the sample was taken out and weighed. Finally, the corrosion rate (VCR) was calculated based on the difference in quality before and after immersion as well as the immersion time. The detail calculation formula was as follows (Eq. 1):
Among them, W1 represented the sample quality before immersion (g), W2 was the sample quality after immersion (g), T denoted the immersion time (h).
2.7 Simulation calculation
Density functional theory (DFT) was used to calculate the quantum chemistry (QC) information of folic acid, copper gluconate, and Cu-N-CDs in the gas phase. The 6–31 G+ (d,p) basis set was adopted to optimize all geometry and exchange correlations of atoms at the B3LYP DFT level. The energy of the highest occupied molecular orbital (HOMO), the lowest unoccupied molecular orbital (LUMO), the gap (ΔE) between HOMO and LUMO, and surface electron distribution were obtained. Since Fe (110) was the surface with the highest atomic density, the molecular dynamics (MD) simulation was conducted to research the adsorption configuration of the inhibitor molecule on the Fe (110) surface with a COMPASS II force field. In detail, the interaction between the Fe (110) surface and inhibitor molecule was conducted in a simulation box with periodic boundary conditions, and the surface was magnified into (6 × 6) supercells. In order to prevent the influence of periodic images on the surface above the molecules, a 30 Å high vacuum plate was added above the metal surface. The electrostatic, non-binding, and van der Waals interactions were set as atom based summation using the Ewald summation method and a cut-off radius of 9.50 Å. Fe (110) was composed of six layers. The layer near the bottom was frozen. The adsorption system contained 500 H2O, 10 Na+, and 10 Cl-, and one inhibitor molecule. A proper simulation time could better achieve the equilibrium state of the model, thus MD simulation was conducted using a canonical ensemble (NVT) at 298.0 K with a time step of 1.0 fs and a simulation time of 500 ps. Before MD simulation, the geometric shape of the system had already been optimized. The adsorption process was simulated through the model until the temperature and energy of the system reached equilibrium. Finally, the adsorption state and interfacial energy difference of the inhibitor molecule was revealed through QC and MD simulation.
3. Results and Discussion
3.1. Composition of functional inhibitors
The FTIR spectra of functional inhibitors have been depicted in Figure 2(a). From it, a series of absorption peaks were detected in the spectrum. For example, a lot of characteristic peaks of C-OH, -CH2, COO-, C=O, C-H, -CH3, O-H, -NH-CO-, C=N, and N-H were observed at 1184.5, 1400.1, 1461.9, 1696, 2830.7, 2993.6, 3408.7, 1651, 1650, and 1587 cm-1 [23,24]. After the addition of Cu atoms, two weak peaks of Cu-O and Cu-N stretching vibration were observed at 506 and 1045 cm-1 [25]. This indicated that Cu atoms were successfully doped onto the surface of CDs, mainly in the form of complexation with oxygen-containing and nitrogen-containing functional groups.
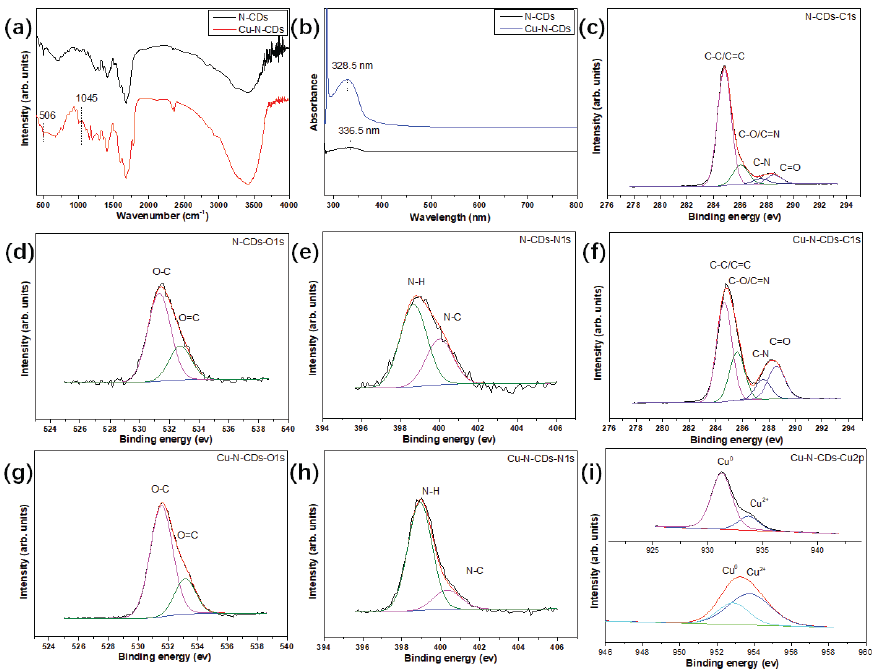
- (a) FTIR; (b) UV-Vis; (c) N-CDs-C1s; (d) N-CDs-O1s; (e) N-CDs-N1s; (f) Cu-N-CDs-C1s; (g) Cu-N-CDs-O1s; (h) Cu-N-CDs-N1s; (i) Cu-N-CDs-Cu2p.
The UV-Vis spectra of functional inhibitors have been presented in Figure 2(b). One obvious peak was detected in functional inhibitors, while there was a certain difference in the position of the peak. In the N-CDs inhibitor, the peak was located at 336.5 nm and the intensity was weak, corresponding to the slight n-π* transition. In the terms of the Cu-N-CDs inhibitor, the peak intensity increased and the peak position transferred to 328.5 nm, indicating that Cu atom doping affected its transition behavior.
The XPS spectra of functional inhibitors have been displayed in Figure 2(c-i). For the N-CDs inhibitor, four typical peaks at 284.5, 285.6, 287.6, and 288.5 eV attributing to C-C/C=C, C-O/C=N, C-N, and C=O bonds were observed in the C1s spectrum. Meanwhile, the O1s spectrum was fitted to two peaks, which were located at 531 and 532.7 eV, corresponding to O-C, and O=C bonds. Moreover, two peaks at 398.2 and 399.7 eV were observed in the N1s spectrum, which corresponded to N-H and N-C bonds. In case of Cu-N-CDs inhibitor, the fitting results of C1s, O1s, and N1s spectra were similar to the N-CDs inhibitor. However, the Cu2p spectrum could be fitted to four peaks at 933.1, 952.7 eV and 933.7, 953.8 eV, which belonged to Cu0 and Cu2+, respectively [25].
3.2. Morphology of functional inhibitors
Figure 3(a-b) show the TEM images of functional inhibitors. By observation, the functional inhibitors were well dispersed in distilled water. Meanwhile, the functional inhibitors were approximately spherical. Through statistics, the size range of N-CDs belonged to 2∼5 nm, while the Cu-N-CDs inhibitor presented a larger size of 3∼10 nm, implying that Cu atom doping might change the size of inhibitor. Figure 3(c-f) revealed the AFM images of functional inhibitors. Obvious nanoparticles were observed on the surface of the Si wafer. In the meantime, both groups of inhibitors were evenly dispersed without significant aggregation, which was consistent with the results of TEM. From the three-dimensional perspective, it could be observed that the height of the N-CDs nanoparticles was less than 4 nm, but the value of Cu-N-CDs nanoparticles was less than 8 nm. In order to gain a more intuitive understanding of the height and size of the inhibitor nanoparticle please see Figures 3(g-h). Through calculation, the height of N-CDs nanoparticles was about 1.5∼3.5 nm, but the value of Cu-N-CDs nanoparticles was around 4∼8 nm. Thus, the results of AFM were consistent with those of TEM.
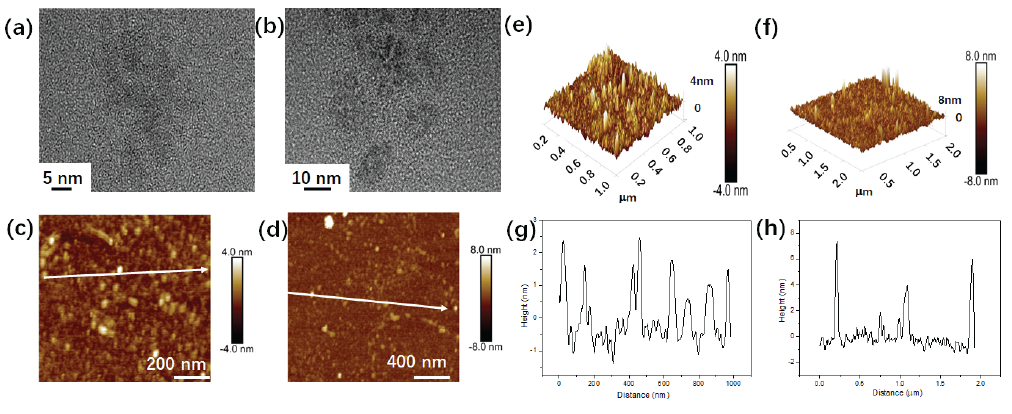
- (a) TEM, (c,e) AFM and (g) height of N-CDs; (b) TEM, (d,f) AFM and (h) height of Cu-N-CDs.
3.3. Antimicrobial behavior of functional inhibitors
Figure 4 reveals the variations of bacterial distribution after 24 hrs of cultivation with functional inhibitors. In the absence of any inhibitors (blank group), both types of bacteria basically covered entire areas of the culture dish, implying a high reproductive ability under normal conditions. After adding the N-CDs inhibitor, the area covered by bacteria significantly reduced, indicating that the inhibitor effectively inhibited both types of bacteria. With the addition of Cu atom, the antibacterial effect became more significant. With increase in the Cu/N ratio, the coverage area of the bacteria gradually decreased, illustrating that the addition of the Cu atom could further inhibit both types of bacterial growth. In the meantime, the growth of E. coil was basically inhibited by the addition of the Cu3.0-N-CDs inhibitor, while S. aureus growth showed similar results with the Cu6.0-N-CDs inhibitor. This phenomenon suggested that the inhibition effect of Cu atoms on E. coil might be superior to that of S. aureus.
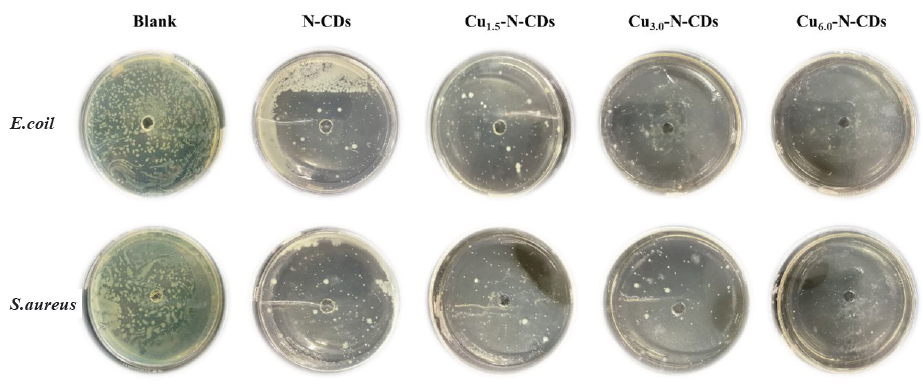
- The variations in bacterial distribution after 24 hrs of cultivation with functional inhibitors.
To analyze the bactericidal process of these inhibitors more please see Figure 5 for all bactericidal kinetics curves under various cultivation conditions. For both types of bacteria, the inhibition rate of the N-CDs inhibitor slowly rose after 4 hrs of cultivation and then tended to a stable state. After a 24-hr treatment, the inhibition rate of the N-CDs inhibitor for both types of bacteria was about 50∼65%. For Cu-N-CDs inhibitor, the inhibition rate for both types of bacteria sharply rose after 1 hr of cultivation, and then tended to a stable state. Meanwhile, the inhibition rate for both types of bacteria were enhanced with increase in the Cu/N ratio, implying that Cu atom doping could evidently improve the bacterial inhibition rate of the N-CDs inhibitor. In addition, when the proportion of copper gluconate was 66.67%, the Cu-N-CDs inhibitor displayed the strongest inhibition rate on both types of bacteria, which was higher than 98%, showing an enormous antimicrobial potential.
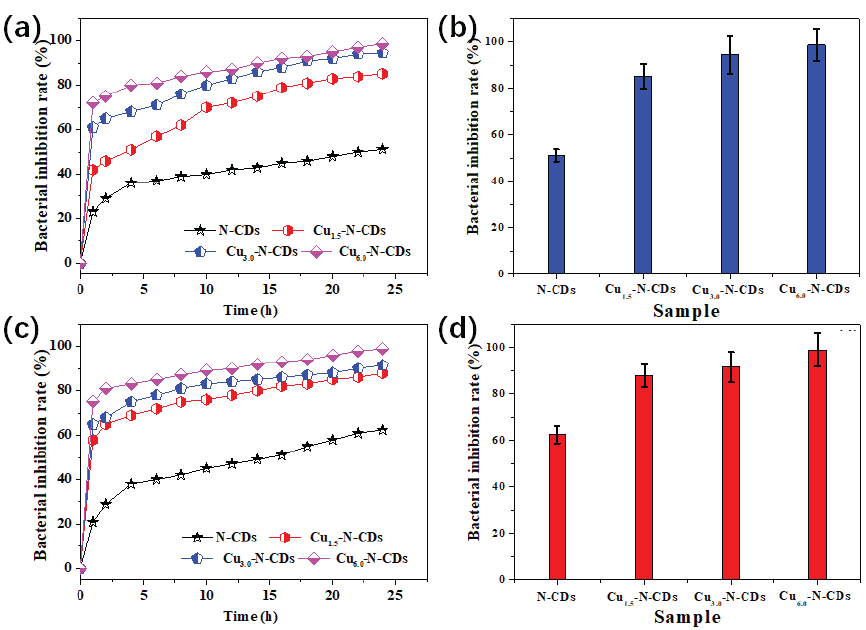
- (a) The bactericidal kinetics curve and (b) the largest inhibition rate of E. coil, (c) the bactericidal kinetics curve and (d) the largest inhibition rate of S. aureus.
3.4. Anticorrosion behavior of functional inhibitors
In order to ensure stability of the electrochemical testing process, the OCP of working electrode was measured under different environments, see Figure S1. During testing, the OCP curve was very stable, and the values were concentrated between -0.2 and -0.3 V. against SCE. After that, the electrochemical measurements of steel in 3.5% NaCl solution with or without inhibitors were conducted to explore the corrosion resistance of functional inhibitors, and the results and equivalent circuit model have been depicted in Figure 6. Obviously, the Nyquist plots in blank environment presented the minimum capacitance arc diameter, thus indicating weak corrosion resistance. Compared with blank solution, the capacitance arc diameter of metal in corrosion solution was slightly expanded after adding folic acid and copper gluconate, implying that corrosion was suppressed to a certain extent, see Figure S2. However, this inhibitory effect still had a significant gap in comparison to N-CDs and Cu-N-CDs inhibitors. After adding the N-CDs inhibitor, the capacitance arc diameter greatly enlarged. Meanwhile, the increase in capacitance arc diameter was directly proportional to the inhibitor concentration. With increase in the Cu/N ratio, the capacitance arc diameter first increased, and then decreased at the same condition that reached the peak at Cu3.0-N-CDs inhibitor. When the copper gluconate was excessively increased, the capacitance arc diameter significantly decreased.
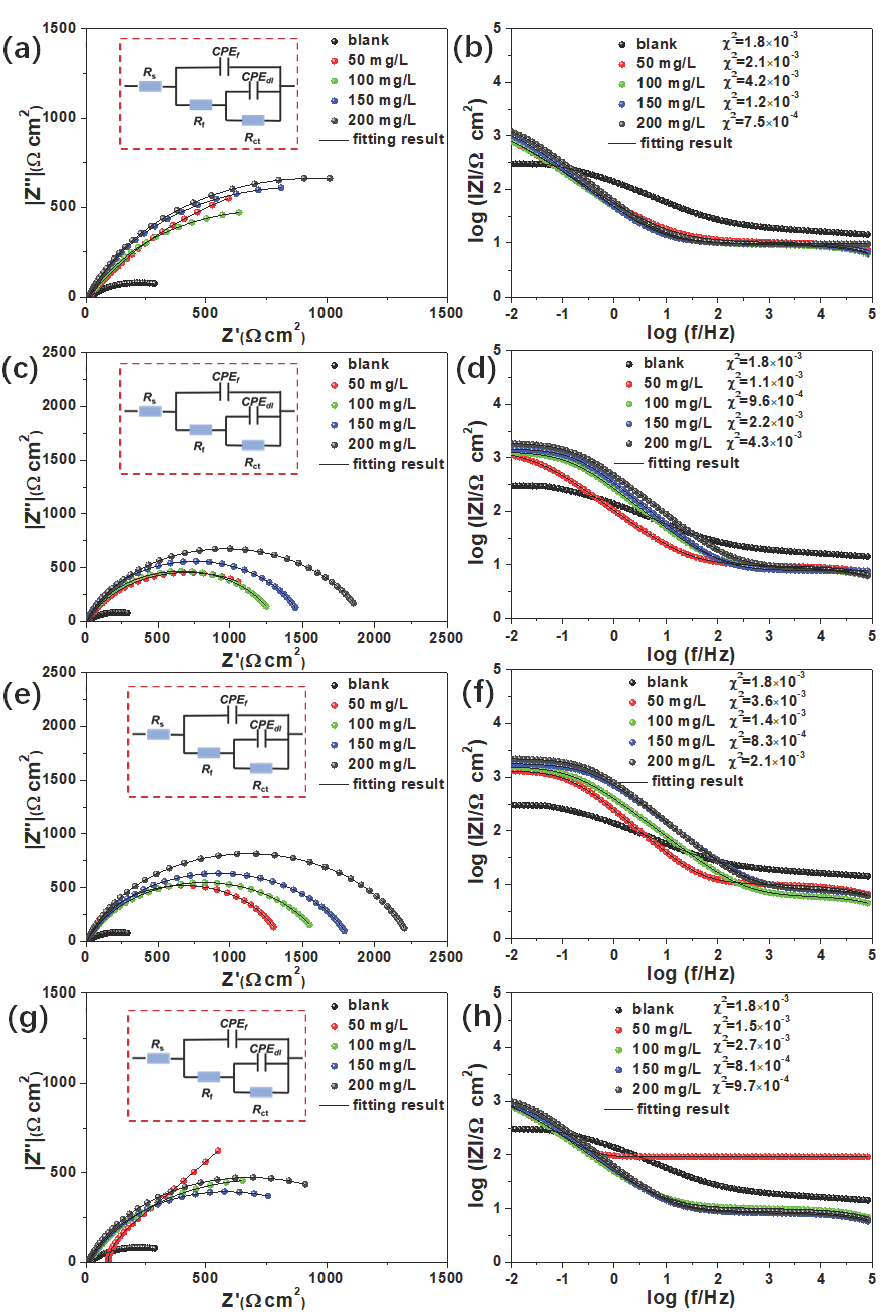
- EIS results and equivalent circuit model of functional inhibitors (a, b) N-CDs; (c, d) Cu1.5-N-CDs; (e, f) Cu3.0-N-CDs; (g, h) Cu6.0-N-CDs.
The |Z|0.01 Hz in Bode plot could quantitatively analyze the protective effect of inhibitors [26]. As depicted in Figure 6(b), the |Z|0.01 Hz of steel in pure corrosion solution was about 300 Ω cm2. After adding the N-CDs inhibitor, the |Z|0.01 Hz showed an uptrend. From 50 to 200 mg/L, the |Z|0.01 Hz changed from 600 to 1050 Ω cm2, the improvement proportion increased from 100% to 250%. When adding the Cu1.5-N-CDs inhibitor, the |Z|0.01 Hz was greatly increased. For example, the |Z|0.01 Hz enlarged from 1100 to 1830 Ω cm2 when the concentration changed from 50 to 200 mg/L. As the Cu/N ratio increased, the |Z|0.01 Hz displayed an increasing trend, and reached the peak at Cu3.0-N-CDs inhibitor. In this case, the |Z|0.01 Hz changed from 1300 to 2200 Ω cm2 when the concentration changed from 50 to 200 mg/L. Compared with blank condition, the improvement proportion of |Z|0.01 Hz was 333% and 633% at 50 and 200 mg/L, respectively. However, excessive copper gluconate caused a sharp decrease in |Z|0.01 Hz, and all values decreased to below 1000 Ω cm2, suggesting the decrease of protection ability.
The anticorrosion performance was also evaluated using the Tafel curve, the results have been depicted in Figure 7. As a whole, once these functional inhibitors were introduced, the Tafel curve moved in the negative direction. After that, these curves were linearly fitted, and the corresponding parameter have been shown in Table 1. The surface coverage of θ and IE were calculated according to Eqs. (2) and (3) [27].
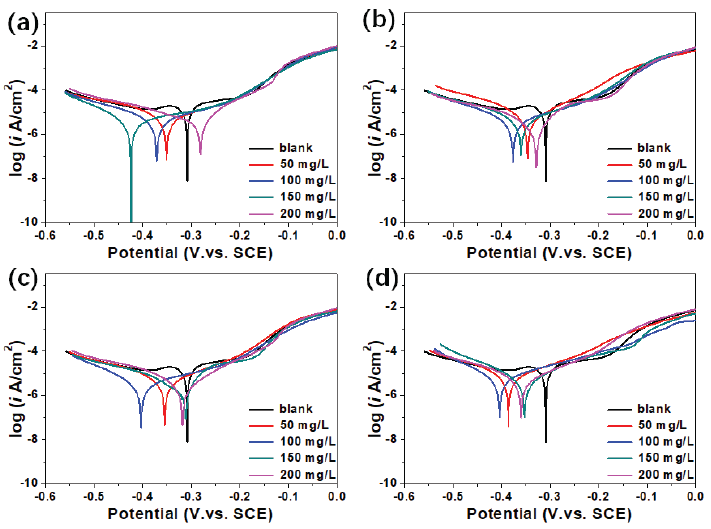
- Tafel results of functional inhibitors (a) N-CDs; (b) Cu1.5-N-CDs; (c) Cu3.0-N-CDs; (d) Cu6.0-N-CDs.
| Sample |
C (mg/L) |
Ecorr mV. vs. SCE |
Icorr μA cm-2 |
θ |
IE % |
|---|---|---|---|---|---|
| Blank | 0 | -309±8 | 37.60±2.41 | - | - |
| 0 | 50 | -351±6 | 6.57±0.35 | 0.83 | 82.53 |
| 100 | -372±11 | 5.98±0.47 | 0.84 | 84.10 | |
| 150 | -424±9 | 4.85±0.21 | 0.87 | 87.10 | |
| 200 | -282±5 | 4.16±0.36 | 0.89 | 88.94 | |
| 1.5 | 50 | -346±13 | 5.61±0.27 | 0.85 | 85.08 |
| 100 | -376±7 | 4.95±0.38 | 0.87 | 86.84 | |
| 150 | -360±4 | 4.67±0.19 | 0.88 | 87.58 | |
| 200 | -312±8 | 2.96±0.12 | 0.92 | 92.13 | |
| 3.0 | 50 | -355±12 | 4.70±0.31 | 0.88 | 87.50 |
| 100 | -404±11 | 4.05±0.24 | 0.89 | 89.23 | |
| 150 | -329±3 | 2.69±0.15 | 0.93 | 92.85 | |
| 200 | -319±7 | 2.68±0.10 | 0.93 | 92.87 | |
| 6.0 | 50 | -386±9 | 7.82±0.23 | 0.79 | 79.20 |
| 100 | -404±3 | 6.83±0.34 | 0.82 | 81.84 | |
| 150 | -353±5 | 5.95±0.37 | 0.84 | 84.18 | |
| 200 | -360±6 | 5.19±0.22 | 0.86 | 86.20 |
Among them, iblank was the corrosion current density of steel measured in blank solution, and icorr represented the corrosion current density of steel in the presence of functional inhibitors.
Form the fitting result, the iblank was about 37.6 µA cm-2, which was the only value exceeding 10 µA cm-2. After adding N-CDs inhibitor, the icorr showed a downtrend. From 50 to 200 mg/L, the icorr decreased from 6.57 to 4.16 µA cm-2, the IE increased from 82.53% to 88.94%. This indicated that the corrosion behavior was obviously suppressed. When adding Cu1.5-N-CDs inhibitor, the icorr was further decreased, which decreased from 5.61 to 2.96 µA cm-2 when the concentration changed from 50 to 200 mg/L. Meanwhile, the IE increased from 85.08% to 92.13%. With the Cu/N ratio increased, the icorr presented a decreasing trend, and achieved the lowest value at Cu3.0-N-CDs inhibitor concentration. When the concentration changed from 50 to 200 mg/L, the icorr decreased from 4.70 to 2.68 µA cm-2 and the IE increased from 87.50% to 92.87%. In this case, the IE of inhibitor was higher than that of Ethanedihydrazide (81%), Isatin (71%), Triethanolamine (85.7%), Cetyltrimethyl ammonium Bromide (65%), Berberine (79%), and Rice straw extract (92%) [28-33]. Nevertheless, excessive Cu atom doping could cause a rebound in the icorr value, which is well in agreement with EIS analysis.
3.5. Corrosion product of functional inhibitors
Figure 8 displayed the 3D morphology of metal after corrosion in the 3.5% NaCl solution with and without functional inhibitors. Through observation, numerous raised areas were detected on the metal surface after 12 hrs of corrosion. Nevertheless, the distribution of raised areas was increased and the surface roughness increased from 1.18 to 1.96 µm after 24 hrs of corrosion, illustrating that the area of corrosion had expanded. After adding the N-CDs inhibitor, the raised areas were significantly reduced, and the surface roughness sharply decreased, implying weakening of the corrosion. Meanwhile, the surface roughness further decreased after the addition of Cu-N-CDs. With increase in the Cu/N ratio, the surface roughness first decreased and then increased, and reached the peak value at Cu3.0-N-CDs inhibitor. Moreover, the decrease in inhibitor concentration and corrosion time led to a rebound of surface roughness. By comparison, the influence of inhibitor concentration on surface roughness was stronger than that of corrosion time.
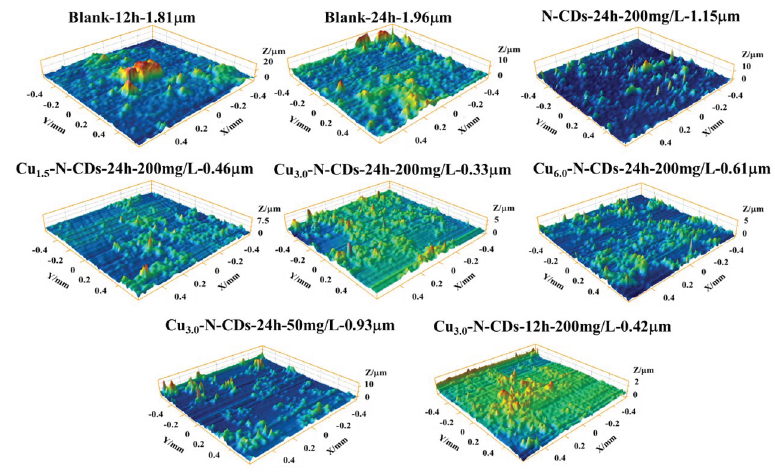
- 3D morphology of metal after corrosion in 3.5% NaCl solution with and without functional inhibitors.
In order to more intuitively study the protective behavior of functional inhibitors on metal, the corrosion morphology results have been displayed in Figure 9. Under the pure corrosion solution, many corrosion pits were found on the metal surface after 12 hrs of application. However, many loose corrosion products were produced on the metal surface after 24 hrs of corrosion, implying the exacerbation of corrosion. With the addition of the N-CDs inhibitor, the signs of corrosion were significantly suppressed, but a small amount of corrosion pores still formed on the metal surface. With the addition of the Cu1.5-N-CDs and Cu3.0-N-CDs inhibitors, the metal surface became relatively flat and smooth, indicating that the corrosive medium was significantly isolated. By EDS detection, the metal surface was primarily distributed with C, N, O, Cu, Cl, and Na elements. Among them, N and Cu came from functional inhibitors, implying that the metal surface was covered by functional inhibitors. Cl and Na were from the corrosion medium. As the Cu/N ratio further increased, many corrosion regions were observed on the metal surface. In the presence of functional inhibitors, significant corrosion signs were also observed on the metal surface by reducing inhibitor concentration and corrosion time, indicating that these two variables were also key factors to affect metal corrosion.
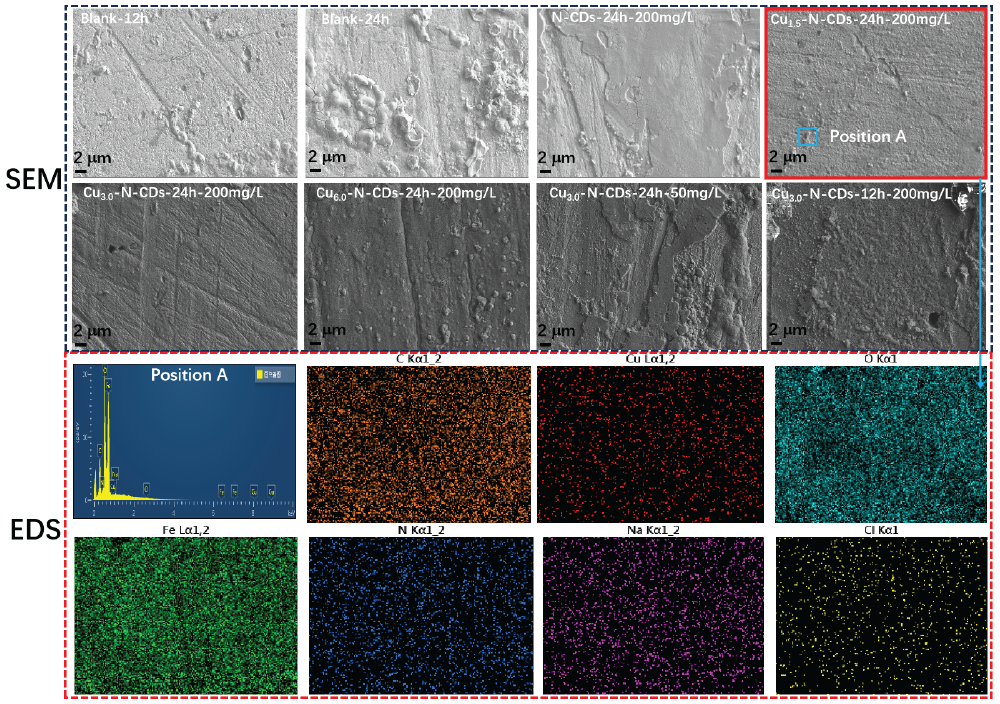
- SEM and EDS results after corrosion testing.
Figure 10 shows the XPS analysis of the metal surface after corrosion in Cu-N-CDs solution. By fitting, the O1s spectrum was divided into two peaks at 531 and 532.7 eV, which represented to O-C and O=C bonds, respectively. Meanwhile, four typical peaks at 284.5, 285.6, 287.6, and 288.5 eV attributing to C-C/C=C, C-O/C=N, C-N, and C=O bonds were observed in the C1s spectrum. For N1s spectrum, two peaks at 399.7 and 401.8 eV were observed, which corresponded to N-C and N-Fe/N-Cu bonds, indicating that the functional inhibitor might form chemical bonds with metal surfaces [34]. In the case of the Cu2p3/2 spectrum, two peaks were observed at 932.1 and 934.2 eV, which ascribed to Cu-O and Cu-Cl bonds, implying that copper ions might react with oxygen to form oxides on the metal surface [35,36].
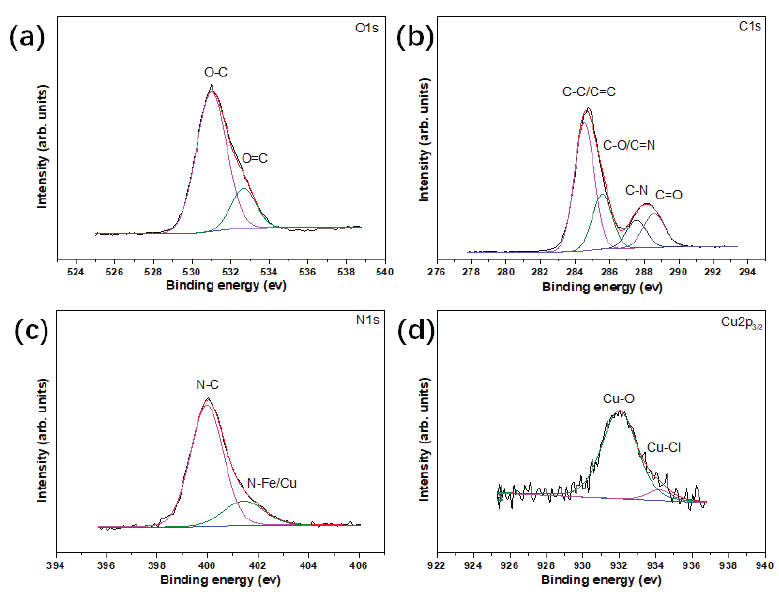
- XPS result of metal surface after corrosion in Cu-N-CDs environment (a) O1s; (b) C1s; (c) N1s; (d) Cu2p3/2.
3.6. Weight Loss behavior of functional inhibitors
Figure 11 displayed the weight loss of the metal after corrosion in a 3.5% NaCl solution with and without functional inhibitors. When the inhibitor concentration was used as a variable, the overall corrosion rate of metal showed a decreasing trend as the concentration increased, implying that the increase in concentration could effectively inhibit the corrosion of metal. When the Cu/N ratio was selected as a variable, the overall corrosion rate decreased first and then increased as the ratio increased, which reached the peak at Cu3.0-N-CDs inhibitor, suggesting that an appropriate Cu/N ratio could effectively suppress the occurrence of corrosion. In terms of corrosion time, the corrosion rate of the metal in a blank environment presented a slight upward trend. Nevertheless, the corrosion rate of the metal in a functional inhibitor environment exhibited an opposite change trend.
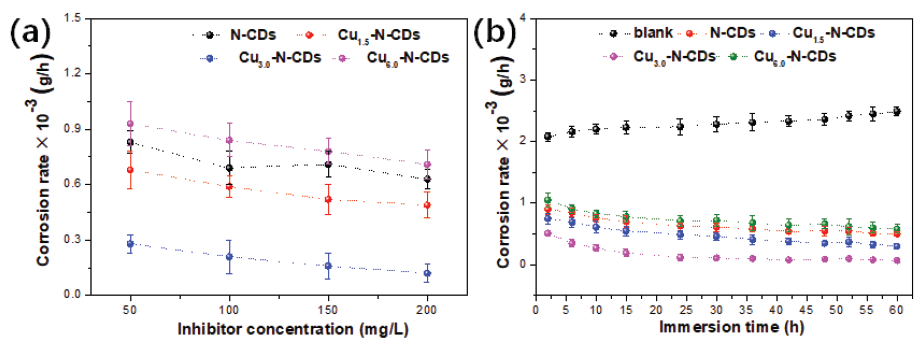
- Weight loss result of metal after corrosion (a) corrosion rate-concentration; (b) corrosion rate-immersion time.
3.7. Protection mechanism of functional inhibitors
The adsorption isotherm of the corrosion process has been shown in Figure 12. Meanwhile, according to the relationship between C/θ and C, it could be found that these inhibitors satisfied the Langmuir adsorption model. The types of interaction between inhibitor and metal were determined by the adsorption-free energy (ΔG), which was calculated from Eqs. (4) and (5) [37,38]:
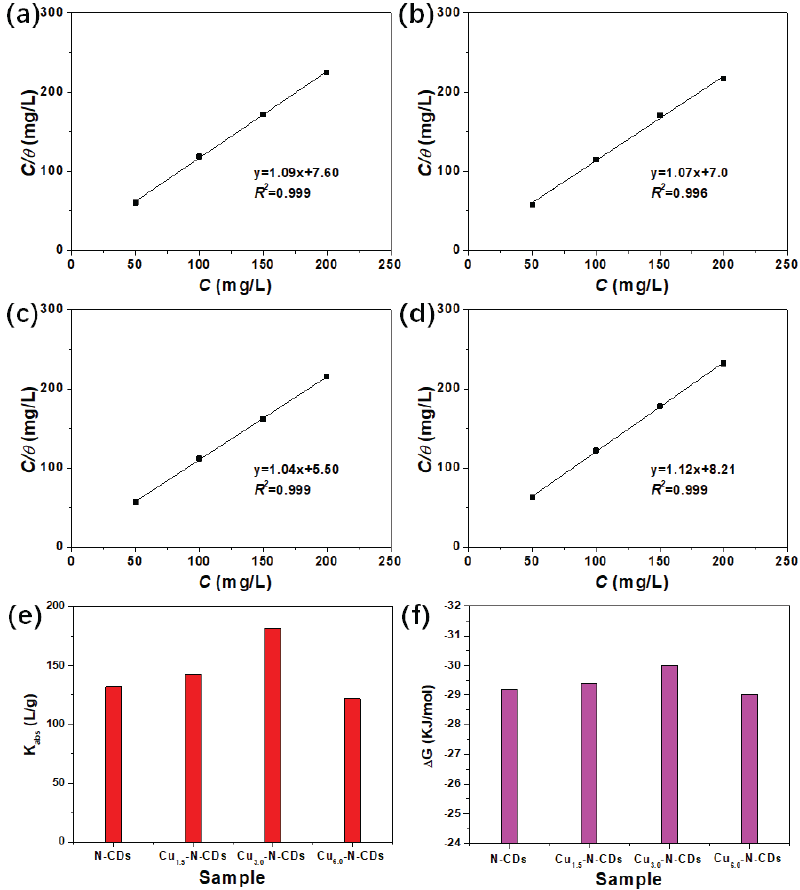
- (a-d) Adsorption isotherms, (e) Kads and (f) ΔG of functional inhibitors.
The meaning of C, θ, Kads, ΔG, R and T could be known from previous research [3]. Usually, the larger the Kads was, the stronger the adsorption process was. By calculation, the Kads value of the metal in Cu1.5-N-CDs inhibitor solution was about 142.9 L/g, which was greatly higher in comparison to the N-CDs inhibitor solution, indicating a stronger adsorption. With the increase of the Cu/N ratio, the Kads value showed an increasing trend followed by a decreasing trend, reaching the largest value in the Cu3.0-N-CDs solution. Furthermore, the physical or chemical adsorption between inhibitor molecules and metal surfaces was closely related to ΔG. The ΔG of physical adsorption ≤ -20 kJ·mol-1, while the value of chemical adsorption ≥ -40 kJ·mol-1 [39]. The ΔG of N-CDs, Cu1.5-N-CDs, Cu3.0-N-CDs, and Cu6.0-N-CDs was calculated to -29.2, -29.4, -30.0, and -29.0 kJ·mol-1, suggesting that the adsorption essence of all inhibitors was mixed adsorption. Therefore, the corrosion inhibition process was spontaneous and conducive, forming an adsorption film on the interface. Excessive copper gluconate might cause agglomeration of the inhibitor, reducing its coverage on the metal surface, and ultimately lowering its overall protective performance.
The micro-protective mechanism of inhibitors were analyzed through molecular dynamics and quantum chemistry, as shown in Figure 13. The HOMO and LUMO distributions of inhibitors could be simulated and analyzed through structural optimization. From the result (Figure 13a), the HOMO of folic acid was mainly distributed on the middle side of the molecule, while the LUMO was mainly concentrated on the right side of the molecule, implying that the left side of molecule was not fully covered by HOMO and LUMO. Meanwhile, the surface electron distribution was mainly concentrated in the middle and right sides, which was consistent with the regions of HOMO and LUMO. For copper gluconate (Figure 13b), the HOMO and LUMO were mainly concentrated in the middle and left sides of molecule, while the right side of the molecule was not fully covered, which was similar to the result of surface electron distribution. After the reaction (Figure 13c), the Cu3.0-N-CDs was selected as a representative. The LUMO of Cu-N-CDs was almost distributed on all N-containing skeletons, while the HOMO of Cu-N-CDs was mainly concentrated in other carbon skeletons, illustrating that the Cu-N-CDs integrated the orbital distribution characteristics of folic acid and copper gluconate. The surface electron distribution almost covered the entire molecular skeleton. The energy gap (ΔE= ELUMO- EHOMO) was chosen for evaluating the adsorption capacity of the inhibitor on the steel/solution interface [40-42]. Meanwhile, the smaller the ΔE meant stronger the capacity. After simulation analysis, the ΔE of Cu-N-CDs was 0.6495 eV, which was smaller in comparison to folic acid (3.6045 eV), declaring a strong adsorption capacity.
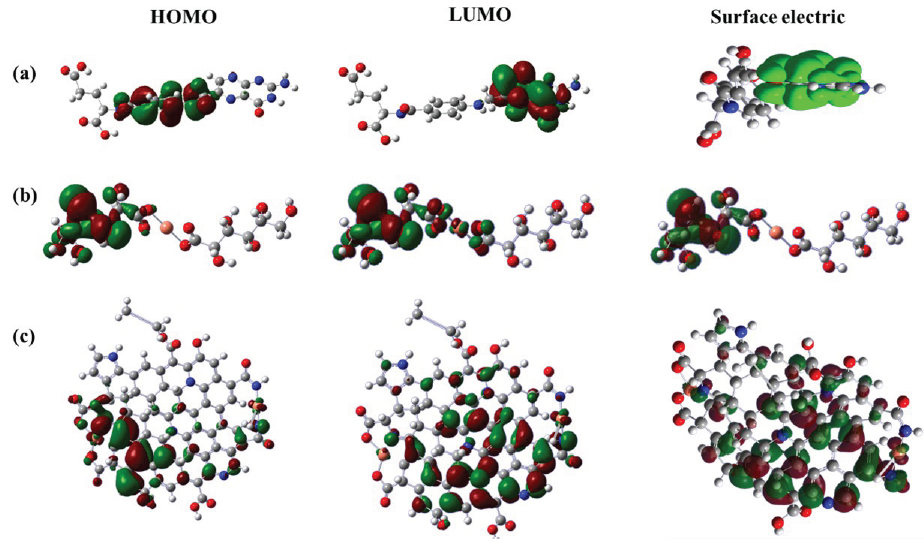
- Quantum chemical simulation calculation results of HOMO, LUMO and surface electric distribution for (a) folic acid, (b) copper gluconate, and (c) Cu-N-CDs.
The adsorption states of the inhibitor molecules have been shown in Figure 14. From the front, side, and vertical directions (Figure 14a), the folic acid molecule adsorbed on the metal surface in a warped manner, which could not efficiently and tightly cover the metal surface. Meanwhile, this way could easily cause the infiltration of corrosive media, resulting in serious corrosion. Different to folic acid, the copper gluconate was vertically adsorbed on the metal surface, see Figure 14(b). In this case, the coverage effect was the lowest, which was not conducive to blocking the invasion of corrosive media. As far as Cu-N-CDs was concerned (Figure 14c), due to its higher number of active sites compared to folic acid and copper gluconate, it still maintained parallel adsorption on the metal surface, achieving efficient coverage. Moreover, the Ebinding value could be used to quantitatively evaluate the adsorption capacity of inhibitor, and the larger Ebinding value implied a higher interaction force at the steel/inhibitor interface [20,43,44]. By calculation, the Ebinding value of Cu-N-CDs was approximately -306.14 Kcal/mol, which was greater than that of folic acid (-91.85 Kcal/mol) and copper gluconate (-123.27 Kcal/mol), explaining that the Cu-N-CDs exhibited a superior protection ability. In order to better understand the adsorption behavior of the Cu-N-CDs inhibitor, its adsorption diagram in the solution/ metal interface has been presented in Figure S3. The adsorption film and oxide film together achieved efficient protection of metals.
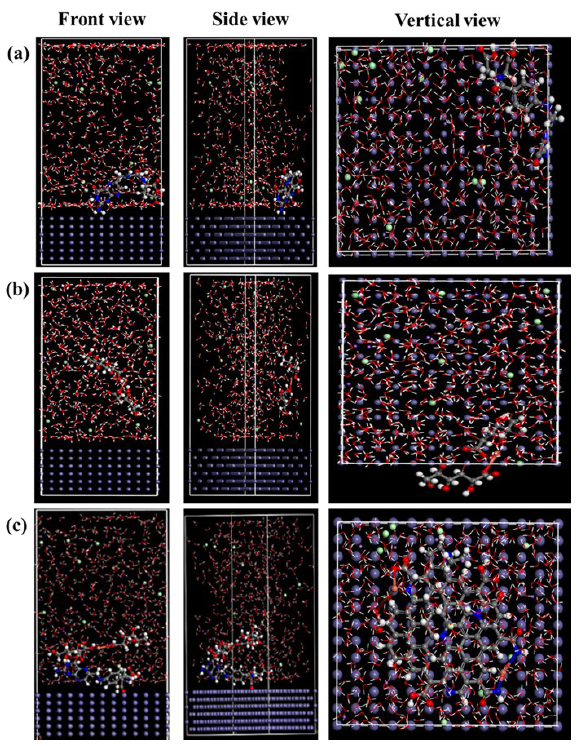
- Equilibrium adsorption configuration of (a) folic acid, (b) copper gluconate, and (c) Cu-N-CDs on Fe (110) surface from front, side, and vertical view.
4. Conclusions
In this work, different mass ratios of folic acid and copper gluconate were selected to prepare green and efficient functional inhibitors (Cu-N-CDs). The chemical structure, bonding state, surface morphology, and distraction size of functional inhibitors were confirmed via FTIR, UV-Vis, XPS, AFM, and TEM characterizations. The plate coating method was used to evaluate its inhibitory behavior against E. coli and S. aureus. The corrosion protective effect of functional inhibitors was assessed via EIS, Tafel, and weight loss measurements. The results indicated that the antibacterial ability of functional inhibitor increased with the increase in Cu/N ratio, ultimately crossing 98% at Cu6.0-N-CDs. Meanwhile, the |Z|0.01 Hz (2200 Ω cm2) of Cu3.0-N-CDs increased by 6.3 times, and the icorr (2.68 µA cm-2) decreased by 92.87% than that in blank condition (300 Ω cm2 and 37.6 µA cm-2), suggesting that the Cu3.0-N-CDs could remarkably strengthen the protective ability of metal. Form simulation calculation, after Cu atom doping into the folic acid-based carbon dots, the HOMO and LUMO covered the entire inhibitor molecular orbital. Meanwhile, the Ebinding value was approximately -306.14 Kcal/mol, which was higher than that of folic acid and copper gluconate. Overall, an appropriate Cu/N ratio could effectively enhance the antibacterial and anticorrosion abilities of functional inhibitors, providing an effective strategy to extend the service life of metal in harsh environments.
Acknowledgment
This study was sponsored by Jiangxi Provincial Health Technology Project; National Nature Science Foundation of China (grant No. 52461016); the Joint Funds of the Jiangxi Provincial Natural Science Foundation of China under Grant No. 20244BAB28020 and No. 20244BAB28036; Jiangxi Provincial Natural Science Foundation (No. 20224BAB206069); Jiangxi Province High-level and High-skilled Leading Talents Training Project (2021); Ganzhou Science and Technology Plan Project (2023LNS17423 and GZ2024YLJ004).
CRediT authorship contribution statement
Zhiji Tang: Writing-original draft, Resources. Weilong Huang: Supervision, Investigation. Wenjin Wei: Resources, Investigation. Lin Liu: Investigation. Shiyu Zheng: Methodology. Mingang Zou: Resources. Xinyun Ye: Resources, Investigation. Yuwei Ye: Resources, Data curation. Qiuhua Jiang: Supervision, Resources.
Declaration of competing interest
We are submitting our original research paper entitled “Folic acid-based carbon dots as an environmentally friendly and functional inhibitor for metal protection” for the possible publication in Arabian Journal of Chemistry. All authors have read and approve this version of the article, and due care has been taken to ensure the integrity of the work. I and co-authors state: no part of this paper has been published or submitted elsewhere, and no conflict of interest exits in the submission of this manuscript.
Declaration of Generative AI and AI-assisted technologies in the writing process
The authors confirm that there was no use of artificial intelligence (AI)-assisted technology for assisting in the writing or editing of the manuscript and no images were manipulated using AI.
Appendix A. Supplementary material
Supplementary material to this article can be found online at https://dx.doi.org/10.25259/AJC_289_2024
References
- Free base phthalocyanine coating as a superior corrosion inhibitor for copper surfaces: a combined experimental and theoretical study. Colloids Surf. A. 2023;648:129138. https://doi.org/10.1016/j.colsurfa.2022.129138
- [Google Scholar]
- Synthesis and evaluation of a novel pyridinyl thiazolidine derivative as an antioxidant and corrosion inhibitor for mild steel in acidic environments. Arabian Journal of Chemistry. 2024;17:105807. https://doi.org/10.1016/j.arabjc.2024.105807
- [CrossRef] [Google Scholar]
- Pumpkin leaf extract crop waste as a new degradable and environmentally friendly corrosion inhibitor. Langmuir. 2024;40:5738-5752. https://doi.org/10.1021/acs.langmuir.3c03399
- [CrossRef] [PubMed] [Google Scholar]
- pH-responsive capsule loaded with nitrogen-doped carbon dots for metal corrosion protection. Journal of Materials Research and Technology. 2023;25:2306-2323. https://doi.org/10.1016/j.jmrt.2023.05.283
- [CrossRef] [Google Scholar]
- Pumpkin (Cucurbita maxima) seed-derived nitrogen, phosphorus, and sulfur carbon quantum dot as an inhibitor of corrosion for mild steel in HCl solution. Journal of Materials Research and Technology. 2024;28:2504-2515. https://doi.org/10.1016/j.jmrt.2023.12.170
- [Google Scholar]
- Study on structure and molecular scale protection mechanism of green ce,N-CDs anti-bacterial and anti-corrosive inhibitor. Journal of Materials Research and Technology. 2024;28:3865-3881. https://doi.org/10.1016/j.jmrt.2023.12.250
- [CrossRef] [Google Scholar]
- Zea mays bracts extract as an eco-friendly corrosion inhibitor for steel in HCl pickling solution: Experimental and simulation studies. Arabian Journal of Chemistry. 2024;17:105895. https://doi.org/10.1016/j.arabjc.2024.105895
- [CrossRef] [Google Scholar]
- Synthesis and evaluation of an environmentally friendly phosphorus-free and nitrogen-free polymer as a scale and corrosion inhibitor. Arabian Journal of Chemistry. 2024;17:106033. https://doi.org/10.1016/j.arabjc.2024.106033
- [CrossRef] [Google Scholar]
- Novel thiazole-derived schiff-bases as efficient corrosion inhibitors for mild steel in acidic media: Synthesis, electrochemical and computational insights. Arabian Journal of Chemistry. 2024;17:105867. https://doi.org/10.1016/j.arabjc.2024.105867
- [CrossRef] [Google Scholar]
- One-step synthesis of color-tunable carbon dots-based organic long persistent luminescence materials. Chemical Engineering Journal. 2024;479:147589. https://doi.org/10.1016/j.cej.2023.147589
- [CrossRef] [Google Scholar]
- Inorganic salt incorporated solvothermal synthesis of multicolor carbon dots, emission mechanism, and antibacterial study. ACS Applied Nano Materials. 2018;1:6131-8. https://doi.org/10.1021/acsanm.8b01355
- [CrossRef] [Google Scholar]
- Carbon dots as new eco-friendly and effective corrosion inhibitor. Journal of Alloys and Compounds. 2017;726:680-692. https://doi.org/10.1016/j.jallcom.2017.08.027
- [CrossRef] [Google Scholar]
- Novel ce@N-CDs as green corrosion inhibitor for metal in acidic environment. Journal of Molecular Liquids. 2022;349:118155. https://doi.org/10.1016/j.molliq.2021.118155
- [CrossRef] [Google Scholar]
- A universal strategy for green and in situ synthesis of carbon dot-based pickling solution. Green Chemistry. 2022;24:5842-5855. https://doi.org/10.1039/d2gc01581a
- [Google Scholar]
- A feasible method to improve the protection ability of metal by functionalized carbon dots as environment-friendly corrosion inhibitor. Journal of Cleaner Production. 2020;264:121682. https://doi.org/10.1016/j.jclepro.2020.121682
- [CrossRef] [Google Scholar]
- Corrosion resistance enhancement of magnesium alloy by n-doped graphene quantum dots and polymethyltrimethoxysilane composite coating. Carbon. 2020;157:537-548. https://doi.org/10.1016/j.carbon.2019.09.013
- [CrossRef] [Google Scholar]
- Selective inactivation of gram-negative bacteria by carbon dots derived from natural biomass: Artemisia argyi leaves. The Journal of Materials Chemistry B. 2020;8:2666-2672. https://doi.org/10.1039/c9tb02735a
- [CrossRef] [PubMed] [Google Scholar]
- Carbon dots derived from folic acid as an ultra-succinct smart antimicrobial nanosystem for selective killing of s. aureus and biofilm eradication. Carbon. 2022;199:395-406. https://doi.org/10.1016/j.carbon.2022.07.065
- [CrossRef] [Google Scholar]
- A green and effective anti-corrosion and anti-microbial inhibitor of citric acid-based carbon dots: Experiment and mechanism analysis. Journal of Materials Research and Technology. 2024;32:2149-2159. https://doi.org/10.1016/j.jmrt.2024.08.048
- [CrossRef] [Google Scholar]
- Copper doped carbon dots for addressing bacterial biofilm formation, wound infection, and tooth staining. ACS Nano. 2022;16:9479-9497. https://doi.org/10.1021/acsnano.2c02518
- [CrossRef] [PubMed] [Google Scholar]
- The synthesis of “folic acid” by Streptobacterium plantarum and its inhibition by sulphonamides. British Journal of Experimental Pathology. 1948;29:264-281.
- [PubMed] [PubMed Central] [Google Scholar]
- Essential metabolites of mycobacterium tuberculosis and their mimics. mBio. 2011;2:e00301-e00310. https://doi.org/10.1128/mBio.00301-10
- [CrossRef] [PubMed] [PubMed Central] [Google Scholar]
- Exopolysaccharide produced by Vibrio neocaledonicus sp. as a green corrosion inhibitor: Production and structural characterization. Journal of Materials Research & Technology. 2022;20:916-933. https://doi.org/10.1016/j.jmst.2018.05.019
- [PubMed] [Google Scholar]
- Blue luminescent graphene quantum dots and graphene oxide prepared by tuning the carbonization degree of citric acid. Carbon. 2012;50:4738-4743. https://doi.org/10.1016/j.carbon.2012.06.002
- [CrossRef] [Google Scholar]
- Copper nanocrystalline-doped folic acid-based super carbon dots for an enhanced antitumor effect in response to tumor microenvironment stimuli. The Journal of Materials Chemistry B. 2022;10:8046-8057. https://doi.org/10.1039/d2tb01363k
- [CrossRef] [PubMed] [Google Scholar]
- Experimental and theoretical studies on inhibition performance of Cu corrosion in 0.5 M H2SO4 by three disulfide derivatives. Journal of Industrial and Engineering Chemistry. 2019;77:449-460. https://doi.org/10.1016/j.jiec.2019.05.011
- [Google Scholar]
- Berberine isolated from mahonia nepalensis as an eco-friendly and thermally stable corrosion inhibitor for mild steel in acid medium. Arabian Journal of Chemistry. 2021;14:103423. https://doi.org/10.1016/j.arabjc.2021.103423
- [CrossRef] [Google Scholar]
- Ethanedihydrazide as a corrosion inhibitor for iron in 3.5% naCl solutions. ACS Omega. 2021;6:14525-14532. https://doi.org/10.1021/acsomega.1c01422
- [CrossRef] [PubMed] [PubMed Central] [Google Scholar]
- Electrochemical, thermodynamic and theoretical study on anticorrosion performance of a novel organic corrosion inhibitor in 3.5% naCl solution for carbon steel. Bulletin of Materials Science. 2019;42 https://doi.org/10.1007/s12034-019-1889-y
- [Google Scholar]
- Performance evaluation of triethanolamine as corrosion inhibitor for magnesium alloy in 3.5 wt% naCl solution. RSC Advances. 2016;6:113967-113980. https://doi.org/10.1039/c6ra23203e
- [Google Scholar]
- Synergistic effect of mixed cationic and anionic surfactants on the corrosion inhibitor behavior of mild steel in 3.5% naCl. Applied Surface Science. 2013;285:674-681. https://doi.org/10.1016/j.apsusc.2013.08.109
- [Google Scholar]
- Plant derived cationic dye as an effective corrosion inhibitor for 7075 aluminum alloy in 3.5% naCl solution. Journal of Industrial and Engineering Chemistry. 2014;20:4276-4285. https://doi.org/10.1016/j.jiec.2014.01.033
- [Google Scholar]
- Corrosion inhibition of steel in 3.5% naCl by rice straw extract. Journal of Industrial and Engineering Chemistry. 2019;70:299-310. https://doi.org/10.1016/j.jiec.2018.10.030
- [Google Scholar]
- Synthesis of Ce,N co-doped carbon dots as green and effective corrosion inhibitor for copper in acid environment. Journal of the Taiwan Institute of Chemical Engine. 2022;141:, 104608.
- [Google Scholar]
- X-ray photoelectron spectroscopic study of copper minerals. Journal of Inorganic and Nuclear Chemistry. 1978;40:789-791. https://doi.org/10.1016/0022-1902(78)80152-3
- [CrossRef] [Google Scholar]
- Initial and final state effects in the ESCA spectra of cadmium and silver oxides. The Journal of Chemical Physics. 1977;67:3500-6. https://doi.org/10.1063/1.435347
- [CrossRef] [Google Scholar]
- Plant extracts as green corrosion inhibitor for ferrous metal alloys: A review. Journal of Cleaner Production. 2021;304:127030. https://doi.org/10.1016/j.jclepro.2021.127030
- [CrossRef] [Google Scholar]
- Alkaloids extract of retama monosperma (L.) boiss. seeds used as novel eco-friendly inhibitor for carbon steel corrosion in 1 M HCl solution: Electrochemical and surface studies. Applied Surface Science. 2015;357:1294-1305. https://doi.org/10.1016/j.apsusc.2015.09.159
- [CrossRef] [Google Scholar]
- Experimental and theoretical studies of benzothiazole derivatives as corrosion inhibitors for carbon steel in 1 M HCl. Corrosion Science. 2016;112:563-575. https://doi.org/10.1016/j.corsci.2016.08.012
- [Google Scholar]
- Determination of corrosion inhibition effects of amino acids: Quantum chemical and molecular dynamic simulation study. Journal of the Taiwan Institute of Chemical Engineers. 2016;58:528-535. https://doi.org/10.1016/j.jtice.2015.06.009
- [Google Scholar]
- Quantum chemical and molecular dynamic simulation studies for the prediction of inhibition efficiencies of some piperidine derivatives on the corrosion of iron. Journal of the Taiwan Institute of Chemical Engineers. 2016;65:522-9. https://doi.org/10.1016/j.jtice.2016.05.034
- [Google Scholar]
- Quantum chemical and molecular dynamics simulation studies on inhibition performances of some thiazole and thiadiazole derivatives against corrosion of iron. Journal of Molecular Liquids. 2016;219:497-504. https://doi.org/10.1016/j.molliq.2016.03.042
- [CrossRef] [Google Scholar]
- A combined experimental and theoretical study of the inhibition effect of three disulfide-based flavouring agents for copper corrosion in 0.5 M sulfuric acid. Journal of colloid and interface science. 2018;526:268-280. https://doi.org/10.1016/j.jcis.2018.04.092
- [CrossRef] [PubMed] [Google Scholar]
- 2-mercaptobenzothiazole as a corrosion inhibitor for carbon steel in supercritical CO2-H2O condition. Applied Surface Science. 2019;476:422-434. https://doi.org/10.1016/j.apsusc.2019.01.113
- [CrossRef] [Google Scholar]


