

Translate this page into:
Front face synchronous fluorescence as a tool for the quality assurance of Greek milk
⁎Corresponding author. harpro@chem.uoa.gr (Charalampos Proestos)
-
Received: ,
Accepted: ,
This article was originally published by Elsevier and was migrated to Scientific Scholar after the change of Publisher.
Peer review under responsibility of King Saud University.
Abstract
This research focuses on implementing the low cost and rapid front face synchronous fluorescence (SyFS) in order to ensure the quality assurance of Greek milk. Specifically, samples originated from the Greek domestic production of goat, sheep, cow, as well as foreign cow milk samples and adulterated cow milk samples. SyFS spectra were acquired in the excitation area of 250–500 nm with (Δλ)= 100 nm. Greek and foreign cow milk samples were differentiated based on intensity variations at wavelengths 350–515 nm, 540–579 nm, and 580–600 nm. The emissions at these wavelength positions correspond to tryptophan, vitamin A, and riboflavin. The supervised model with 94 samples exhibited p-value = 7,98E-11, RMSEE= 0,29171, RMSEcv= 0,29284 and RMSEP= 0,98013, AUROC for Greek samples= 0,61 and AUROC for foreign= 0,85. We differentiated milk samples according to the animal type with PCA and OPLS-DA models of 107 samples exhibiting RMSEE= 0,225842, RMSEcv= 0,228054 and RMSEP= 0,518635, AUROC for sheep samples= 0,99, AUROC for goat samples= 0,98 and AUROC for cow samples= 0,96. In fact, the emission band 350–591 nm characterized sheep milk and corresponds to aminoacids and fatty acids, cow milk was related to the 350–600 nm emission band related to the b-carotene and to the goat milk the emission bands 350–505 nm and 520–600 nm were attributed to tryptophan, NADH and Rivoflabin. Finally, we investigated whether SyFS coupled with chemometrics may provide preliminary evidence on adulterated cow milk samples. All models were validated with permutation testing, p-values and ROC curves.
Keywords
Milk
Synchronous fluorescence
Chemometrics
Adulteration
Quality assurance

1 Introduction
The current research focuses on two emerging topics within the dairy sector that concern product’s quality assurance and fraud detection. For this purpose we utilized front face fluorescence to investigate whether this low cost and rapid analytical technique could deliver palpable evidence on milk’s quality assurance.
Milk constitutes a complex mixture of carbohydrates, lipids, proteins, vitamins, minerals and various other compounds dispersed in water (Kaminarides and Moatchou, 2009; Ahmad et al., 2008; Ozrenk and Inci, 2008). The nutritional and economic value of a dairy product is directly related to the lactation period, the environmental conditions, the season, the food ration, the dietary, the reproduction process, the race of the animal and the processing technology (Kittivachra et al., 2007; Mungkarndee et al., 2016).
Today consumers and food supply chain companies have a propensity for expressing concerns regarding the consistency and origin of a food item. Fraudulent attempts towards a food item involve adulteration and deliberate mislabeling of a product. Specifically, cases of milk adulteration include the addition of compounds that alter its natural content, such as the dilution with water, mixing milk of different animal species or the addition of milk powder, (Handford et al., 2016; Moncayo et al., 2017). In Greece, milk is a prime commodity product and its adulteration bears a significant negative economic impact on the dairy industry.
Spectroscopic techniques are gaining popularity in food chemistry as they facilitate rapid analytical methods for various products (Mousdis and Mellou, 2017). Fluorescence spectroscopy exhibits various advantages over other spectroscopic methods, since it is rapid, may acquire multidimensional information in a single measurement and is much more sensitive than other spectroscopic methods because fluorescent compounds are highly sensitive to their environment (Karoui and Blecker, 2011; Lohumi et al., 2015; Poiana et al., 2012). On the other hand, molecular fluorescence spectroscopy is a well-established analytical technique, with sensitivity (Valeur, 2001) that normal modes of vibrational techniques cannot compete with. However, methods based on fluorescence spectroscopy are not well suited for the analysis of complex multi-component samples without prior separation, due to severe overlaps of excitation and emission bands.
In such cases, SyFS techniques or total luminescence (TL) spectroscopy improve the analytical potential of fluorescence spectroscopy (Poulli et al., 2009a, 2009b). In SyFS the excitation and emission monochromators are scanned simultaneously in such a manner that a constant wavelength interval is kept between emission and excitation wavelengths (Patra and Mishra, 2002). SyFS spectroscopy reduces spectral overlaps by narrowing spectral bands and simplifies spectra by preferentially amplifying some fluorescence bands. It has several advantages over conventional fluorescence spectroscopy, such as simple spectra, high selectivity and low interference (Patra and Mishra, 2002). By using suitable offset values (Δλ), we can enhance some bands and use it as a very simple and effective method of obtaining data for quantitative determination in a single measurement.
A series of valuable information about milk or dairy products can be extracted from chemometric analysis of fluorescence spectra based on small changes in protein and lipid structure due to high sensitivity to the molecular environment (Andersen and Mortensen, 2008; Shaikh and O' Donnell, 2017; Kumar and Mishra, 2012; Kumar et al., 2014). In fact, the concept of PCA and OPLS-DA methods and their applications have been extensively discussed (Trygg et al., 2007; Eriksson et al., 2006; Fotakis, et al., 2013).
In this work we investigated the ability of front face SyFS complemented with chemometrics to address rapidly and with low cost, consumer issues regarding the quality assurance of Greek milk. We differentiated cow milk samples between Greek and foreign. Then we investigated the impact of the production area and the dairy animal species
Finally, we attempted to gather preliminary evidence on whether front face SyFS complemented by chemometrics may pinpoint adulterated samples among a sample pool of cow samples. To the best of our knowledge, this is the first time that front face SyFS was implemented for the study of Greek dairy products, such as milk.
2 Material and methods
2.1 Milk samples
2.1.1 Greek samples
Fifty (50) commercial milk samples from cows of the Holstein breed, forty (40) goats of the Karagouniko breed and thirty five (35) sheep of the Chios breed were collected from different farms in Greece, stemming from the regions of Attiki Viotias, Ilia, North Greece:
Ksanthi, Larissa, Serres and Thessaloniki. All the aforementioned samples were provided by the Delta Foods S.A.
2.1.2 Foreign samples
Forty four (44) commercial cow milk samples were analyzed in parallel, originating from (14) Czech Republic, (14) Slovakia and (16) Hungary. All the aforementioned samples were provided by the Delta Foods S.A.
2.1.3 Adulterated samples
Finally, Delta Foods S.A, Ag Stefanos, Greece, provided six (6) cow milk samples with milk powder of unknown composition. The adulteration was conducted by the company Delta Foods S.A by adding milk powder of unknown composition to six samples.
The milk powder is a plant derived product diluted in water for different and then added to cow milk.
Two samples (skonh & skonh1) consisted only of milk powder, and four cow milk samples (2 = 5% addition, 3 = 10% addition, 4 = 15% addition, 5 = 20% addition) ςε.
2.1.4 Samples treatment
All samples were labeled, frozen and transported to a laboratory from the company Delta Foods S.A. Specifically, all samples were stored in plastic containers of 20 ml capacity.
The cow milk samples were treated with sodium azide (NaN3) 0,1% (Sinaga, et al., 2018) as antimicrobial agent and all milk samples were stored at −20 °C. Samples were transported in isothermal boxes with ice bags to the laboratory where they were further stored at −20 °C until analysis.
2.2 Synchronous fluorescence analysis
The Fluorolog of Jobin Yvon is a fully computer-controlled instrument using a double-grating monochromator for excitation and a single-grating emission monochromator using a 450 W xenon lamp for excitation. Excitation and emission slit widths were set at 2 nm. The acquisition interval and integration time were set at 1 nm and 0,3 s respectively.
Three acquisitions per cow milk sample were performed. All SyFS spectra were collected by simultaneously scanning the excitation and emission monochromator in the excitation wavelength range 250–500 nm and with Δλ varying from 10 to 100 nm. The spectra were corrected for the excitation lamp and the photomultiplier detector spectral response. All the measurements were done using the front face technique. All the wavelength numbers refer to the emission.
2.3 Statistical analysis
2.3.1 Data-processing
The fluorescent data set was converted to ASCII format and imported into the SIMCA-P version 15.02 (Umetrics, Umeå, Sweden) for statistical analysis. The data was log transformed, mean centered and UV scaled. Scaling to unit variance (UV) and mean centering ensures that large relative alterations in low abundance biomolecules exert the same influence as high abundance biomolecules. The Log Transformation alleviates the effect of a significant bunching of data in one area with a few more disperse points elsewhere.
All models were extracted at a confidence level of 95%.
A Table with explanations of the abbreviations used in the statistical analysis was added to the supplementary material, Table S1.
2.3.2 Model interpretation
The quality of models (PCA/OPLS-DA) was described by the goodness-of-fit R2 (0 ≤ R 2 ≤ 1) and the predictive ability Q2 (0 ≤ Q2 ≤ 1) values. The R2 indicates how well the model explains the dataset, thus constituting a quantitative measure of how well the data of the training set was mathematically reproduced.
The overall predictive ability of the model is assessed by the cumulative Q2, referred as the cross-validated correlation in the SIMCA-P software. Cross-validation involves partitioning the subjects into subsets, and fitting the model after randomly excluding one subset at a time from the analysis. Q2 is the correlation based on averaging the results from repeated iterations of cross-validation, and represents a measure of the predictive power of the model (i.e., how well the model is expected to fit additional cohorts). In an ideal model the R2 and Q2 should be similar, meaning that each of the subjects contribute equally and uniformly to the observed group separation. In reality Q2 is always lower than R2; however, if Q2 is substantially lower than R2 then the robustness of the model is poor, implying overfitting (Eriksson et al., 2006).
2.3.3 Exploratory analysis
The exploratory principal component analysis (PCA) was applied to acquire a general insight and visualize any relation (trends, outliers among the observations (samples). First, we utilized the milk’s SyFS fingerprint to extract PCA models with various Δλ varying from 10 to 100 nm. A first screening showed that the optimal and most reliable results from the extracted statistical models, can be obtained with the Δλ = 100, since this PCA model exhibited the highest R2 and Q2 values, the lowest R2 - Q2 and high values of eigenvalues of the first two components (Supplementary material Table S2). This means that this model explains the highest percentage of the variation and is more robust than the others. Therefore, the difference between emission and excitation remains constant at 100 nm (Δλ = 100 nm).
2.3.4 Classification analysis
Data sets were further subjected to Orthogonal Projections to Latent structures Discriminant Analysis (OPLS-DA) in order to increase the quality of the classification model. Specifically, OPLS-DA facilitates the separation of the systematic variation in X into two parts, one that is linearly related to Y (predictive information) and one that is unrelated to Y (orthogonal information). The predictive information of Y in X is concentrated in the first predictive component and is associated with the between groups variation while the variation in X which is unrelated to Y is put in the second and orthogonal component and is linked to the within groups variation. The cognition of the orthogonal variation improves model visualization and interpretation (Trygg et al., 2007; Eriksson et al., 2006; Fotakis et al., 2013).
2.3.5 Important feature selection
Contribution, and volcano shaped plots were extracted to reveal the spectral areas mostly affecting the samples’ differentiation.
A contribution plot displays the differences, in scaled units, for all the terms in the model, between an outlying observation or a group and the normal (or average) observation or another group, multiplied by the absolute value of the normalized weight.
The loading plots display the correlation structure of the variables. That is, they show the importance of the x-variables in the approximation of the X matrix.
Variable selection using a combination of Variable Influence in Projection (VIP) and p(corr) was performed in terms of a volcano shaped plot. Based on the resulting Q2 (predictive power) and CV-ANOVA values, iterations of variable selection using VIP > 0,75 and |p(corr)| > 0,2 as inclusion criteria were applied. VIP is a metric that summarizes the importance of each variable in driving the observed group separation. A complementary parameter is the p(corr) value, representing the loadings scaled as a correlation coefficient, thereby standardizing the range from −1,0 to 1,0 (Eriksson et al., 2006; Fotakis and Zervou, 2016).
The SIMCA-P version 15.02 (Umetrics, Umeå, Sweden) was used to extract the above plots from the acquired data.
2.3.6 Internal validation
Regression models have been validated using cross validation-analysis of variance (CV-ANOVA), with a P-value < 0,05.
Permutation testing was applied (900 permutations) to check the validity and the degree of overfit for all OPLS-DA models and thus evaluate whether the specific classification of two classes in a model are significantly better than any other models obtained by randomly permuting the original groups attribution.
An additional measure of PLS-DA model validity included the extraction of receiver–operator characteristic (ROC) curves to assess the ability of the PLS latent variable Tpred to correctly classify the test set. The area under the ROC (AUROC) was calculated. A perfect discrimination corresponded to an AUROC equal to 1.
2.3.7 External validation
Also, for validation purposes, and the Root Mean Square Error of Estimation (RMSEE), root mean squared error from cross-validation (RMSECV) model, and root mean square error of prediction (RMSEP) were estimated for each supervised model.
All this information is summarized in the supplementary material Table S3.
3 Results & discussion
Milk and dairy products contain several intrinsic fluorophores that may prove useful as markers in the identification of milk origin, since these compounds are affected by the animal breed and the geographic location. In fact, aromatic amino acids and nucleic acids, tryptophan residues of proteins, vitamin A and riboflavin are the best known fluorescent molecules in dairy products (Herbert et al., 2000; Karoui et al., 2005).
3.1 Fluorescent profiles of milk products
Characteristic fluorescent spectra of samples are presented in Fig. 1 (and in Fig. S1 with annotations on the fluorescent molecules) exhibiting the different fluorescent profile of each animal’s milk. At a glance there is a clear difference in fluorescence intensity between adulterated, sheep and goat milk at 363 nm attributed to vitamin A, tryptophan, aromatic amino acids (AAA) and nucleic acid (NA). Also, variations related to the type of animal can be observed at 419 nm and are probably attributed to the β-carotene (Raynal-Ljutovac et al., 2008; Ullah et al., 2020).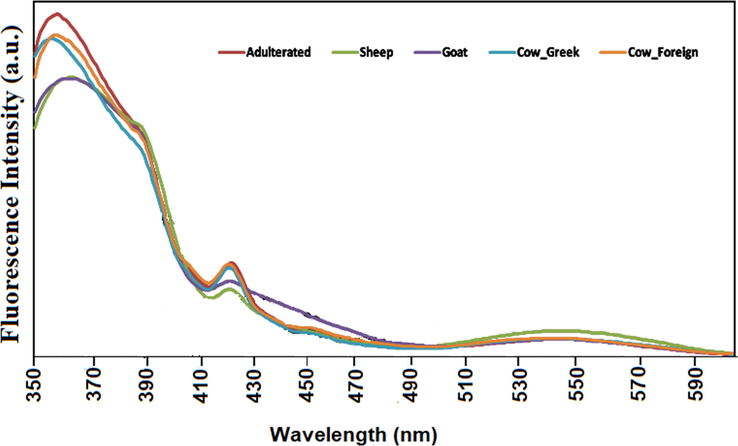
Indicative SyFS spectrum for Δλ = 100 nm of cow, sheep, goat milk spectra and adulterated and foreign milk samples’ within the fluorescent areas.
These preliminary findings will be verified with the implementation of chemometrics.
Considering the vitamin A fluorescence spectra, the shape of the spectra showed two maxima located at 305 and 322 nm and a shoulder at 295 nm (Karoui et al., 2007). Recently, it has been reported that the shapes of the vitamin A excitation spectrum is correlated with the physical state of the triglycerides in the fat globules (Karoui et al., 2007). Finally, it has been suggested that the changes in the shape of vitamin A spectra may also result from fluorescence transfer between tryptophan residues of proteins and vitamin A located in the fat globule membrane (Kulmyrzaev et al., 2005).
The second region between 405 and 480 nm includes fluorophores responsible for these special bands that have not yet been identified. This region typically shows fluorescence from stable oxidation products formed by aldehydes and amino acids (Kikugawa and Beppu, 1987). In the same region, lumichrome, a photo breakdown product from riboflavin, exhibits fluorescence in the 444–479 nm region (Fox and Thayer, 1998). Finally, β-carotene can also absorb around 400–500 nm. Also β-carotene may undergo photodegradation (Hansen and Skibsted, 2000), which could influence the fluorescence spectra. broad peak at about 522 nm is attributed to riboflavin, as has previously been suggested by Wold et al. (2002). Riboflavin appears to be predominant in the emission spectra with a maximum at 525 nm.
3.2 Authenticity of milk samples
We then implemented chemometrics to extract information regarding the milk’s geographical and animal origin, as well as to detect the ability of fluorescence to elucidate a possible milk adulteration.
3.2.1 Unsupervised comparison of Greek cow milk with foreign cow milk
First, we put under the scope of exploratory analysis Greek and foreign cow milk samples, to address the product’s geographical origin.
We started with a sample pool of 69 samples. For this purpose we extracted a PCA model of two components (A= 2) and 69 milk samples (N= 69) in Fig. 2.A that probed to the differentiation of the samples in accordance to the provenance, between those of Greek and foreign origin. PC1 explained 62,7% of the variation and PC2 explained 21,8%. The model demonstrates very good fitness and high predictability as indicated by the statistical values R2X(cum)= 0,84 and Q2(cum)= 0,83. In particular, the excellent prediction of the model with a Q2(cum) > 0,80 and R2X(cum) - Q2(cum) < 0,3 enhances the robustness and predictive response of this model thus amplifying the reliability of the classification.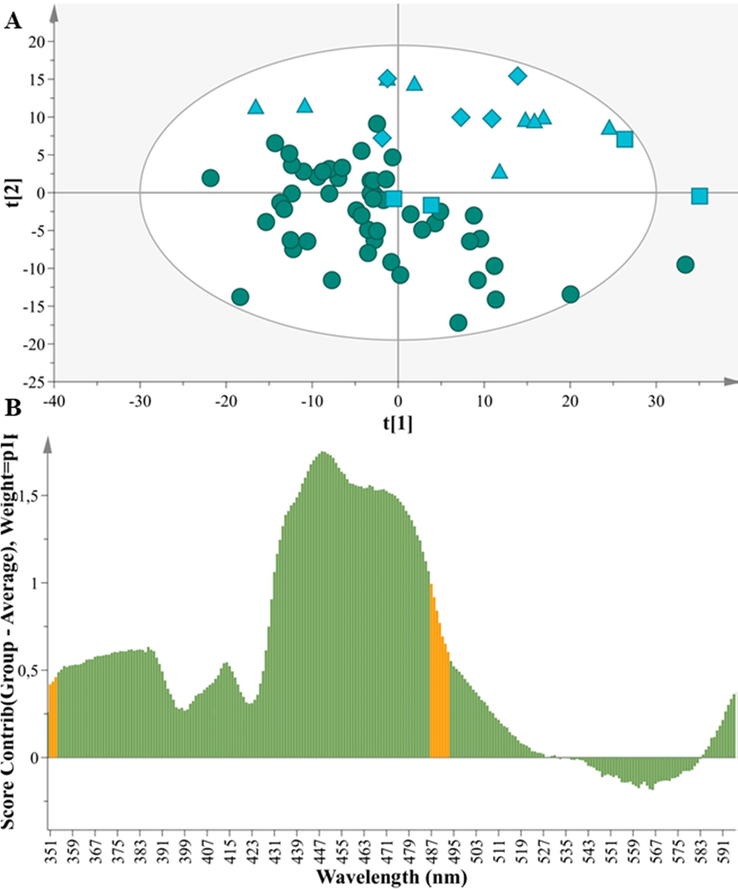
Α. PCA model N = 69, A = 2, R2X(cum) = 0,84, Q2(cum) = 0,83, (Greek: circles) (Foreign: squares = Czech Republic, triangles = Hungary, diamond = Slovakia). B. Contribution plot of Greek vs Foreign cow milk samples depicting the variables responsible for the differentiation between 51 Greek cow milk samples and 18 foreign cow samples.
Moreover, the parameters that contribute to the provenance differentiation are elucidated by the corresponding contribution plot in Fig. 2.B. Specifically, the wavelengths 350–516 nm and 580–600 nm bear high values in the foreign milk samples while the wavelengths in 540–579 nm exhibit low values in the foreign samples. The emissions at these wavelength positions correspond to tryptophan, vitamin A, and riboflavin. The band in 516 nm includes the presence of riboflavin and is probably affected by the origin. The content of riboflavin is increased in the Greek samples in accordance to the contribution plot (Fig. 2.B). The band in 363 nm corresponds to vitamin A, tryptophan, aromatic amino acids (AAA) and nucleic acid (NA), exhibited a higher content in the foreign cow samples. This is an important finding that may be related to the climate of each country.
Another robust PCA model with all the samples is presented in the supplementary material, again verifying the present trends (Fig. S2).
Other studies also demonstrated the ability of front face fluorescence spectroscopy (FFFS) to monitor changes in ewe’s milk throughout the lactation period (Hammami et al., 2010), or to differentiate between two genotypes of ewe’s milk (Zaïdi et al., 2008). In alignment to our results, the aforementioned studies also pinpointed as fluorescent fingerprints aromatic amino acids, nucleic acids (AAA + NA), tryptophan, vitamin A and riboflavin.
3.2.2 Supervised comparison of Greek cow milk samples with foreign
To a step further, we employed supervised analysis on samples of specific Greek origin and random foreign samples in order to verify the parameters responsible for the differentiation and further validate our results.
Specifically, we implemented OPLS-DA with a small number of samples, (training set1: 18 Greek and 18 Foreign), as depicted in Fig. 3.A. The model was constructed with 1 predictive + 1 orthogonal component, N= 36, resulting in a clear separation between the groups along the predictive component. The model demonstrates very good fitness and high predictability as indicated by the statistical values R2X(cum)= 0.87 and Q2(cum)= 0.72. In particular, the excellent prediction of the model with a Q2(cum) > 0.80 and R2X(cum) - Q2(cum) < 0.3 enhances the robustness and predictive response of this model thus amplifying the reliability of the classification.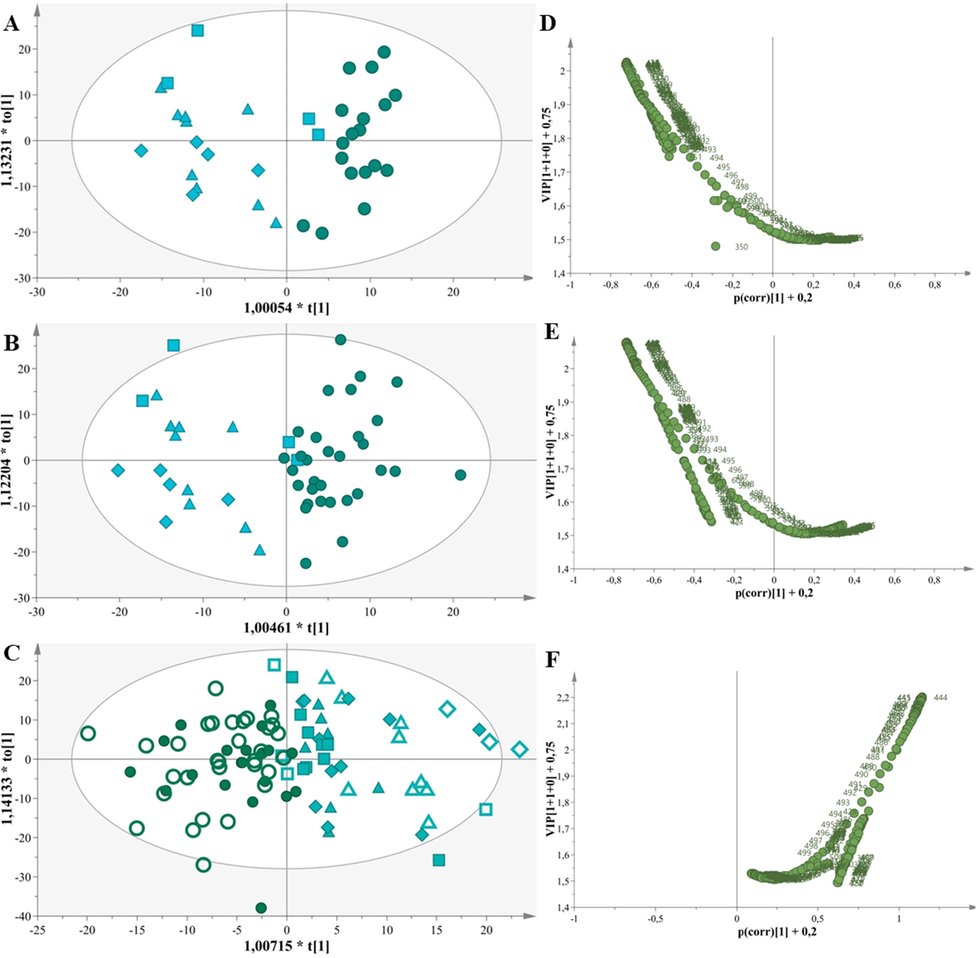
A. OPLS-DA model, N = 36, A = 1 + 1, R2X(cum) = 0,87, Q2(cum) = 0,72. B. OPLS-DA model, N = 50, A = 1 + 1, R2X(cum) = 0,83, Q2(cum) = 0,70. C. OPLS-DA model, N = 94, A = 1 + 1, R2X(cum) = 0,79, Q2(cum) = 0,54. D. Volcano plot of Greek vs Foreign cow milk samples depicting the variables responsible for the discrimination of 36 samples. E. Volcano plot of Greek vs Foreign cow milk samples depicting the variables responsible for the discrimination of 50 samples F. Volcano plot of Greek vs Foreign cow milk samples depicting the variables responsible for the discrimination of 94 samples.
We estimated p[CV-ANOVA]= 2,91E-08, RMSEE= 0,26, RMSEcv= 0,26 and RMSEP= 0,60, evaluated the AUROC (foreign 0,89, Greek 0,73) and Permutation tests (Table S3, Fig. S3). All attesting to the reliability of the model and effacing overfitting.
Another OPLS-DA model was produced with more Greek samples (training set2: 50 Greek and 18 Foreign, Fig. 3.B). The model was constructed with 1 predictive + 1 orthogonal component, N = 50, resulting again in a clear separation between the groups along the predictive component. The model demonstrates very good fitness and high predictability as indicated by the statistical values R2X(cum)= 0.83 and Q2(cum)= 0.70. In particular, the excellent prediction of the model with a Q2(cum) > 0.80 and R2X(cum) - Q2(cum) < 0.3 enhances the robustness and predictive response of this model thus amplifying the reliability of the classification. The OPLS-DA model was validated with the same steps, summarized in the supplementary material (Table S3, Fig. S4).
Then we encompassed an external validation set reaching 94 milk samples that resulted in another OPLS-DA model (external validation set 50 Greek and 44 Foreign, Fig. 3.C). The model was constructed with 1 predictive + 1 orthogonal component, N= 94, discriminating the Greek and foreign samples along the first principal component. The model demonstrates very good fitness and good predictability as indicated by the statistical values R2X(cum)= 0.79 and Q2(cum)= 0.54. In particular, the excellent prediction of the model with a Q2(cum) > 0.80 and R2X(cum) - Q2(cum) < 0.3 enhances the robustness and predictive response of this model thus amplifying the reliability of the classification. Finally, the use of aforementioned validation steps confirmed that the results of this OPLS-DA model were unbiased and reliable as described in the Supplementary (Table S3, Fig. S5).
The differences of all OPLS-DA models are highlighted in corresponding volcano shaped plots (Fig. 3.D, E and F) with variations mainly in the wavelength regions of 411–490 nm, as well as 350–398 nm, 409–416 nm and 426–494 nm. In alignment to the unsupervised comparison of Greek cow milk with foreign cow milk samples in the band 350 – 515 nm the latter samples bear high values and can be attributed to vitamin A, tryptophan, aromatic amino acids (AAA) and nucleic acid (NA) and riboflavin.
The bands responsible for the differentiation are the same for each volcano shaped plot. This postulates that the origin is the dominant factor, while storage, feeding system or other factors in this sample pool seems to contribute scarcely if at all to the discrimination.
Evidently, SyFS may contribute to the differentiation of cow milk samples into Greek or foreign.
3.3 Animal species differentiation
Fluorescence has been employed to detect if a milk sample derives from a specific breed or a mix of several breeds (Plachkova et al., 2016). In alignment, we implemented SyFS to cow, goat and sheep milk samples in order to differentiate them in relation to the animal species.
This information will prove useful for the Greek dairy industry especially valorized for the fortification of the Greek “Feta” cheese. In particular, “Feta” must consist only of sheep and goat milk, it must not contain any cow's milk, and its consistency in goat milk should not exceed 30%.
A PCA model with two components was computed on 107 samples and explained sufficiently the 80,2% of the dataset variance, (PC1 explains 65,0% of the variation and PC2 explains 15,2% of the variation, Fig. 4). The model demonstrates very good fitness and good predictability as indicated by the statistical values R2X(cum)= 0,80 and Q2(cum)= 0,54.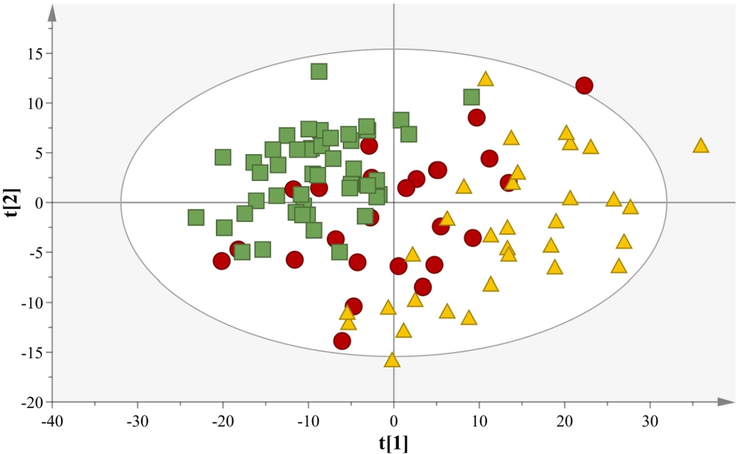
PCA model comparing samples of different animal origin, N = 107, A = 2, R2X(cum) = 0,80, Q2(cum) = 0,54. The animal species classification is depicted using different symbols: (Green box: Cow; Red circle: Goat; Yellow triangle: Sheep).
In fact, the samples deriving from sheep have been located in the 1st and 4th quadrants, the cow milk samples are mainly localized in the 2nd and 3rd quadrants and the goat samples localize among these two groups.
Contribution plots (Fig. S6) pinpointed the parameters that characterize each group. Specifically the sheep samples (Fig. S6.A) are characterized by increased intensity of the band 350–591 nm, the cow milk samples (Fig. S6.B) are characterized by decreased intensity of the band 375–600 nm and increased intensity of the band 350–375 nm. The contribution plot (Fig. S6.C) attributed to the goat samples decreased intensity of the band 350–435 nm, increased intensity of the band 435–505 nm and decreased intensity of the band 520 to 600 nm.
It has to be noted that the 405 and 480 nm region typically shows fluorescence from stable oxidation products formed by aldehydes and amino acids (Kikugawa and Beppu, 1987).
Also, variations related to the type of animal can be observed at 419 nm and are attributed to the β-carotene. The goat and sheep milk are white compared to the bovine milk, which due to the presence of carotenoids tends to be slightly yellow.
To further enhance the validity of our results we extracted an OPLS-DA model on the 107 samples Particularly, a 3D scatter plot (Fig. 5.A) utilizing three components (t(1), t(2), t0(1)) classifies the samples on the basis of the animal species with high goodness of fit R2Xcum) = 0,98 and a strong predictive ability Q2(cum) = 0,76. The first predictive component explains 44% of the variation, the second predictive component explains 9,4% of the variation and the orthogonal component describes 31,8% of the variation. The permutation tests and AUROC curves that were extracted probed to a high classification rate since all portrayed values for each group higher than 0,95 (Table S3, Fig. S7). The RMSEE, RMSEcv and RMSEP were estimated to 0,225842, 0,27743 and 0,2826 respectively.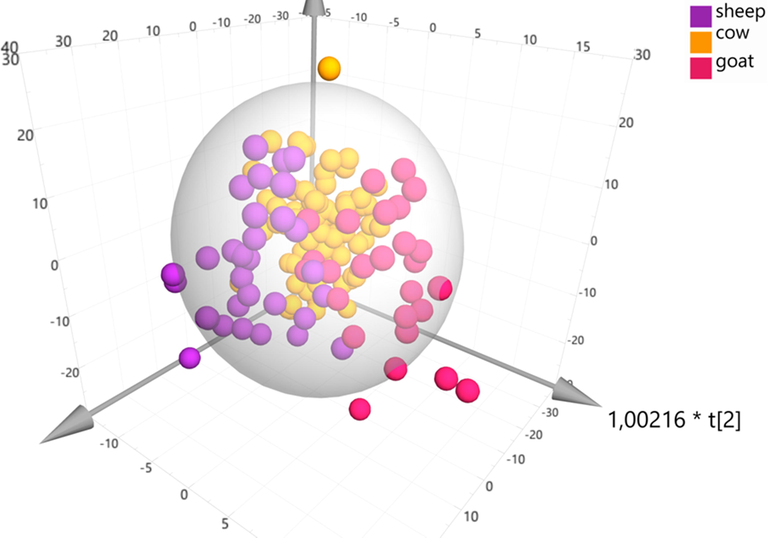
OPLS-DA model comparing samples of different animal origin, A = 2 + 1, N = 107, R2Xcum) = 0,98, Q2(cum) = 0,76.
Species identification is an important issue also addressed by a number of articles, either for authenticity or adulteration purposes. For instance (Genis et al., 2020) applied on fluorescent data from yoghurt and cheese samples PLS-DA with an100% EFR in order to discern the species (cow, buffalo, ewe, and goat). This method even managed to identify more complex adulteration types of binary mixture again with 100% EFR.
Another study (Ullah et al., 2020), implemented synchronous front-face fluorescence spectroscopy with partial least squares regression (PLSR) to predict the adulteration of cow and buffalo milk. The detection limit was found 20%, and determined RMSECV = 1,16 and RMSECP = 6,24.
Another research by (Velioglu et al., 2019) discriminated samples and detected adulteration of buffalo milk with limit of detection value (LOD) of 6% with the models exhibiting values of RMSEC = 2%, RMSECV = 7%, RMSEP = 4%.
When compared to our method, the results of the aforementioned articles show that our chemometric approach delivered reliable results.
3.4 Comparison of cow milk to adulterated samples
The analytical methods for detecting the addition of powder in milk and dairy products are based on alterations of the milk constituents, mainly protein and lactose (Kaminarides and Moatchou, 2009). Few studies have been conducted in which SyF spectroscopy was used for detecting the level of adulteration in dairy products.
In light of this, we attempted to examine whether front face fluorescence complemented by chemometrics may pinpoint the addition of powder to cow milk samples usually used to adulterate milk in Greece. A PCA model with two components was computed on 52 samples and explained sufficiently the 75,8% of the dataset variance, (PC1 explains 52,2% of the variation and PC2 explains 23,6% of the variation, Fig. 6). The model demonstrates very good fitness and good predictability as indicated by the statistical values R2X(cum) = 0,76 and Q2(cum) = 0,63.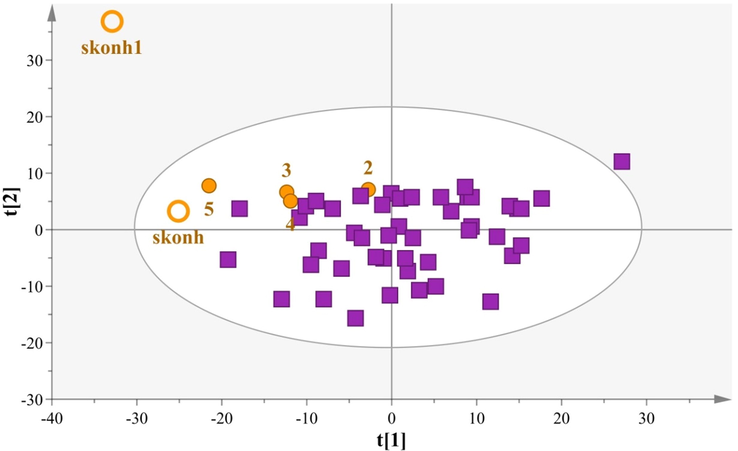
PCA model comparing cow milk samples with adulterated products, N = 52, A = 2, R2X(cum) = 0,87, Q2(cum) = 0,59 (boxes: Cow samples, circles: Cow milk samples with milk powder,
The PCA provides an overview of these samples and allows the highlighting of the milk powder samples located in the 2nd quadrant, while the cow milk samples with milk powder were traced from the rest of the cow samples. Interestingly, for the latter samples a concentration trend was observed for their localization in relation to the addition of milk powder. Specifically, the PCA model includes two samples (skonh & skonh1) consisting only of milk powder, 4 cow milk samples (2 = 5% addition, 3 = 10% addition, 4 = 15% addition, 5 = 20% addition) consisting of cow milk and various concentrations of milk powder and 46 Greek cow samples.
Interestingly, only the sample 5 with 20% addition does not overlap with the cow samples, so we can assume that our method is probably sensitive to 20% adulteration rates and higher. A LOD = 20% has been reported by Ullah et al. (2020), that investigated adulteration of cow and buffalo milk with synchronous front-face fluorescence spectroscopy.
As presented in the loading plot in Fig. S8 the two milk powder samples depicted decreased intensity in the wavelengths 350–460 nm, 510–600 nm, while increased intensity in the wavelengths 460–500 nm. The samples with the addition of milk powder to raw milk samples exhibited high intensity in the wavelengths and decreased intensity in the wavelengths 350–360 nm, 410–434 nm and 490–600 nm.
An OPLS-DA model (Fig. 7) was constructed with 1 predictive + 1 orthogonal component, N = 52. The adulterated samples localized mainly in the 1st quadrant, while the sample skonh1 was a strong outlier. The model demonstrates very good fitness but low predictability as indicated by the statistical values R2X(cum) = 0,77 and Q2(cum) = 0,30. This was expected as the two groups have different sizes. We estimated p[CV-ANOVA] = 0,00714256, RMSEE = 0,26126, RMSEcv = 0,27743 and RMSEP = 0,2826, evaluated the AUROC (foreign 0,90, Greek 0,75) and Permutation tests (Table S3, Fig. S9).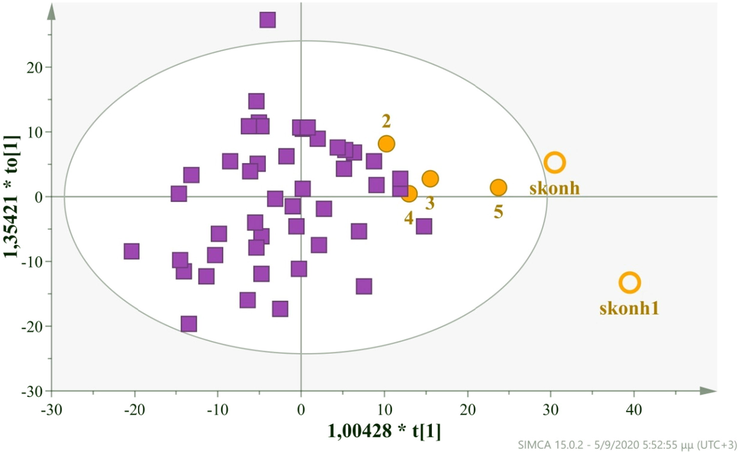
OPLS-DA model comparing cow milk samples with adulterated products, N = 52, A = 2, R2X(cum) = 0,87, Q2(cum) = 0,59 (boxes: Cow samples, circles: Cow milk samples with milk powder, 2 = 5%, 3 = 10%, 4 = 15%, 5 = 20% , skonh & skonh1: Milk Powder,
To enhance the predictability of our approach more adulterated samples must be incorporated but the preliminary results show that samples with adulteration rates higher than 20% can be pinpointed.
Other studies have investigated the milk adulteration issue but used other spectroscopic methods focusing on urea adulterations in milk samples. For instance, a preliminary study (Khan et al., 2015) in milk samples added with urea at various concentrations showed that Raman spectroscopy in combination with the PLS-based chemometric algorithm could detect urea mixed in milk samples with an accuracy of >90%. Another study implemented near‐infrared spectroscopy coupled with multivariate analysis for the same purpose and efficiently discriminated adulterated milk samples with urea, exhibiting excellent values in RMSE = 0,56 and RMSEP = 0,48% (Mabood et al., 2019).
4 Conclusions
This research assessed the fluorescent fingerprint of domestically produced Greek milk (goat, sheep, cow), thus highlighting the ability of front face SyFS to address milk quality assurance issues. In particular, the synchronous fluorescent data of raw milk samples were incorporated into PCA and OPLS-DA models and after their validation could serve as low cost, rapid tools for authenticating Greek milk. Specifically, we attempted to ensure the quality assurance of milk by delineating the geographical origin and the animal type. We also performed preliminary experiments to gather first evidence on detecting possible milk adulteration with the addition of milk powder. From the analysis of three types of domestically produced milk, we concluded that cow milk is characterized by the highest concentration of tryptophan and metabolites of plant pigments compared to the goat and sheep milk. The discrimination of milk samples from different animal types is an important issue for economic reasons, such as the fortification of the Greek cheese “Feta”, since PDO (Protected Denomination of Origin) cheeses are products of high commercial value confined according to legislative and proper labeling rules. Therefore, the results of our research contribute to the production of authentic and competitive products.
Declaration of Competing Interest
The authors declare that they have no known competing financial interests or personal relationships that could have appeared to influence the work reported in this paper.
References
- Effects of acidification on physico-chemical characteristics of buffalo milk: A comparison with cow’s milk. Food Chem.. 2008;106:11-17.
- [Google Scholar]
- Fluorescence spectroscopy: A rapid tool for analyzing dairy products. J. Agric. Food. Chem.. 2008;56:720-729.
- [Google Scholar]
- Multi- and Megavariate Data Analysis (2nd ed.). Sweden: Umetrics AB; 2006.
- NMR metabolite fingerprinting in grape derived products: An overview. Food Res. Int.. 2013;54:1184-1194.
- [Google Scholar]
- NMR metabolic fingerprinting and chemometrics driven authentication of Greek grape marc spirits. Food Chem.. 2016;196:760-768.
- [Google Scholar]
- Development of synchronous fluorescence method for identification of cow, goat, ewe and buffalo milk species. Food Control. 2020;108:106808.
- [Google Scholar]
- Fluorescence spectroscopy coupled with factorial discriminant analysis technique to identify sheep milk from different feeding systems. Food Chem.. 2010;122:1344-1350.
- [Google Scholar]
- Impacts of milk fraud on food safety and nutrition with special emphasis on developing countries. Compr. Rev. Food Sci. Food Saf.. 2016;15:130-142.
- [Google Scholar]
- Light-induced oxidative changes in a model dairy spread. Wavelength dependence of quantum yields. J. Agric. Food. Chem.. 2000;48:3090-3094.
- [Google Scholar]
- Monitoring the identity and the structure of soft cheeses by fluorescence spectroscopy. LeLait. 2000;80:621-634.
- [Google Scholar]
- Characterisation of soft cheese by front face fluorescence spectroscopy coupled with chemometric tools: Effect of the manufacturing process and sampling zone. Food Chem.. 2007;100:632-642.
- [Google Scholar]
- Potentiality of front-face fluorescence spectroscopy to determine the geographic origin of milks from Haute-Loire department (France) Le Lait. 2005;85:223-236.
- [Google Scholar]
- Fluorescence spectroscopy measurement for quality assessment of food systems – a review. Food Bioprocess Tech. 2011;4:364-386.
- [Google Scholar]
- Detection of urea adulteration in milk using near-infrared Raman spectroscopy. Food Anal. Methods. 2015;8:93-102.
- [Google Scholar]
- Quantification of ethanol in ethanol-petrol and biodiesel in biodiesel-diesel blends using fluorescence spectroscopy and multivariate methods. J. Fluorescence. 2012;22:339-347.
- [Google Scholar]
- Chem. Phys. Lipids. 1987;44:277-296.
- Factors affecting lactose quantity in raw milk. Songklanakarin J. Sci. Technol.. 2007;29:937-943.
- [Google Scholar]
- Classification of aqueous-based ayurvedic preparations using synchronous fluorescence spectroscopy and chemometric techniques. Curr. Sci.. 2014;107:470-477.
- [Google Scholar]
- Front-face fluorescence spectroscopy allows the characterization of mild heat treatment applied to milk. Relations with the denaturation of milk proteins. J. Agric. Food. Chem.. 2005;53:502-507.
- [Google Scholar]
- A review of vibrational spectroscopic techniques for the detection of food authenticity and adulteration. Trends Food Sci. Technol.. 2015;46:85-98.
- [Google Scholar]
- Robust Fourier transformed infrared spectroscopy coupled with multivariate methods for detection and quantification of urea adulteration in fresh milk samples. Food Sci. Nutrit. 2019:1-10.
- [CrossRef] [Google Scholar]
- Qualitative and quantitative analysis of milk for the detection of adulteration by Laser Induced Breakdown Spectroscopy (LIBS) Food Chem.. 2017;232:322-328.
- [Google Scholar]
- Mousdis, G., Mellou, F. Food Authentication. Fluorescence Spectroscopy 298, Georgiou, C.G., Wiley, J. & Sons Inc. (2017). Food Authentication: Management, Analysis and Regulation (New York, United States) 8.2, 299-325, ISBN: 978-1-118-81026-2.
- Fluorescence sensor array for identification of commercial milk samples according to their thermal treatments. Food Chem.. 2016;197:198-204.
- [Google Scholar]
- The effect of seasonal variation on the composition of cow milk in Van Privince, Pakistan. J. Nutrit.. 2008;7:161-164.
- [Google Scholar]
- Patra, D., Mishra A.K., 2002. Recent development in multicomponent synchronous fluorescence scan analysis. TrAC Trends Anal. Chem., 21, 787.
- Plachkova, V., Zhelyazkova, A., Avramov, L., Zemyarski, Ch., Petrov, P., 2016. Characterization of raw milk of ruminants by means of Fluorescence spectroscopy. J. Sci. Res. Publ., 6, 90–94.
- Poiana, M.A., Mousdis, G., Alexa, E., Moigradean, D., Negrea, M., Mateescu C. (2012). Application of FT-IR spectroscopy to assess the olive oil Adulteration. J. Agroaliment. Processes Technol. 18, 277–282.
- Synchronous fluorescence spectroscopy: tool for monitoring thermally stressed edible oils. J. Agric. Food. Chem.. 2009;57:8194-8201.
- [Google Scholar]
- Monitoring olive oil oxidation under thermal and UV stress through SyFS spectroscopy and classical assays. Food Chem.. 2009;117:499-503.
- [Google Scholar]
- Composition of goat and sheep milk products: An update. Small Rumin. Res.. 2008;79:57-72.
- [Google Scholar]
- Applications of fluorescence spectroscopy in dairy processing: a review. Curr. Opin. Food Sci.. 2017;17:16-24.
- [Google Scholar]
- Effect of sodium azide addition and aging storage on casein micelle size. Int. Conf. Agric. Environ. Food Sec.. 2018;122:012083.
- [CrossRef] [Google Scholar]
- Potentiality of using front face fluorescence spectroscopy for quantitative analysis of cow milk adulteration in buffalo milk. Spectrochim. Acta Part A Mol. Biomol. Spectrosc.. 2020;225:117518.
- [Google Scholar]
- Rapid discrimination between buffalo and cow milk and detection of adulteration of buffalo milk with cow milk using synchronous fluorescence spectroscopy in combination with multivariate methods. J. Dairy Res.. 2019;84:214.
- [Google Scholar]
- Molecular Fluorescence: Principles and Applications (1st ed.). Chishester: Wiley; 2001.
- Wold, J.P., Jorgensen, K., Lundby, F., 2002. Nondestructive Measurement of Light-induced Oxidation in Dairy Products by Fluorescence Spectroscopy and Imaging. J. Dairy Sci., 85, 1693–1704.
- Front face fluorescence spectroscopy as a rapid and non destructive tool for differentiating between Sicilo-Sarde and Comisana ewe’s milk during lactation period: A preliminary study. Food Bioprocess Technol.. 2008;1:143-151.
- [Google Scholar]
Appendix A
Supplementary material
Supplementary data to this article can be found online at https://doi.org/10.1016/j.arabjc.2020.09.019.
Appendix A
Supplementary material
The following are the Supplementary data to this article:Supplementary data 1
Supplementary data 1


