

Translate this page into:
Full physicochemical characterization of malic acid: Emphasis in the potential as food ingredient and application in pectin gels
⁎Corresponding author at: Department of Chemical Engineering, Graduate Program in Food Engineering, Federal University of Paraná, Av. Francisco Heráclito dos Santos, n. 100, PC 81531-980 Curitiba, Parana State, Brazil. carooolmarques@gmail.com (Caroline Marques)
-
Received: ,
Accepted: ,
This article was originally published by Elsevier and was migrated to Scientific Scholar after the change of Publisher.
Peer review under responsibility of King Saud University.
Abstract
Abstract
Malic acid showed high solubility (>48%) even in low temperatures. Malic acid low hygroscopicity (∼8g⋅mol−1) suggests its use in crisp food products. TGA exhibited initial loss of mass in 140 °C, propitiating several food applications of malic acid. Chelating and antioxidant activities of malic acid disclosed expressive results even in 1% solution. Pectin gels with malic acid had stronger structure and less syneresis than citric acid gels.
Abstract
Malic acid, a carboxylic acid most found in fruits, is a smooth taste substance used as flavoring and preservative agent in foods, although not as used as citric acid. There are no studies focusing in quantitative results or investigations on its physicochemical properties, useful to the food industry, or even the confirmation of its calcium chelating, buffer texturizer and antioxidant alleged properties. Thus, the aim of this work was the assessment of most physicochemical properties of malic acid, solid and in solution, that could be useful to the food industry understand its real potential. The following analyses were carried out: melting point; structure (NMR, XRD, FTIR and SEM/EDS); TGA/DTG; solubility, hygroscopicity; antioxidant activity, iron chelating and antibacterial activities and stability of pectin gels. The melting temperature found was 129.71 °C. TGA/DTG exhibited first loss of mass around 140 °C. In the temperature range of 10 to 55 °C, it exhibited a high solubility in water, from 48.12 to 61.49 (100w), respectively. The tested bacteria, related to food spoilage, were inhibited by DL-malic acid 10% or higher. Chelating and antioxidant activities showed expressive results even in 1% solution. Pectin gels with malic acid had stronger structure and less syneresis than citric acid gels. In addition, calcium chelating, buffer texturizer and antioxidant properties were confirmed. Thus, malic acid has potential to be applied in a wide variety of food products as fortified beverages, frozen and refrigerated items, oils, pectin gels, hard and soft candies, and biofilms, due to all the characteristics quantified.
Keywords
Malic acid
Food processing
Food preservative
Metal chelating
Antibacterial agent
Pectin gels

1 Introduction
The DL-Malic acid is a white crystalline powder, highly soluble in water, containing three hydroxyls in its chemical structure. It appears in relatively high amounts in several fruits and vegetables, while only the L-isomer exists naturally. Racemic DL-Malic acid is made commercially by hydration of maleic anhydride under high temperature and pressure to form malic and fumaric acids.
The regulations list the DL-malic acid as food additive, acidifier and preservative in the European Union – E296 (European Food Safety Authority, 2014) without restrictions. In Brazil (BRASIL, 2010), it is allowed as acidity regulator and sequestering agent, with restrictions for pasta and vinegars. The reports of FDA (FDA, 2019) list de malic acid as a flavor enhancer, flavoring agent, adjuvant, and pH control agent, with prohibition for baby food and limitations for other food products, as 3.4% in nonalcoholic beverages, 3.5% in fruit juices and 0.7% in all other food categories, furthermore it is recognized as safe (GRAS).
According to the European Food Safety Authority (European Food Safety Authority, 2014), usually 0.1–0.15% is used in animal feed, and this amount does not affect or change the pH levels. Moreover, the same reports states that authorities have reservations about the effectiveness of malic acid in the preservation of food/feed with <12% of moisture during storage.
In most pear fruits, malic acid is the predominant organic acid, followed by citric acid (Wang et al., 2018). Studies point out some benefits attributed to the malic acid, which could be of great value in food products. The high activity inhibiting α-glucosidase, α-amylase and lipase enzymes (Alakolanga et al., 2015); synthesis and rheological structure of hydrogels (Kwon et al., 2019), with no structural change of the corn starch (Lee et al., 2019); organoleptic quality, physical, biochemical and microbial stability of wine, directly related to the pH regulation (Volschenk et al., 2017); control of pathogenic and spoilage microorganisms from cheese surface with films (Pintado et al., 2010), are some of them.
It worth noticing that malic acid is not categorized as texturizer by legislation. However, according to a technical report (Polynt, 2019) and some websites as Bakerpedia (Bakerpedia, 2020), the malic acid has several other uses in food. Worth to mention: The calcium-fortified beverages added with malic acid with chelating activity; the ability to form stable iron/calcium chelates that prevent the precipitation of iron/calcium salts; the low melting point that is preferable to hard candies; the smooth sour/tart taste that may enhance some flavors and mask others; the pectin gel texture and stability due to its buffering capacity; antioxidant in oil and fats and mold inhibitor for baking products. One of the allegations has quantitative results in scientific papers, the iron chelating activity, where Nadeau and Clydesdale (Nadeau and Clydesdale, 1986) presented results in wheat flake cereal and Keykhosravi and co-workers (Keykhosravi et al., 2016) showed a non-significant effect in mushrooms.
In relation to pectin gels, there are numerous studies that report its high application in the food industry. Traditionally they are applied in the formulation of jams, juices, confectionery and bakery products (Wusigale et al., 2020), they are also used as oil emulsifiers (Williams et al., 2005) and intelligent packaging additives, because they have the ability to transport antimicrobial compounds in the food product, prolonging their shelf life and protecting them from microbial contamination (Kumar et al., 2020). Beyond the well-established application to the food industry, the pectin gels interest in other fields is rising, e.g., are considered a biocompatible resource of functional materials for biomedicine application or even in preparing cleaning formulations (Bertolino et al., 2020; Cavallaro et al., 2019). Reinforcing the importance of the search for new and biocompatible additives to improve the stability of these gels.
In a prospect to 2025, the industry of malic acid will reach USD 257.7 mi, emerging the bakery, confectionery and beverage sectors. Currently only 21% of the malic acid manufactured is for food industry, moreover pet foods, personal care and medical products share the remain amount (Research and markets, 2019). Industries have been using malic acid as food additive in the United States (USA) and Europe (Kwon et al., 2019), although citric acid is still more used in the food industry as acidifier due to the fruity pronounced taste, low price and high availability (Batt and Tortorello, 2014). In contrast, malic acid confers smooth taste, able to even mask flavors of the artificial sweeteners (Hui, 2005; Theron and Lues, 2010).
There are few studies regarding malic acid behavior in foods, none focusing in quantitative results or investigations on its physicochemical properties, useful to the food industry, or even the confirmation of its calcium chelating, buffer texturizer and antioxidant properties. Thus, the aim of this work was the assessment of most physicochemical properties of the malic acid, solid and in solution, that could be useful to the food industry understand its real potential.
2 Material and methods
The study was carried out in the laboratories of the Graduate Program in Food Engineering at the Federal University of Paraná (UFPR), Polytechnic Center, Food Technology Laboratory - LABTECAL, Power Plant B, in the city of Curitiba – Parana State.
2.1 Reagents
For the analysis, the following reagents were used: DL – Malic acid 99.82% (Neon Co.), ABTS 98% (Sigma Aldrich Co.), DPPH (Sigma Aldrich Co.), absolute ethanol (Biotec®), potassium persulfate (Synth®), Trolox (Acros Organics®), sodium carbonate (Vetec Ltd.), Folin-Ciocalteu reagent (Sigma Aldrich Co.), gallic acid 99.98% (Neon Co.), Mueller-Hinton agar (Kasvi®), Mueller-Hinton broth (Kasvi®), chloramphenicol (Colgate-Palmolive Co.), calcium chloride (Alphatec Ltd.), EDTA (Biotec®), ferrozine (Sigma Aldrich Co.), citric acid 99.85% (Neon Co.), citrus pectin (degree of methyl esterification 74%, Mw = 195 kg/mol, impurity ≤ 10%) (BioBrand Co.), sodium hydroxide (Neon Co.), sulfuric acid (Neon Co.) and potassium bromide 99% (Sigma-Aldrich Co.).
2.2 Melting point
The melting point of DL – malic acid was determined using a MP90 digital melting point system (Mettler-Toledo, Columbus, Ohio, USA), software version 3.6.8/1.20. Start temperature was 100 °C and the end temperature was 140 °C, in a heating rate of 1 °C. min−1. The process was recorded and the video file is in the supplementary material.
2.3 Crystallinity by XRD
To characterize the DL - malic acid by X-ray diffractometry, the sample was compacted in a glass sample holder. The measurements were performed with scan from 3 to 50° of 2θ using a Shimadzu diffractometer (XRD-6000, Shimadzu Corp, Kyoto, Japan) with CuKα radiation source of λ = 1.5418 Å, tension of 40 kV, 30 mA current, dwell time of 2° min−1 and step of 0.02°. The XRD pattern obtained and the distances related to each peak, obtained by Bragg’s law (Eq. (1)), are in agreement with the data reported in the literature (Ceolin et al., 1990).
2.4 Structure by FTIR
The characterization by Fourier-transform infrared spectroscopy (FTIR) was obtained in the transmission mode using a MB100 spectrophotometer (Bomem Inc., Zurich, Switzerland), KBr pellets containing around 1% of the DL - malic acid, which were mixed and pressed at 10 tons. A total of 32 scans were accumulated in the region of the medium IR (4000–400 cm−1) with resolution of 4 cm−1.
2.5 Morphological analysis and composition by SEM/EDS
The morphology and the qualitative chemical composition were investigated by scanning electron microscopy (SEM) using a Tescan® VEGA3LMU electronic microscope with AZ Tech software. The DL - malic acid was deposited on a copper double-face tape and after the EDS analysis, the sample was sputtered with a thin gold layer for SEM imaging.
2.6 Thermogravimetric analysis (TGA/DTG)
Thermogravimetric analyze (TGA) was performed on the STA 449 F3 Jupiter (Netzsch®, Germany) The sample was heated in a platinum sample holder under nitrogen atmosphere with a flow rate of 50 mL⋅min−1 and a heating rate of 5 °C⋅min−1.
2.7 Solubility and pH
The solubility of DL - malic acid in water in the temperature range of 10 °C to 55 °C was determined by the gravimetric static method. In 2 mL vials, water and excess malic acid were added to saturate the system. The mixture was stirred in vortex for 2 min and, subsequently, the vials were placed in a thermostatic bath with water circulation (Lab Companion, RW-1025G, Yuseong-gu, Daejeon, Republic of Korea) with an uncertainty of ±0.5 K, at the desired temperature for 40 min, in order to reach thermal balance. After this period, the vials were shaken for 2 min and placed back in the bath, where they were kept for 4 h. With the aid of a syringe, approximately 1 mL of the supernatant solution was removed from the mixture and added to the previously identified and weighed test beaker. They were kept in an oven (Fanem-515, Fanem®, São Paulo, SP, Brazil) at a temperature of 120 °C for 24 h.
After 24 h in the oven, the beaker was conditioned and kept in a desiccator for approximately 2 h, until the system reached the room temperature (approximately 25 °C). From the measurements of the supernatant and solute mass, solubility was determined.
The pH was measured in 25 mL of solution, coupled to a digital meter, noting the value when the meter stabilized (AOAC, 2005). The pH meter (Tecnal®, São Paulo, SP, Brazil) was calibrated with the standards (buffer) 4.0 and 7.0 to obtain reliable results and solutions of DL - malic acid 60%, 40%, 20%, 10% and 1% were tested.
2.8 Higroscopicity and water activity
To determine the sorption isotherms the methodology of Moraes and co-workers (Moraes et al., 2007) was followed with adaptations. The malic acid samples had their moisture values equilibrated at 45 °C/48 h in an air circulation oven. Approximately 1.0 g of sample was weighed in a small aluminum foil container and kept in hermetic glass recipients, which had different relative humidity resulted by H2SO4 (d = 1.84) solutions at different concentrations (10, 20, 30, 40, 50, 60 and 70% v/v). The hermetic glass recipients were kept at constant temperatures (30 °C) for 20 days. These samples were weighed daily in an analytical balance (0.0001 g precision), presenting constant weight at the end of the period. Moisture on dry basis was calculated using Eq. (2):
In sequence the experimental data were fitted using the Halsey model (Halsey, 1985) through Eq. (3):
For the determination of water activity, the sample of anhydrous DL - malic acid was placed in a disposable capsule of the Aqualab 3TE® equipment in an amount sufficient to cover the bottom (approximately 1.0 g). The water activity was obtained by direct reading on the equipment (accuracy of ±0.005) n = 3, at the temperature of 20 °C.
2.9 Antioxidant activity
The DPPH (2,2-diphenyl-1-picryl-hydrazyl) method, based on DPPH capture (60 µM) by an antioxidant (Trolox), was performed by reading the absorbance in a spectrophotometer at 517 nm (Brand-Williams et al., 1995). The blank sample was DPPH diluted with 80% ethanol. The results of the readings were expressed in µM equivalent of Trolox⋅L-1 (Miller et al., 1993), considering (Rufino et al., 2010) modifications. The methodology was performed with a 30-min incubation in the dark and a calibration curve from the Trolox 2000 µM. Malic acid solutions 60%, 40%, 20%, 10% and 1% were tested.
2.10 Chelating capacity
The chelating activity of the Fe2+ ion was in accordance with (Ak and Gülçin, 2008) with minor modifications. The DL – malic acid samples were diluted (60%, 40%, 20%, 10% e 1%) in distilled water (2 mL total) and added to 0.2 mL ferrous ammonium sulfate Fe(NH4)2SO4 (2 mmol), 0.4 mL of ferrozine (5 mmol) and distilled water completing 10 mL. The solution was incubated for 30 min after sulfate and the reading was performed 10 min after the addition of ferrozine, in a spectrophotometer at a wavelength of 562 nm. Iron chelating activity was measured in % by Eq. (4).
To draw the standard curve, different concentrations of ethylenediamine tetraacetic acid (EDTA) were used (0.1–0.0125 mg⋅mL−1).
For the determination of the calcium ion chelating capacity, according to Rathore et al. (1993) with slight modifications, the sample previously diluted in distilled water (60%, 40%, 20%, 10% and 1%), a total of 1 mL, where 3 mL of NaOH was added (1 M) plus 1 mL of CaCl2 (50 mM) with stirring 150 rpm/1 h/37 °C. Subsequently, an indicator (murexide) was incorporated and then the mixture was titrated with EDTA 0.01 M until color change from pink to purple (the volume of EDTA spent was recorded, this being V1).
Sequentially, absolute ethanol was added until turbidity, followed by centrifugation at 6.440g for 1 h. The precipitate was removed, dissolved in distilled water (1 mL) with pH correction (3 mL NaOH) and added again with a murexide indicator (25 µL). The solution was titrated with EDTA until the turning point (pink to purple), with the volume of EDTA spent corresponding to the volume of bound calcium (V2). The experiments were carried out in triplicate and the values were expressed as means ± standard deviation. Eq. (5) calculated the chelating capacity of calcium ions.
2.11 Antibacterial activity
The antimicrobial activity was performed using the diffusion disc technique according to the Clinical and Laboratory Standards Institute (CLSI, 2012) methodology. The strains of bacteria used for analysis were known to the food industry: Clostridium perfringens (ATCC® 13124™), Escherichia coli (ATCC® 25922™), Listeria Monocytogenes (ATCC® 7644™), Salmonella sp. (ATCC® 13076™) and Staphylococcus aureus (ATCC® 25923™). The bacteria were reactivated in Mueller-Hinton broth and plated on Mueller-Hinton agar. Subsequently they were transferred to saline solution (0.85%) until the concentration of 108 CFU⋅mL−1, equivalent to the turbidity of the McFarland standard solution (bioMérieux Co.) of 0.5 (80% transmittance). Diluted samples (60%, 40%, 20%, 10% and 1% DL - malic acid) were incorporated (20 µL) into the sterile white discs (Laborclin Co.) and deposited on Mueller-Hinton agar (25 mL) solidified and previously inoculated with all the microorganisms (108 CFU⋅mL−1) mentioned above. As a positive control, chloramphenicol 30 µg disks were used (antibiotic sample) and as a negative control, absolute ethanol. The plates were incubated inverted at 37 °C for 24 h. The determination of the microbial growth inhibition was made by measuring the inhibitory halos, in millimeters, with a digital caliper. Statistical comparison was made among samples and antibiotic results.
2.12 Stability of pectin gels
To access the effect of malic acid on pectin gel texture, alleged to be suitable due to its buffering capacity, pectin gels with citric and malic acid were compared. The pectin suspension was prepared adding 1% (w/v) of citrus pectin powder and 1% citric/malic acid in 100 mL of deionized water, followed by 3 h stirring, until complete dissolution. The method was adapted from (Guo et al., 2014). Then the pH was corrected to 3.4 and 16 g of calcium chloride was gradually added into the solution, without further stirring, only a gentle mixing. The rheology was evaluated in a Rheometer (Brookfield Ametek Co.) where the viscoelastic properties were measured by frequency sweep test, over a range of 0.01–10 Hz, during 300 s, with vane spindle VT 80–40 type. The shear stress (Pa) was measured as a function of the frequency (Hz), and expressed in logarithmic scale.
Syneresis of the gels was evaluated according to Demiate and co-workers (Demiate et al., 2001), where the pectin gels were separated into three samples of 25 g and frozen at −18 °C in hermetic plastic bags. The gels were submitted to three freeze–thaw cycles, from the freezer (72 h) to thawing at 40 °C for 1 h. The amount of water released from the gels under reduced pressure (−490 mmHg) was measured gravimetrically and expressed as liberated water (%) related to the initial mass.
2.13 Statistics
The Shapiro-Wilk test (p ≥ 0.05) was applied to verify the normality of the results, in addition to the homoscedasticity that was tested by the Bartlett test. Analysis of variance applied were Kruskal-Wallis for nonparametric data and ANOVA (p ≤ 0.05) for data with confirmed normality. Tukey test accessed the mean difference. T test (p ≤ 0.05) evaluated data in pairs. The results were expressed as mean ± standard deviation. Pearson’s correlation was applied to access the correlation between analysis, exponential and linear fit (Eqs. (6) and (7)) explained the growth profile of antioxidant and chelating results. The software Statistica® 12.5 and Origin® 8.5 performed all tests and graphics.
3 Results and discussion
Except the iron chelating results (p < 0.036), Shapiro-Wilk test accepted the null-hypothesis (p ≥ 0.05) thus the data are normally distributed for all the other parameters.
3.1 Purity, melting behavior and structure of DL – Malic acid
The melting point of DL-malic acid was 129.71 °C, a temperature clearly lower than citric acid (153 °C). This difference is particularly interesting in the production of hard sweets, where the acidic behavior starts acting before within the process, making production faster, and additionally, reducing energy costs as there is no need to reach temperatures close to 150 °C. Moreover, citric acid has stronger acidic taste, and malic acid is known as a smoother taste provider.
Regarding DL-malic acid chemical structure, the X-ray diffractogram of the DL-malic acid sample (Fig. 1c) showed a crystallinity pattern, with intense, narrow and well-defined peaks. The calculated values for the distances between atomic planes, as well as the respective attribution using the Miller indices are shown in Table S1 (see supplementary material). Additionally, in the FTIR spectrum of the malic acid sample (Fig. S1 - see supplementary material), the bands were characteristic of the deformation vibration of the O—H bond, C—H bond, COO– group, since it is a carboxylic acid, in addition to the C⚌O bond (Ganguly et al., 1980; Guan et al., 2007; Ilczyszyn et al., 1995; Lopes and Fascio, 2004; Mohamed et al., 2019; Shao et al., 2017).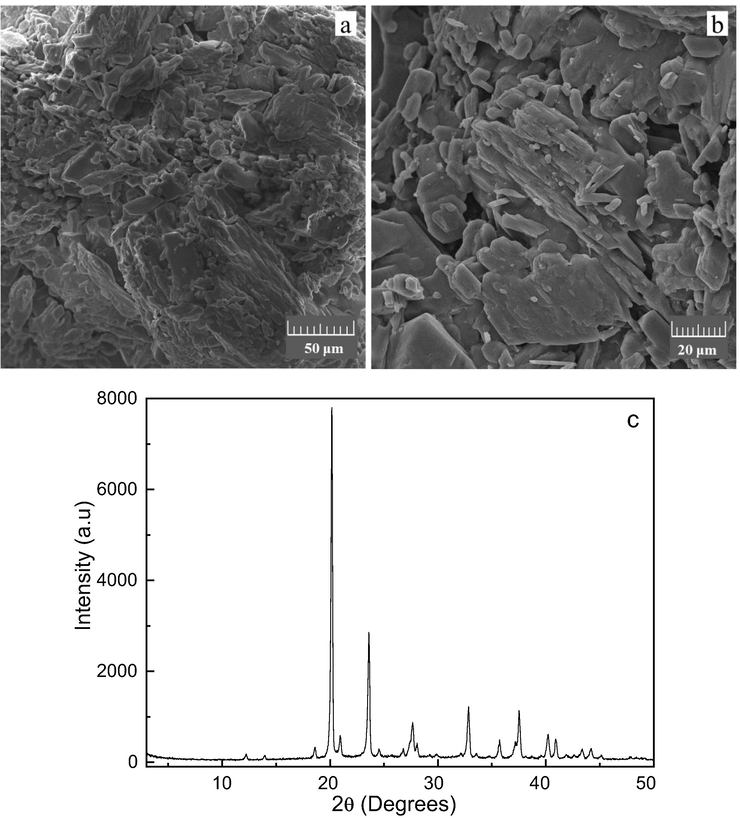
Images obtained by scanning electron microscopy with magnification of 1000× (a) 2000× (b) and X-ray diffractogram of the DL-malic acid (c).
Moreover, the images obtained by electron microscopy scanning (Fig. 1), showed that the sample of DL-malic contains particles with diverse morphologies and without a defined shape, as well as others organic acids such as lactobionic (Cardoso et al., 2019) and even carboxylic acids such as succinic acid (Li et al., 2010). Some particles in the sample showed fillet-shaped morphology and similar results were obtained by Muryanto and co-workers (Muryanto et al., 2014), who applied malic acid as additive in incrustations of calcium carbonate.
When analyzing the EDS spectrum (Fig. S2 – see supplementary material), only carbon and oxygen were detected, with levels of 40.8% and 59.2%, respectively. Such values are consistent with the molecular formula of malic acid (C4H6O5), in which there are more number of oxygen atoms in relation to carbon. The results are consistent with the bands identified in the FTIR spectrum and the data obtained did not show the presence of contaminants, displaying the high purity of the reagent.
3.2 Water parameters: Water activity, hygroscopicity and solubility
The water activity found was 0.586 ± 0.010, typical of solid materials in proper storage. The low water activity are in agreement with the low hygroscopic character conferred to the malic acid (Dai et al., 2018; Iyyappan et al., 2019), facilitating storage for long periods as food ingredient without any caking problems. DL-malic acid presented 8.7 g⋅mol−1 of hygroscopicity, comparable to sorbitol (14 g⋅mol−1), glycolic acid (4 g⋅mol−1) and citric acid (8 g⋅mol−1). Thus, malic acid does not figure as a suitable food ingredient to keep moisture in solid foods. This is related to its chemical structure, formed by three hydroxyl groups and two oxygen able to form hydrogen bonds. Contrary of what occurs to lactobionic acid (LBA), with nine hydroxyls and able to absorb 54 g⋅mol−1 of water.
The low hygroscopic character is an interesting property to the industrial application considering that is not necessary to work with modified atmospheric or in the absence of humidity. This character was properly confirmed through the malic acid sorption isotherm (Fig. 2a), where even in high water activity values (near 1.0) the equilibrium moisture is lower than 0.07 g of water⋅g of sample-1. The moisture isotherm was also fitted by the Halsey model, which depends on two parameters (A = 2.34 and B = 3.38), presenting a correlation coefficient of 0.998.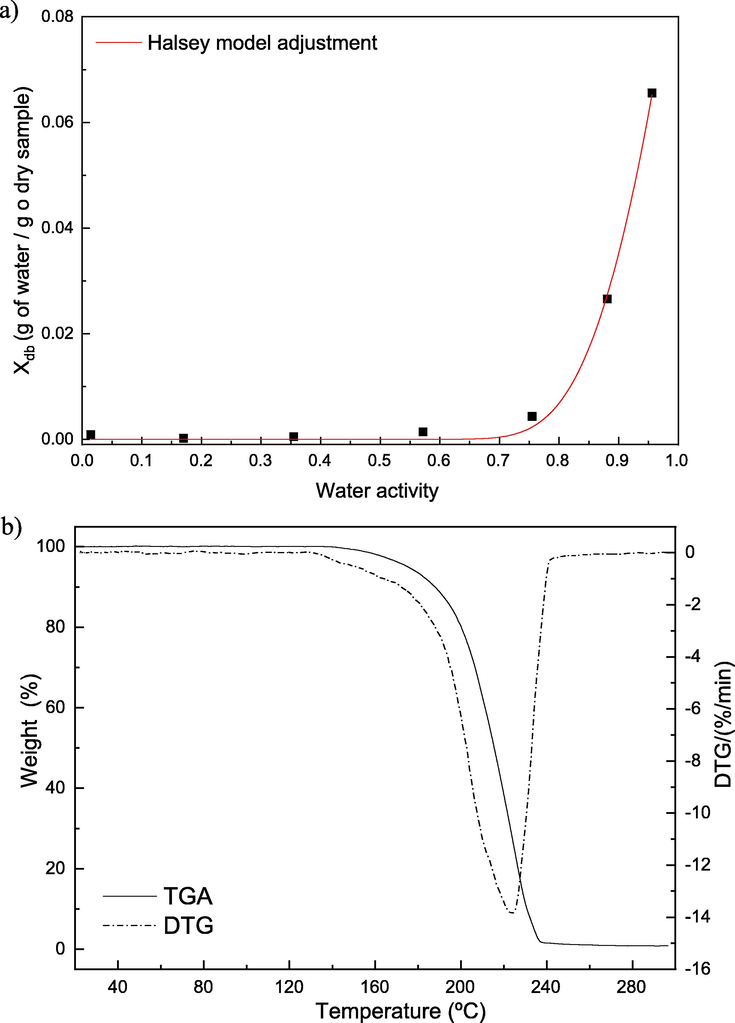
Moisture sorption isotherm of DL-malic acid at 30 °C (a); TGA/DTG curves of DL-malic acid (b).
Furthermore, foods where one desires to keep the crispness and crunchiness malic acid is applicable, as minimally processes fruit and vegetables, extruded cereals, crackers, flakes, baked products and chips. Noting that efficiency of malic acid in food with low moisture is questionable (<12%). Although this is a doubt in any low moisture product, since the lower the humidity, the smaller the amount of water which the preservative acid will solubilize and act in the food. Thus, malic acid, not absorbing much water, helps maintaining texture of food products.
The high solubility of DL-malic acid was confirmed by the test done from 10 °C to 55 °C. At room temperature, it was possible to solubilize 50.11%, or 5.011 g in 10 mL of water (Table 1). This corresponds to 3.73 mol⋅kg−1 of water, superior to citric acid (around 3.13 mol⋅g−1 of water at same temperature). Its high solubility enables several applications in the food industry, especially beverages and drinks.
Temperature (°C)(a)
100w(b)
10
48.12
15
48.84
20
49.85
25
50.11
30
50.71
35
53.28
40
54.03
45
55.14
50
56.39
55
61.49
3.3 Thermogravimetric analysis
The TGA and DTG curves of the malic acid are provided in Fig. 2b, as can be seen, there are no mass loss events in the region of 100 °C, indicating the lack of moisture in the compound. Only one event of mass loss in both curves was easily perceived beginning around 140 °C, which corresponds to the degradation of malic acid. Considering that with continuous heating the weight fraction reaches zero, it is possible to reassure the high purity of the compound and the absence of inorganic contaminants.
The degradation temperature evidenced by the TGA/DTG curves indicates that malic acid has the ability to be applied in several food products, as most of them use unity operations in temperatures below 140 °C. Minimally processed food and refrigerated ones can also benefit from malic acid properties without degradation. Blanched food, via immersion or vapor, would also benefit with a previous step of immersion in malic acid, but the loss by immersion should be investigated.
Considering some food products with processes above 140 °C, according to (Robin and Palzer, 2015) crisp products as extruded cereal achieve 270 °C if used the pallet extrusion, 100 °C if applied the vacuum extrusion and 180 °C with the extrusion-cooking method. In the first case, the temperature applied would degrade the malic acid structure, although 270 °C is the third step of the process and during the first two, 100 °C and 60 °C, the malic acid would assist the conservation of the mixed ingredients, helped by the moisture, which is 30% and 20–22% respectively (Robin and Palzer, 2015).
The fried products with low risk to form acrylamide, using temperatures from 140 to 180 °C, could apply malic acid without loss in mass above 20%. Fried products with superior temperatures, until 210 °C (Haase, 2006), would result in 80% or more of malic acid loss, so its benefit would last until the very moment of frying. Considering starch products, submitted to freezing process, the malic acid would help even in the thawing process, not absorbing much moisture, as well as potatoes ready for frying, contributing with a crisp fried product. Baked products, reaching 180 °C, would be in the temperature range that malic acid loses until 20% of mass. Thus, its benefits could be accounted for too.
3.4 Acidity behavior in solution
The pH values of the aqueous solutions even with low concentration of DL - malic acid (Table 2) reinforce the capacity of this compound to be applied as acidulant for food products (Pereira et al., 2013). The results, beginning with 1.23 until 2.09 with significant difference, showed the ability of malic acid to decrease the pH of aqueous solutions. As food apply around 1% of malic acid, limited to 3.5% by FDA, the results of solution 1% are more important to investigate. Polynt and Brittain (Brittain, 2001; Polynt, 2019) mentioned that malic acid is strong enough in solution to give a high hydrogen ion concentration, and at the same time, weak enough to create an effective buffer solution. The buffering index of malic acid is higher (3.26) than citric acid (2.46) still according to Polynt (Polynt, 2019).
Physicochemical parameters
Solutions of DL – malic acid
60%
40%
20%
10%
1%
pH
1.23a ± 0.03
1.37b ± 0.06
1.55c ± 0.02
1.67d ± 0.01
2.09e ± 0.02
DPPH (uM Trolox eq⋅L-1)
95.42a ± 0.98
86.81b ± 0.59
72.08c ± 0.20
62.22d ± 0.79
47.50e ± 0.79
DPPH (%)
42.97a ± 0.42
39.27b ± 0.25
32.96c ± 0.08
28.72d ± 0.34
22.41e ± 0.34
Iron chelating* (mgEDTA⋅mL−1)
0.18a ± 0.01
0.16ab ± 0.01
0.12ab ± 0.01
0.06ab ± 0.00
0.01b ± 0.00
Iron chelating* (%)
94.13a ± 0.26
84.54ab ± 0.29
61.96ab ± 0.69
56.19ab ± 0.31
8.35b ± 1.63
Calcium chelating (%)
62.50a ± 1.30
34.29b ± 2.45
28.57c ± 1.89
16.22d ± 2.11
15.79e ± 1.13
Antibacterial activity (mm)
Solutions of DL – malic acid
60%
40%
20%
10%
Antibiotic**
E. coli (G-)
14.08b ± 0.11
12.97bc ± 0.45
11.85c ± 0.63
8.62d ± 0.25
28.88a ± 0.48
Salmonella (G-)
17.99b ± 1.51
14.32bc ± 0.59
11.26 cd ± 0.34
8.86d ± 1.36
28.94a ± 1.28
C. perfringens (G+)
17.32b ± 0.66
15.19bc ± 0.67
11.94 cd ± 1.56
8.86d ± 0.29
28.37a ± 1.66
S. aureus (G+)
16.98b ± 0.12
15.45c ± 0.26
11.67d ± 0.02
8.48e ± 0.25
29.86a ± 0.84
L. monocytogenes (G+)
17.58b ± 0.08
14.98c ± 0.14
13.15d ± 0.11
8.91e ± 0.04
28.37a ± 0.95
Malic acid acidity behavior results in complex scientific discussions. It is an example in which lower pH values gave higher ratings of perceived intensity, and acting as buffering as the saliva (Lugaz, 2005), the malic acid has advantages. This characteristic enables the malic acid to act as flavor enhancer, as its flavor lasts more time in the mouth than the flavor of citric acid (Bartek, 2019), in low concentrations. The salts of citric and malic acid, citrates and malates, are known buffers, regulators of tart/sour taste in wine and other beverages. The addition of these acids, forming its salts, have the aim to provide a more rounded flavor to the product, closer to natural ones (Rovira, 2017). Moreover, pectin gel texture is more consistent due to its buffering capacity (Polynt, 2019), property further discussed.
3.5 Antioxidant, chelating and antibacterial activities
The antibacterial activity (Table 2) is justified by antioxidant, chelating (Fig. 3) and pH values. Malic acid did not affect gram-positive and gram-negative bacteria differently, the inhibition zones were similar. The 1% solution did not present visible inhibition zones for any of the bacteria tested. As the percentage of malic acid used in food goes in this range, until around 3.5%, no antibacterial activity would be available. Although, its interaction with other additives could give results within the mentioned range. Pearson’s correlation pointed values > 0.92 for DPPH%/Antimicrobial (mm), >0.96 for Iron chelating%/Antimicrobial (mm) and inferior values > 0.71 for Calcium chelating%/ Antimicrobial (mm). The pair DPPH%/Iron% got 0.93 of correlation and DPPH%/Calcium% the value of 0.89, corroborating the interconnection and highlighting the results of iron chelation.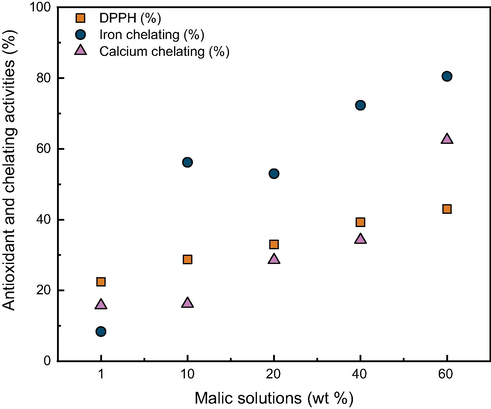
Activity behavior in percentage, of antioxidant and chelating properties of DL-malic acid in solutions from 1% to 60% w/t.
Fig. 3 shows graphically that chelating and antioxidant activities increased with the concentration of malic acid, but not with the same profile. It is also possible to notice that the iron chelating activity stands out after the 10% concentration, and even in the 1% solution, the activities cannot be overlooked. At 1% solution, iron chelation maintained 8.35% of activity and the calcium chelation, 15.79%. From linear and exponential fits, the exponential got higher R2 values. For DPPH (%) the R2 was 0.998 (8), for iron chelating (%) 0.84 (9) and 0.941 (10) for calcium chelating (%) results.
All the inhibition zones obtained by malic acid solutions > 10% differed significantly from the antibiotic (control). According to the CLSI (CLSI, 2012) Salmonella was susceptible to 60% malic acid solution, and intermediate inhibited by 40% solution. S. aureus and E. coli were only intermediate inhibited by 60% and 40% solutions.
The DPPH results showed significant difference among malic acid solutions, and even the 1% solution got > 20% inhibition of DPPH radical (Table 2). Citric acid results were not found for comparison. Even though, citric acid if used in edible oils, as metal chelator and antioxidant, to avoid or delay rancidity (Akaranta and Akaho, 2012). Thus, malic acid could be applied with the same purpose. The low hygroscopicity moreover helps its application in oils.
Malic acid has showed substantial chelating properties, which allows the formation of stable complexes with metals. The chelating activities propitiate the use of malic acid, to chelate metals as iron and calcium, besides the antioxidant action. This property might rescind the cloudiness of wine and juices, caused by iron/calcium salts. A good example of application are the fortified beverages. Two patents mention acid mixtures to fortify beverages, a model drink and a dairy beverage, applying 0.38 to 3.66% of malic acid, respectively (Calapini et al., 2002; Luhadiya et al., 2005). No quantitative results of chelating activity were mentioned. Riri and co-authors mentioned three chelation sites in malic acid structure, corroborating this potential (Riri et al., 2016). Additionally, all these results suggest the possibility to apply malic acid in biofilms.
Cueva et al. (2010) and Mani-López et al. (2012) described the mechanism of organic acids action on bacteria. According to them, the antioxidant activity obstructs the creation of reactive oxygen species and diminishes the redox potential of the culture medium. Worth remembering here that chelating activity is an antioxidant property too. Moreover, organic acids as malic acid accumulate in the cells cytoplasm until toxic levels, interfering and unsettling essential activities, as the cell requires initiation of an active transport of protons to keep homeostasis. Additionally, the low pH of the solutions low internal pH of the bacterial cells and altogether restrict bacterial growth.
Raybaudi-Massilia and authors (Raybaudi-Massilia et al., 2009) evidenced that 2.5% malic acid solution with calcium lactate reduced 5 log CFU⋅g−1 of E. coli and Listeria growth. Thus, it is important to analyze the interaction effect malic acid/other ingredients/food matrix.
3.6 Stability of pectin gels
The pectin gel acidified with malic acid showed higher shear stress at the end of 300 s (Fig. 4a), indicating more elastic and viscous characteristics than citric acid pectin gel. This confirms the alleged property of malic acid stabilizing pectin gels better than the most used organic acid. As the pH is the same for both gels, set at 3.4, probably the buffering capacity of malic acid is responsible for this difference of resistance, as no sugar was used in this formulation of gel. This buffering capacity possibly maintained the pH set stable during the addition of calcium chloride, providing a superior linkage among the chemical structures involved. In this case the hydrophobic interactions between ester groups and hydrogen bonding between hydroxyl groups, which are believed to be the interactions in the HM pectin (Williams et al., 2005), were improved by malic acid addition and its buffer capacity.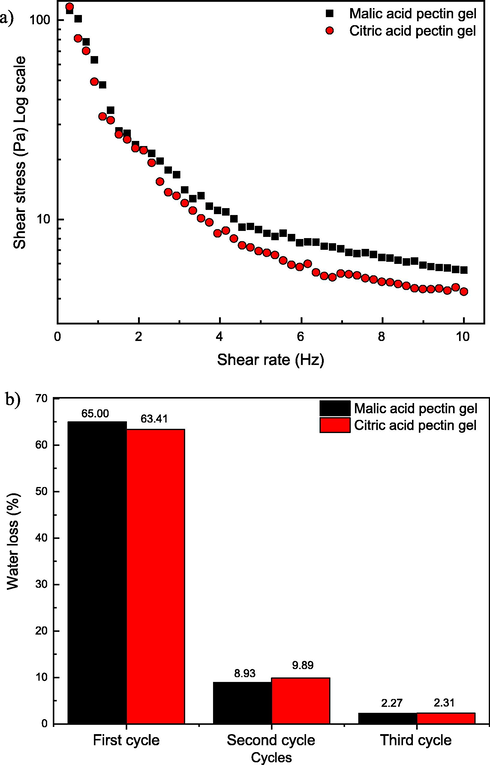
Frequency (1 s−1) dependence of shear stress (Pa) pectin gels with malic and citric acids (a); Syneresis of pectin gels with malic acid and citric acid during three cycles of freezing and thawing (b).
Malic acid pectin gel presented stronger cross-linked network structure, harder to spin the probe after 5 min. Despite the higher initial shear stress of citric acid gel (117 Pa against 112 Pa of malic acid gel), after the total time, the same parameter got citric acid gel = 4.3 Pa against malic acid gel = 5.6 Pa. The table with shear stress and viscosity values is in the supplementary material.
The syneresis of the gels with malic acid and citric acid during three cycles of freezing and thawing, showed no significant difference between samples in any of the cycles. Test t pointed p-values p = 0.44 in the first cycle, p = 0.51 in the second cycle and p = 0.93 in the third and last cycle. This corroborates the potential of substitution of citric acid for malic acid in food processes.
The total amount of water lost may be considered high (>70%) (Fig. 4b), although the aim here was to evaluate the behavior of the acids, comparing them. Other pectin gels, with different components may generate stronger gels, with inferior water loss. Yoo and co-workers (Yoo et al., 2009) found 38.6% of syneresis in pectin gels of Valencia orange pectin methylesterase (p-PME), using only one 72 h-cycle.
According to Yoo and authors (Yoo et al., 2009) HM-pectin gels are being employed in the stabilization of casein in acidic dairy beverages. Moreover, it is known for its application as gelling agent for jams and jellies, confectionary products, bakery fillings and stabilizer of fruit juices. All these possibilities have great potential if combined with malic acid.
4 Conclusions
Malic acid has enhanced chemical-bioactive properties, and yet, it is not the most used organic acid in the food industry. The present findings emphasized DL-malic acid potential in food processes, to be applied in a wider variety of products so far explored with it. Frozen, refrigerated food items and biofilms are other possible applications due to altogether properties found and quantified. A biofilm or food product with antioxidant, chelating and slight antimicrobial properties, containing an acidifier with low hygroscopicity and texturizer characteristics, is highly desirable. To scale up the malic acid production, maybe the current obtaining should be supported by the biotech method, investing in the microbial production. Thus, a fair competition could be established with citric acid, as the limiting factor of malic acid application these days, is the popularity and availability of citric acid, well established in so many products and process presently.
Malic acid showed chelating properties, which allows the formation of stable complexes with heavy metals as iron and calcium. In view of this property, malic acid can replace citric acid in processing and refining of edible oils as well as in protection against food deterioration and possible food enrichment. The thermal behavior further showed wide possibilities of malic acid application in the food industry, as the degradation begins after 140 °C. The low hygroscopicity of the malic acid is a desirable characteristic for crisp products, and products with low moisture (possibly even in the < 12% moisture mentioned). The high solubility and low melting point, enables its use in beverages and hard candies. In addition, the alleged property of stabilization of pectin gels was quantified, similarly useful to soft candies and jams, stating a harder gel with malic acid, with less syneresis after 3 cycles of freezing and thawing, than with citric acid.
Funding
This work was supported by the Conselho Nacional de Desenvolvimento Científico e Tecnológico (CNPq – Brazil) and financed in part by the Coordenação de Aperfeiçoamento de Pessoal de Nível Superior (CAPES – Brazil) - Finance Code 001. The authors thank both CAPES and CNPq for the financial support and the Federal University of Paraná (UFPR) for the technical support provided. F. O. Farias acknowledges CAPES and Fundação Araucária for the post-doctoral fellowship (88887.354435/2019-00).
CRediT authorship contribution statement
Caroline Marques: Conceptualization, Methodology, Formal analysis, Investigation, Data curation, Writing - original draft, Writing - review & editing. Anne Raquel Sotiles: Investigation, Methodology, Formal analysis, Data curation, Writing - review & editing. Fabiane Oliveira Farias: Investigation, Methodology, Formal analysis, Data curation, Writing - review & editing. Grazielle Oliveira: Investigation, Methodology, Formal analysis, Data curation, Writing - review & editing. Marina Leite Mitterer-Daltoé: Writing - review & editing. Maria Lucia Masson: Supervision, Funding acquisition.
Declaration of Competing Interest
The authors declare that they have no known competing financial interests or personal relationships that could have appeared to influence the work reported in this paper.
References
- Antioxidant and radical scavenging properties of curcumin. Chem. Biol. Interact.. 2008;174:27-37.
- [CrossRef] [Google Scholar]
- Synergic Effect of Citric Acid and Peanut Skin Extract on the Oxidative Stability of Vegetable Oil. J. Appl. Sci. Environ. Manage. 2012;16:345-351.
- [Google Scholar]
- Antioxidant property and α-amylase and lipase inhibiting activities of Flacourtia inermis fruits: characterization of malic acid as an inhibitor of the enzymes. J. Food Sci. Technol.. 2015;52:8383-8388.
- [CrossRef] [Google Scholar]
- AOAC, 2005. Official Methods of Analysis of the Association of Analytical Chemists International, 18th ed. Official Methods, Gathersburg.
- Bakerpedia, 2020. Malic acid. Bakerpedia. URL https://bakerpedia.com/ingredients/malic-acid/ (accessed 1.21.20).
- Bartek, 2019. The Advantage of Using Bartek Malic Acid with High Intensity Sweeteners in Beverages.
- Batt C.A., Tortorello M.L., eds. Encyclopedia of food microbiology (2. ed.). Amsterdam: AP, Academic Press/Elsevier; 2014.
- Polysaccharides/Halloysite nanotubes for smart bionanocomposite materials. Carbohydrate Polymers. 2020;245
- [CrossRef] [Google Scholar]
- Use of a free radical method to evaluate antioxidant activity. LWT - Food Sci. Technol.. 1995;28:25-30.
- [CrossRef] [Google Scholar]
- BRASIL, 2010, 2010. Resolução da Diretoria Colegiada – RDC n. 45, de 03 de novembro de 2010. Dispõe sobre aditivos alimentares autorizados para uso segundo as Boas Práticas de Fabricação (BPF).
- Brittain, H.G., 2001. Malic Acid, in: Analytical Profiles of Drug Substances and Excipients. Elsevier, pp. 153–195. https://doi.org/10.1016/S1075-6280(01)28005-7
- Calapini, S., Valencia, D., Dee, K., 2002. Calcium fortified acidic beverages. US20040101597A1.
- Characterization of lactobionic acid evidencing its potential for food industry application. J. Food Process. Eng.. 2019;42
- [CrossRef] [Google Scholar]
- Pickering Emulsion Gels Based on Halloysite Nanotubes and Ionic Biopolymers: Properties and Cleaning Action on Marble Surface. ACS Appl. Nano Mater.. 2019;2:3169-3176.
- [CrossRef] [Google Scholar]
- Ceolin, R., Szwarc, H., Lepage, F., 1990. On the dimorphism of DL-Malic acid 6.
- CLSI, 2012. Performance Standards for Antimicrobial Disk Susceptibility Tests, Approved Standard, 7th ed., CLSI document M02-A11. In: Clinical and Laboratory Standards Institute. 950 West Valley Road, Suite 2500, Wayne, Pennsylvania 19087, USA.
- Antimicrobial activity of phenolic acids against commensal, probiotic and pathogenic bacteria. Res. Microbiol.. 2010;161:372-382.
- [CrossRef] [Google Scholar]
- Current advance in biological production of malic acid using wild type and metabolic engineered strains. Bioresource Technol.. 2018;258:345-353.
- [CrossRef] [Google Scholar]
- Characterization of chestnut (Castanea sativa, mill) starch for industrial utilization. Braz. Arch. Biol. Technol.. 2001;44:69-78.
- [CrossRef] [Google Scholar]
- European Food Safety Authority, 2014. Scientific Opinion on the safety and efficacy of malic acid and a mixture of sodium and calcium malate when used as technological additives for all animal species (Panel on Additives and Products or Substances used in Animal Feed). European Food Safety Authority.
- FDA, 2019. Title 21-Food And Drugs. Chapter I-Food And Drug Administration. Department Of Health And Human Services. Subchapter B-Food For Human Consumption (Continued). Part 184 - Direct Food Substances Affirmed As Generally Recognized As Safe (GRAS). Subpart B-Listing of Specific Substances Affirmed as GRAS. Sec. 184.1069 Malic acid.
- Phase transition in malonic acid: An infrared study. Chem. Phys. Lett.. 1980;69:227-229.
- [CrossRef] [Google Scholar]
- Guan, X., Chen, G., Shang, C., 2007. ATR-FTIR and XPS study on the structure of complexes formed upon the adsorption of simple organic acids on aluminum hydroxide. J. Environ. Sci. 19, 438–443. https://doi.org/10.1016/S1001-0742(07)60073-4.
- Characteristics of Two Calcium Pectinates Prepared from Citrus Pectin Using Either Calcium Chloride or Calcium Hydroxide. J. Agric. Food Chem.. 2014;62:6354-6361.
- [CrossRef] [Google Scholar]
- Haase, N.U., 2006. The formation of acrylamide in potato products, in: Acrylamide and Other Hazardous Compounds in Heat-Treated Foods. Elsevier, pp. 41–59. https://doi.org/10.1533/9781845692018.1.41.
- Physical adsorption on uniform surfaces. Journal of Chemical Physics. 1985;16:931-937.
- [Google Scholar]
- Handbook of food science, technology, and engineering. Boca Raton, FL: CRC Press; 2005.
- Structure and polarized infrared and Raman spectra of the solid complex of betaine and maleic acid (1:1) J. Mol. Struct. Theochem.. 1995;372:9-27.
- [CrossRef] [Google Scholar]
- Process optimization and kinetic analysis of malic acid production from crude glycerol using Aspergillus niger. Bioresour. Technol.. 2019;281:18-25.
- [CrossRef] [Google Scholar]
- Keykhosravi, K., Jebelli Javan, A., Parsaiemehr, M., 2016. Effect of malic acid on bioactive components and antioxidant properties of sliced button mushroom (Agaricus bisporus) during storage. Iran. J. Vet. Med. 9. https://doi.org/10.22059/ijvm.2016.56329.
- Emerging trends in pectin extraction and its anti-microbial functionalization using natural bioactives for application in food packaging. Trends Food Sci. Technol.. 2020;105:223-237.
- [CrossRef] [Google Scholar]
- Structural and Physicochemical Characteristics of Granular Malic Acid-Treated Sweet Potato Starch Containing Heat-Stable Resistant Starch. J. Chem.. 2019;2019:1-10.
- [CrossRef] [Google Scholar]
- Structural Characteristics and In Vitro Digestibility of Malic Acid-Treated Corn Starch with Different pH Conditions. Molecules. 2019;24:1900.
- [CrossRef] [Google Scholar]
- One step recovery of succinic acid from fermentation broths by crystallization. Sep. Purif. Technol.. 2010;72:294-300.
- [CrossRef] [Google Scholar]
- Esquema para interpretação de espectros de substâncias orgânicas na região do infravermelho. Quím. Nova. 2004;27:670-673.
- [CrossRef] [Google Scholar]
- Time-Intensity Evaluation of Acid Taste in Subjects with Saliva High Flow and Low Flow Rates for Acids of Various Chemical Properties. Chem. Senses. 2005;30:89-103.
- [CrossRef] [Google Scholar]
- Luhadiya, A.P., Yang, D., Heisey, M., 2005. Calcium fortified beverages. US20050025861A1.
- Organic acids as antimicrobials to control Salmonella in meat and poultry products. Food Res. Int.. 2012;45:713-721.
- [CrossRef] [Google Scholar]
- Miller, N.J., Rice-Evans, C., Davies, M.J., Gopinathan, V., Milner, A., 1993. A novel method for measuring antioxidant capacity and its application to monitoring the antioxidant status in premature neonates. Clin. Sci. Lond. Engl. 1979 84, 407–412.
- Growth and characterization of L-histidinium fumarate fumaric acid monohydrate single crystal: A promising second and third order nonlinear optical material. Chin. J. Phys.. 2019;60:581-597.
- [CrossRef] [Google Scholar]
- Equilibrium isotherms of chitin: heat of desorption determination. Braz. J. Food Technol.. 2007;10:212-219.
- [Google Scholar]
- Muryanto, S., Bayuseno, A.P., Ma’mun, H., Usamah, M., Jotho, 2014. Calcium Carbonate Scale Formation in Pipes: Effect of Flow Rates, Temperature, and Malic Acid as Additives on the Mass and Morphology of the Scale. Procedia Chem. 9, 69–76. https://doi.org/10.1016/j.proche.2014.05.009.
- Nadeau, D.B., Clydesdale, F.M., 1986. Effect of acid pretreatment on the stability of citric and malic acid complexes with various iron sources in a wheat flake cereal. J. Food Biochem. 10, 241–257. https://doi.org/10.1111/j.1745-4514.1986.tb00103.x.
- Use of UFLC-PDA for the Analysis of Organic Acids in Thirty-Five Species of Food and Medicinal Plants. Food Anal. Methods. 2013;6:1337-1344.
- [CrossRef] [Google Scholar]
- Control of pathogenic and spoilage microorganisms from cheese surface by whey protein films containing malic acid, nisin and natamycin. Food Control. 2010;21:240-246.
- [CrossRef] [Google Scholar]
- Polynt, 2019. Malic Acid - Technical report.
- Rathore, D.P.S., Bhargava, P.K., Kumar, M., Talra, R.K., 1993. Indicator for the titrimetric determination of calcium and total calcium plus magnesium with ethylenediaminetetraacetate in water. Anal. Chim. Acta. https://doi.org/10.1016/0003-2670(93)85351-J.
- Raybaudi-Massilia, R.M., Mosqueda-Melgar, J., Sobrino-López, A., Soliva-Fortuny, R., Martín-Belloso, O., 2009. Use of malic acid and other quality stabilizing compounds to assure the safety of fresh-cut “Fuji” apples by inactivation of Listeria monocytogenes, Salmonella enteritidis and Escherichia coli O157:H7. J. Food Saf. 29, 236–252. https://doi.org/10.1111/j.1745-4565.2009.00153.x.
- Research and markets, 2019. Malic Acid Market Size, Share & Trends Analysis Report By End Use (Beverages, Confectionery & Food, Personal Care & Cosmetics), By Region, And Segment Forecasts, 2019 - 2025. Allied Mark. Res. URL https://www.researchandmarkets.com/reports/3934200/malic-acid-market-size-share-and-trends-analysis#rela2-4752320 (accessed 1.17.20).
- Complexation of trivalent lanthanide cations by different chelation sites of malic and tartric acid (composition, stability and probable structure) Arab. J. Chem.. 2016;9:S1478-S1486.
- [CrossRef] [Google Scholar]
- Robin, F., Palzer, S., 2015. Texture of breakfast cereals and extruded products, in: Modifying Food Texture. Elsevier, pp. 203–235. https://doi.org/10.1016/B978-1-78242-333-1.00010-3.
- Rovira, D.A., 2017. Dictionary of flavors, Third edition. ed. Wiley Blackwell, Chichester, West Sussex ; Hoboken, NJ.
- Rufino, M. do S.M., Alves, R.E., de Brito, E.S., Pérez-Jiménez, J., Saura-Calixto, F., Mancini-Filho, J., 2010. Bioactive compounds and antioxidant capacities of 18 non-traditional tropical fruits from Brazil. Food Chem. https://doi.org/10.1016/j.foodchem.2010.01.037.
- Vacuum FTIR observation on hygroscopic properties and phase transition of malonic acid aerosols. Chem. Phys.. 2017;483-484:7-11.
- [CrossRef] [Google Scholar]
- Theron, M.M., Lues, J.F.R., 2010. Organic Acids and Food Preservation, 0 ed. CRC Press. https://doi.org/10.1201/9781420078435.
- Malic Acid in Wine: Origin, Function and Metabolism during Vinification. South Afr. J. Enol. Vitic.. 2017;27
- [CrossRef] [Google Scholar]
- Wang, Libin, Ma, M., Zhang, Y., Wu, Z., Guo, L., Luo, W., Wang, Li, Zhang, Z., Zhang, S., 2018. Characterization of the Genes Involved in Malic Acid Metabolism from Pear Fruit and Their Expression Profile after Postharvest 1-MCP/Ethrel Treatment. J. Agric. Food Chem. 66, 8772–8782. https://doi.org/10.1021/acs.jafc.8b02598.
- Elucidation of the Emulsification Properties of Sugar Beet Pectin. J. Agric. Food Chem.. 2005;53:3592-3597.
- [CrossRef] [Google Scholar]
- Wusigale, Liang, L., Luo, Y., 2020. Casein and pectin: Structures, interactions, and applications. Trends Food Sci. Technol. 97, 391–403. https://doi.org/10.1016/j.tifs.2020.01.027.
- Characteristics of enzymatically-deesterified pectin gels produced in the presence of monovalent ionic salts. Food Hydrocolloids. 2009;23(7):1926-1929.
- [CrossRef] [Google Scholar]
Appendix A
Supplementary data
Supplementary data to this article can be found online at https://doi.org/10.1016/j.arabjc.2020.10.036.
Appendix A
Supplementary data
The following are the Supplementary data to this article:
Supplementary video 1
Supplementary video 1


