

Translate this page into:
Functionalization of sodium magnesium silicate hydroxide/sodium magnesium silicate hydrate nanostructures by chitosan as a novel nanocomposite for efficient removal of methylene blue and crystal violet dyes from aqueous media
⁎Corresponding author. hakatouah@uqu.edu.sa (Hanadi A. Katouah)
-
Received: ,
Accepted: ,
This article was originally published by Elsevier and was migrated to Scientific Scholar after the change of Publisher.
Peer review under responsibility of King Saud University.
Abstract
Herein, sodium magnesium silicate hydroxide/sodium magnesium silicate hydrate nanostructures were facilely synthesized using the hydrothermal method. After that, the synthesized nanostructures were modified by chitosan as a novel nanocomposite for the efficient removal of the methylene blue and crystal violet dyes from aqueous media. The synthesized nanostructures and their chitosan composite were characterized using several tools such as XRD, FT-IR, EDX, CHN, and SEM. The functionalization of nanostructures with chitosan led to the appearance of chitosan XRD peaks at 2 = 8.9° and 21° whereas the intensities of the other XRD peaks were affected. The SEM analysis showed that the nanostructures consist of spheres and irregular shapes. Also, the nanocomposite consists of cotton and large irregular shapes due to the functionalization of the synthesized nanostructures with chitosan. Also, the EDX analysis confirmed that the nanocomposite consists of Si, Mg, Na, O, C, and N with weight percentages equal to 7.24%, 5.73%, 10.59%, 30.99%, 43.25%, and 2.20%, respectively. The CHN elemental analysis confirmed that the nanocomposite contained C, H, and N with weight percentages equal to 53.28%, 4.32%, and 1.92%, respectively. Hence, pH = 8, time = 50 min, and temperature = 298 K are the ideal values that achieves the maximum removal of the examined dyes. The maximum adsorption capacity of the nanostructures and nanocomposite toward the methylene blue dye is 19.07 and 20.25 mg/g, respectively. Also, the maximum adsorption capacity of the nanostructures and nanocomposite toward the crystal violet dye is 18.62 and 23.51 mg/g, respectively. The adsorption processes are chemical and exothermic. Besides, the adsorption processes followed the pseudo-second-order kinetic model and the Langmuir isotherm.
Keywords
Nanostructures
Adsorption
Chitosan
Methylene blue dye
Crystal violet dye

1 Introduction
According to the literature, 10–15% of the organic dyes used in human activities (often in the textile industry) can be released into the environment (Elgarahy et al., 2021; Oladoye et al., 2022). Due to the improper managing with these organic dyes and their discharge into the environment, there are severe pollution risks primarily associated with the retrogression of water quality, and hence endangering the health of the exposed population (Qiu et al., 2017; Sankar Sana et al., 2022). Based on their chemical structures, dyes can generally be divided into three categories: nonionic, cationic, and anionic (Konicki et al., 2015). Organic cationic dyes, such as crystal violet (CV) and methylene blue (MB), are considered to be more harmful than anionic ones (Adel et al., 2021; Fetimi et al., 2021; Karaman et al., 2022; Karimi-Maleh et al., 2023). The removal of MB and CV dyes then becomes a major area of study. Various techniques, including coagulation/flocculation, oxidation/ozone, membrane separation, photodegradation, adsorption, and biological processes, can be utilized to eliminate these toxic dyes and provide environmental protection (Abdelrahman et al., 2019b; Arif Ullah et al., 2023; El-Aassar et al., 2022; Hotan Alsohaimi et al., 2023; Mahmoud et al., 2019; Wang et al., 2022; Wasim et al., 2022). Diverse studies have concluded that most of these elimination techniques are insufficient for achieving a simple and effective treatment of dye-polluted water. In another sense, they may also be costly. To obtain treated water with the appropriate quality for human consumption and to protect the environment, it is necessary to employ an efficient and dependable removal technique. Due to its numerous benefits, including high removal efficiency and relatively low operating costs, the adsorption technique has been deemed a competitive removal method (Abdelrahman, 2018; Abdelrahman et al., 2019a). There are a lot of adsorbents for removing methylene blue and crystal violet dyes such as vilvam fruit shell carbon, zirconium silicate/SDS nanocomposite, carboxymethyl cellulose/ZSM-5/ZIF-8, magnetic cellulose beads, alginate grafted polyacrylonitrile beads, carboxymethyl cellulose/k-carrageenan/activated montmorillonite, alginate-grafted-poly (methyl methacrylate), and magnetic NaY zeolite (Liu et al., 2018; Luo and Zhang, 2009; Mahmoud et al., 2019; Marsiezade and Javanbakht, 2020; Priya et al., 2014; Salisu et al., 2015b, 2015a; Shirani et al., 2014). However, the majority of these adsorbents are prepared from expensive chemicals. Finding novel low-cost adsorbents with a high affinity for dye molecules is a necessary and urgent objective. So, in this work, sodium magnesium silicate hydroxide/ sodium magnesium silicate hydrate nanostructures were facilely synthesized then modified by chitosan as a novel nanocomposite. The synthesized nanocomposite was utilized for the efficient removal of methylene blue and crystal violet dyes from aqueous media. Effects of pH, time, temperature, and concentrations were studied. The novelty of the work is due to the following reasons;
1: In the crystal lattice of the sodium magnesium silicate hydroxide/sodium magnesium silicate hydrate nanostructures, some Si(IV) ions is replaced by some Mg(II) ions and hence a negative charge is produced and neutralized by sodium ions. After that, the sodium ions can easily be replaced by cationic molecules such as methylene blue and crystal violet dyes.
2: The functionalization of the synthesized nanostructures with chitosan makes the nanocomposite can remove the cationic dyes (i.e., methylene blue and crystal violet dyes) via chemical electrostatic attraction between dyes and functional groups (i.e., NH2 and OH) of the nanocomposite in basic medium.
2 Experimental
2.1 Chemicals
Crystal violet dye (C25H30ClN3), methylene blue dye (C16H18N3SCl), hydrochloric acid (HCl), sodium metasilicate pentahydrate (Na2SiO3·5H2O), sodium hydroxide (NaOH), and magnesium chloride hexahydrate (MgCl2·6H2O) were gotten from Sigma Aldrich Company and utilized without additional chemical refining. Also, chitosan was supplied via ROTH company, Germany.
2.2 Synthesis
2.2.1 Synthesis of sodium magnesium silicate hydroxide/ sodium magnesium silicate hydrate nanostructures
12 g of Na2SiO3·5H2O were dissolved in about 50 mL of distilled water. 3 g of MgCl2·6H2O were dissolved in about 30 mL of distilled water. Using a pipette, the magnesium solution was added to the silicon solution drop by drop with continuous stirring for an hour. After that, the produced white gel was charged into a 100 mL Teflon-lined stainless-steel autoclave then the autoclave was placed inside a drying furnace at 150 °C for 12 h. Furthermore, the formed nanostructures were filtered, washed with hot distilled water, dried at 60 °C, and encoded as H1.
2.2.2 Synthesis of chitosan nanocomposite
125 mL of an acetic acid solution (5% V/V) was added to 2 g of chitosan and 2 g of the synthesized nanostructures then the mixture was stirred for 5 h. After that, the mixture is added partially wise to 250 mL of 0.65 M of NaOH with continuous stirring for 5 h. Furthermore, the formed nanocomposite was filtered, washed with hot distilled water, dried at 60 °C, and encoded as H1Ch.
2.3 Instrumentation
X-ray diffraction analyses of the H1 and H1Ch samples were carried out using a D8 Advance X-ray diffractometer (Billerica, Massachusetts, United States). Infrared analyses of the H1 and H1Ch samples were carried out using a Nicolet 6700 FT-IR spectrometer (Waltham, Massachusetts, United States). A JSM 6490 LV scanning electron microscope (Akishima, Tokyo, Japan) attached with an energy dispersive X-ray unit was employed to investigate the morphological structures and elemental compositions of the H1 and H1Ch samples. The concentrations of methylene blue and crystal violet dyes were determined using a Shimadzu 1800 UV–Vis spectrophotometer (Colmworth, United Kingdom). The maximum wavelengths of the methylene blue and crystal violet dyes are 663 and 590 nm, respectively. The percentages of carbon (C), hydrogen (H), and nitrogen (N) of the H1Ch nanocomposite were determined using a 2400 PerkinElmer CHN Elemental analyzer (Waltham, United States).
2.4 Removal of methylene blue and crystal violet dye from aqueous media
0.1 g of the adsorbent (H1 or H1Ch) was added to 50 mL of 40 mg/L dye solution (methylene blue or crystal violet). The pH of the mixture was adjusted to the desired value using 0.1 M HCl or NaOH. The mixture was magnetically stirred at the desired time. The adsorbent was centrifuged then the concentration of methylene blue or crystal violet dyes was measured by a Shimadzu 1800 UV–Vis spectrophotometer. Several factors affecting the adsorption process have been studied such as pH (2–8), time (10–80 min), temperature (298–328 K), and concentration (20–60 mg/L). The % removal (% R) of the studied dyes and the adsorption capacity (Q) of the H1 or H1Ch adsorbents were determined using Eqs. (1) and (2), respectively.
3 Results and discussion
3.1 Characterization of the synthesized samples
3.1.1 X-ray diffraction
Fig. 1. A-B represents the XRD patterns of the H1 and H1Ch samples, respectively. The results confirmed that the H1 sample consists of two phases, namely sodium magnesium silicate hydroxide (Chemical formula: Na(NaMg)Mg5(Si8O22(OH)2) and JCPDS No. 01–073-2764) and sodium magnesium silicate hydrate (Chemical formula: Na2Mg3Si6O16·8H2O and JCPDS No. 00–013-0310). The average crystallite size of the H1 sample is 90.27 nm. The observed peaks at 2
= 6.71° and 20.80° are due to the sodium magnesium silicate hydrate. Also, the observed peaks at 2
= 19.17°, 28.69°, 36.61°, 53.11°, 55.49°, and 60.47° are due to the (3 2 1), (2 1 1), (3 1 1), ( −1 2 3), (4 6 1), and ( −5 7 1) miller indices of the sodium magnesium silicate hydroxide, respectively. After the union of nanostructures with chitosan, as suggested in scheme 1, the characteristic peaks of chitosan at 2
= 8.9° and 21° appeared very clearly, whereas the intensity of the other peaks was affected. These observations are consistent with other inorganic/organic nanocomposites prepared in similar ways as reported by Al-Wasidi et al. (Al-Wasidi et al., 2022a) (Al-Wasidi et al., 2022b) and Abdelrahman et al. (Abdelrahman and Hegazey, 2019a, 2019b).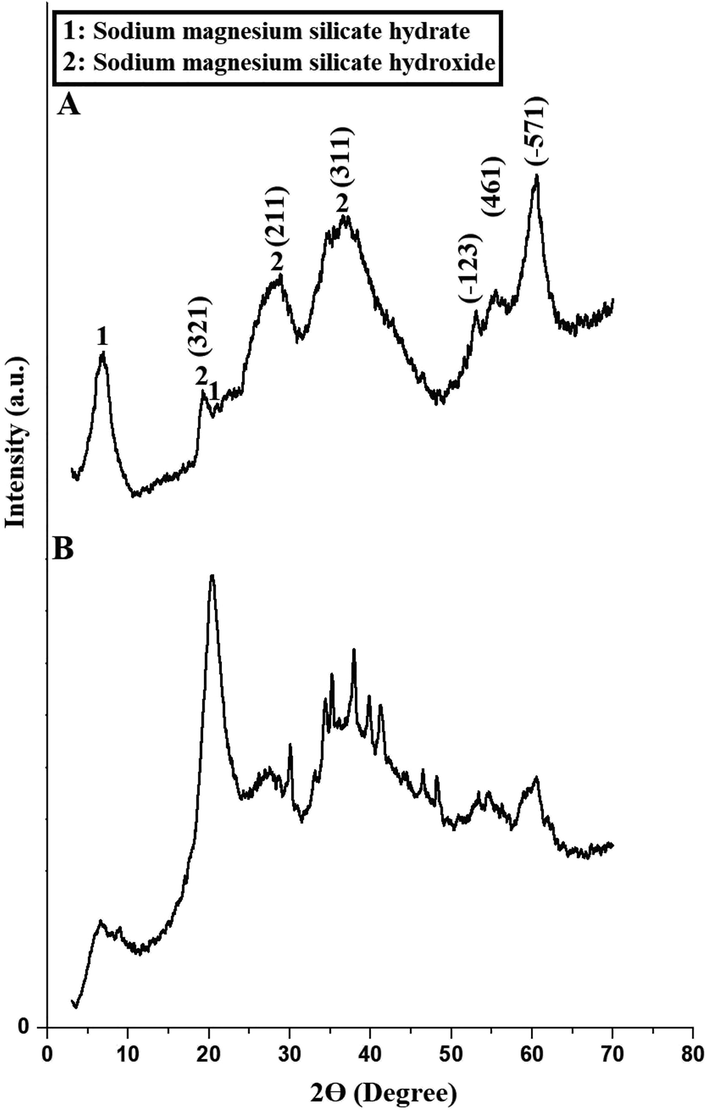
The XRD patterns of the H1 (A) and H1Ch (B) samples.
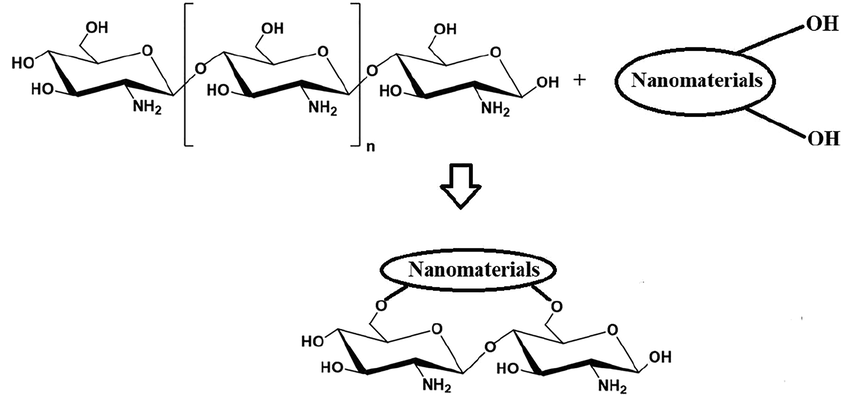
Synthesis of chitosan nanocomposite.
3.1.2 EDX and CHN analyses
Fig. 2. A-B represents the EDX patterns of the H1 and H1Ch samples, respectively. The results confirmed that the H1 sample consists of Si, Mg, Na, and O with weight percentages equal to 41.5 0%, 16.33%, 5.59%, and 36.58%, respectively. Also, the H1Ch sample consists of Si, Mg, Na, O, C, and N with weight percentages equal to 7.24%, 5.73%, 10.59%, 30.99%, 43.25%, and 2.20%, respectively. The low percentage of silicon and the appearance of nitrogen and carbon in the H1Ch sample are the results of the association of chitosan with the synthesized nanostructures. Due to the functionalization of the nanostructures with chitosan, the CHN elemental analysis confirmed that the H1Ch sample contained C, H, and N with weight percentages equal to 53.28%, 4.32%, and 1.92%, respectively. These observations are consistent with other inorganic/organic nanocomposites prepared in similar ways as reported by Al-Wasidi et al. (Al-Wasidi et al., 2022a) (Al-Wasidi et al., 2022b) and Abdelrahman et al. (Abdelrahman and Hegazey, 2019a, 2019b).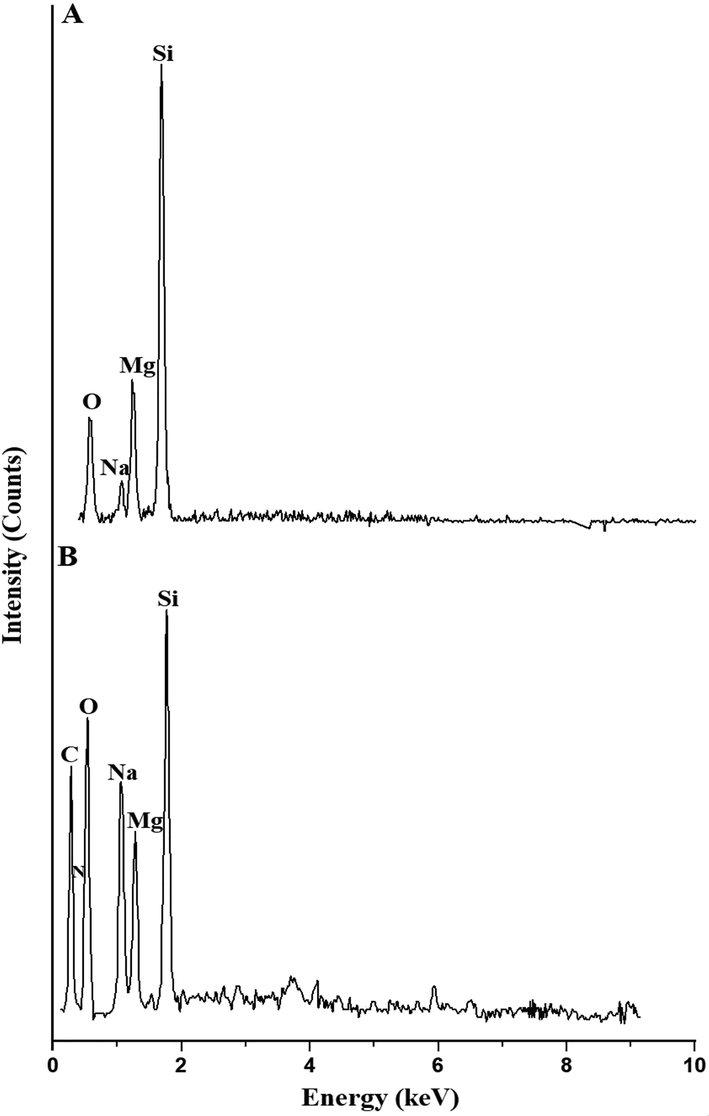
The edx patterns of the h1 (a) and h1ch (b) samples.
3.1.3 FT-IR
Fig. 3. A-B represents the FT-IR spectra of the H1 and H1Ch samples, respectively. The results confirmed that the bands, which appeared at 454 and 662 cm−1 in the H1 and H1Ch samples, are due to the bending and internal symmetric stretching vibrations of L-O-L (L = Si and/or Mg), respectively. The bands, which appeared at 736 and 737 cm−1 in the H1 and H1Ch samples, are due to the external symmetric stretching of L-O-L, respectively. The bands, which appeared at 1011 and 1016 cm−1 in the H1 and H1Ch samples, are due to the internal asymmetric vibrations of L-O-L, respectively. The bands, which appeared at 1404 and 1417 cm−1 in the H1 and H1Ch samples, are due to the external asymmetric vibrations of L-O-L, respectively. The bands, which appeared at 1648 and 1573 cm−1 in the H1 and H1Ch samples, are due to the bending vibrations of O–H, respectively. The band, which appeared at 1653 cm−1 in the H1Ch sample, is due to bending vibration of NH2. The bands, which appeared at 3471 and 3423 cm−1 in the H1 and H1Ch samples, are due to the stretching vibrations of O–H and/or NH2, respectively. The bands, which appeared at 1252 and 2914 cm−1 in the H1Ch sample, are due to the stretching vibrations of C-N and C–H, respectively. The bands, which appeared at 1063 and 1153 cm−1 in the H1Ch sample, are due to the stretching vibration of C-O (Abdelrahman and Hegazey, 2019a; Khalifa et al., 2020). These observations are consistent with other inorganic/organic nanocomposites prepared in similar ways as reported by Al-Wasidi et al. (Al-Wasidi et al., 2022a) (Al-Wasidi et al., 2022b) and Abdelrahman et al. (Abdelrahman and Hegazey, 2019a, 2019b).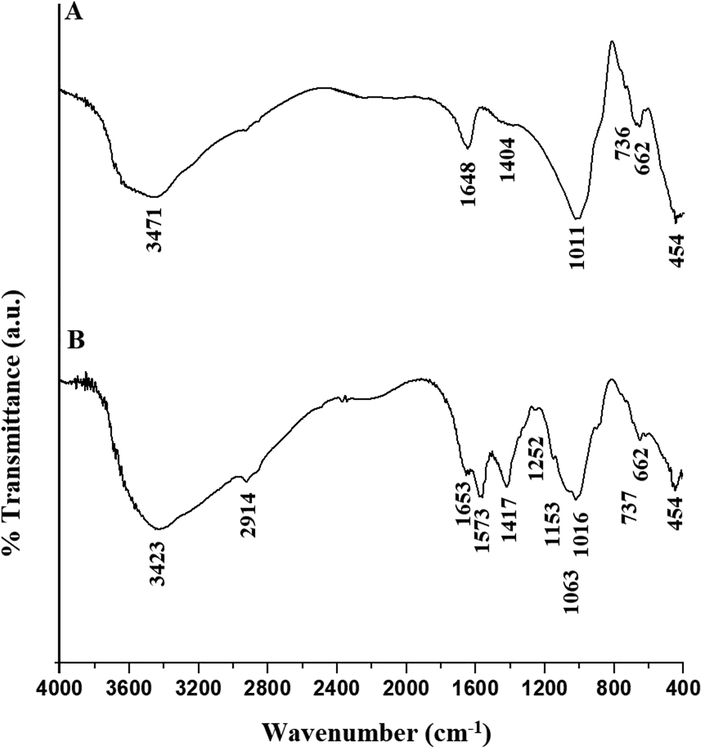
The FT-IR spectra of the H1 (A) and H1Ch (B) samples.
3.1.4 FE-SEM and surface area
Fig. 4. A-B represents the FE-SEM images of the H1 and H1Ch samples, respectively. The results confirmed that the H1 sample consists of spheres and irregular shapes. Also, the H1Ch sample consists of cotton and large irregular shapes due to the functionalization of the synthesized nanostructures with chitosan (Abdelrahman and Hegazey, 2019a; Khalifa et al., 2020). These observations are consistent with other inorganic/organic nanocomposites prepared in similar ways as reported by Al-Wasidi et al. (Al-Wasidi et al., 2022a) (Al-Wasidi et al., 2022b) and Abdelrahman et al. (Abdelrahman and Hegazey, 2019a, 2019b).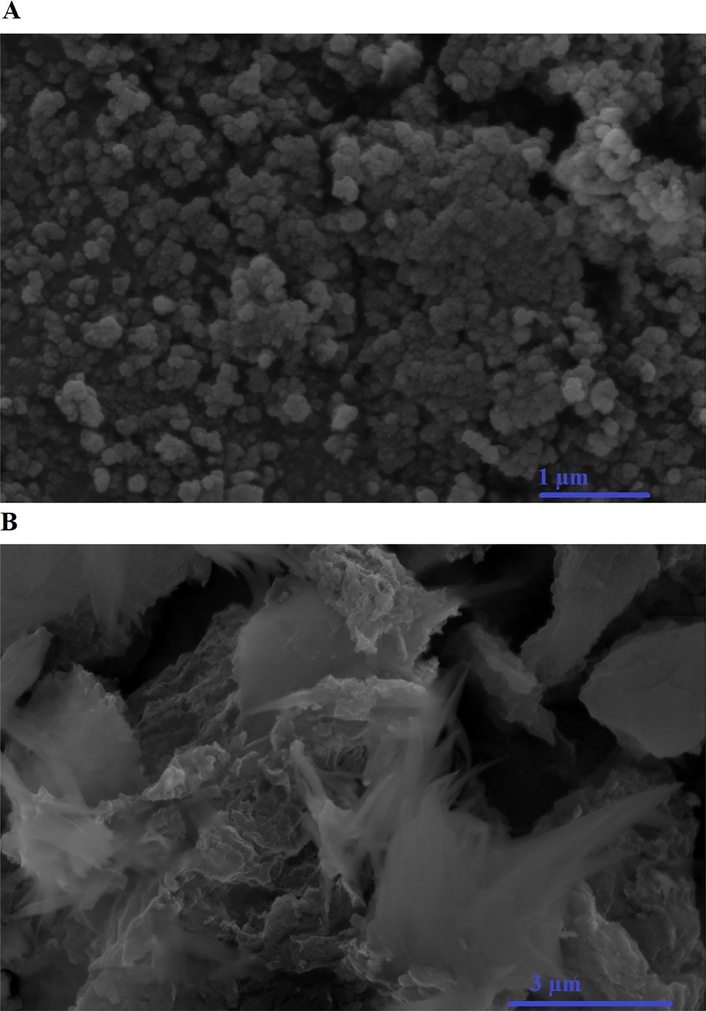
The FE-SEM images of the H1 and H1Ch samples, respectively.
The BET surface area, which was determined using N2 adsorption/desorption analyzer, of the H1 and H1Ch samples are 200.25 and 160.14 m2/g, respectively. The decrease in the surface area of the H1Ch is due to the functionalization of the synthesized nanostructures with chitosan. Hence, the H1Ch can remove the cationic dyes (i.e., methylene blue and crystal violet dyes) via chemical electrostatic attraction between dyes and functional groups (i.e., NH2 and OH) of the H1Ch adsorbent in basic medium. Also, the H1 sample can remove the cationic dyes via the ion exchange between sodium ions of the nanostructures and cationic dyes.
3.2 Removal of methylene blue and crystal violet dyes from aqueous media
3.2.1 Effect of pH
Fig. 5. A-B shows the plot of pH versus % R of the studied dyes and Q of the H1 and H1Ch samples, respectively. The results showed an increase in the values of % R and Q with an increase in pH from 2 to 8. Hence, pH = 8 is the ideal value at which other factors affecting the removal of the examined dyes will be studied. % R of methylene blue dye using the H1 and H1C samples at pH = 8 equals 71.25 and 93.75 %, respectively. Q of the H1 and H1C samples toward methylene blue dye equals 14.25 and 18.75 mg/g, respectively. % R of crystal violet dye using the H1 and H1C samples at pH = 8 equals 78.93 and 96.90 %, respectively. Q of the H1 and H1C samples toward crystal violet dye equals 15.79 and 19.38 mg/g, respectively.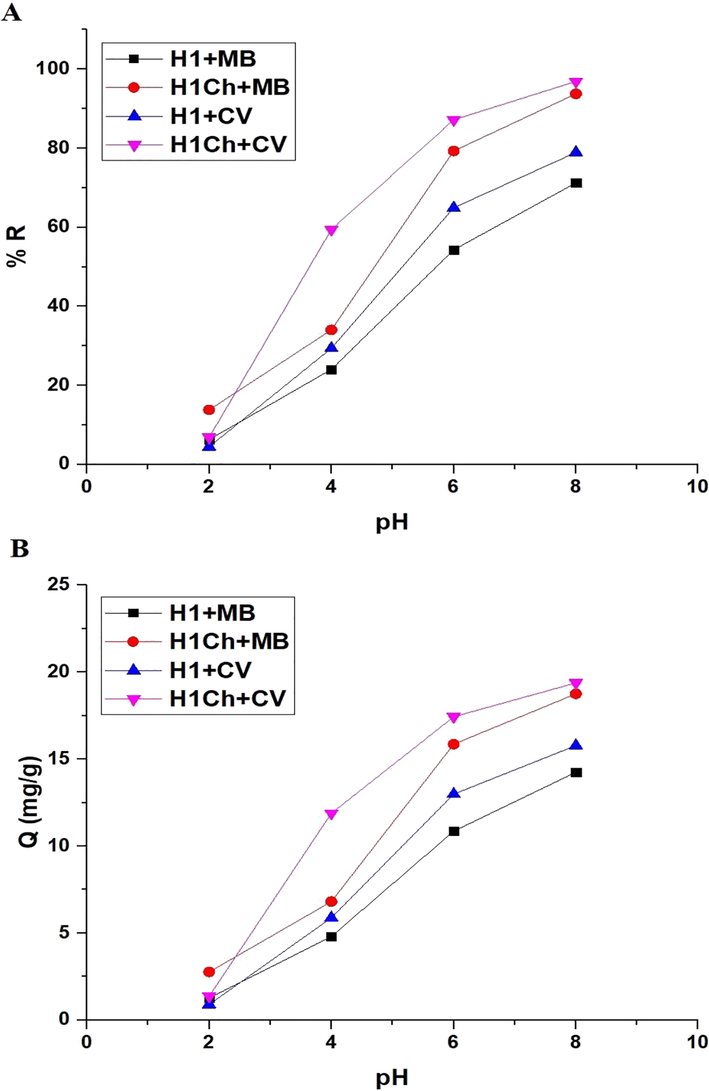
The plot of pH versus % R of the studied dyes (A) and Q of the H1 and H1Ch samples (B).
3.2.2 Effect of time
Fig. 6. A-B shows the plot of time versus % R of the studied dyes and Q of the H1 and H1Ch samples, respectively. The results showed an increase in the values of % R and Q with an increase in time from 10 to 50 min. Also, there was approximate stability in both % R and Q when increasing the time from 50 to 80 min due to the saturation of active sites. Hence, time = 50 min is the ideal value at which other factors affecting the removal of the examined dyes will be studied. % R of methylene blue dye using the H1 and H1C samples after 50 min equals 72.50 and 93.88 %, respectively. Q of the H1 and H1C samples toward methylene blue dye equals 14.50 and 18.78 mg/g, respectively. % R of crystal violet dye using the H1 and H1C samples after 50 min equals 78.75 and 97.00 %, respectively. Q of the H1 and H1C samples toward crystal violet dye equals 15.75 and 19.40 mg/g, respectively. The pseudo-first and pseudo-second-order kinetics, as expressed in Eqs. (3) and (4), were used to examine experimental data (Abdelrahman and Hegazey, 2019a; Khalifa et al., 2020).
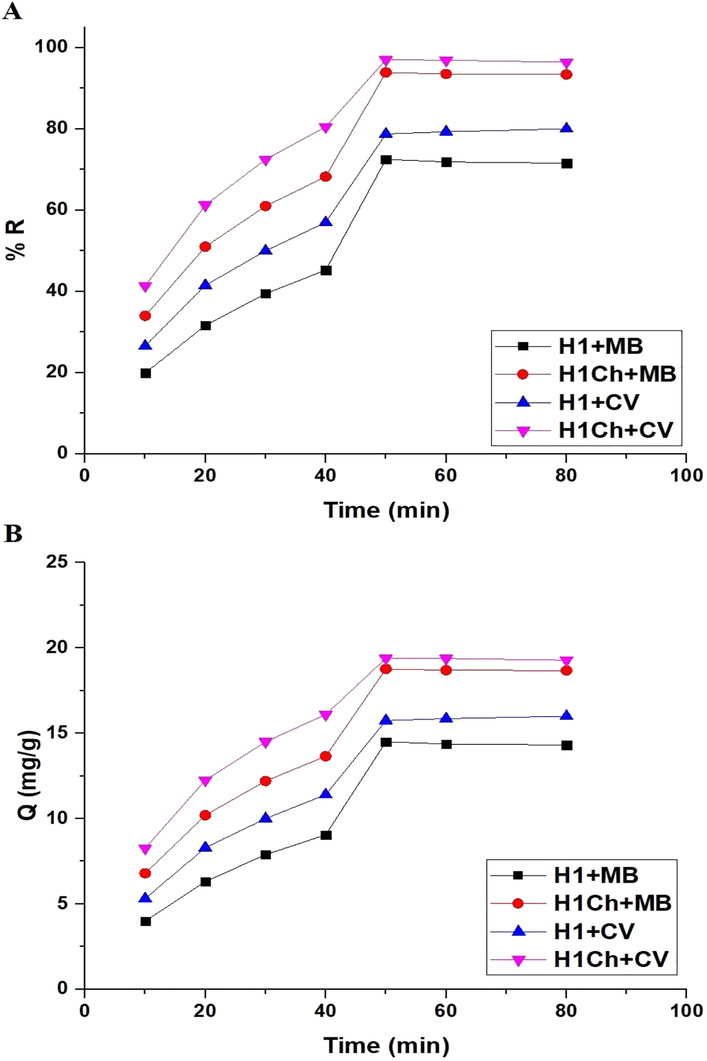
The plot of time versus % R of studied dyes (A) and Q of the H1 and H1Ch samples (B).
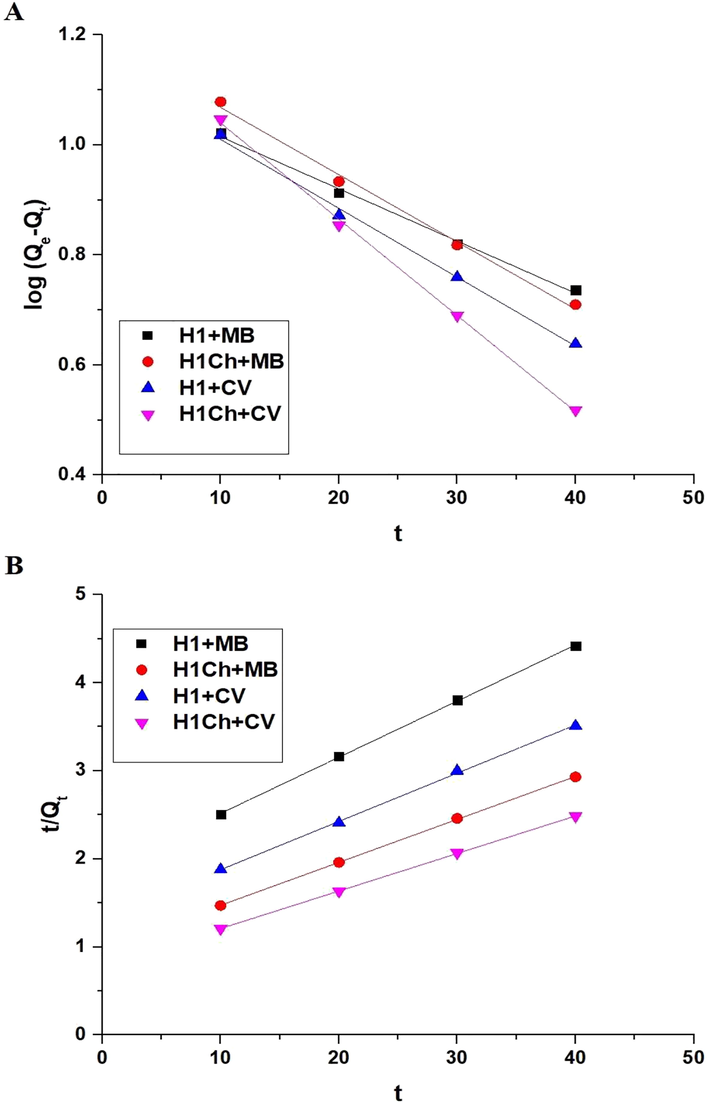
The plot of time versus log (Qe-Qt) (A) and t/Qt (B).
Adsorbent
Pseudo-first-order
Pseudo-second-order
Qe (mg/g)
k1 (1/min)
R2
Qe (mg/g)
k2 (g/mg.min)
R2
H1
12.88
0.0218
0.9948
15.68
0.0022
0.9997
H1Ch
15.49
0.0281
0.9927
20.50
0.0024
0.9998
Adsorbent
Pseudo-first-order
Pseudo-second-order
Qe (mg/g)
k1 (1/min)
R2
Qe (mg/g)
k2 (g/mg.min)
R2
H1
13.65
0.0288
0.9953
18.25
0.0023
0.9989
H1Ch
16.38
0.0403
0.9984
23.46
0.0024
0.9999
3.2.3 Effect of temperature
Fig. 8. A-B shows the plot of temperature versus % R of the studied dyes and Q of the H1 and H1Ch samples, respectively. The results showed a decrease in the values of % R and Q with an increase in temperature from 298 to 328 K. Hence, temperature = 298 K is the ideal value at which other factors affecting the removal of the examined dyes will be studied. The influence of temperature on the adsorption processes of the methylene blue and crystal violet dyes can be evaluated by determining the thermodynamic parameters such as change in free energy (△Go, KJ/mol), change in entropy (△So, KJ/molK), and change in enthalpy (△Ho, KJ/mol) applying Eqs. (5), (6), and (7) (Abdelrahman and Hegazey, 2019a; Khalifa et al., 2020).
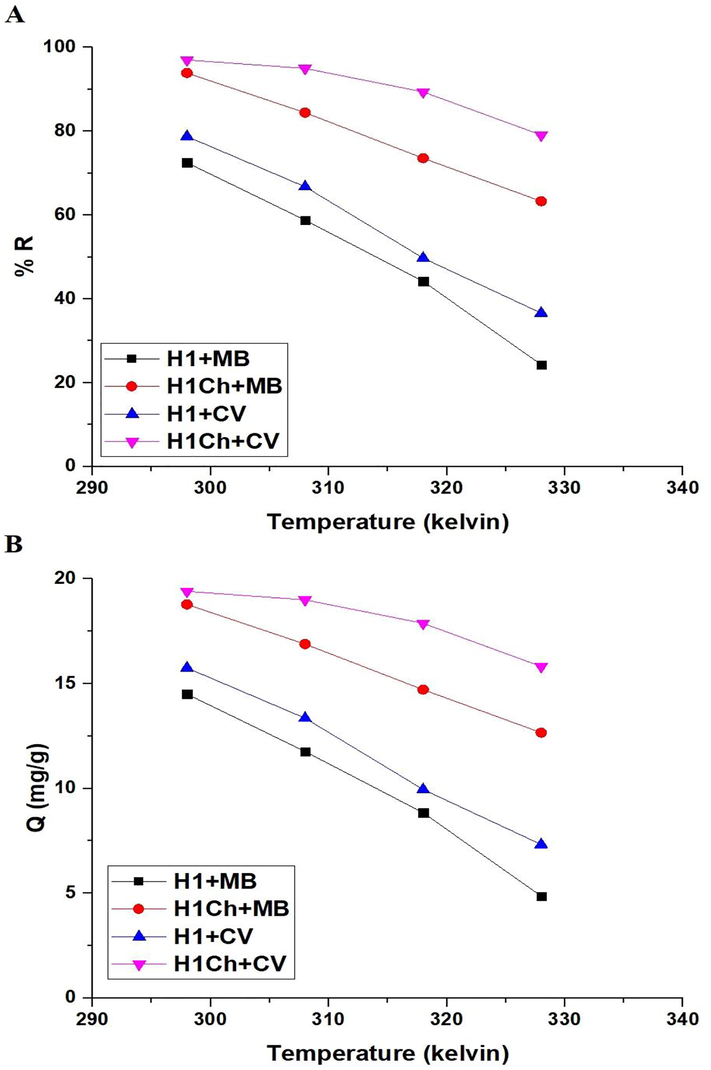
The plot of temperature versus % R of the studied dyes (A) and Q of the H1 and H1Ch samples (B).
T (kelvin) is the adsorption temperature whereas Kd (L/g) is the distribution constant. R (kJ/mol kelvin) is a gas constant. By plotting ln Kd against 1/T, the △So and △Ho can be calculated from the intercept and slope as clarified in Fig. 9 and Tables 3 and 4. Additionally, the values of △Go were calculated based on the values of △Ho and △So, as clarified in Tables 3 and 4. The minus values of △Ho signifies that the adsorption processes are exothermic. In addition, △Ho is higher than 40 KJ/mol, which indicates the chemical adsorption. The positive values of (△So) suggest greater randomization at the solid/solution interface after adsorption of the methylene blue and crystal violet dyes onto the H1 and H1Ch samples. The negative values of △Go suggested the spontaneous nature of the adsorption of methylene blue and crystal violet dyes using the H1 and H1Ch samples.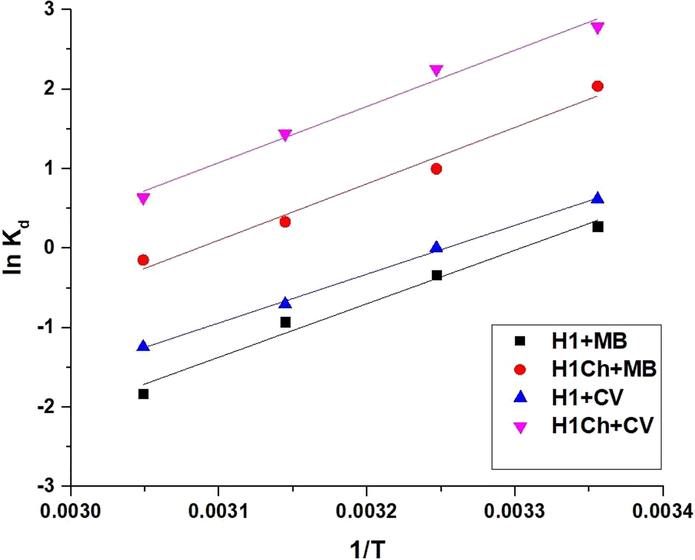
The plot of 1/T versus ln Kd.
Adsorbent
△Ho (KJ/mol)
△So (KJ/mol kelvin)
△Go (KJ/mol)
298
308
318
328
H1
−56.25
0.1858
−111.62
−113.48
−115.34
−117.19
H1Ch
−59.25
0.1828
−113.73
−115.56
−117.39
−119.22
Adsorbent
△Ho (KJ/mol)
△So (KJ/mol kelvin)
△Go (KJ/mol)
298
308
318
328
H1
−51.34
0.1669
−101.09
−102.77
−104.44
−106.11
H1Ch
−59.10
0.1742
−111.02
−112.76
−114.50
−116.25
3.2.4 Effect of concentration
Fig. 10. A-B shows the plot of concentration versus % R of the studied dyes and Q of the H1 and H1Ch samples, respectively. The results showed a decrease in the values of % R and an increase in the values of Q with an increase in concentration from 20 to 60 mg/L. The Langmuir and Freundlich isotherms, as expressed in Eqs. (8) and (9), were used to examine experimental data (Abdelrahman and Hegazey, 2019a; Khalifa et al., 2020).
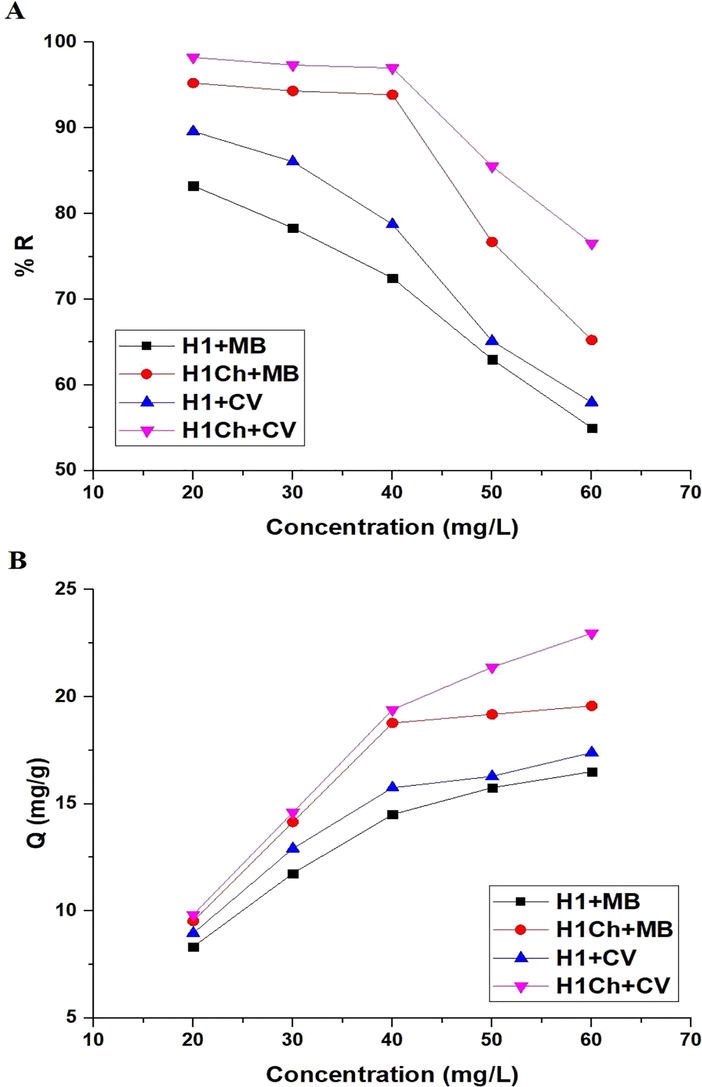
The plot of concentration versus % R of the studied dyes (A) and Q of the H1 and H1Ch samples (B).
kL (L/mg) is the equilibrium constant of the Langmuir isotherm whereas Qm (mg/g) is the maximum adsorption capacity of the Langmuir isotherm. kF (mg/g)(L/mg)1/n and 1/n are the equilibrium constant and the heterogeneity constant of the Freundlich isotherm, respectively. The Freundlich isotherm can be utilized to determine the Qm using Eq. (10) (Abdelrahman and Hegazey, 2019a; Khalifa et al., 2020).
Fig. 11. A-B shows the Langmuir and Freundlich isotherms, respectively. The values of kL, kF, Qm, and correlation coefficients (R2) are listed in Tables 5 and 6. The results are consistent with the Langmuir isotherm because the R2 values of the Langmuir isotherm are more than the R2 values of the Freundlich isotherm. The maximum adsorption capacity of the H1 and H1Ch samples toward the methylene blue dye is 19.07 and 20.25 mg/g, respectively. Also, the maximum adsorption capacity of the H1 and H1Ch samples toward the crystal violet dye is 18.62 and 23.51 mg/g, respectively. Nonlinear equilibrium isotherms were studied as described by Altowayti et al. (Figures omitted for brevity). The R2 value derived from the nonlinear plot is much smaller than that derived from the linear isotherm. Hence, the results of this study showed that the linear method is a good way to show the equilibrium data (Altowayti et al., 2021).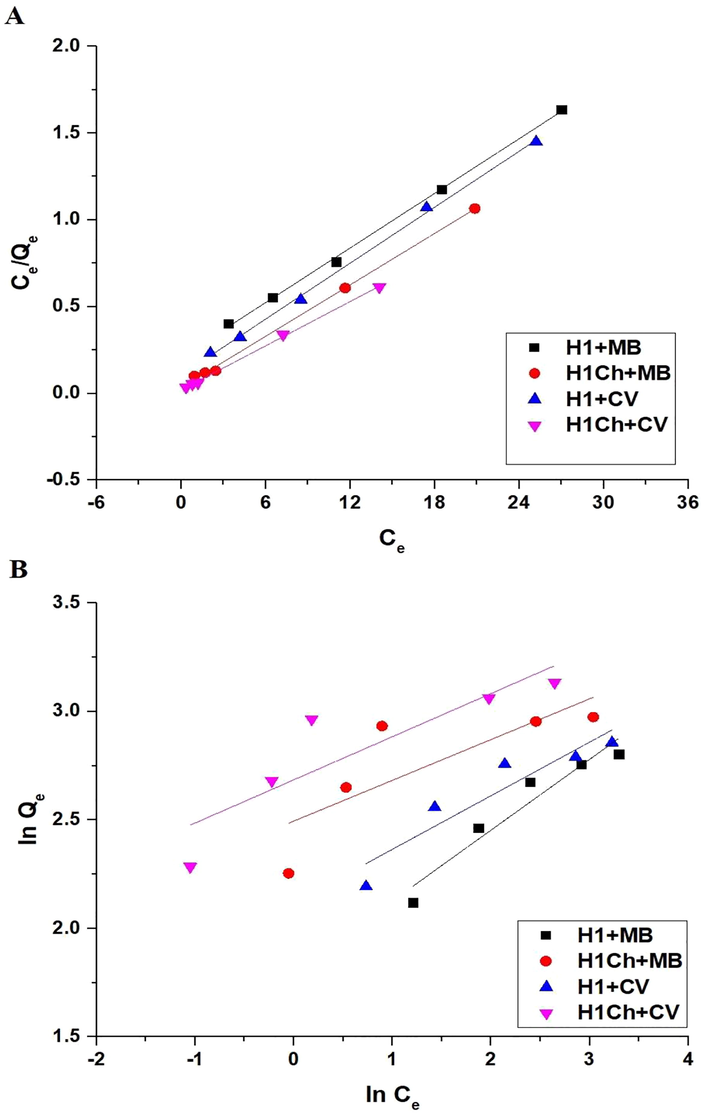
The Langmuir (A) and Freundlich (B) isotherms.
Adsorbent
Langmuir
Freundlich
Qm (mg/g)
kL (L/mg)
R2
Qm (mg/g)
kF (mg/g)(L/mg)1/n
R2
H1
19.07
0.2505
0.9984
20.16
6.0555
0.9063
H1Ch
20.25
1.4856
0.9982
24.23
12.1187
0.5194
Adsorbent
Langmuir
Freundlich
Qm (mg/g)
kL (L/mg)
R2
Qm (mg/g)
kF (mg/g)(L/mg)1/n
R2
H1
18.62
0.5047
0.9979
20.67
8.3138
0.8362
H1Ch
23.51
2.1869
0.9988
30.53
14.66
0.7134
4 Conclusions
The hydrothermal method was utilized for the facile synthesis of sodium magnesium silicate hydroxide/sodium magnesium silicate hydrate nanostructures. The nanostructures were modified by chitosan as a novel composite for the efficient removal of the methylene blue and crystal violet dyes from aqueous media. The functionalization of nanostructures with chitosan led to the appearance of chitosan XRD peaks at 2 = 8.9° and 21° whereas the intensities of the other XRD peaks were affected. The maximum adsorption capacity of the nanostructures and nanocomposite toward the methylene blue dye is 19.07 and 20.25 mg/g, respectively. Also, the maximum adsorption capacity of the nanostructures and nanocomposite toward the crystal violet dye is 18.62 and 23.51 mg/g, respectively.
Declaration of Competing Interest
The authors declare that they have no known competing financial interests or personal relationships that could have appeared to influence the work reported in this paper.
References
- Synthesis of zeolite nanostructures from waste aluminum cans for efficient removal of malachite green dye from aqueous media. J. Mol. Liq.. 2018;253:72-82.
- [CrossRef] [Google Scholar]
- Utilization of waste aluminum cans in the fabrication of hydroxysodalite nanoparticles and their chitosan biopolymer composites for the removal of Ni(II) and Pb(II) ions from aqueous solutions: kinetic, equilibrium, and reusability studies. Microchem. J.. 2019;145:18-25.
- [CrossRef] [Google Scholar]
- Exploitation of Egyptian insecticide cans in the fabrication of Si/Fe nanostructures and their chitosan polymer composites for the removal of Ni(II), Cu(II), and Zn(II) ions from aqueous solutions. Compos. Part B Eng.. 2019;166:382-400.
- [CrossRef] [Google Scholar]
- Efficient removal of methylene blue dye from aqueous media using Fe/Si, Cr/Si, Ni/Si, and Zn/Si amorphous novel adsorbents. J. Mater. Res. Technol.. 2019;8:5301-5313.
- [CrossRef] [Google Scholar]
- Facile synthesis of Fe2O3 nanoparticles from Egyptian insecticide cans for efficient photocatalytic degradation of methylene blue and crystal violet dyes. Spectrochim. Acta - Part A Mol. Biomol. Spectrosc.. 2019;222:117195
- [CrossRef] [Google Scholar]
- A facile and rapid removal of cationic dyes using hierarchically porous reduced graphene oxide decorated with manganese ferrite. FlatChem. 2021;26:100233
- [CrossRef] [Google Scholar]
- Application of a novel nanocomposites carbon nanotubes functionalized with mesoporous silica-nitrenium ions (CNT-MS-N) in nitrate removal: optimizations and nonlinear and linear regression analysis. Environ. Technol. Innov.. 2021;22:101428
- [CrossRef] [Google Scholar]
- Facile synthesis of a novel nanocomposite for determination of mercury and copper ions in food and water samples. Arab. J. Chem.. 2022;15:104113
- [CrossRef] [Google Scholar]
- Modification of sodium aluminum silicate hydrate by thioglycolic acid as a new composite capable of removing and preconcentrating Pb(II), Cu(II), and Zn(II) ions from food and water samples. Arab. J. Chem.. 2022;15:104178
- [CrossRef] [Google Scholar]
- Arif Ullah, M., Sulaiman Othman Alhar, M., Ullah Khan, A., Tahir, K., E. A. Zaki, M., Alabbad, E.A., Abdu Musad Saleh, E., M. A. Hassan, H., El-Zahhar, A.A., Munshi, A.M., 2023. Photocatalytic removal of alizarin red and photoinhibition of microbes in the presence of surfactant and Bio-template mediated Ag/SnO2/Nb2O5-SiO2 nanocomposite. J. Mol. Liq. 370, 121042. https://doi.org/10.1016/j.molliq.2022.121042
- Fabrication of novel Bentonite-Anthracite@Zetag (BT-An@Zetag) composite for the removal of Arsenic (V) from an aqueous solution. Molecules. 2022;27
- [CrossRef] [Google Scholar]
- A critical review of biosorption of dyes, heavy metals and metalloids from wastewater as an efficient and green process. Clean. Eng. Technol.. 2021;4:100209
- [CrossRef] [Google Scholar]
- Optimization and prediction of safranin-O cationic dye removal from aqueous solution by emulsion liquid membrane (ELM) using artificial neural network-particle swarm optimization (ANN-PSO) hybrid model and response surface methodology (RSM) J. Environ. Chem. Eng.. 2021;9
- [CrossRef] [Google Scholar]
- Adsorptive performance of aminonaphthalenesulfonic acid modified magnetic-graphene oxide for methylene blue dye: mechanism, isotherm and thermodynamic studies. Inorg. Chem. Commun.. 2023;147:110261
- [CrossRef] [Google Scholar]
- Congo red dye removal from aqueous environment by cationic surfactant modified-biomass derived carbon: equilibrium, kinetic, and thermodynamic modeling, and forecasting via artificial neural network approach. Chemosphere. 2022;290:133346
- [CrossRef] [Google Scholar]
- State-of-art advances on removal, degradation and electrochemical monitoring of 4-aminophenol pollutants in real samples: a review. Environ. Res.. 2023;222:115338
- [CrossRef] [Google Scholar]
- Application of mesoporous silica nanoparticles modified with Dibenzoylmethane as a novel composite for efficient removal of Cd(II), Hg(II), and Cu(II) ions from aqueous media. J. Inorg. Organomet. Polym. Mater.. 2020;30:2182-2196.
- [CrossRef] [Google Scholar]
- Study on efficient removal of anionic, cationic and nonionic dyes from aqueous solutions by means of mesoporous carbon nanospheres with empty cavity. Chem. Eng. Res. Des.. 2015;94:242-253.
- [CrossRef] [Google Scholar]
- Liu, C., Omer, A.M., Ouyang, X. kun, 2018. Adsorptive removal of cationic methylene blue dye using carboxymethyl cellulose/k-carrageenan/activated montmorillonite composite beads: Isotherm and kinetic studies. Int. J. Biol. Macromol. 106, 823–833. https://doi.org/10.1016/j.ijbiomac.2017.08.084
- High effective adsorption of organic dyes on magnetic cellulose beads entrapping activated carbon. J. Hazard. Mater.. 2009;171:340-347.
- [CrossRef] [Google Scholar]
- Effective removal of crystal violet and methylene blue dyes from water by surface functionalized zirconium silicate nanocomposite. J. Environ. Chem. Eng.. 2019;7:103009
- [CrossRef] [Google Scholar]
- Novel hollow beads of carboxymethyl cellulose/ZSM-5/ZIF-8 for dye removal from aqueous solution in batch and continuous fixed bed systems. Int. J. Biol. Macromol.. 2020;162:1140-1152.
- [CrossRef] [Google Scholar]
- Methylene blue dye: toxicity and potential elimination technology from wastewater. Results Eng.. 2022;16:100678
- [CrossRef] [Google Scholar]
- Removal of colour from crystal violet dye using low cost adsorbents. Int. J. ChemTech Res.. 2014;6:4346-4351.
- [Google Scholar]
- Acid-promoted synthesis of UiO-66 for highly selective adsorption of anionic dyes: adsorption performance and mechanisms. J. Colloid Interface Sci.. 2017;499:151-158.
- [CrossRef] [Google Scholar]
- Adsorption of methylene blue on alginate-grafted-poly (methyl methacrylate) J. Teknol.. 2015;76:19-25.
- [CrossRef] [Google Scholar]
- Removal of methylene blue dye from aqueous solution using alginate grafted polyacrylonitrile beads. Der Pharma Chem.. 2015;7:237-242.
- [Google Scholar]
- Silver nanoparticles-based composite for dye removal: a comprehensive review. Clean. Mater.. 2022;6:100161
- [CrossRef] [Google Scholar]
- Optimization of simultaneous removal of methylene blue, crystal violet, and fuchsine from aqueous solutions by magnetic NaY zeolite composite. Water. Air. Soil Pollut.. 2014;225
- [CrossRef] [Google Scholar]
- Adsorption properties of methylene blue and gentian violet of sodium vanadate nanowire arrays synthesized by hydrothermal method. Appl. Surf. Sci.. 2022;604:154608
- [CrossRef] [Google Scholar]
- Mussel inspired surface functionalization of polyamide membranes for the removal and adsorption of crystal violet dye. Dye. Pigment.. 2022;206:110606
- [CrossRef] [Google Scholar]


