

Translate this page into:
Functionalized electrospun carbon nanofibers for removal of cationic dye
⁎Corresponding author at: Department of Chemistry, College of Science, King Saud University, Riyadh 11451, Saudi Arabia. melnewehy@ksu.edu.sa (Mohamed H. El-Newehy) melnewehy@hotmail.com (Mohamed H. El-Newehy)
-
Received: ,
Accepted: ,
This article was originally published by Elsevier and was migrated to Scientific Scholar after the change of Publisher.
Peer review under responsibility of King Saud University.
Abstract
Abstract
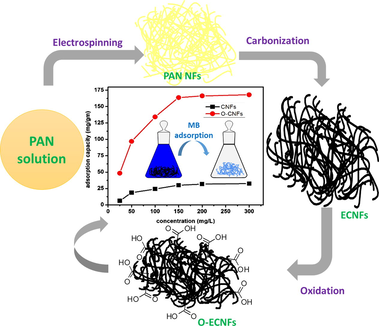
Electrospun carbon nanofibers (ECNFs) have attracted significant attention in recent years as relatively inexpensive alternative to carbon nanotubes for adsorption organic pollutants. In this study, ECNFs were fabricated from polyacrylonitrile (PAN) using an electrospinning technique, followed by carbonization and oxidation via treatment with a H2SO4/HNO3 mixture. The prepared oxidized electrospun carbon nanofibers (O-ECNFs) were characterized using scanning and transmission electron microscopy (SEM and TEM), Fourier transform infrared (FT-IR), Brunauer-Emmett-Teller (BET), X-ray diffraction (XRD), and thermogravimetric analysis (TGA). The O-ECNFs were used as nano-adsorbents for the adsorption of methylene blue (MB) from aqueous solution. The adsorption of MB by the O-ECNFs was studied as a function of pH, time, adsorbent dosage, MB concentration, and temperature. ECNF functionalization enhanced the adsorption capacity towards MB dye compared pristine ECNFs. Detailed analysis of the adsorption kinetics showed that the adsorption process followed a pseudo-second-order model. The adsorption isotherm was best fit by the Langmuir model. The thermodynamic results showed that MB adsorption onto the O-ECNFs was endothermic and spontaneous.
Keywords
Electrospinning
Carbon nanofibers
Functionalization
Methylene blue
Adsorption
Kinetic

1 Introduction
Tremendous development of various industrial sectors has had a negative impact on the environment. Many industries including the textile, cosmetic, and lather industries produce effluents containing harmful colored compounds (Crini, 2006). Synthetic dyes are some of the most hazardous colored compounds in wastewater due to their low biodegradability, and they hinder light penetration in water, causing decreased dissolved oxygen, which is detrimental to aquatic life (Hao et al., 2000). The removal of these dyes from wastewater is often performed by physical (e.g. decoloration), chemical, or biodegradation processes (Slokar and Majcen Le Marechal, 1998). Adsorption is the most commonly used physical process for non-biodegradable dye removal and yields high quality water from wastewater due to its cheap, simple, and effective treatment (Gui et al., 2014; He et al., 2013; Otero et al., 2003).
Since the adsorption of pollutants depends on the characteristics of the adsorbent, the adsorptive capacity varies widely between materials because of their inherent physical and chemical properties (Adegoke and Bello, 2015). Recently, several studies have reported the development of new adsorbent materials. Carbon nanomaterials (CNMs) have attracted considerable attention in the field of water treatment due to their hollow layered structures, π-π electrostatic interactions, and large specific surface areas (Ren et al., 2011; Teng et al., 2012; Wu, 2007). A disadvantage of CNMs concerning their use in water treatment is their hydrophobicity, chemically inert surface, and poor dispersion in aqueous solution (Lin and Xing, 2008; Mishra et al., 2010). The modification of their surface with functional groups is a suitable process for overcoming these problems. Chemical activation allows alteration of electronic properties and the introduction of new functional groups, affecting the chemical properties of the surface that cannot otherwise be gained in the pristine carbon nanostructure (Bai et al., 2013; Sweetman et al., 2017).
The use of CNMs, such as carbon nanotubes (CNTs), carbon nanofibers (CNFs), and graphene at the commercial scale for various applications depends on the cost and quality of the raw materials. The price of CNTs and CNFs varies depending on the producer, but the cost of CNFs is typically an order-of-magnitude lower than that of CNTs. In general, there are two types of CNFs: vapor-grown CNFs (VGCNFs) and electrospun CNFs (ECNFs). ECNFs are common carbon nanostructures that have recently attracted growing attention and have been used in water treatment and purification due to their nanosized diameter, large surface areas, porosity, and low cost compared to carbon nanotubes and graphene (Bai et al., 2014; Lee et al., 2010; Li et al., 2015; Singh et al., 2010). Electrospinning of polymeric nanofibers is a novel technique for fabrication of continuous fibers with diameters ranging from a few micrometers to a few nanometers (Thamer et al., 2017; Wei et al., 2016; Lu et al., 2018). Polyacrylonitrile (PAN) is the most common polymer to be successfully electrospun, and following heat treatment can produce ultrafine ECNFs with higher carbon content yield and strength (Zhang et al., 2014; Zhang et al., 2009). To the best of our knowledge, oxidized ECNFs have not been used for the removal inorganic and organic contaminants like their counterparts VGCNFs, CNTs, and graphene (see Table 1).
Sample code
Surface area
(m2 g−1)Pore volume
(cm3 g−1)Average pore radius
(nm)
ECNFs
10.10
0.022
1.00
O-ECNFs
115.60
0.029
1.49
In this study, we report a novel system based on ECNFs for removal of methylene blue (MB) as a model cationic dye from aqueous solution. The electrospinning technique was used to prepare the nanofibers followed by carbonization under an inert gas to produce the ECNFs. The surface of the ECNFs was then modified via oxidation to produce the final adsorbent material, oxidized electrospun carbon nanofibers (O-ECNFs).
2 Experimental
2.1 Materials
Analytically pure polyacrylonitrile (PAN, Mw = 150 kg·mol−1) and N,N-dimethylformamide (DMF) were purchased from Sigma-Aldrich. Methylene blue (MB, Scheme 1) and nitric acid (68–71%) were purchased from Laba Chemie, India. Sulfuric acid and sodium hydroxide were purchased from BDH Chemicals.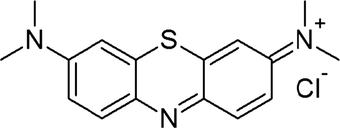
Structure of methylene blue.
2.2 Preparation of oxidized electrospun carbon nanofibers (O-ECNFs)
2.2.1 Fabrication of electrospun carbon nanofibers (ECNFs)
A PAN solution (8% w/v) was prepared by dissolving 0.8 g of PAN powder in 9.2 mL of DMF under gentle stirring for 5 h at 60 °C to obtain a homogeneous solution. Electrospun nanofibers were obtained by placing the polymer solution into a syringe pump and electrospinning was run to produce nanofiber mats using an electrospinning machine with the following parameters: voltage of 16 kV at a distance (TCD) of 15 cm at a flow rate of 0.8 mL h−1, and humidity of 30–40% at 25 °C. The obtained nanofibrous mats were dried in a vacuum oven at 80 °C for 8 h prior to stabilization treatment.
2.2.2 Carbonization of the electrospun carbon nanofibers (ECNFs)
The dried nanofibrous mats was placed in a furnace (OFT-1200X) and stabilized by heating to 280 °C, at heating rate of 1 °C min−1 in air and holding the samples at 280 °C for 2 h. The stabilized fibers were carbonized by heating to 900 °C, at heating rate of 3 °C min−1 under argon then holding for 1 h at 900 °C and then cooled to room temperature. The prepared samples are denoted as electrospun carbon nanofibers (ECNFs).
2.2.3 Surface modification of the electrospun carbon nanofibers (O-ECNFs)
The pristine ECNFs were treated with a mixture of concentrated nitric acid (69%) and sulfuric acid (98%) with a 1:3 ratio at 75 °C for 5 h. The oxidized carbon nanofibers (O-ECNFs) mats were filtered and washed with deionized water until the filtrate was neutral. The product, O-ECNFs, was dried at 80 °C for 24 h under vacuum.
2.3 Characterization
The morphology of the ECNFs and O-ECNFs before and after adsorption process was examined using scanning electron microscopy (SEM, Model 1820, UK) and transmission electron microscopy (TEM, JEOL JEM-1011, USA). The chemical structure of the O-ECNFs was investigated by Fourier transform infrared (FT-IR, Bruker Optic Tensor27, Germany) spectroscopy from 400 to 4000 cm−1 using KBr pellets. The textural properties (surface area, pore volume, and pore size) of the ECNFs and O-ECNFs were measured using N2 adsorption at 77 K by Brunauer-Emmett-Teller (BET, NOVA 2200e analyzer, Quantachrome Instruments, Boynton Beach, FL, USA). The X-ray diffraction measurements were performed on an X-ray diffractometer (XRD, MiniFlex-600 Rigaku) with Cu Kα radiation, operated at 40 kV and 15 mA, with an angle scan from 2θ = 3–80° at a scan rate of 5° min−1. The thermal degradation of the pristine and oxidized electrospun carbon nanofibers was analyzed by thermogravimetric analysis (TGA, Q500 TGA, USA) under a nitrogen atmosphere with a heating rate of 10 °C min−1 from 30 to 800 °C. Zeta potential measurements were performed using a NanoPlus zet/nano particle analyzer. The samples (0.005 g) were dispersed in 10 mL of distilled water and then thoroughly sonicated using an ultrasonic probe (VCX 130 ultrasonic processor, Sonics, CT, USA). The samples were allowed to settle for approximately ∼1 h and a small aliquot of the dispersion from the top of the tube was taken for subsequent measurements.
2.4 Adsorption study
The batch experiments of MB adsorption were performed in a 50 mL Erlenmeyer flask containing 20 mL of solution with different concentrations of dyes (25, 50, 75, 100, 150, and 200 mg L−1) with 10 mg of ECNFs or O-ECNFs at 298 K for 24 h. The samples were agitated at 70 rpm in a thermostated shaker-water bath.
The effect of pH on MB adsorption was studied by adjusting the dye solution (50 mg L−1) to different pH values (2.5–9). The pH values of all the dye solutions were adjusted using 0.1 mol/L HCl or NaOH solutions with to the desired pH. The effect of adsorbent dosage on the removal of MB was investigated by adding various adsorbent dosages from 5 to 20 mg to 20 mL of MB solution with an initial concentration of 50 mg L−1 at pH 9 under agitation at 298 K for 24 h. The effect of temperature was examined using 20 mL of the MB solutions at an initial concentration of 50 mg L−1 with 10 mg of adsorbent at 298, 303, 308, and 313 K for 24 h. For measuring the residual concentration of the dye, 5 mL of the dye solution was removed using a pipette from upper part of the solution then centrifuged at 4.2 k rpm for 5 min. After centrifugation, the residual concentration of MB in the aqueous solution was measured using a UV–Vis spectrophotometer (UV–Vis, Perkin Elmer Lambda 35, UK) at λmax = 664 nm. For the kinetic studies, 100 mg of O-ECNFs was added to 200 mL of a 50 mg L−1 MB solution at pH 9.0 under agitation at 298 K. The absorbance of the MB solution was measured at regular time intervals (from 12 min to 24 h) using UV–Vis spectroscopy at λmax = 664 nm.
The amount of MB adsorbed on O-ECNFs at time t (qt, mg g−1) and at equilibrium (qe, mg g−1) as well as removal efficiency were calculated using the following equations:
3 Results and discussion
Functionalization of carbon nanofibers is of interest for potential biological and technological applications. Surface modification is performed to manipulate the surface chemistry to create potential adsorption sites, maximize its selectivity, and maintain the stability of the surface (Klein et al., 2008). For various applications it is necessary to perform functionalization of CNFs via chemical modification to leverage its high surface area, which provides excellent properties for use in applications such as adsorption of dye pollutants.
3.1 Characterization of ECNFs and O-ECNFs
3.1.1 Morphology of the ECNFs and O-ECNFs
SEM and TEM were used to detect morphological changes of the nanofibers after carbonization, oxidation, and adsorption. As shown in Fig. 1A, the PAN nanofibers were smooth, bead-free, straight, and randomly arranged with an average diameter of 284 nm. During the carbonization process, gases (e.g. CO2, CO, NH3, and H2O) were released, inducing shrinkage of the nanofibers and resulting in a change in the morphology of the ECNFs while maintaining the basic nanofibrous structure (Fig. 1B) (Peng and Lo, 2015). After oxidation of the ECNFs by H2SO4/HNO3, the carbon nanofibers exhibited a more compact stacking morphology due to the cohesive force generated (H-bonding) by the introduction of oxygen containing functional groups (e.g. —OH, —COOH) (Sun et al., 2012). Fig. 1D shows the surface of the O-ECNFs after adsorption of MB, which exhibited a smoother morphology when compared to the original O-ECNFs (Fig. 1C) due to bonding of the MB molecules with the surface organic functional groups.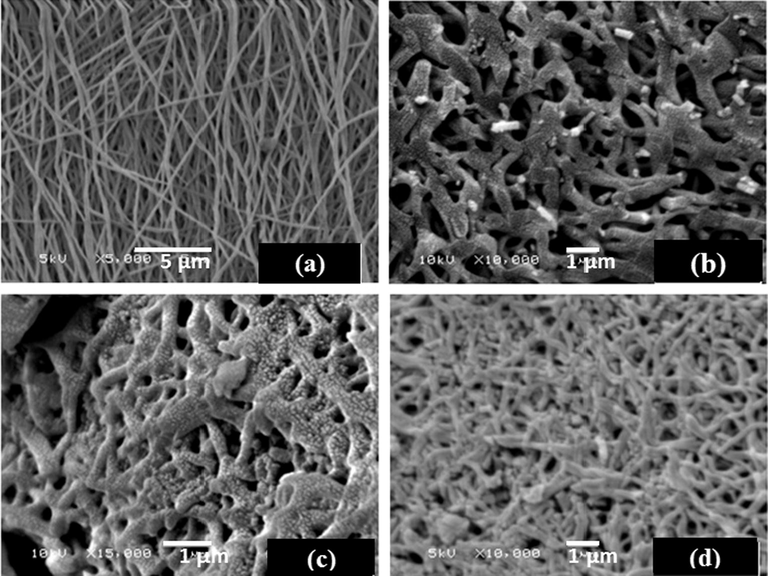
SEM images of (A) PAN nanofibers, (B) ECNFs, (C) O-ECNFs, and (D) O-ECNFs/MB.
Fig. 2 shows the TEM images of the ECNFs and O-ECNFs before and after MB adsorption. It is clear that the fiber diameter decreased after oxidation from 234 to 153 nm due to etching of the surface of the ECNFs by the strong acids. After oxidation, the O-ECNFs exhibited a rough and microporous surface compared to the smooth surface of the pristine ECNFs. Fig. 2C shows the TEM image of the adsorbed dye on the O-ECNFs with a rough surface compared to the pristine ECNFs.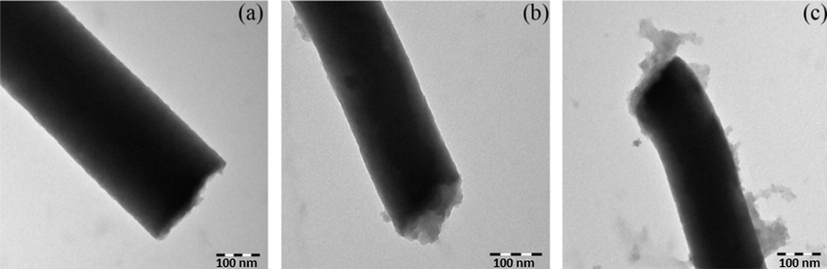
TEM images of (a) ECNFs, (b) O-ECNFs, and (c) O-ECNFs/MB.
3.1.2 Surface area and pore volume analysis
Fig. 3 shows the N2 adsorption isotherm and corresponding pore size distribution (PSD) of the ECNFs and O-ECNFs. According to the BET analysis, the O-ECNFs exhibited high surface area (115.6 m2 g−1) compared to that of the ECNFs (10.1 m2 g−1), as shown in Fig. 3a. The high surface area of the O-ECNFs is due to the abundance of microsized pores compared to the mesosized pores (2–50 nm) of the ECNFs. According to SEM and TEM images, The O-ECNFs still possessed nanofibers morphology with many defects on the outer walls and end caps that gave a significant increase in micropore volume, while keeping a noticeable mesoporosity. This suggests that oxidation of ECNFs with H2SO4/HNO3 mixture is an effective method to remove the amorphous carbon and carbon nanoparticles introduced by carbonization process, which appear as white spots in the ECNFs SEM image. This indicated that oxidation process is producing microsized pores with a keeping mesoporocity of ECNFs. Li who studied oxidized carbon nanotubes by different oxidized agents, also observed similar change (Li et al., 2003). The Barrett-Joyner-Halenda (BJH) pore size distribution (Fig. 3b) shows an intense peak at pore diameters <1 and 2 nm for ECNFs and O-ECNFs, respectively. This indicated that the micropores are dominant and their size distribution is narrow.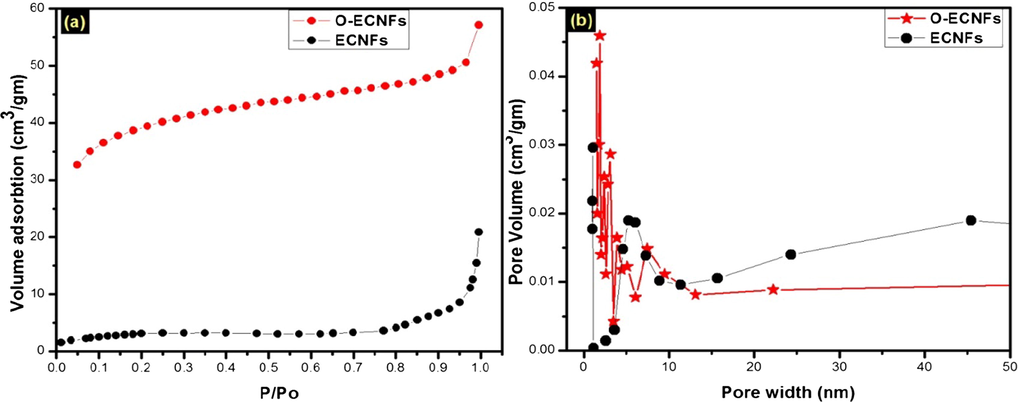
(a) Nitrogen adsorption isotherm and (b) pore size distribution.
3.1.3 FT-IR spectra
FT-IR spectroscopy was used to investigate the functional groups on the surface of ECNFs as well as the changes to the functional groups during the adsorption processes. As shown in Fig. 4, the pristine ECNFs was exhibited a characteristic absorption peak at 1577 cm−1 arising from the C—C stretching vibrations of polyaromantic C⚌C. The surface oxidation of ECNFs to form O-ECNFs was confirmed by the appearance of a broad and intense absorption peak at ∼3430 cm−1 corresponding to the stretching vibrations of isolated surface hydroxyl groups and/or carboxyl groups. In addition, the FT-IR spectra of O-ECNFs exhibited new peak at 1717 cm−1 corresponding to carbonyl groups (carboxylic acid, ketone, or lactone) on the surface of ECNFs after oxidation. Furthermore, the polyaromantic C⚌C band was shifted from 1577 to 1604 cm−1 after oxidation due to conjugation with carbonyl groups.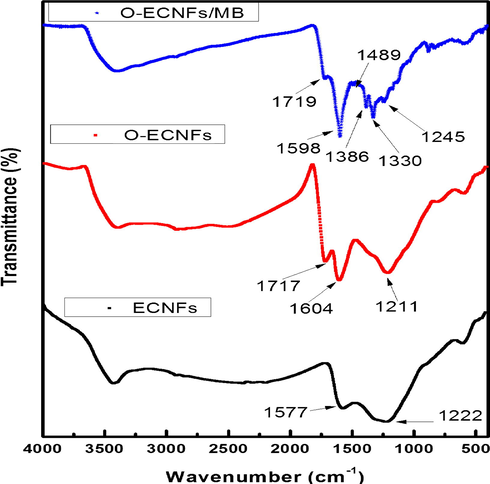
FT-IR of ECNFs, O-ECNFs, and O-ECNFs/MB.
After adsorption of MB, the FT-IR spectra of O-ECNFs exhibited new bands at 1489, 1386, and 1330 cm−1 that can be attributed to C⚌S+ vibration and stretching of the heterocycle and C—N stretching vibrations, respectively (Ovchinnikov et al., 2016). In addition, the peaks at 1717, 1604, and 1211 cm−1 shifted to 1719, 1598, and 1245 cm−1, respectively, due to MB adsorption by electrostatic forces on the negatively charged surface and π-π stacking interactions.
3.1.4 XRD analysis
To determine the composition of the crystalline and amorphous states of the carbon nanofibers, the as-prepared ECNFs and O-ECNFs were examined using powder XRD (Fig. 5). In the pristine ECNFs, the two broad peaks centered at 24.42° and 44.09° can be attributed to the (0 0 2) crystal plane of graphitic layer, and the (1 0 0) signal of turbostratic carbon plane, respectively (Peng and Lo, 2015). The broad shape of the peak indicated that the skeleton of the carbon nanofibers is mainly composed of amorphous carbon. The O-ECNFs showed similar patterns with slight peak shift for crystallographic plane of (1 0 0) from 44.09° for ECNFs to 42.80° for O-ECNFs. The average interlayer spacing, d002 and d101, was calculated using the Bragg equation:
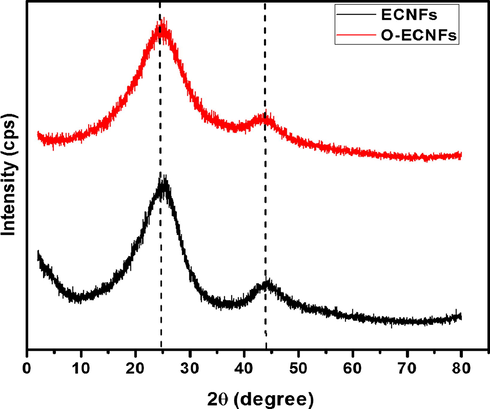
X-ray diffraction pattern of the ECNFs and O-ECNFs.
The microcrystallite sizes (L) of pristine and oxidized carbon nanofibers in the a- (stack width, La) and c-axes (stack highest, Lc) directions were quantitatively determined from the full width at half maximum (FWHM) of the diffraction peak according to the Scherer equation (Cullity, 1978).
Sample code
0 0 2 Peak
1 0 0 Peak
2θ
(°)
d0 0 2
(nm)FWHM (2θ)
Lc
(nm)2θ
(°)
d1 0 0
(nm)FWHM (2θ)
La
(nm)
ECNFs
24.42
0.364
8.41
0.977
44.09
0.205
5.48
3.20
O-ECNFs
24.60
0.361
9.80
0.838
42.80
0.211
9.64
1.81
3.1.5 Thermogravimetric analysis (TGA)
TGA analysis was used to study effect of acid treatment on the ECNFs by monitoring weight losses under an inert atmosphere (N2). Fig. 6 shows the weight loss as a function of temperature for the ECNFs and O-ECNFs. For ECNFs, the total weight loss was 7.11% from 30 to 600 °C, which indicated a high thermal stability of the unmodified fibers. Between 600 and 800 °C, significant weight loss was observed (15%), which can be attributed to the oxidation/combustion of amorphous phase. The TGA curve of the O-ECNFs exhibited three weight loss steps. The first step occurred at 50–120 °C, which is attributed to the evaporation of moisture on the surface the O-ECNFs. The second step was observed between 130 and 360 °C with a weight loss of 18.5%, which is ascribed to the decomposition of the phenolic groups and decarboxylation (Ros et al., 2002). The third step was observed between 370 and 560 °C, which may be due to the decomposition of the more stable oxygen functionalities (lactone, carbonyl, and quinones) (Chernyak et al., 2016). The residual mass of the O-ECNs/MB at 800 °C was 46.53% of the original compared to 39% for the O-ECNFs, which confirmed the adsorption of MB. Furthermore, the second step shifted from 195 °C in the O-ECNFs TGA curve to 225 °C for the O-ECNs/MB due the interaction between MB and O-ECNFs.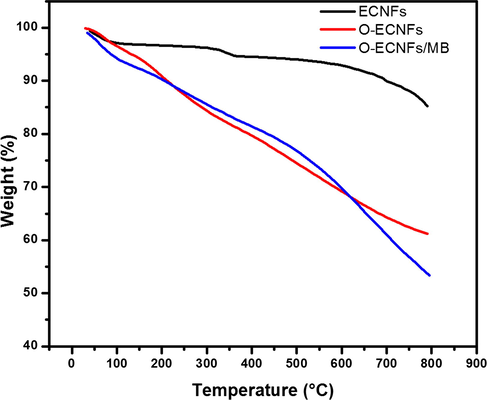
Thermal gravimetric analysis of ECNFs, O-ECNFs, and O-ECNFs/MB.
3.2 Adsorption studies
3.2.1 Effect of pH
Previously, it has been shown that the pH of the adsorbate solution significantly influences the adsorption process due its effect on the surface charge of the adsorbent and ionization of alkali-activated multiwalled carbon nanotubes (Ma et al., 2012). The adsorption of MB onto the O-ECNFs was attributed to the π-π interaction and electrostatic attraction between MB and the oxidized fiber, which increased with increasing hydrophilicity of the ECNFs after oxidation. Over the pH range of 2.5–9.0, the adsorption of MB onto ECNFs and O-ECNFs increased from 9.45 to 21.77 and 88 to 98 mg/g, respectively, as shown in Fig. 7a. It can be observed that, the removal of MB by using O-ECNFs remarkable higher than the ECNFs due to the ionization step by the functional groups on the surface of O-ECNFs. It is worth mentioning that, the adsorption of MB on the surface pristine ECNFs achieved by π-π interactions. Increasing pH results in ionization of carboxylic groups, created by oxidation of the ECNFs, to carboxylate anions. With increasing pH of solution, the O-ECNFs became more negatively charged than ECNFs due to the dissociation of the function groups, which could enhance the electrostatic interactions of MB ions with negative function groups and facilitate the MB adsorption. This is in agreement with the zeta potential values of O-ECNFs that remarkable decreased with increasing pH compared to ECNFs, as shown in Fig. 7b. The results obtained over a wide pH range are in agreement with those obtained by Vanyorek et al., who treated N-doped multi-wall carbon nanotubes with a mixture of H2SO4/HNO3 (Vanyorek et al., 2014).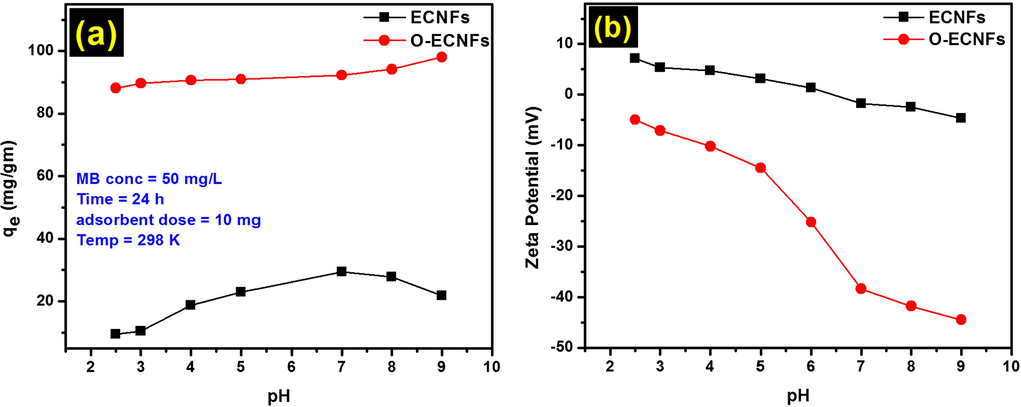
(a) Effect of pH on the adsorption of MB onto ECNFs and O-ECNFs; (b) zeta potential analysis.
3.2.2 Effect of adsorbent dosage
The effect of the amount of O-ECNFs the adsorption capacity of MB onto O-ECNFs was studied at adsorbent dosages ranging from 5 to 20 mg. As shown in Fig. 8a, the removal efficiency increased from 83.1% to 96.8%, which is attributed to the increase of adsorbent surface area and volume of the binding sites (Oyetade et al., 2016). On the other hand, the adsorption capacity decreased from 166.2 to 96.8 mg g−1 due to the increasing adsorbent dosage at the same concentration and volume of MB solution resulting in unsaturated adsorption sites (Oyetade et al., 2016). Based on these results, the optimal adsorption conditions for MB is 0.5 g of O-ECNFs in 1000 mL of a 50 mg L−1 dye solution.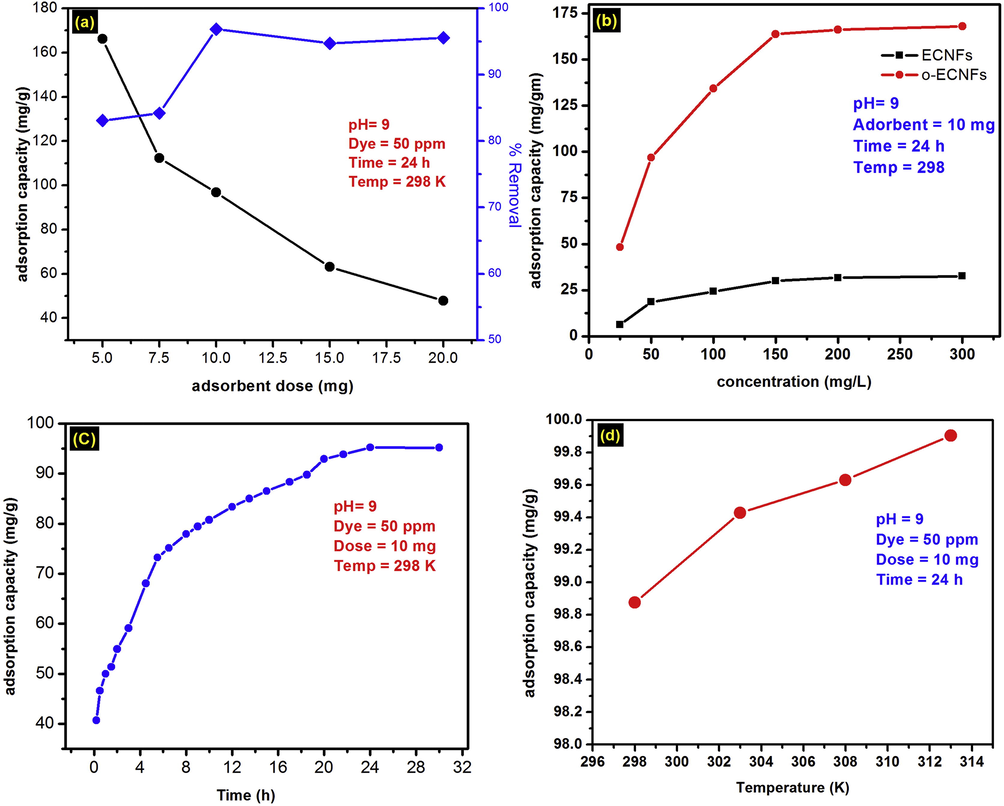
Effect of (a) adsorbent dosage, (b) initial MB concentration, (c) contact time, and (d) temperature on the adsorption of MB by O-ECNFs.
3.2.3 Adsorption isotherm
The influence of increasing MB concentration on the adsorption capacity was studied at concentrations ranging from 25 to 200 mg L−1 on ECNFs and O-ECNFs. The efficiency of the O-ECNFs far exceeds that of the pristine unoxidized ECNFs. As shown in Fig. 8b, the adsorption capacity of both pristine and oxidized ECNFs increased with increasing initial concentration of MB. Increased removal of MB per unit mass from 6.2 to 32.5 mg g−1 and 48.8 to 168 mg g−1 for ECNFs and O-ECNFs, respectively, was observed. The adsorption capacity of O-ECNFs is higher than that of ECNFs due to the electrostatic interactions between the surface functional groups of the fibers and MB. The adsorption capacity increased with increasing initial MB concentration due to the driving force provided by the higher concentration, which was sufficient to overcome the mass transfer resistance between the solid and liquid phases (Li et al., 2017).
3.2.4 Analysis of the isotherms
The isotherms show the relationship between the concentration of adsorbate in solution and the amount of adsorbate adsorbed by the adsorbent at equilibrium. In this study, Langmuir, Freundlich, Redlich–Peterson, and Dubinin–Radushkevich isotherms were fitted to the MB adsorption on O-ECNFs (Fig. 9). All models were analyzed nonlinearly using the origin software.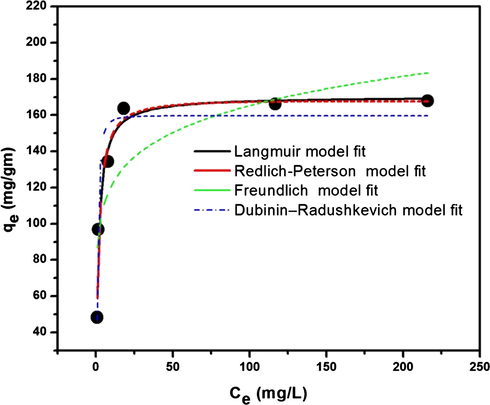
Adsorption isotherms of MB by O-ECNFs (Experimental conditions: pH = 9.0, m/V = 0.5 g L−1, t = 24 h, and T = 298 K).
The Langmuir isotherm model assumes homogeneity of the adsorbent surface and monolayer coverage by the adsorbate. This model can be represented by the following non-linear equation (Langmuir, 1918):
The Freundlich isotherm model more accurately describes heterogeneous surfaces or multilayers of adsorbent and can be describes as follows (Freundlich, 1906):
To test the nature of adsorption (physical or chemical) of MB onto the O-ECNFs, the Dubinin-Radushkevich (D-R) isotherm model was applied as follows (Dubinin and Radushkevich, 1947):
For the D-R isotherm model, from the KD-R values, the mean energy, E, can be calculated using the following equation:
If E is between 8 and 16 kJ mol−1, adsorption is achieved by chemical processes, whereas when E < 8 kJ mol−1 physical processes dominate.
The Redlich–Peterson (R-P) isotherm is a three-parameter empirical adsorption model that incorporates features of the Langmuir and Freundlich isotherm models. Due to its versatility, it can be used to represent adsorption equilibria over a wide concentration range and in homogeneous and heterogeneous systems. It has the following form (Redlich and Peterson, 1959):
The adsorption isotherms based on the experimental data and their parameter constants obtained from nonlinear fitting are shown in Fig. 9 and Table 3, respectively. According to the determination coefficient, the Langmuir, Redlich-Peterson, and Dubinin–Radushkevich isotherm models yielded better fits compared to the Freundlich model. The applicability of the Langmuir isotherm indicates homogeneity of the O-ECNFs surface and coverage by a monolayer of MB.
Isotherm model
Constants
Langmuir
KL
(L mg−1)Qo
(mg g−1)RL
at 50 mg L−1
R2
0.627
170.26
0.031
0.958
Freundlich
KF
(mg g−1)/(mg L−1)n
1/n
0.669
88.43
0.136
Redlich-Peterson
KR-P
(L g−1)β
aR-P
(mg L−1)−β
0.945
102.86
0.999
0.951
Dubinin-Radushkevich
qs
(mg g−1)KD-R
(mol2 kJ−2)E
(kJ mol−1)0.939
159.73
0.335
1.22
Table 3 shows that the monolayer adsorption capacity is 170.26 (mg g−1), and that the RL and 1/n values are less than unity and higher than zero, respectively, indicating that the adsorption of MB is favorable.
Based on the mean energy (E, 1.22 KJ mol−1) calculated by the D-R isotherm model, the adsorption of MB onto O-ECNFs is achieved by physical processes.
Table 4 shows a comparison of the maximum adsorption capacities of the O-ECNFs with various carbon nanomaterial adsorbents previously used for the MB removal. It can be seen that the O-ECNFs exhibit higher adsorption ability than most adsorbents reported in the literature.
Adsorbents
Adsorption capacity
(mg g−1)Reference
M-MWCNTs
48.06
Ai et al. (2011)
M-MWCNTs
54.54
Rodríguez et al. (2010)
CNFs
54.69
Rodríguez et al. (2010)
CNTs
64.70
Yao et al. (2010)
CNT aerogels
62.50
Tabrizi and Yavari (2015)
Oxidized CNTs
188.68
Li et al. (2013)
Oxidized ECNFs
172.12
This study
3.2.5 Adsorption kinetics
The adsorption of MB onto O-ECNFs was measured as a function of contact time to determine the optimum time required for maximum adsorption (Fig. 8c). The adsorption (qt) is rapid initially (∼0.2 h), and is followed by a sharp and linear adsorption increase until 5.5 h, which significantly slows after 5.5 h. The higher initial value of qt can be attributed to the increased number of free adsorption sites and facile penetration of MB through the vacant pores of the O-ECNFs network. During the later stages, the adsorption sites are occupied by MB molecules, and the number of available adsorption sited is greatly reduced, decreasing the rate of adsorption. The SEM image in Fig. 1D shows the compact surface of the O-ECNFs due to pore filling in the adsorbent with MB. In general, the adsorption of pollutants onto mesoporous and microporous adsorbents can require long periods of time to approach true equilibrium. This can be achieved by different mechanisms including electrostatic attraction, π-π interaction, and pores filling and involve many steps such as boundary layer and film diffusion, intraparticle diffusion, and equilibrium establishment (Kim et al., 2016; Malik, 2003).
3.2.6 Analysis of the kinetic study
Adsorption kinetics are important for describing the nature of the transient behavior of the solute moving from solution to the surface of adsorbent. The adsorption mechanism of MB onto the O-ECNFs was analyzed by four linear kinetic models including the pseudo-first-order, pseudo-second-order, Weber-Morris, and Boyd models. The pseudo-first-order (PFO) and pseudo-second-order (PSO) equations are the most widely used for studying the adsorption rates of solutes. The PFO (Lagergren, 1898) and PSO (Ho et al., 1996) kinetic models can be expressed by the following equations.
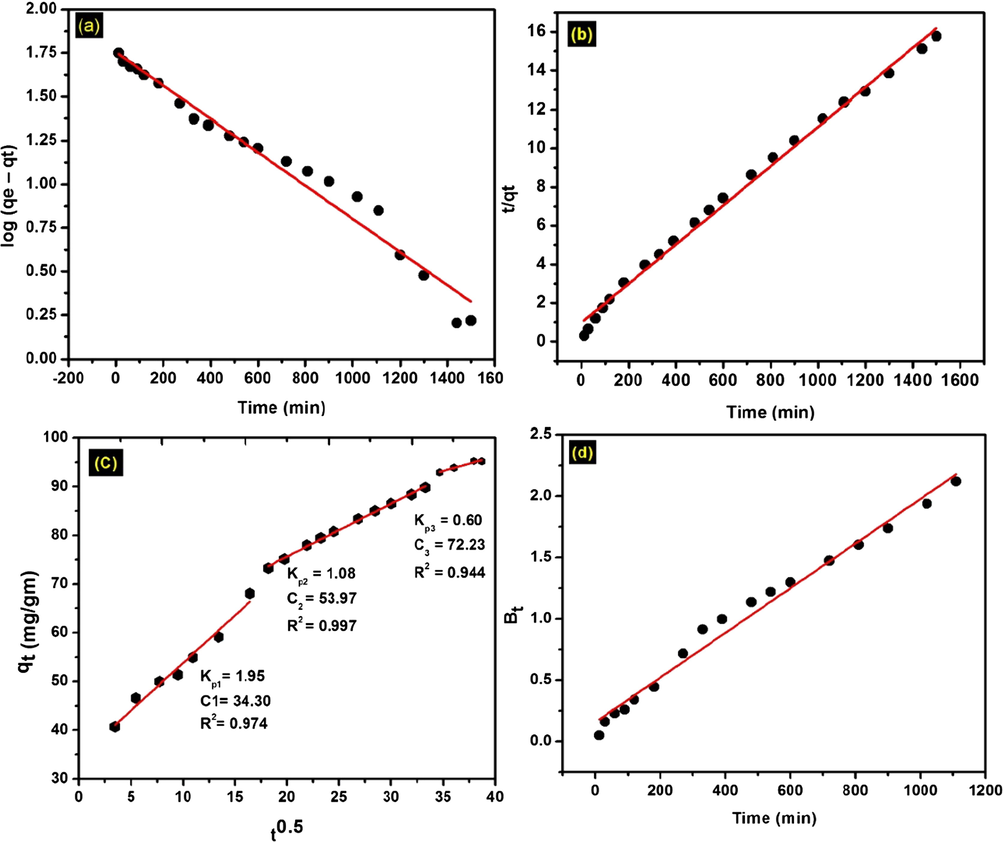
(a) Pseudo-first-order, (b) pseudo-second-order, (c) Weber-Morris, and (d) Boyd models for MB adsorption onto O-ECNFs.
To determine the steps involved in the adsorption process, the Weber-Morris intraparticle diffusion model was used to further analyze the kinetic results. This model is described by the following equation (Weber and Morris, 1963):
Fig. 10c shows the plot of the intraparticle diffusion model for MB adsorption onto O-ECNFs where the plot of qt against t0.5 is linear without passing through the origin. This indicates that the adsorption process was achieved in three stages.
The first stage involves the transport of MB from solution to the external surface of the O-ECNFs by outer diffusion, and the rate was higher than that of the second stage (Table 5). The second stage involves intraparticle diffusion of MB molecules through the pores of the O-ECNFs. The third stage was attributed to the adsorption of MB onto the surface sites. A similar phenomenon was observed in the adsorption of MB by magnetic multiwalled carbon nanotubes (Ai et al., 2011). The higher values of C and R2 (Table 4) indicated that the adsorption process involved intraparticle diffusion, but it was not the sole rate-controlling step.
Kinetic model
Constants
Pseudo-first-order
k1 (min−1)
qe,exep (mg/g)
qe,cal (mg/g)
R2
2.2 × 10⁻³
96.86
56.81
0.970
Pseudo-second-order
K2 (g mg−1 min−1)
qe,exep (mg/g)
qe,calc (mg/g)
0.994
0.11 × 10⁻³
96.86
98.62
Weber-Morris
Kp1 (mg g−1min−1)
Kp2 (mg g−1min−1)
C1
C2
0.968
1.95
1.15
34.298
51.845
Boyd
Linear equation Bt = 0.001 t + 0.1568
0.983
Thus, the Boyd kinetic model was used to determine the true rate-controlling step for MB adsorption onto O-ECNFs. This model was described by the following equation (Boyd et al. (1947)):
Eq. (16) can be rearranged into the following form:
The plot of Bt versus time is the Boyd plot, which can be used to distinguish between external transport (film diffusion) and intraparticle diffusion. If the plot is linear and passes through the origin, the adsorption process is governed by intraparticle diffusion, whereas if the line does not pass through the origin, film diffusion is the rate-controlling step. As shown in Fig. 10d, the Boyd plot is linear but does not pass through the origin, so film diffusion is the rate-controlling step. Furthermore, the R2 value of the plot is high (0.9837), suggesting that external transport is the rate-controlling step in MB adsorption onto the O-ECNFs. The results of the Boyd model further confirmed the rate-controlling mechanism of adsorption as indicated by the Weber-Morris kinetic model.
3.2.7 Effect of temperature
As shown in Fig. 8d, increasing temperature leads to an increase in the MB adsorption capacity of the O-ECNFs after 24 h. This suggests that MB adsorption onto O-ECNFs is endothermic. The increase in adsorption capacity was due to the penetration of MB molecules across the external boundary layer and through the internal pores of the carbon nanofiber with increasing temperature (Peng et al., 2014).
3.2.8 Thermodynamic study
Thermodynamic parameters play an important role in determining spontaneity and predicting the mechanisms of adsorption. The free energy of adsorption (ΔG°), enthalpy (ΔH°), and entropy (ΔS°) were calculated using the following equations:
The values of ΔG°, ΔH°, and ΔS° were calculated from the slope and intercept of van't Hoff plot (ln Kc versus 1/T), as shown in Fig. 11 and Table 6. The ΔG° values at all temperatures were negative and ranged between -11 and -16 kJ mol−1, which conformed the spontaneous nature of the adsorption process. The positive value of ΔH° and ΔS° indicated the endothermic nature of the adsorption process and good affinity of MB toward the O-ECNFs, respectively (Eskandarian et al., 2014).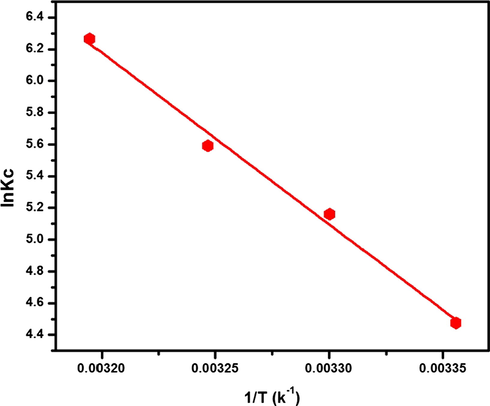
Van’t Hoff plot for evaluating the thermodynamic parameters for MB adsorption onto ECNFs.
T (K)
Van’t Hoff equation
Kc
ΔG°
(kJ mol−1)ΔH°
(kJ mol−1)ΔS°
(J K−1 mol−1)
298
y = −10822.16X + 40.81
R2 = 0.989187.86
−11.14
89.97
339.29
303
174.19
−12.84
308
268.42
−14.53
313
526.15
−16.23
4 Conclusion
Oxidized ECNFs, as nano-adsorbent for efficient removal of MB from aqueous solution, were fabricated using the electrospinning technique. This process involved fabrication of ECNFs, followed by carbonization and functionalization by acid treatment. The acid treatment produced functional groups on the surface of the ECNFs while maintaining their nano-morphology. The adsorption capacity towards MB of the O-ECNFs increased in alkaline media due the ionization of surface carboxylic groups and increased with increasing temperature. The optimal adsorption conditions for MB is 0.5 g of O-ECNFs in 1000 mL of 50 mg L−1 MB solution. The adsorption capacity O-ECNFs for MB at 25 °C is 170 mg g−1, larger than that of the ECNFs (32.5 mg g−1) due to the electrostatic interaction between the functional groups on the surface of the O-ECNFs and MB. In the kinetic studies, the adsorption data was best fit with the pseudo-second-order model and involved intraparticle diffusion, but external transport was the rate-controlling step. The experimental equilibrium data were fitted with the non-linear Langmuir, Freundlich, Redlich-Peterson, and Dubinin-Radushkevich models. The Langmuir (R2 = 0.958) and Redlich-Peterson (R2 = 0.945) isotherm models yielded a much better fit than that of the Freundlich (R2 = 0.669) isotherm model for describing MB adsorption. The thermodynamic study showed that MB adsorption onto O-ECNFs was spontaneous (ΔG°: −11.089 kJ mol−1 at 298 K) and endothermic (ΔH°: 89.975 kJ mol−1). Overall, it can be concluded that the O-ECNFs can be used as effective nanosorbents for cationic dye removal from aqueous solutions.
Acknowledgements
The project was supported by King Saud University, College of Science, Department of Chemistry. The authors thank the Deanship of Scientific Research and RSSU at King Saud University for their technical support.
References
- Dye sequestration using agricultural wastes as adsorbents. Water Resour. Ind.. 2015;12:8-24.
- [CrossRef] [Google Scholar]
- Removal of methylene blue from aqueous solution with magnetite loaded multi-wall carbon nanotube: kinetic, isotherm and mechanism analysis. J. Hazard. Mater.. 2011;198:282-290.
- [CrossRef] [Google Scholar]
- Electrospun preparation of microporous carbon ultrafine fibers with tuned diameter, pore structure and hydrophobicity from phenolic resin. Carbon N.Y.. 2014;66:705-712.
- [CrossRef] [Google Scholar]
- Improvement of the hydrophilicity of electrospun porous carbon nanofibers by grafting phenylsulfonic acid groups. J. Colloid Interface Sci.. 2013;394:177-182.
- [CrossRef] [Google Scholar]
- The exchange adsorption of ions from aqueous solutions by organic zeolites: II kinetics. J. Am. Chem. Soc.. 1947;69:2836-2848.
- [Google Scholar]
- Mechanism of thermal defunctionalization of oxidized carbon nanotubes. J. Phys. Chem. C. 2016;120:17465-17474.
- [CrossRef] [Google Scholar]
- Non-conventional low-cost adsorbents for dye removal: a review. Bioresour. Technol.. 2006;97:1061-1085.
- [CrossRef] [Google Scholar]
- Cullity, B.D., 1978. Elements of Diffraction.
- Equation of the characteristic curve of activated charcoal. Chem. Zentr. 1947;1:875-890.
- [Google Scholar]
- Evaluation of adsorption characteristics of multiwalled carbon nanotubes modified by a poly (propylene imine) dendrimer in single and multiple dye solutions: isotherms, kinetics, and thermodynamics. J. Chem. Eng. Data. 2014;59:444-454.
- [CrossRef] [Google Scholar]
- Sandwichlike magnesium silicate/reduced graphene oxide nanocomposite for enhanced Pb2+ and methylene blue adsorption. ACS Appl. Mater. Interfaces. 2014;6:14653-14659.
- [CrossRef] [Google Scholar]
- Pore and solid diffusion kinetics in fixed-bed adsorption under constant pattern conditions. I&EC Fundam.. 1966;5:212-223.
- [CrossRef] [Google Scholar]
- Decolorization of wastewater. Crit. Rev. Environ. Sci. Technol.. 2000;30:449-505.
- [CrossRef] [Google Scholar]
- Adsorption and desorption of methylene blue on porous carbon monoliths and nanocrystalline cellulose. ACS Appl. Mater. Interfaces. 2013;5:8796-8804.
- [CrossRef] [Google Scholar]
- Kinetic studies of competitive heavy metal adsorption by sphagnum moss peat. Environ. Technol. (United Kingdom). 1996;17:71-77.
- [CrossRef] [Google Scholar]
- Enhanced adsorption removal of methyl orange and methylene blue from aqueous solution by alkali-activated multiwalled carbon nanotubes. Appl. Mater. Interfaces 2012:5749-5760.
- [Google Scholar]
- Adsorption dynamics of methyl violet onto granulated mesoporous carbon: facile synthesis and adsorption kinetics. Water Res.. 2016;101:187-194.
- [CrossRef] [Google Scholar]
- Surface characterization and functionalization of carbon nanofibers. J. Appl. Phys.. 2008;103
- [CrossRef] [Google Scholar]
- About the theory of so-called adsorption of soluble substances. K. Sven. VETENSKAPSAKADEMIENS Handl.. 1898;24:1-39.
- [Google Scholar]
- The adsorption of gases on plane surfaces of glass, mica and platinum. J. Am. Chem. Soc.. 1918;40:1361-1403.
- [CrossRef] [Google Scholar]
- Activated carbon nanofiber produced from electrospun polyacrylonitrile nanofiber as a highly efficient formaldehyde adsorbent. Carbon N.Y.. 2010;48:4248-4255.
- [CrossRef] [Google Scholar]
- Adsorption of ciprofloxacin, bisphenol and 2-chlorophenol on electrospun carbon nanofibers: in comparison with powder activated carbon. J. Colloid Interface Sci.. 2015;447:120-127.
- [CrossRef] [Google Scholar]
- Efficient removal of organic pollutants from aqueous media using newly synthesized polypyrrole/CNTs-CoFe2O4 magnetic nanocomposites. Chem. Eng. J.. 2017;316:893-902.
- [CrossRef] [Google Scholar]
- Comparative study of methylene blue dye adsorption onto activated carbon, graphene oxide, and carbon nanotubes. Chem. Eng. Res. Des.. 2013;91:361-368.
- [CrossRef] [Google Scholar]
- Adsorption of cadmium (II) from aqueous solution by surface oxidized carbon nanotubes. Carbon N. Y.. 2003;41:1057-1062.
- [Google Scholar]
- Tannic acid adsorption and its role for stabilizing carbon nanotube suspensions. Environ. Sci. Technol.. 2008;42:5917-5923.
- [CrossRef] [Google Scholar]
- Direct evidence of IR-driven hot electron transfer in metal-free plasmonic W18 O49/Carbon heterostructures for enhanced catalytic H2 production. Appl. Catal. B Environ.. 2018;233:19-25.
- [CrossRef] [Google Scholar]
- Use of activated carbons prepared from sawdust and rice-husk for adsoprtion of acid dyes: a case study of acid yellow 36. Dye. Pigment.. 2003;56:239-249.
- [CrossRef] [Google Scholar]
- Study of removal of azo dye by functionalized multi walled carbon nanotubes. Chem. Eng. J.. 2010;162:1026-1034.
- [CrossRef] [Google Scholar]
- Kinetic and equilibrium modelling of the methylene blue removal from solution by adsorbent materials produced from sewage sludges. Biochem. Eng. J.. 2003;15:59-68.
- [CrossRef] [Google Scholar]
- Manifestation of intermolecular interactions in FTIR spectra of methylene blue molecules. Vib. Spectrosc.. 2016;86:181-189.
- [CrossRef] [Google Scholar]
- Nitrogen-functionalised carbon nanotubes as a novel adsorbent for the removal of Cu(ii) from aqueous solution. RSC Adv.. 2016;6:2731-2745.
- [CrossRef] [Google Scholar]
- Adsorption of anionic and cationic dyes on ferromagnetic ordered mesoporous carbon from aqueous solution: equilibrium, thermodynamic and kinetics. J. Colloid Interface Sci.. 2014;430:272-282.
- [CrossRef] [Google Scholar]
- Effect of microstructure and morphology of electrospun ultra-small carbon nanofibers on anode performances for lithium ion batteries. J. Electrochem. Soc.. 2015;162:A1085-A1093.
- [CrossRef] [Google Scholar]
- Carbon nanotubes as adsorbents in environmental pollution management: a review. Chem. Eng. J.. 2011;170:395-410.
- [CrossRef] [Google Scholar]
- Adsorption of dyes on carbon nanomaterials from aqueous solutions. J. Environ. Sci. Health. A. Tox. Hazard. Subst. Environ. Eng.. 2010;45:1642-1653.
- [CrossRef] [Google Scholar]
- Removal of disinfection byproducts from water by carbonized electrospun nanofibrous membranes. Sep. Purif. Technol.. 2010;74:202-212.
- [CrossRef] [Google Scholar]
- Methods of decoloration of textile wastewaters. Dye. Pigment.. 1998;37:335-356.
- [CrossRef] [Google Scholar]
- The removal of U(VI) from aqueous solution by oxidized multiwalled carbon nanotubes. J. Environ. Radioact.. 2012;105:40-47.
- [CrossRef] [Google Scholar]
- Activated carbon, carbon nanotubes and graphene: materials and composites for advanced water purification. J. Carbon Res. C. 2017;3:18.
- [CrossRef] [Google Scholar]
- Methylene blue removal by carbon nanotube-based aerogels. Chem. Eng. Res. Des.. 2015;94:516-523.
- [CrossRef] [Google Scholar]
- Electrospun mesoporous carbon nanofibers produced from phenolic resin and their use in the adsorption of large dye molecules. Carbon N.Y.. 2012;50:2877-2886.
- [CrossRef] [Google Scholar]
- Preparation of zero-valent Co/N-CNFs as an immobilized thin film onto graphite disc for methanol electrooxidation. Fibers Polym.. 2017;18:696-705.
- [CrossRef] [Google Scholar]
- Surface and electrosurface characterization of surface-oxidized multi-walled N-doped carbon nanotubes. Colloids Surfaces A Physicochem. Eng. Asp.. 2014;448:140-146.
- [CrossRef] [Google Scholar]
- Facile: In situ synthesis of plasmonic nanoparticles-decorated g-C3N4/TiO2 heterojunction nanofibers and comparison study of their photosynergistic effects for efficient photocatalytic H2 evolution. Nanoscale. 2016;8:11034-11043.
- [CrossRef] [Google Scholar]
- Kinetics of adsorption on carbon from solution. J. Sanit. Eng. Div.. 1963;89:31-60.
- [Google Scholar]
- Adsorption of reactive dye onto carbon nanotubes: equilibrium, kinetics and thermodynamics. J. Hazard. Mater.. 2007;144:93-100.
- [CrossRef] [Google Scholar]
- Adsorption behavior of methylene blue on carbon nanotubes. Bioresour. Technol.. 2010;101:3040-3046.
- [CrossRef] [Google Scholar]
- A review: carbon nanofibers from electrospun polyacrylonitrile and their applications. J. Mater. Sci.. 2014;49:463-480.
- [CrossRef] [Google Scholar]
- Polyacrylonitrile and carbon nanofibers with controllable nanoporous structures by electrospinning. Macromol. Mater. Eng.. 2009;294:673-678.
- [CrossRef] [Google Scholar]
- Development of carbon nanofibers from aligned electrospun polyacrylonitrile nanofiber bundles and characterization of their microstructural, electrical, and mechanical properties. Polymer (Guildf). 2009;50:2999-3006.
- [CrossRef] [Google Scholar]


