

Translate this page into:
Gasification char residues management: Assessing the characteristics for adsorption application
⁎Corresponding author. anisatikah@unimap.edu.my (Anis Atikah Ahmad)
-
Received: ,
Accepted: ,
This article was originally published by Elsevier and was migrated to Scientific Scholar after the change of Publisher.
Peer review under responsibility of King Saud University.
Abstract
Due to the world-wide energy crisis and economic issues, biomass has become a resource of global interest as an alternative to activated carbon (AC) produced using non-renewable feedstock (i.e. coal-based). The production of AC from biomass has been determined to be sustainable owing to the abundance of biomass resources on Earth. Biomass gasification has significantly gained market interest and was predicted to reach a value of USD 126 billion by 2023. A critical concern for the existing commercial gasification plants is the handling of char residues, which represent approximately 10% of the initial feedstock mass and are presently treated as waste. The conversion of these chars into AC that can be used for adsorption applications is a possible alternative. This review article focuses on evaluating the characteristic of the gasification char (GC) that is used for adsorption processes. The current AC production method was briefly reviewed. In addition, recent studies on adsorption using GC were explored and summarised.
Keywords
Activated carbon
Gasification char residues
Adsorption
Solid waste

1 Introduction
Biomass gasification has gained significant attention recently, particularly in developing countries. The IMARC Group estimated that the gasification market reached USD 78 billion in 2017 and anticipated an increasing trend up to USD 126 billion by 2023 (IMARC Group, 2017). Gasification is a thermochemical process where carbonaceous materials are converted into gaseous products at temperatures from 600 to 1000 °C, in the presence of a gasification agent, such as air, oxygen, steam, or a combination of these (Ahmad et al., 2016). The main product of gasification is synthetic gas (usually a mixture of H2, CH4, CO, and CO2), and its composition usually depend on the initial feedstock properties and operational conditions (Ahmad et al., 2016; Al-zareer et al., 2016; Galindo Al et al., 2014), whereby the by-products include char, tar, and water vapor. The gasification char (GC) is the irregularly shaped particles which comprised of unreacted carbon with several amounts of siliceous ash. It has well-developed pore properties and potentially become an excellent adsorbent or/and precursor for activated carbon (AC) production. The flow rates of biomass feedstock and gasification agent, equivalence ratio, reactor temperature, and pressure are among the important operating parameters that critically affect the process.
One of the challenges in biomass gasification industry is the solid waste disposal mostly in the form of char, which represents approximately 5–10% of the initial feedstock (De Gisi et al., 2016). Presently, char is treated as waste, which is considered to be an actual loss for plant owners (Benedetti et al., 2017) and no special disposal method has been employed. The growth of gasification industry will create a substantial increase in solid waste management problem. Hence, it is beneficial to seek an alternative application for GC. From the previous finding, GC has shown a reliable performance as an adsorbent in water and wastewater treatment application. However, the research on the GC application in adsorption is quite limited. Several reported literatures regarding its application in adsorption includes malachite green (MG) (Ahmad et al., 2021; Ahmad et al., 2020; Ahmad et al., 2020), rhodamine B (RhB) (Maneerung et al., 2016); methylene blue (MB) (Ahmad et al., 2023; Pessôa, 2019) & amaranth (AM) (Ravenni et al., 2020); congo red (CR) and crystal violet (CV) (Jung et al., 2019); sulphate (Runtti et al., 2016), phosphate & nitrate (Kilpimaa et al., 2015; Kilpimaa et al., 2014), nickel, iron and copper (Runtti et al., 2014); atenolol (ATN) (Ahmad et al., 2020), acetaminophen (ACE) and caffeine (Galhetas et al., 2014; Galhetas et al., 2014), diclofenac (DCF) (Back et al., 2020), toluene (Bhandari et al., 2014) and chromium (III) removal (Godinho et al., 2017; Dias, 2018).
2 Gasification char (GC)
Char is the unreacted carbonaceous solid residue obtained after the gasification process. The physical and chemical properties of char are significant to determine its potential applications. The sorption performance and pore characteristics of adsorbents depend on their physical and chemical properties.
2.1 GC physicochemical properties
The specific Brunauer–Emmett–Teller surface area (SBET), total pore volume (TPV), and average pore diameter (APD) of char are among the most important factors that influence its adsorption performance. The SBET of char is the ratio of the total pore surface area to the total char particle mass (You, 2017). The pore size determines the accessibility of the active sites and mass transfer limitation. According to the International Union of Pure and Applied Chemistry, micropores, mesopores, and macropores are pores featuring diameters of < 2, 2–50, and > 50 nm, respectively (Maneerung et al., 2016; Pessôa, 2019). Particles presenting different pore sizes can be expected to exhibit different behaviours during adsorption, as the pressure increases. The sorption behaviour in micropores is almost entirely dominated by the interactions between the fluid molecules and pore walls. By contrast, the sorption behaviour in mesopores depends not only on the fluid-wall attractions, but also on the attractive interactions between fluid molecules, which leads to multilayer adsorption and capillary condensation (Thommes, 2010).
The properties of GC are influenced by the gasificiation operating paremeter such as temperature and biomass equivalence ratio (ER). For instance, increasing the gasification temperature can promote the release of volatiles which subsequently increase the char porosity. However, too high temperatures may cause the break-down of pore walls and the consequent sintering of the material with consequent porosity reduction (Benedetti et al., 2017). Zhai et al. (Zhai, 2017) characterised sawdust char obtained at high gasification temperature in steam atmosphere using a fixed bed reactor and discovered that the carbon conversion rate increased as the reaction temperature, time, and steam flow rate increased. The SBET of sawdust ash increased from 948.84 and 987.61 m2/g when the temperature reached 800 and 1000 °C, respectively. Similar observation was found by Pelaez-samaniego et al. (Pelaez-samaniego et al., 2020) who gasified wood in 0.4 × 0.102 m (length × internal diameter) reverse downdraft gasifier. The upsurge trend of char SBET from 379 to 517 m2/g was reported with increasing temperature from 725 to 838 °C. This was due to the release of volatiles and tar at high temperatures (Tian et al., 2020). Besides, a remarkable improvement of pore structure was observed by Zhang et al. (Zhang et al., 2020) with the SBET and TPV prominently increased from 186 to 552 m2/g and 0.252 to 0.665 cm3/g, respectively, due to the increase of gasification rate in Boudouard reaction at high temperature. Higher gasification temperature could accelerate the carbon burn-off, leading to the broadening of the existing pores and thus enlarging the surface area or pore volume (Zhang et al., 2018; Zhang et al., 2018). However, at very high temperature (>1200 °C), the excessive consumption of the residual carbon matrix in the char could lead to the collapse of the developed porous structure; the blockage of some pores (due to enrichment of the inherent inorganic elements); and the fusion and sintering of the pores (Zhai, 2017). In general, increasing operating temperature can extremely increase the gasification reaction rate, but at very high temperature, the char surface area and pore volume may not be linearly improved.
Another important parameter in gasification is ER, which is defined as the ratio of the biomass mass flow rate to the air mass flow rate divided by the same ratio at the stoichiometry of the reaction considered (Palies, 2020). The increase in the relative biomass/air ratio resulted in producing more aromatic and stable char, and the increase in carbonisation reaction extent. Qian et al. (Qian, 2013) investigated the effects of biomass (switchgrass, sorghum straw and red cedar) and ER (0.20, 0.25 and 0.28) on the physiochemical properties of GC, and determined that as the ER increased, the ash content and SBET of most char increased, while the moisture and fixed carbon contents of the char decreased. Furthermore, using Fourier transform infrared spectra results, they concluded that the surface functional groups of char were found to differ between biomass types, but remained similar with the change in ER. Meanwhile, Liu et al. (Liu, 2018) reported that the volatile and fixed carbon of the chars decrease with ER rising, leading to the increase in the ash content. This was due to the increase in the ratio of oxygen and fuel with ER rising, resulting in more consumption of fixed carbon in the gas–solid reactions.
Char production was reported to increases from 0.15 kg/kg to 0.18 kg/kg when increasing ER from 1.6 to 4.6 (Hernández et al., 2016). Higher ER values also lead to a decrease in the bulk density of the produced char, which indicates the fuel conversion through the release of volatile matter and the conversion of a fraction of the remaining char via heterogeneous reactions (partial oxidation, steam reforming, and Boudouard reaction). Hernández et al. (Hernández et al., 2016) also reported that the carbon content of the char increases from 40% to 55% wt. when increasing the ER, which confirms the progressive carbonisation of the char. However, they found that all the obtained chars have low SBET (<70 m2/g), which is not suitable for adsorption application without further activation. In another study, GC from straw gasification was reported to have high SBET of 1027 m2/g (Hansen et al., 2015).
Maneerung et al. (Maneerung et al., 2016) reported that the char has high surface area after steam activation at 900 ⁰C, proving that activated GC generally have a higher SBET. They prepared AC from woody biomass gasification for dye adsorption and discovered that the SBET had a significant increment from 172 to 776 m2/g, which gave it high dye adsorption capability.
In their study on the rate of biomass gasification, Lundberg et al. (Lundberg et al., 2016) found that the SBET of the GC varied from 469 to 1581 m2/g, depending on different boundary conditions. Similarly, Dias et al. (Dias, 2017) compared the characteristics of chars from the gasification and pyrolysis of rice waste streams as potential adsorbent materials. They discovered that GC had SBET ranging from 26.9 to 62.9 m2/g, while pyrolysis chars lacked a porous matrix due to their high volatile matter content. The authors suggested that GC had favorable properties for adsorption and could be further developed for this purpose, whereas the pyrolysis chars required additional activation.
The choice of feedstock source can significantly affect the final properties of GC. Wood-based GC tend to have a higher SBET and TPV compared to other feedstocks (Oni et al., 2019). This can be attributed to the reduction of relatively large cell structures in wood to smaller pores during gasification, resulting in an overall increase in SBET (Weber and Quicker, 2018) and consequently, PV. The increase in SBET and TPV may also be related to the loss of micro-molecule organic compounds and volatilization of gases or water during gasification, leading to the creation of voids within the GC matrix (Ippolito, 2020). On the other hand, GC produced from manures/biosolids typically exhibit lower SBET, which is likely due to deformation, structural cracking, or micropore blockage during gasification, along with less distinct porous structures in the feedstock (Ahmad, 2014).
In a nutshell, the GC properties vary among the samples depending on the combination of gasification technology, temperature, gasification agent, ER and initial feedstock (Benedetti et al., 2017). Table 1 summarises the physical characteristics of GCs reported in the literature. ER = Equivalance ratio, a = Total micropore volume.
Feedstock
Type of gasifier
Gasification agent
Temperature (°C)
SBET (m2/g)
TPV
(10-3 cm3/g)Reference
Switchgrass
Fluidised bed
Air (ER = 0.28)
700–800
21
11.88a
(Qian, 2013)
Sorghum
Air (ER = 0.28)
5.6
2.14a
Red cedar
Air (ER = 0.25)
61
31.33a
Wheat straw pellet
Circulating fluidised bed
Steam
750
75
40
(Hansen et al., 2015)
Pine wood
Two stage
1000–1200
1027
580
Sieved pine wood
426
520
Dealcoholised marc of grape
Entrained flow
Air
1200
60
N/A
(Hernández et al., 2016)
Steam
1200
35
Activated mesquite wood chips
Downdraft fixed-bed
N/A
N/A
776
657
(Maneerung et al., 2016)
Soft wood chips
Bubbling fluidised bed
Steam
850
489
N/A
(Lundberg et al., 2016)
Soft wood pellets
1581
Sawdust
Fixed bed
Steam-air
800–1000
945–988
N/A
(Zhai, 2017)
Rice husk and polyethylene mixture
Bubbling fluidised bed
Steam-air
850
27–63
N/A
(Dias, 2017)
Wood chips
Downdraft
Air
∼650
352
240
(Benedetti et al., 2017)
Pellets
Rising co-current
Air
∼700
128
180
Wood chips
Downdraft
Air
∼650
78
80
Wood chips
Downdraft
Air
∼800
281
130
Wood chips
Dual-stage
Air
∼900
587
300
Wood chips
Dual-stage
Air
∼850
272
150
Pine wood
N/A
N/A
600–900
N/A
N/A
(Marks et al., 2016)
Switchgrass
Downdraft
N/A
N/A
64
90
(Bhandari et al., 2014)
Switchgrass
Fluidised bed
N/A
N/A
2
20
Pine wood
Updraft
Air
1000
183
90
(Huggins et al., 2015)
Poplar wood
Fluidised bed
Steam
750
573.8
219
(Ducousso et al., 2015)
Woodchip
Downdraft
Air
725–838
517
288.8
(Pelaez-samaniego et al., 2020)
Coal
N/A
CO2
800–950
346.74
262.7
(Liu, 2021)
Miscanthus
N/A
Steam
1000
981.75
566.5
(Tian et al., 2020)
Glyricidia sepium woodchip
Downdraft
Air
N/A
39.52
28.0
(Ahmad et al., 2020)
Woodchip
Downdraft
Air
N/A
257.96
87.5
(Ahmad et al., 2020)
Hevea brasiliensis root
Downdraft
Air
N/A
135.22
80.0
(Ahmad et al., 2021)
Numerous papers have been published on the characterisation of GCs. From the available data, the chars featuring high SBET and TPV values were gasified at high temperature and steam was used as gasification agent. The SBET and TPV values of GCs ranged from 2 to 1581 m2/g and 0.002 to 0.657 cm3/g, respectively, and these values were comparable with those of AC, which exhibited SBET and TPV values ranging from 500 to 2000 m2/g and 0.20 to 0.60 cm3/g, respectively (Marsh and Rodríguez-Reinoso, 2006). Therefore, these chars are suitable to be developed as low-cost adsorbents, as they are more affordable and their production require lower energy amounts than AC (since the production of GCs does not involve a carbonisation step). Moreover, the feedstocks for the production of GCs are abundant and are mainly obtained from biowastes.
Despite exhibiting good physical properties, GC cannot be used as sole indicator of good pollutants removal (Abdelhadi et al., 2017). Seredych et al. (Seredych et al., 2009) studied the removal of dibenzothiophene (DBT) and 4,6-dimethyldibenzothiophene (4,6-DMDBT) from effluents using different types of carbon and reported that, although the adsorption of DBT and 4,6-DMDBT was mainly due to the presence of small micropores in the structure of GC, the acidic groups located in the larger pores of the char additionally attracted the DBT and 4,6-DMDBT molecules via specific interactions. In addition, they suggested that the specific carbons that were required for the removal of DBT and 4,6-DMDBT should present high volumes of pores smaller than 10 Å coupled with certain numbers of strong acidic groups in the slightly larger pores, which would enhance the specific adsorption/surface reactions and at the same time would not block or limit the accessibility of the small pores. These findings demonstrated that the physical properties of chars are not the only factors that could affect the adsorption process. Therefore, it is important to study the chemical properties of GCs.
The chemical characteristics of GC that are relevant to adsorption applications include the carbon and ash contents, functional groups, aromaticity, and pH. Table 2 summarises the total carbon, ash, and elemental composition of several types of GCs. Char presenting high carbon content (50–90%) is suitable to be transformed into AC, which could be used for adsorption (Danish and Ahmad, 2018).
Feedstock
Technology
Gasification agent
Temperature (°C)
Carbon (%)
Fixed carbon (%)
Volatile matter (%)
Moisture (%)
Ash
(%)Reference
Switchgrass
Fluidised bed
Air (ER = 0.20, 0.25, 0.28)
700–800
43.19
15.01
70.36
9.7
4.62
(Qian, 2013)
Sorghum
40.68
17.46
68.1
9.39
5.05
Red cedar
47.51
15.62
71.79
8.5
4.09
Sorghum
Downdraft
Air (ER = 0.20)
850
67.9
66.8
12.2
0.8
20.2
(Qian et al., 2015)
Red cedar
66.4
71.7
22.8
1.0
4.5
Pine wood
N/A
N/A
600–900
79.34
N/A
8.0
N/A
10.79
(Marks et al., 2016)
Poplar wood
Fluidised bed
Steam
750
77.4
N/A
N/A
6.2
3.6
(Ducousso et al., 2015)
Glyricidia sepium woodchip based
Downdraft
Air
N/A
59.87
67.23
13.51
9.65
9.63
(Ahmad et al., 2020)
Woodchip
Downdraft
Air
N/A
58.74
75.88
10.79
8.16
5.17
(Ahmad et al., 2020)
Hevea brasiliensis root
Downdraft
Air
N/A
75.12
77.95
10.44
6.51
5.11
(Ahmad et al., 2021)
Corn stover
Fluidised bed
Steam
850
42.0
41.4
8.4
3.2
47.1
(Cheah et al., 2014)
Oak
76.9
N/A
N/A
0.3
N/A
Spruce wood chips
Downdraft
Air
800
87.6
N/A
N/A
N/A
N/A
(Ravenni et al., 2020)
Municipal solid wast
Downdraft
Steam + Air
N/A
48.3
23.6
26.0
N/A
50.4
(Jung et al., 2019)
Oil sludge
Furnace
Steam
900
5.61
0.13
12.49
1.05
86.33
(Zhiwei, 2021)
Woodchip
Dual stage
Air
850
91.4
N/A
N/A
N/A
4.2
(Benedetti et al., 2019)
Penicillin mycelial dreg and
Thermogravimetric analyzer
Steam
1000
59.64
N/A
N/A
N/A
29.47
(Yuan, 2021)
Pinus patula woodchip
Downdraft
Air
N/A
75.98
89.51
7.23
2.88
3.26
(Pelaez-samaniego et al., 2020)
Pine sawdust
Fixed-bed
CO2
N/A
84.83
79.80
19.68
2.01
0.56
(Zhang et al., 2020)
Data on functional groups provide information on the possible interactions between adsorbents and adsorbates. Carboxylic acids, anhydrides, lactones, lactols, and phenols, are acidic, carbonyl and ether groups are neutral, while quinone, chromene, pyrone, and nitrogen groups are basic (Zhai, 2017; Pelaez-samaniego et al., 2020). For AC (Tian et al., 2020; Zhang et al., 2020) and chars (Langley and Fairbrother, 2007), greater amounts of oxygen-containing surface functional groups (especially carboxyl) result in enhanced sorption capacities for metal ions in controlled aqueous media (Uchimiya et al., 2011).
Ogata et al. (Ogata et al., 2011) reported that the sorption capacity of wheat bran for heavy metals depended on the components of the sorbent (pectin and carboxyl groups). Zhong et al. (Zhong et al., 2018) modified commercial AC using nitric acid oxidation and heat treatment at different temperatures to produce different amounts of oxygen-containing surface functional groups. They determined that the oxygen-containing surface functional groups, especially carboxylic groups, controlled the adsorption of MB and methyl orange by AC. Meanwhile, Ducousso et al. (Ducousso et al., 2015) reported that phenol, ether, and quinone were determined to be the dominant oxygen-containing groups on the surface of wood chip gasification biochar. Stavropoulos (Stavropoulos et al., 2008) reported that the phenol adsorption capacity of AC could be enhanced by increasing the content of functional groups on its surface.
Generally the number of functional groups on the surface of GC is small owing to the significant loss of functional groups, such as hydroxyl, carboxyl, and carbonyl at high gasification temperature (Wiedner et al., 2013). Moreover, the number of functional groups also depends on the feedstock used for producing the char. A higher O/C ratio for a char material could indicate the presence of more functional groups (such as hydroxyl, carboxyl, and carbonyl), which could contribute to a higher cation exchange capacity value (Hansen et al., 2015; Lundberg et al., 2016), owing to the higher negative charge on the surface of the char (Xu et al., 2011). Scholars predicted that electrostatic interactions could occur between the negatively charged char surface and positively charged pollutants (Şolpan et al.).
A high degree of carbonisation removes the acidic functional groups of the feedstock, therefore causing the char surface to become basic (Shen et al., 2016). Depending on the feedstock used to produce char, the pH of GC is generally alkaline (7 < pH < 12) (Ippolito, 2020; Ahmad, 2014). The basicity of char is attributed to the presence of small amounts of oxygen-containing groups on its surface. These groups are responsible for the electrostatic interactions between the positively charged char and negatively charge pollutants. In addition, the presence of alkali and alkaline metals such as K and Ca also lead to the alkaline pH (Saffe et al., 2020).
The degree of aromaticity of GC is generally higher (Abdulrazzaq et al., 2014) at high temperature (Huggins et al., 2015; Ducousso et al., 2015). This indicates that GC presents high chemical stability, therefore making it suitable for soil amendment and adsorption applications.
In conclusion, the characteristics of char such as its porous structure, high SBET, large number of surface functional groups, and mineral content make it suitable as adsorbent for removing pollutants from the environment (Marsh and Rodríguez-Reinoso, 2006; Abdelhadi et al., 2017). The oxygen-rich functional groups, including C⚌O, C—O, and aromatic groups on the surface of GC could act as strong active sites and promote its adsorption capability (Xue, 2012).
3 Adsorption
Adsorption is a mass transfer process whereby elements gather at the interface of two different phases, such as gas–solid and liquid–solid (De Gisi et al., 2016; Xue, 2012). The adsorbed substance is called adsorbate, while the substance used to adsorb the adsorbate is called adsorbent. Adsorption can be either a chemical (chemisorption) (Aljeboree et al., 2017) or/and physical (physisorption) process (Toumi, 2018). Generally, for physisorption, the attractive forces between the adsorbate molecules and adsorbent are Van der Waals forces, which are weak in nature and result in reversible adsorption. On the other hand, if the attraction forces are due to chemical bonding, the adsorption process is called chemisorption. Chemisorption is characterized by the formation of strong chemical associations between the molecules or ions of adsorbate and the adsorbent surface, which are generally due to the exchange of electrons between them and thus, chemisorption is generally irreversible. In general, the adsorption process involves both chemical and physical adsorption.
Adsorption has been determined to be superior to other pollutants removal techniques owing to its flexibility and simplicity of design, high efficiency, insensitivity to toxic pollutants, and ease of operation compared to other removal techniques such as membrane separation, ion exchange, coagulation/flocculation, chemical oxidation, electrochemical, photochemical and biodegradation. Table 3 summarizes the advantages and disadvantages of various pollutant removal methods.
Technology
Advantages
Disadvantages
Adsorption
High efficiency, offer excellent quality of the treated effluent, simple operation (simple equipment, adaptable to many treatment process)
Ineffective to certain pollutants, issues on the disposal of adsorbent residues (elimination of the adsorbent requires incineration, regeneration or replacement of the material).
Membrane separation
Small space requirement, simple, rapid and efficient even at high concentrations
Investment costs are often too high for small and medium industries, high energy requirements, high maintenance and operation costs.
Ion exchange
Rapid and efficient process
Ineffective for certain target pollutants (disperse dyes, drugs, etc.), performance sensitive to pH of effluent, require regular inspection and unloading and loading of new exchange resins, which are disruptive to operations and mean ongoing operational costs
Coagulation/ Flocculation
Rapid and efficient for insoluble contaminants
(pigments, etc.) removalHigh sludge production and disposal issues, requires accurate chemical dosing (this may be an unsuitable wastewater treatment method if the inlet water quality fluctuates often
Advanced oxidation process
High efficiency, rapid
Sludge production, economically unfeasible, high chemical reagents and electricity consumption, formation of by-products
Electrochemical process
High efficiency (more effective and rapid organic matter separation than in traditional coagulation), does not require the addition of chemical reagents
High initial cost of the equipment, high electricity consumption
Photochemical process
No sludge production, rapid
The formation of by-products and power consumption
In adsorption, the removal efficiency depends on the pore characteristics and the surface functional groups of the adsorbent. This information can be examined from the physical and chemical properties of the adsorbent.
4 Activated carbon
Activated carbon is the generic term used to describe a family of carbonaceous adsorbents exhibiting highly amorphous and extensively developed internal pore structure. Activated carbon has been demonstrated to be an effective adsorbent for a wide variety of pollutants from aqueous or gaseous media. Moreover, AC is widely used owing to its exceptionally high surface area (500–1500 m2/g), well-developed internal microporosity (pore size distribution of < 1–100 nm), and wide spectrum of surface functional groups (carboxyl, carbonyl, hydroxyl, and amine) (Zhai, 2017; Danish and Ahmad, 2018). All these characteristics confer AC the extraordinary capacity to adsorb a great diversity of molecules (Ahmad et al., 2020).
Activated carbon can be prepared by physical and chemical activation. Physical activation consists of two steps. The first step involves carbonisation, whereby the precursor material is pyrolyzed in an inert atmosphere at medium–high temperature (300–800 °C) (Danish and Ahmad, 2018; Rivera-Utrilla et al., 2011). The product resulted after carbonisation is called char. The second step is the activation of char at high temperature (700–1000 °C) in the presence of activating agents, such as CO2 or steam. Since the reactivity of CO2 at high temperature is lower than that of steam, the activation process using CO2 can be easier to control, and therefore, CO2 is more commonly used as activating agent. Additionally, CO2 activation favours microporosity formation, while steam activation favours microporosity widening. Therefore, AC prepared using steam exhibits lower micropore volume, but larger meso- and macropore volumes than AC prepared using CO2 (Pallarés et al., 2018).
For chemical activation, the carbon sample is impregnated with various activation agent (e.g. KOH, ZnCl2, FeCl3, H3PO4, and H2SO4) (Shafeeyan et al., 2010; Sánchez-Polo and Rivera-Utrilla, 2002; Klasson et al., 2009), and subsequently, this mixture is pyrolyzed in a conventional furnace (Ribas, 2014) or microwave oven (Rodrigues et al., 2011). The resulting AC product often possesses a large surface area per unit of volume and multi-channel pores that aid the adsorption process (Ogungbenro et al., 2018). Activation agents facilitate the carbonaceous materials decomposition and enhance the carbon yield (Duan et al., 2017). KOH is widely applied and preferred as compared to other activators due to its major role in the improvement of specific surface area as well as porosity (produces wide and narrow micropores) (Singh et al., 2019). Liu et al. (Liu et al., 2012) reported that the AC prepared by KOH showed improvement in O-containing functional groups. Meanwhile, Shu et al. (Shu et al., 2013) found that the use of ZnCl2 required low energy consumption, but its volatility and toxicity posed a negative environmental impact. H3PO4 treatment offers low operating cost, but the AC specific surface area is somehow smaller than KOH activation (Rajapaksha, 2016).
AC can also be produced through physicochemical activation which combined physical and chemical activation process. It is conducted when chemical activator is not completely diffused which results in pore clogging. This process involves the sample impregnation with chemical agent followed by heating step with the existence of oxidizing gas at 200–900 °C (Chowdhury et al., 2011). The combination of physical and chemical activation promotes the improvement of the pores textural and chemical characteristics compared to single activation method (physical or chemical activation).
However, at industrial scale, physical activation is preferred, to avoid the use of chemicals, which can reduce both the costs of the process and associated pollution. In addition, it could be concluded that physical activation is more adequate than chemical activation for preparing AC intended for applications that require accurate control of pore size distribution (Prauchner and Rodríguez-Reinoso, 2012). Table 4 summarises the activation agents that have been studied for the synthesis of AC. TPV = Total pore volume, APD = Average pore diameter.
Feedstock
Activation agent
Application
SBET (m2/g)
TPV (cm3/g)
APD (nm)
Reference
Coffee grounds
H3PO4
Methylene blue and Nylosan Red removal
925.00
0.718
>3
(Reffas, 2010)
Celery residues
H2SO4
Congo red removal
24.93
0.041
N/A
(Mohebali et al., 2019)
Banana peels
KOH
Methylene blue and Co2+ removal
1396.60
0.750
N/A
(Yu et al., 2018)
Corn starch
KOH
Pyraclostrobin removal
160.60
0.095
2.37
(Suo, 2019)
Pistachio wood wastes
NH4NO3
Hg2+ removal
1448.00
0.901
2.48
(Sajjadi, 2018)
Alga (Ulva lactuca)
KOH
Cu2+, Cr3+, Cd2+, and Pb2+ removal
193.90
0.108
1.113
(Ibrahim et al., 2016)
Plum stones
H3PO4
Cd2+ and Pb2+, Ni2+, and chlorophenols removal
829.00
0.418
1.008
(Pap et al., 2017)
Glebionis coronaria L.
KOH
Cd2+ and Co2+ removal
174.30
N/A
N/A
(Tounsadi, 2016)
Apricot stones
H3PO4
Congo red removal
88.05
0.2641
17.632
(Abbas and Trari, 2015)
Date pits
FeCl3
Methylene blue removal
780.06
0.573
N/A
(Theydan and Ahmed, 2012)
Waste tea
H3PO4
Methylene blue and phenol removal
1398.00
1.177
N/A
(Gokce and Aktas, 2014)
Tomato stems
FeCl2
Congo red removal
971.00
0.576
2.782
(Fu et al., 2017)
Rice straw
KOH
Acetaminophen and ibuprofen removal
1330.50
0.522
N/A
(Nam et al., 2018)
Tara gum
FeCl3
Antipyrine removal
1680.00
0.990
N/A
(Bedia et al., 2018)
Caesalpinia ferrea seed pod wastes
ZnCl2
Captopril removal
1480.00
0.572
N/A
(Kasperiski, 2018)
Date palm tree fronds
CO2
N/A
1094.00
0.438
1.609
(Shoaib and Al-swaidan, 2015)
Rubber-seed shells
Steam
N/A
948.00
0.988
3.650
(Sun and Jiang, 2010)
Coffee grounds
KOH-steam
Phenol and methylene blue removal
1865.00
0.960
N/A
(Laksaci et al., 2017)
Crofton weed
CO2
N/A
1036.00
0.710
2.750
(Zhao-qiang et al., 2014)
Fish waste
Steam
N/A
N/A
N/A
N/A
(Fadhil et al., 2017)
Pinewood soot
Steam
Phenol and chlorine removal
470.00
1.300
N/A
(Trubetskaya et al., 2019)
Tyre carbon black
Steam
470.00
0.600
N/A
Beechwood soot
Steam
260.00
0.500
N/A
Wheat straw soot
Steam
400.00
N/A
N/A
Macadamia nut shells
Steam
N/A
844.00
0.4852
2.301
(Aworn et al., 2008)
CO2
487.00
0.2522
2.070
Corncob
Steam
675.00
0.3590
2.128
CO2
836.00
0.4258
2.042
Bagasse bottom ash
Steam
595.00
O.3953
2.679
CO2
546.00
0.3059
2.434
Sawdust fly ash
Steam
613.00
0.4926
3.216
CO2
816.00
0.5469
2.682
Rice husk fly ash
Steam
74.00
0.0532
2.894
CO2
39.00
0.0296
3.014
Previous studies mostly mentioned KOH, ZnCl2, FeCl3, H3PO4, and H2SO4 as activation agents for chemical activation to improve the textural properties and sorption capability of AC. However, it is worth highlighting that chemical activators such as NH4NO3 and FeCl2 are comparable with conventional activators. Meanwhile, steam and CO2 are commonly used for physical activation.
Presently, most of the CAC is synthesised from non-renewable precursors such as coke, pitch, and coal-based feedstock (Rashidi and Yusup, 2017). The major concerns when utilising these materials are related to their sustainability and high cost owing to the intensive regeneration and reactivation processes they have to undergo, which could also result in the degradation of their adsorption properties and subsequently affect the economic feasibility of the operation (Gupta et al., 2011). Another important AC precursor is coconut shell charcoal, which possess excellent properties as AC. However, the excessive demand of AC led to its mounting prices (Schaeffer, Jun. 2011), hence, other renewable, low-cost adsorbents that could be used on large-scale are needed. An adsorbent is considered “low-cost” if it requires little processing and is abundant in nature, or waste material from another industry, which has lost its economic value (Yagub et al., 2014).
5 Recent studies on adsorption applications
Khasri et al. (Khasri et al., 2018) studied the removal of MB using Pentace species sawdust AC (PSAC). They reported that the optimum activation conditions for PSAC were reached when the radiation power, radiation time, and impregnation ratio were 418 W, 6.4 min, and 0.5, respectively, which resulted in the 27% PSAC yield and 94% MB removal. They also reported that the SBET, TPV, and APD of PSAC were 914.15 m2/g, 0.52 cm3/g, and 3.19 nm, respectively.
The adsorption of acridine orange (AO) was studied using zinc oxide-almond shell AC powder (Zbair et al., 2018). Similar to the findings reported by Khasri et al. (Khasri et al., 2018), the adsorption of AO followed the pseudo second order kinetic model. The maximum removal of AO (99.43%) was achieved at neutral solution pH, when the concentration, temperature, and stirring time were 80 ppm, 40 °C, and 25 min, respectively. Zbair et al (Zbair et al., 2018) concluded that the electrostatic interactions, π-π interactions, and hydrogen bonding between AO and Zn2+/AC were the main possible phenomena involved in the adsorption mechanism.
Bouaziz et al. (Bouaziz et al., 2017) examined the potential of almond gum as low-cost adsorbent for the removal of MG from aqueous solutions. They studied the effects of the adsorbent dose, pH, contact time, particle size, initial dye concentration, temperature, and agitation on dye removal, and reported that the kinetic behaviour was similar with those observed by Khasri et al. (Khasri et al., 2018) and Zbair et al. (Zbair et al., 2018). Based on the thermodynamic changes in enthalpy, entropy, and free energy, Bouaziz et al. (Bouaziz et al., 2017) concluded that the adsorption of MG on the surface of almond gum was endothermic and occurred spontaneously.
The ability of pomelo peels to remove MB from aqueous solution was enhance by pre-treating them with ultrasounds at 30, 60, and 90% amplitude (Low and Tan, 2018). It was determined that the pre-treated pomelo peels required shorter time to reach their higher saturation limit of the adsorption capacity than the non-treated ones. The Dubinin–Radushkevich model fitted the adsorption isotherm data very well compared to the Langmuir, Freundlich, and Temkin models.
Ahmed & Hameed (Ahmed and Hameed, 2018) prepared pyrolyzed barley straws char for the adsorption of salicylic acid. They investigated the effects of the initial salicylic acid concentration (50–250 ppm), contact time (0–24 h), initial pH (3–11), and temperature (25–45 °C) on the adsorption performance of char, and reported that the equilibrium data fitted well to the Langmuir isotherm, the maximum salicylic acid uptake of 210.6 mg/g being reached at 45 °C. Moreover, they concluded that the adsorption of salicylic acid by char was spontaneous, endothermic, and occurred through chemisorption.
Wheat straw ash was used to synthesise NaY zeolite for the adsorption of tetracycline using the sol–gel method (Ali et al., 2018). The characteristics and effectiveness of NaY as adsorbent for tetracycline were evaluated, and it was determined that the SBET and TPV of the prepared NaY were 657.4 m2/g and 0.34 cm3/g, respectively. The Langmuir equation was successfully applied to analyse the isotherm data, and revealed the maximum equilibrium uptake of 230.7 mg/g at 50 °C.
Ogata et al. (Ogata et al., 2018) prepared wheat bran (WB) for the adsorption of Mo. They used virgin WB, calcined WB (at 200 to 1000 °C), and HCl treated WB (at HCl concentrations from 0.01 to 6.0 mol/L) and reported that the SBET of the calcined WB was larger than that of virgin WB. However, the amount of Mo adsorbed on the virgin WB was greater than that adsorbed on the WB treated using different concentrations of HCl. They concluded that the Mo adsorption mechanism was related to the three-dimensional protein structure of WB.
Table 5 summarises the findings of recent adsorption studies. SBET = specific Brunauer–Emmett–Teller surface area, TPV = total pore volume, APD = average pore diameter, PZC = point of zero charge, PSO = pseudo second order, PFO = pseudo first order, and HSDM = Homogeneous solid diffusion model, MB = methylene blue, AO = acridine orange, MG = malachite green, CR = congo red, OII = orange II, IR = impregnation ratio, qm = maximum monolayer adsorption capability, qs = Dubinin-Radushkevich constant related to adsorption capacity.
Feedstock
Physical properties
Activation conditions
Application
Adsorption capacity (mg/g)
Kinetics
Isotherm
Reference
Medical waste
SBET: 1379 m2/g
TPV: 0.778 cm3/g
APD: 2.25 nmPyrolyzed in an N2 atmosphere at 600 °C, KOH activation IR: 1,
calcined at 800 °CMB and reactive yellow (RY) removal
922.2 (MB)
343.4 (RY)PSO
Langmuir
(Ullah, 2022)
Peanut shell
SBET: 179.3 m2/g
TPV: 0.08 cm3/g
APD: 1.7 nmCarbonization & CO2 activation flow rate: 100 mL/min, heating rate: 5 °C/min
Naphthenic acids removal
884
Elovich
Langmuir
(Campos et al., 2022)
Pinecone, white popinac, and sugarcane bagasse biochar
N/A
Pyrolyzed in an N2 atmosphere at 550 °C for 4 hr and mixed with FeSO4‧7 H2O, and MnSO4 ‧ H2O at
Cu2+ removal
32.7–43.1
PSO
Langmuir
(Huang et al., 2023)
Butiacapitate residue
SBET: 914.15 m2/g
TPV: 0.52 cm3/g
APD: 3.19 nmTreatment with ZnCl2 IR: 1 and heating at 105 °C (48 h)
Paracetamol and ketoprofenon removal
134.52
N/A
Monolayer & double layer process model
(Yanan, 2022)
Pentace sawdust
SBET: 914.15 m2/g
TPV: 0.52 cm3/g
APD: 3.19 nmPower: 418 W
Time: 6.4 min
KOH IR: 0.5MB removal
357.14
PSO
Redlich Peterson
(Khasri et al., 2018)
Zinc oxide-almond shell
SBET: 1391.0 m2/g
TPV: 1.26 cm3/g
APD: 3.21 nmTemperature: 300 °C (2 h) then 800 °C (3 h) at 10 °C/min.
KOH IR: 5AO removal
909.1
PSO
Langmuir
(Zbair et al., 2018)
Almond gum
N/A
No activation
MG removal
196.07
PSO
Freundlich
(Bouaziz et al., 2017)
Pomelo peel (ultrasound pre-treated)
N/A
No activation
MB removal
113.14 (qs)
1883.88 (qm)N/A
Dubinin–Radushkevich
(Low and Tan, 2018)
Barley straw
SBET: 435.52 m2/g
TPV: 0.241 cm3/g
APD: 2.216 nmNo activation
Salicylic acid removal
210.56
PSO
Langmuir
(Ahmed and Hameed, 2018)
Wheat straw ash
SBET: 657.44 m2/g
TPV: 0.341 cm3/gNo activation
Tetracycline removal
230.69
PSO
Langmuir
(Ali et al., 2018)
Wheat bran
SBET: 0–260.9 m2/g
No activation
Mo removal
84.0
PSO
Langmuir
(Ogata et al., 2018)
Carbonised cellulose
N/A
No activation
Diclofenac sodium removal
27.3
PSO
Langmuir
(Feng et al., 2018)
Cashew nuts
SBET: 1871 m2/g
TPV: 1.254 cm3/gTreatment with ZnCl2 IR: 1.5 and carbonisation at 400 °C (2 h)
MB removal
456
N/A
Langmuir
(Spagnoli et al., 2017)
Pyrolyzed crab shells
SBET: 81.57 m2/g
TPV: 0.0861 cm3/g
APD: 4.22 nmNo activation
(only carbonisation by pyrolysis)MG and CR removal
12 502 (MG)
20 317 (CR)PSO (MG)
PFO and PSO (CR)Langmuir
(Dai, 2018)
Prunus dulcis leaves
SBET: 426.346 m2/g
TPV: 0.282 cm3/g
APD: 2.644 nmTreatment with NaOH IR: 5 and heating at 50 °C (4 h)
Acid green 25 removal
50.79
PSO
Langmuir
(Jain and Gogate, 2018)
Acacia mearnsii waste
SBET: 4.867 m2/g
Steam explosion (remove tannins)
Acetone + H2SO4 (acetosolv treatment)Crystal violet removal
280
HSDM
Freundlich
(Pereira et al., 2018)
Yerba mate
SBET: 20.74 m2/g
PZC = 4.7No activation
OII and MB removal
47 (OII)
52 (MB)PSO
Sips
(Albadarin et al., 2018)
Inula viscosa leaves
N/A
N/A
Zn2+ removal
N/A
PSO
Langmuir
(Rouibah, Jan. 2023)
Olive waste residue
PZC = 6.6
Treatment with KOH (0.2 M)
MB removal
504.9
N/A
Langmuir
(Ferkous, 2022)
Cotton fiber waste
N/A
Treatment with ZnCl2 IR: 1 and pyrolyzing at 500 °C (1 h)
CI Reactive Red removal
970.34
PSO
N/A
(Behloul, 2022)
Recent adsorption studies indicated the increasing trend in the utilisation of low-cost materials from agricultural residues as well as new applications of char for adsorbing polluting pharmaceutical compounds. However, the agricultural residue from biomass gasification plants (which is GC), has not been well explored yet.
6 Previous studies on liquid adsorption applications using GC residues
Contrarily to other materials used for adsorption studies, the use of gasification residues is scarcely found in the literature. The literature regarding its application in adsorption is somewhat limited to ion and dye removal. Only few researchers reported the emerging contaminant adsorption utilizing GC as adsorbent or precursor for AC.
6.1 Ion removal
The activated char from pine and spruce gasification have been used for removing nitrate and phosphate ions (Kilpimaa et al., 2015; Kilpimaa et al., 2014). Both physical and chemical activation was conducted using char from a downdraft gasifier. Physical activation by CO2 at high temperature was found to be the most effective process. The maximum monolayer adsorption capability (qm) of activated char for phosphate and nitrate removal was 80 and 20.5 mg/g, respectively. Similar type of char (pine & spruce) was used by Runtti et al. (Runtti et al., 2014) who studied the adsorption of iron, copper and nickel ions. They gasified the wood chips at a rate of 50 kg h − 1 in a 150 kW downdraft gasifier, operating at 1000 ⁰C. They found that the removal of metal ions by GC with and without chemical activation was 2–5 times greater than commercial AC. The highest maximum experimental sorption capacities (qm,exp) for iron, copper and nickel by GC were 20.5, 23.1 and 18.2 mg/g, respectively. They concluded that the GC (with and without chemical activation) could be utilized in wastewater treatment due to their high adsorption efficiency. In another study, Runtti et al. (Runtti et al., 2016) chemically activated GC using ZnCl2, BaCl2, CaCl2, FeCl2 and FeCl3, for sulphate removal. They revealed that the removal of sulphate ions using FeCl3 was notably higher (qm, exp = 19.55 mg/g) compared to the unmodified GC residue and commercially available AC (q m, exp = 7.59 mg/g). The sorption data exhibited PSO kinetics, while the isotherm analysis indicated that the sorption data can be represented by the bi-Langmuir isotherm model.
Godinho et al. (Godinho et al., 2017) analysed the efficiency of chars obtained from the gasification and co-pyrolysis of rice wastes as adsorbents of Cr3+ ion from aqueous solutions, and concluded that GC was very efficient to remove Cr3+ ion from aqueous solutions, without requiring further activation. A similar study was conducted by Dias et al. (Dias, 2018), who determined that rice waste chars obtained from steam-oxygen gasification presented higher Cr3+ ion removal efficiencies and uptake capacities than CAC. Although the prepared chars in this study were very effective for removing Cr3+ from aqueous solutions (by both precipitation and adsorption), the char (80% rice husk w/w + 20% w/w polyethylene, with the solid/liquid ratio of 5 mg/L) only presented better results than CAC for the removal of Cr3+ from industrial wastewater when precipitation occurred.
6.2 Dye removal
Another application of GC in adsorption was discussed by Jung et al., (Jung et al., 2019), who studied the removal of CR and CV dye using the GC from municipal solid waste. They reported that adsorption performances were higher for municipal solid gasification waste at lower steam rate (37 kg/h) and higher air supply rate (214 Nm3/h, ER = 0.36), which were 49.7 mg/g and 356 mg/g for CR and CV adsorption respectively, suggesting that higher air supply rate with lower steam rate were effective gasification process conditions.
Meanwhile, Maneerung et al. (Maneerung et al., 2016) investigated the removal of RhB using AC from the gasification of mesquite wood chips in a downdraft fixed-bed gasifier, and reported that the prepared AC exhibited high RhB adsorption capability. This was due to its high SBET (776.5 m2/g) and the abundance of carboxyl and hydroxyl groups on its surface. The study also revealed that the equilibrium data ideally fitted to the Langmuir isotherm, the maximum monolayer adsorption capability of AC being 189.8 mg/g, and concluded that, the utilisation of GC as a precursor of AC lowered the AC production cost, offered a cost effective and environmentally friendly method of recycling char, and lessened the environmental problems related to its disposal.
The removal of MG dye was also reported using GC from gasified Hevea brasiliensis root (Ahmad et al., 2021), gasified Glyricidia sepium (Ahmad et al., 2020) and gasified wood chip (Ahmad et al., 2020) in batch and fixed bed column adsorption. All the GCs were physicochemically activated via microwave irradiation technique with the aid of KOH and CO2 as the activation agent. The adsorption capacity and production cost of gasified Hevea brasiliensis root, gasified Glyricidia sepium and gasified wood chip were 259.49 mg/g and 0.23 USD/ kg; 230.47 mg/g and 0.54 USD/ kg; and 226.06 mg/g and 0.23 USD/ kg, respectively.
Another application of GC in cationic dye removal was reported by Pessôa et al. (Pessôa, 2019) and Ravenni et al. (Ravenni et al., 2020) using GC derived from açaí berry (Euterpe oleracea Mart) residues and woodchips, respectively. Pessôa et al. (Pessôa, 2019) discovered that the NaOH-activated GC improved the SBET from 1.94 to 491.90 m2/g which led to the increase of MB adsorption capacity from 33.73 to 93.23 mg/g. The performance of activated GC was also tested in raw textile wastewater, which exhibited a reduction of 84.62% in the effluent Biochemical Oxygen Demand (BOD). Meanwhile, Ravenni et al. (Ravenni et al., 2020) reported slightly lower MB adsorption capacity (25.1 mg/g) than Pessôa et al. (Pessôa, 2019), probably due to no GC activation prior to the adsorption as well as different type of GC feedstock was used. Ravenni et al. (Ravenni et al., 2020) also concluded that the performance of GC for cationic dye-MB (25.1 mg/g) and anionic dye-AM (25.3 mg/g) adsorption were comparable with commercially available AC (25.4 and 23.5 mg/g for MB and AM, respectively).
6.3 Emerging contaminant removal
Galhetas et al. (Galhetas et al., 2014) used K2CO3 to activate pine gasification residue for the adsorption of ACE. In another study, Galhetas et. al (Galhetas et al., 2014) also used the gasification residue of pine and coal for ACE and caffeine adsorption from aqueous solutions. They reported that activated pine produced porous materials that aided the ACE and caffeine adsorption processes, which were ruled by the micropore size distribution of the carbons. They concluded that the surface chemistry seemed to be the determinant factor that controlled the affinity of caffeine towards carbons.
Another use of GC for emerging contaminant removal was reported by Ahmad et al. (Ahmad et al., 2020). In this study, the Glyricidia sepium woodchip (GGSWAC) was activated via microwave irradiation techniques with the aid of KOH and CO2 as the chemical and physical agents for ATN adsorption. The BET surface area increased from 39.52 to 483.07 m2/g after the activation step. It was found that the ATN adsorption fitted well to n-BET model indicating a multilayer adsorption with the saturation capacity of 121, 143 and 163 mg/g at 30, 45 and 60 °C, respectively. Meanwhile, the kinetic study showed that the ATN adsorption followed Avrami model equation with R2 = 0.99. In addition, the adsorption of ATN onto GGSWAC was endothermic (ΔHS° = 234.17 kJ/mol) in the first layer of adsorption and exothermic in the subsequent layer (ΔHL° =-165.62 kJ/mol). The ATN adsorption was controlled by both diffusion and chemisorption. In continuous operation, the Thomas and Yoon–Nelson models successfully predicted the ATN adsorption with R2 of 0.9822 and 0.9817, respectively. Table 6 summarises the literature findings on the adsorption applications of GC residue. SBET = specific Brunauer–Emmett–Teller surface area, RhB = rhodamine B, GC = gasification char, PC = pyrolysis char, AC = activated carbon, CAC = commercial activated carbon, RH = rice husk, RS = rice straw, PE = polyethylene, ID = internal diameter, L = length, L/S = liquid/solid ratio, S/L = solid/liquid ratio, AM amanth dye, CR = congo red dye, CV = crystal violet dye, ATN = atenolol, ACE = acetaminophen, DCF = diclofenac, MB = methylene blue dye, MG = malachite green dye. Summary: Publications on adsorption using GC residue are rather scarce. Based on the limited literature consulted, the adsorption performance of GC residue was demonstrated to be comparable with that of CAC. The sorption process can be further enhanced by various activation processes that could improve the porosity and surface area of char.
Feedstock
Technology
SBET (m2/g)
Application
Activation
Adsorption capacity (mg/g)
Remarks
Reference
Agent
T (°C)
SBET (m2/g)
Hevea brasiliensis root
Downdraft
135.22
MG
KOH-CO2
N/A
477.74
259.49
Monolayer and multilayer adsorption involved
(Ahmad et al., 2021)
Glyricidia sepium
Downdraft
39.52
MG
KOH-CO2
N/A
633.30
230.47
Glyricidia sepium possessed excellent characteristics for BG4 and ATN removals due to high SBET
(Ahmad et al., 2020)
Downdraft
39.52
ATN
KOH-CO2
N/A
483.07
163
(Ahmad et al., 2020)
Woodchip
Downdraft
257.96
MG
KOH-CO2
N/A
351.93
226.06
The optimum activation conditions (radiation power = 616 W, impregnation ratio = 1.06, time = 1 m) resulted in 99.01% MG dye removal
(Ahmad et al., 2020)
Mesquite wood
Downdraft fixed-bed gasifier
776.46
RhB
CO2
700
485.20
189.83
prepared AC exhibited high dye adsorption capability
(Maneerung et al., 2016)
800
736.65
900
N/A
Steam
700
538.98
800
736.94
900
776.46
N2
700
177.74
800
280.02
900
286.90
Açaí berry seeds
Downdraft
1.94
MB
NaOH
491.90
93.23
Maximum adsorption capacity increased 173% in comparison to non-activated açaí biochar.
(Pessôa, 2019)
Woodchip
Downdraft
598
MB
AM–
–
–
25.1
25.3GC showed a comparable removal efficiency with CAC
(Ravenni et al., 2020)
Municipal Solid waste
Downdraft
(low steam rate)11.4
CR
–
–
–
49.7
Higher air supply rate with lower steam rate were effective gasification process conditions for CR and CV adsorption
(Jung et al., 2019)
CV
356
Downdraft
(high steam rate)2.73
CR
–
–
–
35.7
CV
235
Pine and spruce
150 kW air-blown downdraft gasifier
(T = 1000 °C)52.4
SO42-
ZnCl2
BaCl2
CaCl2
FeCl3
FeCl2
500
500
500
500
500
52.4
19.5FeCl3-modified carbon residue is a potential sorbent for SO42- ion removal which removed SO42- ions better than CAC in the concentration range of 50 to 1000 mg/L
(Runtti et al., 2016)
Pine and spruce
150 kW air-blown downdraft gasifier
(T = 1000 °C)52.4
PO43- and NO3–
CO2
CO
N2
ZnCl2
HCl
H2SO4
KOH
HNO3
600–800
600–800
600–800
N/A
N/A
N/A
N/A
N/A152–590
126–135
145–160
285
194
157
117
25920.5
(PO43-)
80
(NO3–)The sorption capacity can be improved by chemical activation
(Kilpimaa et al., 2015; Kilpimaa et al., 2014)
Pine and spruce
150 kW downdraft gasifier
(T = 1000 °C)14.4
Ni2+, Fe2+, and Cu2+
ZnCl2
N/A
259
18.2 (Ni2+)
20.5 (Fe2+)
23.1 (Cu2+)The amounts of pollutants removed by carbon residue with and without activation were higher than those removed by CAC.
(Runtti et al., 2014)
Pine
Fluidised bed reactor (gasification agent = air, T = 850 °C)
101
Acetaminophen and caffeine
K2CO3
700
800570
1509434.8 (ACE)
476.2 (Caffeine)The increase in temperature resulted in an increase in the sorption capacity
(Galhetas et al., 2014; Galhetas et al., 2014)
Spruce woodchip
Floating-fixed-bed
308.15
DCF
–
–
35.09
-
(Back et al., 2020)
RH (GC)
RH + PE (PC)Steam gasification and co-pyrolysis
N/A
Cr3+
N/A
N/A
21.1 (GC)
1.44 (PC)GC is better adsorbent than PC.
100% removal
GC presented the highest uptake capacity(Godinho et al., 2017)
50% w/w RH + 50% w/w RS
80% RH w/w + 20% w/w PEBubbling fluidised bed
reactor using steam–air as gasification agent25
<5Cr3+
N/A
N/A
N/A
8.51
6.2Sorption capacity of GC significantly higher than CAC.
The high mineral content of chars played an important role(Dias, 2018)
7 Adsorption mechanisms
The adsorption process involves intermolecular transfer of adsorbate onto the solid surface of the adsorbent. The physical adsorption is carried out mainly through hydrogen bonding, electrostatic interaction and π–π interaction (Sophia and Lima, 2018). Hydrogen bonding (H-bonding) involves the interaction between a hydrogen atom and an electronegative atom (usually N, F, or O). The former is called the H-bond donor, the latter the H-bond acceptor. Previous study showed that the MG adsorption by gasified Hevea brasiliensis root (GHBRAC) was assisted by H-bonding between the carboxyl groups or hydroxyl groups (H-bond donors) of the GHBRAC and H-bond acceptor in MG; as well as H-bonding between hydroxyl group in MG and carbonyl group (H-bond acceptor) of the GHBRAC (Ahmad et al., 2021). Besides, H-bond was also found to aid the adsorption of CV and CR onto gasified municipal solid waste based on the shifts in OH peak wavenumber observed from Fourier transform infrared (FTIR) spectroscopy (Jung et al., 2019).
Electrostatic interaction comprises the attractive or repulsive interactions between charged molecules. The opposite charges such as cations (positive) and anions (negative) will be attracted to each other while the same charges will repel. The electrostatic attraction or repulsion between particles due to their charge can be measured by zeta potential. The electrostatic interaction is commonly influenced by solution pH and ion strength. The influence of pH can be clarified in terms of point of zero charge (pHPZC) value. For cationic adsorbate, at pH < pHPZC, the adsorbent surface becomes predominantly positively charged and tend to repel the cationic adsorbate since the number of the negatively charged groups at the surface of the adsorbent decreased, while the positively charged groups increased. Hence the adsorption of the adsorbate molecules to the surface of the adsorbent will commonly declines as pH below pHPZC. In contrast, the adsorbent surface becomes deprotonated at pH > pHPZC due to availability of large number of negatively charged ions, thus adsorbate cations approach strongly towards the negatively charged sites on the adsorbent surface through electrostatic attraction and result in maximum removal (Banerjee et al., 2016). Electrostatic interaction was reported to aid the adsorption of MB onto açaí gasification waste (Pessôa, 2019). This was shown by the increase in MB adsorption at pH greater than pHPZC since there is an increase in electron receptor-donor interaction forces between sorbent and sorbate. Other studies that report this type of interaction includes RhB removal by gasified mesquite wood chips (Maneerung et al., 2016), tetracycline removal by biochars derived from alfalfa and Bermuda grass (Jang and Kan, 2019), ACE and MB adsorption by activated biochar derived from municipal solid wastes (Sumalinog et al., 2018) and cephalexin adsorption by pomegranate peel (Rashtbari et al., 2020).
π-π interaction (also known as π-π electron donor–acceptor interaction) involves the interaction between the π electrons in a carbonaceous adsorbent and the π-electron in the aromatic ring of an adsorbate (Tran et al., 2017). π- π interaction generally exists in an aromatic supramolecular system (Gong, 2019). High aromaticity and hydrophilicity of the adsorbent will promote the formation of π-π interactions, in the presence of π electrons in the adsorbate and reactive oxygen groups in the adsorbent (Jung et al., 2019). The adsorbent and adsorbate will bound together by electron transfer between the electron donor and acceptor (Cheng, 2021). This adsorption mechanism plays a leading role in the adsorption process of many carbonaceous materials on various pollutants such as cationic dye (MG, MB) (Ahmad et al., 2020; Ahmad et al., 2020; Pessôa, 2019), anionic dye (amaranth) (Ravenni et al., 2020), reactive dye (remazol brilliant violet 5r) (Khasri et al., 2021), ATN (Ahmad et al., 2020), 2,4-dinitrophenol (Azari et al., 2021), tetracycline (Li, 2022), sulfamethoxazole and Bisphenol A (Ahsan, 2018). Fig. 1 shows the mechanism of ATN adsorption onto gasified Glyricidia sepium which involved H-bonding, electrostatic interaction and π-π interaction.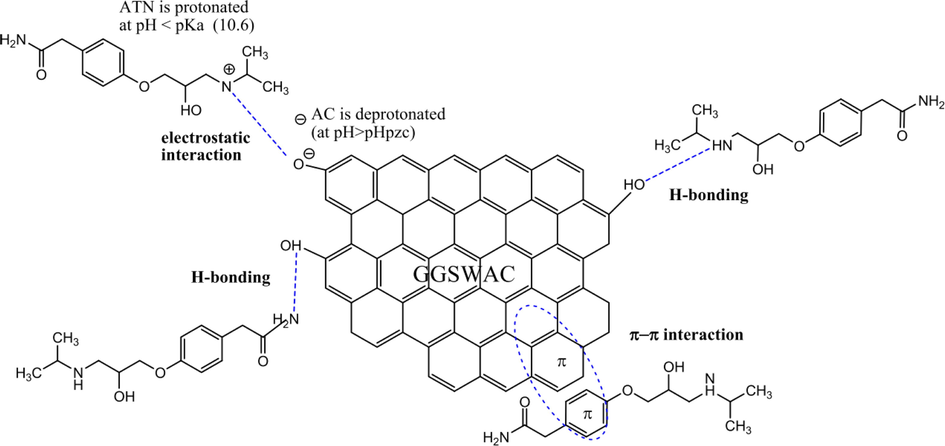
Mechanism of ATN adsorption onto gasified Glyricidia sepium (Ahmad et al., 2020).
The chemical adsorption involves a chemical bond (covalent or ionic bond) resulting from the substantial sharing or transfer of electrons between the adsorbent and adsorbate. It requires high energy for regeneration and may not be fully reversible. As the adsorbate molecules are adsorbed on the surface of the adsorbent through valence bonds, they form a monolayer adsorption. The chemisorption energy between the adsorbate molecules and adsorbents can vary significantly depending on the bond strength (Kwon et al., 2011). The adsorption mechanisms of various pollutants onto different feedstock of GC are summarized in Table 7.
Category
Feedstock
Pollutant
Mechanism
Reference
Ions
Pine and spruce woodchip
SO42-
physical pore filling,
electrostatic interactions(Runtti et al., 2016)
Pine and spruce woodchip
NO3–
physical pore filling, electrostatic interactions
(Kilpimaa et al., 2015)
Pine and spruce woodchip
Fe2+, Cu2+ and Ni2+
electrostatic attraction, ion-exchange, adsorption–precipitation, hydrogen bonding, and chemical inter- action
(Runtti et al., 2014)
Gasified rice waste
Cr3+
ion exchange, physical pore filling, precipitation, electrostatic interactions
(Godinho et al., 2017; Dias, 2018)
Dyes
Glyricidia sepium
MG
H-bond, π-π interaction, electrostatic interaction
(Ahmad et al., 2020)
Woodchip
MG
H-bond, π-π interaction, electrostatic interaction
(Ahmad et al., 2020)
Mesquite wood chips
RhB
H-bond, electrostatic interaction
(Maneerung et al., 2016)
Municipal solid waste
CR & CV
H-bond, π-π interaction, hydrophobic interactions, electrostatic interaction
(Jung et al., 2019)
Hevea brasiliensis root
MG
H-bond, π-π interaction, electrostatic interaction
(Ahmad et al., 2021)
Emerging contaminant
Glyricidia sepium
ATN
H-bond, π-π interaction, electrostatic interaction, London dispersion force
(Ahmad et al., 2020)
Spruce woodchip
DCF
hydrophobic and π-electron-donor–acceptor & π-cation interactions, pore-size effects, electrostatic interaction & H-bond
(Back et al., 2020)
8 Factor affecting adsorption
8.1 Effect of initial concentration and contact time
The adsorption performance of the solid adsorbent generally increases with the initial concentration of the adsorbate. This is due to the increase in driving force for transporting the adsorbate molecules from aqueous phase to the adsorbent surface (Ahmad et al., 2016; Kallel et al., 2016). The number of collisions between the adsorbate molecules and the adsorbent functional groups also rises as the initial concentration increases, which resulted in the escalation of the adsorption capacity (Hadi et al., 2015).
Maneerung et al. (Maneerung et al., 2016) observed that the amount of RhB adsorbed on activated-GC derived from woody biomass increased with the initial concentration. At 25 °C, the equilibrium adsorption capacity of activated-GC significantly increased from 132 to 232 mg/g when the initial RhB concentration was increased from 13 to 28 mg/L. The increase in adsorption capacity was due to a higher concentration gradient or stronger driving force between the liquid and GC solid phases at a higher initial RhB concentration. This in turn led to an increase in adsorption capacity. In general, the initial concentration plays a crucial role in overcoming mass transfer resistance of adsorbate molecules between liquid and solid phases during adsorption (Ab Aziz et al., 2023; Kwon et al., 2011).
In the studies of ATN adsorption by GGSWAC, Ahmad et al. (Ahmad et al., 2020) observed a similar trend where the adsorption uptake of ATN molecules on the adsorbent increased from 25.65 to 120.94 mg/g as the initial concentration of ATN increased from 50 to 300 mg/L. This was due to the greater mass transfer driving force at higher initial concentrations which helped to overcome the mass transfer resistance of ATN between the liquid and solid phases. The higher initial concentrations resulted in more ions competing for available sites on the surface of the adsorbent, as reported by Azari et al. (Azari et al., 2021), thus leading to a higher ATN adsorption capacity. These findings were consistent with the adsorption studies conducted by To et al. (To et al., 2017) and Fu et al. (Fu et al., 2020). Additionally, in the study on iron, copper, and nickel removal, Runtti et al. (Runtti et al., 2014) observed that the adsorbent reached its saturation point at higher initial metal concentrations and could no longer accommodate further sorption due to the absence of available sites.
Meanwhile, contact time can be defined as the agitation time needed for the adsorbent–adsorbate system to achieve steady state. The adsorption process can be described by few steps; (1) film diffusion (mass transfer from the liquid phase to the adsorbent surface across the liquid film), (2) intraparticle diffusion (diffusion within the pores of adsorbent) and (3) surface reaction (adsorption on the surface of adsorbent) (Tan and Hameed, 2017; Choudhary et al., 2020). The equilibrium time commonly varies according to adsorbent pore structure and particle size, type of the adsorbate, adsorbate concentration, solution temperature and pH. Hadi et al. (Hadi et al., 2015) reported that the equilibrium time for the mesoporous adsorbent is much lesser than the microporous adsorbent. Additionally, the tinier particle size of adsorbent requires shorter equilibrium time compared to adsorbent with larger particle size (Bohli et al., 2013).
The adsorption experiment to determine the adequate adsorption time of RhB by activated GC was conducted by Maneerung et al. (Maneerung et al., 2016) at room temperature using 5 mg of activated GC and 100 mL of 20 mg/L RhB solution (pH 7). The amount of adsorbed RhB (Qt) increased rapidly with the contact time up to 180 min, after which it slowly increased until it reached equilibrium at maximum adsorption capability at ∼ 240 min of contact time. This is because the initial adsorption rate was rapid due to the high number of vacant sites of the activated GC for adsorption, and then it slowly increased due to the saturation of active sites for adsorption. The maximum adsorption capacity at equilibrium of the activated GC prepared was approximately 215.7 mg/g as shown in Fig. 2.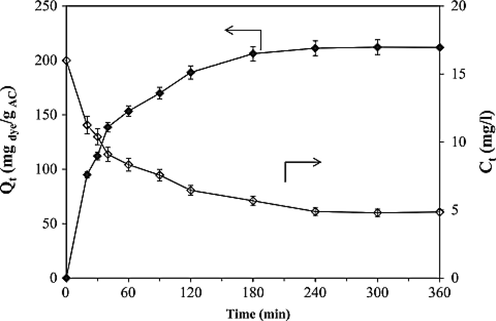
Effect of contact time (Maneerung et al., 2016).
Similarly, Runtti et al. (Runtti et al., 2016) reported that the initial stage of the sorption experiment had a higher rate of sulphate ion removal due to the greater number of available adsorption sites. The optimal sulphate removal efficiency (97.6%) and sorption capacity (10.3 mg/g) were achieved in approximately one minute, after which there was a slight decrease in the removal. efficiency.
8.2 Effect of temperature
Temperature is another important parameter that may affect adsorption by affecting solubility and molecular interactions with solid particles. The solution temperature can either improve or reduce the adsorption performance depending on the nature of the adsorbate-adsorbent interaction, whether exothermic or endothermic process (Chen, 2022). In ACE adsorption using GC from pine wood, the increase in adsorption capacity due to temperature was observed by Galhetas et al. (Galhetas et al., 2014), which is consistent with previously reported data (Ahmad et al., 2020; Ahmad et al., 2021; Ahmad et al., 2020; Ahmad et al., 2020), demonstrating a temperature dependence that is a characteristic of an endothermic process. The authors also explained that the relationship between the dimension of ACE species present in solution and the micropore size network of the GC samples can account for this phenomenon. At lower temperatures, the critical dimension of ACE monomers is close to the opening of the pores corresponding to the maximum of the micropore size distribution of the lab-made sample. However, with an increase in temperature from 20 to 40 °C, the vibration energy of the molecules increases, leading to an activation of adsorption. This favours the accessibility of the species to the microporosity with widths near to the critical dimensions of the molecule, resulting in an increase in monolayer adsorption capacity.
On the contrary, Maneerung et al. (Maneerung et al., 2016) found that the adsorption capacity of RhB slightly decreased as the temperature increased. For example, when the initial concentration was kept constant at 22 mg/L, the amount of RhB adsorbed on the GC decreased from 210.2 to 196.4 mg/g as the temperature increased from 25 to 60 °C. This observation indicates that the adsorption of RhB onto the GC is an exothermic process.
The study of temperature is vital in evaluating the thermodynamic parameters such as the change of Gibbs free energy (ΔG°), enthalpy (ΔH°) and entropy (ΔS°), which can provide the information related to the adsorption nature (Moralı et al., 2018). An accurate estimation of these parameters relies on the appropriate determination of the equilibrium constant, KC. The thermodynamic parameters can be estimated using KC values obtained from adsorption-isotherm constants or the partition coefficient (Ribas, 2014; Rodrigues et al., 2011). However, several factors need to be considered thoroughly to obtain a reliable value of these thermodynamic parameters; (1) The KC value must be unitless. (2) The van't Hoff linear regression coefficient (R2) must be high. (3) The adsorbate concentration used in the adsorption equilibrium study are low or high (Nguyen et al., 2017). Since the KC values can be estimated from several methods, significant variation in the thermodynamic parameters can be found. Hence, the most reliable approach should be studied so that the determined thermodynamics parameters are relevant.
Rangabhashiyam et al. (Rangabhashiyam et al., 2018) used the distribution constant, Kd to estimate the thermodynamic properties of MG adsorption onto Carica papaya wood (CPW). The authors estimated Kd value from the intersection of ln(qe/Ce) versus Ce plot. The results showed a declining trend in the value of Gibbs free energy with increasing temperature, suggesting that adsorption of MG was preferred at higher temperature. The results of the enthalpy change revealed that the MG adsorption process was endothermic, and the positive values of the entropy change indicated the increase randomness in the system.
The estimation of KC values from Langmuir isotherm, KL for MG, MB, and RhB adsorption were employed by Geçgel et al. (Geçgel et al., 2016), who used AC obtained from waste Elaeagnus stone. They reported the negative values of Gibbs free energy, which revealed the spontaneity of the process; the positive values of entropy change indicating the increase in the randomness in the system; and the positive values of enthalpy which reconfirm that the adsorption of MG was endothermic. Similar approach has been performed by Qu et al. (Qu et al., 2019), who evaluated the MG adsorption using apricot-AC, coconut-AC, peach-AC and coal-AC. The thermodynamic results obtained by Qu et al. (Qu et al., 2019) were in good agreement with Geçgel et al. (Geçgel et al., 2016). In contrast, Sayğili & Güzel (Sayğili and Güzel, 2015) calculated the thermodynamic properties of CR and MG adsorption using distribution coefficient with Kd = Qm KL with unit of L/g, which was different from those of KL (L/mg). The results for thermodynamic properties were in good agreement with other researchers with high value of R2.
8.3 Effect of pH
A pH of the solution is another important factor that affect the adsorption capacity. The pH value can influence the ionization degree of the adsorbate and metal ion speciation in a solution. A solution‘s pH affects the degree of the adsorption. H+ and OH– ions are commonly adsorbed, thus affecting the adsorption process by dissociating the functional groups on the active sites of the adsorbent surface, resulting in a shift in the kinetics of reaction and in the properties of equilibrium (Rathi and Kumar, 2021).
The influence of pH can also be clarified in terms of point of zero charge (pHPZC) value. At pH < pHPZC, the adsorbent surface becomes mainly positively charged which tends to attract the anionic adsorbate owing to the increase in the number of the positively charged groups at the surface of the adsorbent, leading to the increase in adsorption of the adsorbate molecules to the surface of the adsorbent. In contrast, the adsorbent surface becomes deprotonated at pH > pHPZC due to the availability of large number of negatively charged ions on the surface of adsorbent, resulting in the electrostatic repulsion between the negatively charged adsorbent surface and the anionic adsorbate. For instance, Ahmad et al. (Ahmad et al., 2020) reported that, at pH value lower than pHPZC (pH < 4.8), the GC surface were positively charged while at pH value greater than pHPZC (pH > 4.8), the surfaces became negatively charged. Therefore, when the pH is above pHPZC (pH > 4.8), the GC surface possessed the net negative charge and promoted the electrostatic attraction with positively charged ATN solution. Hence the adsorption uptake increased from 67.65 to 74.71 mg/g at pH 4 and pH 8 as depicted in Fig. 3. However, at pH above the pKa value, ATN molecules were deprotonated and became neutral, thus causing a declining trend in ATN uptake at pH 10 to 12. Similar trend was reported by Haro et al. (Haro et al., 2017), To et al. (To et al., 2017), Fu et al. (Fu et al., 2020) and Chang (Chang et al., 2019).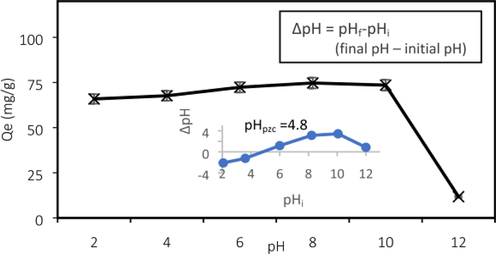
Effect of pH (Ahmad et al., 2020).
Sharma et al. (Sharma, 2019) found that the maximum MG adsorption by AC derived from Pinus roxburghii cone occurred at pH 6 with pHPZC value of 8.4. At pH 6 (below the pHPZC), the surface of AC was positively charged, while the MG molecules was either neutral or slightly negatively charged, thus demonstrating the greatest interactions between AC and MG molecules, leading to high adsorption performance.
Meanwhile, the effect of pH was described using chemical equation by Maneerung et al. (Maneerung et al., 2016), who studied the RhB removal using activated GC. Under the basic condition, the hydroxyl (—OH) groups and carboxyl (—COOH) groups on the surface of GC were deprotonated and became more negatively charged, which led to the increase in the electrostatic interaction between the negatively charged GC and the positively charged RhB molecule. In contrast, under the acidic condition, the hydroxyl groups and carboxyl functional groups of the GC as well as the carboxyl functional groups of RhB molecules were protonated and became more positively charged. Hence the adsorption capability declined owing to the strong electrostatic repulsion between the positively charged RhB molecules and the positively charged GC.
Under basic condition: —COOH + OH– → —COO– + H2O —OH + OH– → —O- + H2O
Under acidic condition: —COOH + H+ → —COOH2+ —OH + H+ → —OH2+
Under neutral condition, Maneerung et al. (Maneerung et al., 2016) added that RhB molecules were mostly adsorbed on the surface of GC via hydrogen bonding between carboxylic (—COOH) groups of RhB molecules and both hydroxyl (—OH) groups and carboxylic (—COOH) groups present on the surface of GC. They finally concluded that the basic condition was more favorable for the adsorption of cationic dye-RhB by the prepared GC.
According to Ravenni et al. (Ravenni et al., 2020), the adsorption of cations or anions, influenced by solution pH, is related to the zeta potential of the GC surface, which measures the electric potential at the interface between the adsorbent and the surrounding solution. When the GC surface has a positive or negative zeta potential, there is an electrostatic attraction or repulsion between the ionic dyes and the surface. For instance, if the solution pH is higher than the pHPZC, the GC surface becomes negatively charged, facilitating the adsorption of positively charged ions of cationic dyes. This is why cationic-MB is adsorbed more efficiently and with faster kinetics compared to anionic-AM on the adsorbents tested.
Meanwhile, Jung et al. (Jung et al., 2019) observed that the equilibrium adsorption capacity, qe, for anionic dye-CR adsorption decreased with an increase in pH, indicating the potential presence of negatively charged species in the GC. On the other hand, the adsorption of cationic dye-CV showed an increasing trend in qe as the initial solution pH increased because of the higher concentration of positively charged (H+) ions in solution at low pH, leading to increased competition for available adsorption sites.
9 Adsorption isotherm & kinetic
The adsorption isotherm models provide essential data on the adsorbent surface characteristic, adsorbent affinities towards adsorbate, adsorbent uptake capacity and adsorption mechanisms. Most of the researchers employed two and three parameter isotherm models for monolayer adsorption system, including Langmuir, Freundlich, Sips, Dubinin-Radushkevich (D-R), Redlich Peterson (R-P) and Temkin. Other monolayer models such as Hills, Koble-Corrigan (K-C), Radke-Prausnitz Radke, Toth, Fritz-Schlunder (F-S), Khan, Jossens, Flory-Huggins, Baudu and multilayer models including Aranovich, Brunauer-Emmett-Teller (BET), n-BET, Anderson, Dubinin-Serpinsky, Frenkel-Halsey-Hill and Guggenheim Anderson de-Boer (GAB) (Saadi et al., 2015) were rarely reported or almost absence in the literature for adsorption isotherm study. This could be due to more complex equation consisting of more than three parameters which requires the optimization of non-linear equations. Limited number of studies has been found applying multilayer isotherm such as BET model equation for phenol (Horváth et al., 2017), dye (Scheufele, 2016) and emerging contaminant (Sotelo et al., 2012) adsorption. The correct form of BET isotherm for modeling liquid phase adsorption was discussed by Ebadi et al (Ebadi et al., 2009). According to BET model, the second, third, and subsequent layers have similar amount of adsorption energy and are unaffected by adsorbent-adsorbate interactions. In contrast, the first layer energy differs from other layers. The adsorption layers tend to become infinity at saturation concentration. Scheufele et al. (Scheufele, 2016) for instance, employed the multilayer BET equation for the reactive blue 5G dye removal from aqueous solution with high R2 value of 0.9568–0.9967 and concluded that the adsorption of RB5G showed a multilayer adsorption behavior. Another study using BET isotherm model was reported by Sotelo et al. (Sotelo et al., 2012), who investigated the adsorption of isoproturon and ATN in batch and continuous mode of operation. The equilibrium state of batch adsorption was found after 25 h and the isotherm data ideally fitted to BET model (R2 = 0.9962) with monolayer adsorption capacity, qm,BET of 80.4 mg/g.
The adsorption kinetic models provide insights over the dynamics of adsorption of adsorbate onto the adsorbent and gave the information on the ruling adsorption mechanism. Pseudo-first order (PFO), Pseudo-second order PSO and Elovich model equations were mostly reported for various pollutants adsorption due to the simplicity of the equations. In short, the appropriate models must be carefully applied for better insight on the thermodynamic properties as well as the adsorption mechanism that ruled the process. Table 8 and Table 9 show several isotherm and kinetic model equations that had been widely used in liquid adsorption.
Isotherm model
Equation
Parameter
Model Description
Ref
Freundlich
An empirical model assuming that the distribution of the heat on the adsorbent surface is non-uniform.
(Freundlich, 1906)
Langmuir
Assuming monolayer adsorption occurs on the solid surface with identical homogeneous sites.
(Langmuir, 1918)
Dubinin-Radushkevish (D-R)
Often used to estimate the characteristic porosity in addition to the apparent free energy of adsorption.
(Kutluay et al., 2019)
Temkin
Heat of adsorption decrease linearly rather than logarithmically due to adsorbate–adsorbent interactions.
(Ayawei et al., 2017)
Redlich-Peterson (R-P)
Valid when the mechanism of adsorption is a hybrid and does not follow ideal monolayer adsorption.
(Saravanan et al., 2018)
Sips
Valid for predicting the heterogeneous adsorption systems and localized adsorption without adsorbate–adsorbate interactions.
(Popoola et al., 2019)
Koble-Corrigan (K-C)
Incorporates both Langmuir and Freundlich isotherms. Mostly applied for heterogeneous adsorbent surface.
(Wakkel et al., 2019)
Fritz–Schlünder (F-S)
An empirical equation which can fit a wide range of experimental data.
(Fritz and Schluender, 1974)
n-layer BET
Assuming that there are a maximum n layers that can be adsorbed onto the internal surface of adsorbent.
(Scheufele, 2016)
Toth
Useful in describing heterogeneous adsorption systems.
(Toth, 1971)
Kinetic model
Equation
Parameter
Description
Ref
Pseudo-first order (PFO)
The change in rate of the solute uptake with time is directly proportional to the difference in saturation concentration and the solute uptake with time.
[191]
Pseudo-second order (PSO)
The rate limiting step are chemisorption involves forces by sharing or exchanging electrons between the adsorbent and the adsorbate.
(Ho and Mckay, 1999)
Elovich
Commonly used in chemisorption processes.
(Low, Jun. 1960; Agbor Tabi, 2022)
Avrami
Used to verify specific changes of kinetic parameters as functions of temperature and reaction time.
For unusual adsorption kinetic quantities when the adsorption rate is very slow and presents more than one adsorption mechanism.(Avrami, 1939)
Table 10 indicates the fitted isotherm and kinetic models for liquid adsorption by GC. In the studies of MG and ATN adsorption by various GCs conducted by Ahmad et al. (Ahmad et al., 2020; Ahmad et al., 2021; Ahmad et al., 2020; Ahmad et al., 2020), Langmuir, Freundlich, D-R, Temkin, R-P, K-C, F-S, n-BET and Toth isotherm models were employed. They found that n-BET model fitted all the experimental data very well. This model assumes there are a maximum number of layers, n that can be adsorbed onto the internal surface (Saadi et al., 2015). Number of layers (n = 1, 2, 3…,nth) can be defined as follows: (See Fig 4) RH = rice husk, RS = rice straw, PE = polyethylene, RhB = rhodamine B, AM = amanth dye, CR = congo red dye, CV = crystal violet dye, ATN = atenolol, ACE = acetaminophen, DCF = diclofenac, MB = methylene blue dye, MG = malachite green dye, PFO = Pseudo-first order, PSO = Pseudo-second order, PNO = Pseudo-n-order.
Feedstock
Application
Adsorption capacity (mg/g)
Kinetic
Isotherm
Reference
Model
R2
Model
R2
Hevea brasiliensis root
MG
259.49
Avrami
0.999
n-BET
0.988
(Ahmad et al., 2021)
Glyricidia sepium
MG
230.47
Avrami
0.999
Fritz–Schlünder
0.992
(Ahmad et al., 2020)
ATN
163.0
Avrami
0.998
n-BET
0.998
(Ahmad et al., 2020)
Woodchip
MG
226.06
Avrami/PFO
0.987
Fritz–Schlünder
0.992
(Ahmad et al., 2020)
Mesquite wood
RhB
189.83
PSO
0.995
Langmuir
0.991
(Maneerung et al., 2016)
Açaí berry seeds
MB
93.23
PNO
N/A
Sips
0.998
(Pessôa, 2019)
Woodchip
MB
AM25.1
25.3PFO
PSO0.998
0.992N/A
N/A
(Ravenni et al., 2020)
Municipal Solid waste
CR
CV49.7
356PSO
PSO0.932
0.962Redlich-Peterson
0.952
0.979(Jung et al., 2019)
Pine and spruce
SO42-
19.55
PSO
0.999
Bi-Langmuir
0.980
(Runtti et al., 2016)
Pine and spruce
PO43-
NO3–
20.5
80PSO
0.997
0.999Langmuir
0.998
0.992(Kilpimaa et al., 2015; Kilpimaa et al., 2014)
Pine and spruce
Ni2+,
Fe2+
Cu2+
18.2
20.5
23.1PSO
0.999
0.999
0.999Langmuir
0.979
0.997
N/A(Runtti et al., 2014)
Pine
ACE
Caffeine434.8
476.2PSO
0.999
0.999Langmuir
0.990
0.999(Galhetas et al., 2014; Galhetas et al., 2014)
Spruce woodchip
DCF
35.09
PSO
0.890
Freundlich
0.980
(Back et al., 2020)
Rice Husk
Cr3+
21.1
PSO
0.966
Sips
0.956
(Godinho et al., 2017)
50% w/w RH + 50% w/w RS
80% RH w/w + 20% w/w PECr3+
Cr3+
8.51
6.2N/A
PSON/A
N/AN/A
LangmuirN/A
0.999(Dias, 2018)
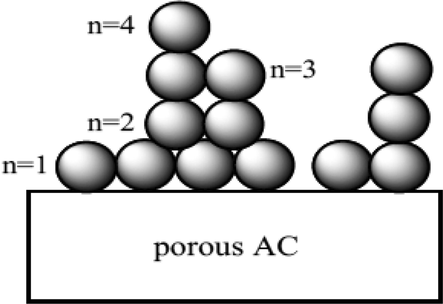
Number of layers, n.
The n value of less than 2 for MG removal (Ahmad et al., 2020; Ahmad et al., 2020), which was attributed to monolayer adsorption, showed a good agreement with the monolayer adsorption isotherm models, such as F-S (R2 = 0.99), R-K (R2 = 0.97), Toth (R2 = 0.97), Sips (R2 = 0.97), Langmuir (R2 = 0.97), K-C (R2 = 0.97), D-R (R2 = 0.94), and Temkin (R2 = 0.93) with reasonable values of R2. In addition, Ahmad et al. (Ahmad et al., 2020) also reported that the MG adsorption occurred at the specific homogeneous sites of the GGSWAC as supported by the values of ; ns, nToth and kKC in R-P, Sips, Toth and K-C isotherm models respectively, which were close to unity. The system is heterogenous when these values deviate from 1, while the values close to 1 describe a homogeneous system. Meanwhile, the D-R model was also employed by Ahmad et al. (Ahmad et al., 2020; Ahmad et al., 2020) to evaluate the energy of adsorption. The energy of adsorption, E, was applied to judge the adsorption type; when 1 < E < 8 kJ/mol, the adsorption is categorized as physical process, when 8 < E < 16 kJ/mol, the adsorbate is absorbed by ion exchange, and when E > 16 kJ/mol, the chemical adsorption involved. The low sorption energy, E (<8 kJ/mol), provided from D-R indicated physisorption.
The heterogeneity of the system can also be described by Bi-Langmuir isotherm equation as employed by Runtti et al. (Runtti et al., 2016). The model assumes that there are two favoured adsorption sites on the surface and was first suggested by Graham (Graham, 1953). Runtti et al. (Runtti et al., 2016) who studied sulphate removal using FeCl3-activated GC from 150 kW downdraft gasifier operating at 1000 °C, reported Bi-Langmuir model ideally fitted the experimental data (R2 = 0.98), followed by Sips (R2 = 0.96), Freundlich (R2 = 0.96) and Langmuir (R2 = 0.75), suggesting heterogeneous adsorption of SO42- anions onto the surface of GC with two different types of adsorption sites. This result showed a good agreement with the heterogeneity factors in Sips (nS = 0.2) and Freundlich (1/n = 0.11) as their values deviate from unity, indicating a heterogenous adsorption site. In kinetic study, Runtti et al. (Runtti et al., 2016) employed both PFO and PSO models and reported that the R2 value of the PFO kinetic model was lower than that of the PSO model. In addition, experimental uptake values (qe,exp) were not reasonable in regard to the calculated values (qe,calc). Therefore, the PSO kinetic model was selected as the best-fit model (R2 = 0.99).
Pessôa et al. (Pessôa, 2019) and Godinho et al. (Godinho et al., 2017) reported that Sips model greatly described the adsorption of MB and Cr3+ ions onto GC derived from açaí berry seeds and rice husk, respectively. Based on kinetic data, the adsorption of Cr3+ ions fitted well to the PSO model with R2 of 0.96, indicating that ion exchange might have occurred during the adsorption process (Godinho et al., 2017). Meanwhile, Pessôa et al. (Pessôa, 2019) employed pseudo-n-order (PNO) model together with PFO and PSO. They reported that all models accurately predicted the MB adsorption with R2 of 0.996, 0.996 and 0.994 for PNO, PSO and PFO, respectively. The order factor (n) value in PNO were 2.26, indicating that the adsorption was equivalent to the second-order model, which was supported by the high value of R2 for PSO. However, Pessôa et al. (Pessôa, 2019) did not further elaborated on the adsorption mechanism based on the findings in isotherm and kinetic studies.
Other researchers revealed that the adsorption of RhB (Maneerung et al., 2016), phosphate & nitrate (Kilpimaa et al., 2015; Kilpimaa et al., 2014), nickel, iron & copper (Runtti et al., 2014), ACE & caffeine (Galhetas et al., 2014; Galhetas et al., 2014)and chromium (III) (Dias, 2018) followed Langmuir adsorption isotherm and PSO kinetic models, manifesting that the adsorbate molecules formed monolayer coverage on the prepared GC, which is homogenous in nature. It can be concluded that every adsorption sites of the GC have the same adsorption energy. In addition, Dias et al. (Dias, 2018) emphasized that the adsorption of chromium (III) was mostly driven by ion exchange rather than by physical adsorption.
The multilayer adsorption (with limited number of layers, n) was reported by Ahmad et al (Ahmad et al., 2021; Ahmad et al., 2020) for the removal of MG and ATN based on the excellent fitting (R2 = 0.98–0.99) in the n-BET isotherm equation as well as the number of layer predicted by this model (n ≥ 2). The maximum number of layers, n equal to 3, 6, 5 and 2.5, 2.1, 2.7 at 30, 45 and 60 °C for MG and ATN adsorption respectively. The finding was further proven with the heterogeneity value of nS predicted by Sips which were far from unity (nS = 2.19), suggesting heterogenous distribution of the adsorption sites. In the kinetic study, Ahmad et al. (Ahmad et al., 2020; Ahmad et al., 2021; Ahmad et al., 2020; Ahmad et al., 2020) applied PFO, PSO, Elovich and Avrami models and all the data fitted to Avrami model very well (R2 = 0.98–0.99). Avrami model is generally used for unusual adsorption kinetic quantities when the adsorption rate is very slow and/or presents more than one adsorption mechanism. The Elovich model showed poor fitting with R2 values of 0.17–0.65 (Ahmad et al., 2021; Ahmad et al., 2020; Ahmad et al., 2020), confirming that this model was not appropriate to describe the rate of MG adsorption, and the MG removal was not governed by chemisorption. In contrast, some of the kinetic data for ATN adsorption (Ahmad et al., 2020) correlated well with Elovich model, suggesting the possibility of chemisorption involved. Ahmad et al. (Ahmad et al., 2020) further concluded that the overall mechanism of ATN adsorption was ruled by both film diffusion and chemisorption based on the results from Weber & Moris IPD, Boyd and diffusion-chemisorption models.
The adsorption of CR and CV (Jung et al., 2019) were ideally described by R-P model with R2 of 0.95 and 0.98, respectively. The values of in the Redlich-Peterson models were close to 1, which can be reduced to the Langmuir isotherm model, manifesting a monolayer adsorption, which indicated the adsorbent-adsorbate interaction. In addition, some pore filling phenomena were depicted by D-R model (R2 = 0.91) for CV removal with adsorption energy ascribed to physisorption (E < 8 kJ/mol). The kinetic data for both CR and CV adsorption fitted well to PSO, suggesting chemisorption. Thus, it can be concluded that CR and CV adsorption had both physisorption and chemisorption contributions.
10 Rate controlling steps of adsorption
It is well known that during the adsorption of adsorbate over a porous adsorbent, the following three consecutive steps were taken place: (1) transport of the ingoing adsorbate ions to external surface of the adsorbent, (2) transport of the adsorbate ions within the pores of the adsorbent and (3) adsorption of the ingoing adsorbate ions on the internal surface of the adsorbent. Out of these three processes, the third process is considered to be very quick and is not the rate-limiting step in the adsorption of organic compounds (Karthikeyan et al., 2010). Hence, the adsorption process is governed either by external diffusion, internal diffusion or by both types of diffusions. Most of the researchers only considered these two processes to determine the slowest steps in adsorption process (Wakkel et al., 2019; Bhattacharyya and Ray, 2015; Maia et al., 2019; Oyelude et al., 2018; Sewu et al., 2017; Sy et al., 2017). The Weber and Morris IPD model, the Boyd kinetic model are the two models that were commonly applied to evaluate whether intraparticle or film diffusion is the rate controlling step. However, for complex processes that involve chemical reaction, diffusion-chemisorption model was also applied. For example, To et al. (To et al., 2017) used the Weber and Morris IPD, Boyd kinetic and the diffusion-chemisorption model equations to investigate the adsorption mechanism of ATN adsorption onto activated PKS. The ATN adsorption ideally fitted to the diffusion-chemisorption model (R2 ≥ 0.998) suggesting that the ATN adsorption was governed by diffusion and chemisorption. To et al. concluded that the binding mechanism of ATN adsorption onto the adsorbent was related to hydrogen bonding.
Similar models was employed by Choudhary et al. (Choudhary et al., 2020), whom investigated the removal of MG using Opuntia ficus-indica-derived AC. They computed the diffusion-chemisorption model, together with Weber and Morris IPD and Boyd kinetic models and found that the kinetic data fitted well to diffusion-chemisorption model (R2 ≥ 0.99) indicating that both diffusion and chemisorption ruled the adsorption process. This is in agreement with the results reported by Ahmad et al. for ATN adsorption by gasified Glyricidia sepium (Ahmad et al., 2020). The data revealed that the overall mechanism of ATN adsorption was ruled by both film diffusion and chemisorption based on high correlation coefficient R2 ranging from 0.9984 to 1.000.
11 Conclusion and future prospects
Previously published papers concluded that both the physical and chemical properties of sorbents play important roles in the adsorption process. Physical properties such as SBET and TPV are critical factors that influence adsorption efficiency. Chemical properties such as the presence of oxygen-rich functional groups and aromatic groups on the surface of char are responsible for providing strong active sites for adsorption.
While many scholars have studied the adsorption process using other materials as adsorbents, gasification residues have been rarely researched. Owing to its good physicochemical properties, high adsorption capability, and new added-value offered, GC residue presents good application prospects as alternative feedstock for AC.
Owing to the good physicochemical properties of GC residues, their application for adsorption should be further investigated. The literature on the applications of GC residues for adsorption is somewhat limited to the adsorption of dyes and heavy metals. Furthermore, studies on the removal of pharmaceutical compound have been extremely rare. Additionally, studies on the activation parameters (i.e: temperature, impregnation ratio of activation agent, activation duration), adsorption conditions (i.e: pH, initial sorbate concentration, temperature, sorbent dosage), kinetics (i.e: pseudo first order, pseudo second order), thermodynamics (ΔH, ΔG, ΔS), and regeneration should be conducted to analyse the adsorption mechanism involved. The effects of these parameters on the adsorption performance of GC should be examined by analysing the optimal experimental conditions. In addition, an economic analysis of the production of AC from GC should be conducted. The findings of the studies cited in this paper are crucial for designing pilot-plant scale adsorption columns to assess the feasibility of GC at industrial level.
Acknowledgments
The authors thankfully acknowledge the support obtained from Ministry of Higher Education (MOHE), Universiti Malaysia Perlis (UniMAP), Universiti Sains Malaysia (USM) and Intel Microelectronics (M) Sdn Bhd in form of scholarship and facilities given to the corresponding author.
Declaration of Competing Interest
The authors declare that they have no known competing financial interests or personal relationships that could have appeared to influence the work reported in this paper.
References
- Non-functionalized oil palm waste-derived reduced graphene oxide for methylene blue removal: Isotherm, kinetics, thermodynamics, and mass transfer mechanism. Arab. J. Chem.. 2023;16(1):104387.
- [CrossRef] [Google Scholar]
- Kinetic, equilibrium and thermodynamic study on the removal of Congo Red from aqueous solutions by adsorption onto apricot stone. Process Saf. Environ. Prot.. 2015;98:424-436.
- [CrossRef] [Google Scholar]
- Production of biochar from olive mill solid waste for heavy metal removal. Bioresour. Technol.. 2017;244(June):759-767.
- [CrossRef] [Google Scholar]
- Characterization and stabilisation of biochars obtained from empty fruit bunch, wood, and rice husk. BioResources. 2014;9(2):2888-2898.
- [CrossRef] [Google Scholar]
- Non-linear modelling of the adsorption of Indigo Carmine dye from wastewater onto characterized activated carbon/volcanic ash composite. Arab. J. Chem.. 2022;15(1):103515
- [CrossRef] [Google Scholar]
- Speciation and phytoavailability of lead and antimony in a small arms range soil amended with mussel shell, cow bone and biochar: EXAFS spectroscopy and chemical extractions. Chemosphere. 2014;95:433-441.
- [CrossRef] [Google Scholar]
- Optimization and batch studies on adsorption of malachite green dye using rambutan seed activated carbon. Desalin. Water Treat.. 2016;57(45):21487-21511.
- [CrossRef] [Google Scholar]
- Assessing the gasification performance of biomass: A review on biomass gasification process conditions, optimization and economic evaluation. Renew. Sustain. Energy Rev.. 2016;53:1333-1347.
- [CrossRef] [Google Scholar]
- Atenolol sequestration using activated carbon derived from gasified Glyricidia sepium. Arab. J. Chem.. 2020;13(10):7544-7557.
- [CrossRef] [Google Scholar]
- Honeycomb-like porous-activated carbon derived from gasification waste for malachite green adsorption: equilibrium, kinetic, thermodynamic and fixed-bed column analysis. Desalin. Water Treat.. 2020;196:329-347.
- [CrossRef] [Google Scholar]
- Adsorption of basic green 4 onto gasified Glyricidia sepium woodchip based activated carbon: optimization, characterization, batch and column study. Arab. J. Chem.. 2020;13(8):6887-6903.
- [CrossRef] [Google Scholar]
- Effective removal of methylene blue from aqueous solution by adsorption onto gasification char: isotherm, kinetic and thermodynamics studies. Desalin. Water Treat.. 2023;285:264-273.
- [CrossRef] [Google Scholar]
- Adsorption of Malachite Green by Activated Carbon Derived from Gasified Hevea brasiliensis Root. Arab. J. Chem.. 2021;14(4):103104
- [CrossRef] [Google Scholar]
- Adsorption behavior of salicylic acid on biochar as derived from the thermal pyrolysis of barley straws. J. Clean. Prod.. 2018;195:1162-1169.
- [CrossRef] [Google Scholar]
- Adsorptive Removal of Sulfamethoxazole and Bisphenol A from Contaminated Water using Functionalized Carbonaceous Material Derived from Tea Leaves. J. Environ. Chem. Eng.. 2018;6(4):4215-4225.
- [CrossRef] [Google Scholar]
- Efficient removal of anionic and cationic dyes from aqueous systems using spent Yerba Mate ‘Ilex paraguariensis’. J. Taiwan Inst. Chem. Eng.. 2018;82:144-155.
- [CrossRef] [Google Scholar]
- NaY zeolite from wheat (Triticum aestivum L.) straw ash used for the adsorption of tetracycline. J. Clean. Prod.. 2018;172:602-608.
- [CrossRef] [Google Scholar]
- Kinetics and equilibrium study for the adsorption of textile dyes on coconut shell activated carbon. Arab. J. Chem.. 2017;10:S3381-S3393.
- [Google Scholar]
- Effects of various gasification parameters and operating conditions on syngas and hydrogen production. Chem. Eng. Res. Des.. 2016;115:1-18.
- [CrossRef] [Google Scholar]
- Kinetics of Phase Change. I General Theory. J. Chem. Phys.. 1939;7(12):1103-1112.
- [CrossRef] [Google Scholar]
- Preparation and characteristics of agricultural waste activated carbon by physical activation having micro- and mesopores. J. Anal. Appl. Pyrolysis. 2008;82:279-285.
- [CrossRef] [Google Scholar]
- Modelling and Interpretation of Adsorption Isotherms. J. Chem.. 2017;2017(September):1-11.
- [CrossRef] [Google Scholar]
- The superior adsorption capacity of 2,4-Dinitrophenol under ultrasound-assisted magnetic adsorption system: Modeling and process optimization by central composite design. J. Hazard. Mater.. 2021;vol. 418, no. June:126348
- [CrossRef] [Google Scholar]
- Adsorptive removal of micropollutants from wastewater with floating-fixed-bed gasification char. J. Environ Chem. Eng.. 2020;8(3):pp.
- [CrossRef] [Google Scholar]
- Removal of Malachite Green, a hazardous dye from aqueous solutions using Avena sativa (oat) hull as a potential adsorbent. J. Mol. Liq.. 2016;213:162-172.
- [CrossRef] [Google Scholar]
- Adsorption of antipyrine by activated carbons from FeCl3-activation of Tara gum. Chem. Eng. J.. 2018;333(August 2017):58-65.
- [CrossRef] [Google Scholar]
- New insights on the adsorption of CI-Reactive Red 141 dye using activated carbon prepared from the ZnCl2-treated waste cotton fibers: statistical physics, DFT, COSMO-RS, and AIM studies. J. Mol. Liq.. 2022;364:119956
- [CrossRef] [Google Scholar]
- Characterization of char from biomass gasification and its similarities with activated carbon in adsorption applications. Appl. Energy. 2017;227:92-99.
- [CrossRef] [Google Scholar]
- Valorization of char from biomass gasification as catalyst support in dry reforming of methane. Front. Chem.. 2019;7(119):1-12.
- [CrossRef] [Google Scholar]
- Synthesis and evaluation of biochar-derived catalysts for removal of toluene (model tar) from biomass-generated producer gas. Renew. Energy. 2014;66:346-353.
- [CrossRef] [Google Scholar]
- Removal of congo red and methyl violet from water using nano clay filled composite hydrogels of poly acrylic acid and polyethylene glycol. Chem. Eng. J.. 2015;260:269-283.
- [CrossRef] [Google Scholar]
- Adsorption on activated carbon from olive stones: kinetics and equilibrium of phenol removal from aqueous solution. J. Chem. Eng. Process Technol.. 2013;04(06):pp.
- [CrossRef] [Google Scholar]
- Adsorptive removal of malachite green from aqueous solutions by almond gum: kinetic study and equilibrium iesotherms. Int. J. Biol. Macromol.. 2017;105:56-65.
- [CrossRef] [Google Scholar]
- Adsorption of naphthenic acids on peanut shell activated carbon: Batch and fixed-bed column study of the process. Chem. Eng. Res. Des.. 2022;188:633-644.
- [CrossRef] [Google Scholar]
- The triple mechanisms of atenolol adsorption on Ca-montmorillonite: Implication in pharmaceutical wastewater treatment. Materials (Basel). 2019;12(18):pp.
- [CrossRef] [Google Scholar]
- Speciation of sulfur in biochar produced from pyrolysis and gasification of oak and corn stover. Environ. Sci. Technol.. 2014;48(15):8474-8480.
- [CrossRef] [Google Scholar]
- Isotherm models for adsorption of heavy metals from water - A review. Chemosphere. 2022;307(P1):135545
- [CrossRef] [Google Scholar]
- Adsorption of emerging contaminants from water and wastewater by modified biochar: A review. Environ. Pollut.. 2021;273:116448
- [CrossRef] [Google Scholar]
- Activated biochar derived from Opuntia ficus-indica for the efficient adsorption of malachite green dye, Cu+2 and Ni+2 from water. J. Hazard. Mater. (February)122441
- [CrossRef] [Google Scholar]
- Adsorption thermodynamics, kinetics and isosteric heat of adsorption of malachite green onto chemically modified rice husk. Desalination. 2011;265(1–3):159-168.
- [CrossRef] [Google Scholar]
- Calcium-rich biochar from crab shell: An unexpected super adsorbent for dye removal. Bioresour. Technol.. 2018;267:510-516.
- [CrossRef] [Google Scholar]
- A review on utilization of wood biomass as a sustainable precursor for activated carbon production and application. Renew. Sustain. Energy Rev.. 2018;87:1-21.
- [CrossRef] [Google Scholar]
- Characteristics and adsorption capacities of low-cost sorbents for wastewater treatment: a review. Sustain. Mater. Technol.. 2016;9:10-40.
- [CrossRef] [Google Scholar]
- Properties of chars from the gasification and pyrolysis of rice waste streams towards their valorisation as adsorbent materials. Waste Manag.. 2017;65:186-194.
- [CrossRef] [Google Scholar]
- Cr(III) removal from synthetic and industrial wastewaters by using co-gasification chars of rice waste streams. Bioresour. Technol.. 2018;266(April):139-150.
- [CrossRef] [Google Scholar]
- Synthesis of activated carbon fibers from cotton by microwave induced H3PO4 activation. J. Taiwan Inst. Chem. Eng.. 2017;70:374-381.
- [CrossRef] [Google Scholar]
- Reactivity enhancement of gasification biochars for catalytic applications. Fuel. 2015;159:491-499.
- [CrossRef] [Google Scholar]
- What is the correct form of BET isotherm for modeling liquid phase adsorption? Adsorption. 2009;15(1):65-73.
- [CrossRef] [Google Scholar]
- Production of liquid fuels and activated carbons from fish waste. Fuel. 2017;187:435-445.
- [CrossRef] [Google Scholar]
- Microwave carbonized cellulose for trace pharmaceutical adsorption. Chem. Eng. J.. 2018;346(April):557-566.
- [CrossRef] [Google Scholar]
- The Removal of a Textile Dye from an Aqueous Solution Using a Biocomposite Adsorbent. Polymers (Basel). 2022;14(12):1-15.
- [CrossRef] [Google Scholar]
- Simultaneous adsorption equilibria of organic solutes in dilute aqueous solutions on activated carbon. Chem. Eng. Sci.. 1974;29(5):1279-1282.
- [CrossRef] [Google Scholar]
- Activated carbon from tomato stem by chemical activation with FeCl2. Colloids Surf. A. 2017;529(June):842-849.
- [CrossRef] [Google Scholar]
- The single co-adsorption characteristics and microscopic adsorption mechanism of biochar-montmorillonite composite adsorbent for pharmaceutical emerging organic contaminant atenolol and lead ions. Ecotoxicol. Environ. Saf.. 2020;187:109763
- [CrossRef] [Google Scholar]
- Carbon-based materials prepared from pine gasification residues for acetaminophen adsorption. Chem. Eng. J.. 2014;240:344-351.
- [CrossRef] [Google Scholar]
- Chars from gasification of coal and pine activated with K2CO3: acetaminophen and caffeine adsorption from aqueous solutions. J. Colloid Interface Sci.. 2014;433:94-103.
- [Google Scholar]
- Biomass gasification in a downdraft gasifier with a two-stage air supply: effect of operating conditions on gas quality. Biomass Bioenergy. 2014;61:236-244.
- [Google Scholar]
- Adsorption of cationic dyes on activated carbon obtained from waste Elaeagnus stone. Adsorpt. Sci. Technol.. 2016;34(9–10):512-525.
- [CrossRef] [Google Scholar]
- Adding value to gasification and co-pyrolysis chars as removal agents of Cr3+. J. Hazard. Mater.. 2017;321:173-182.
- [CrossRef] [Google Scholar]
- Nitric acid modification of activated carbon produced from waste tea and adsorption of methylene blue and phenol. Appl. Surf. Sci.. 2014;313:352-359.
- [CrossRef] [Google Scholar]
- p – p interaction effect in insertion polymerization with a -Diimine palladium systems. J. Catal.. 2019;378:184-191.
- [CrossRef] [Google Scholar]
- The Characterization of Physical Adsorption Systems. I. The Equilibrium Function and Standard Free Energy of Adsorption. J. Phys. Chem.. 1953;57(7):665-669.
- [CrossRef] [Google Scholar]
- Pesticides removal from waste water by activated carbon prepared from waste rubber tire. Water Res.. 2011;45(13):4047-4055.
- [CrossRef] [Google Scholar]
- A critical review on preparation, characterization and utilization of sludge-derived activated carbons for wastewater treatment. Chem. Eng. J.. 2015;260:895-906.
- [CrossRef] [Google Scholar]
- Gasification biochar as a valuable by-product for carbon sequestration and soil amendment. Biomass and Bioenergy. 2015;72(1):300-308.
- [CrossRef] [Google Scholar]
- Removal of atenolol by adsorption – Study of kinetics and equilibrium. J. Clean. Prod.. 2017;154:214-219.
- [CrossRef] [Google Scholar]
- Characterisation of residual char from biomass gasification: effect of the gasifier operating conditions. J. Clean. Prod. 2016
- [CrossRef] [Google Scholar]
- Multilayer adsorption in liquid chromatography – The surface heterogeneity below an adsorbed multilayer. J. Chromatogr. A. 2017;1505:50-55.
- [CrossRef] [Google Scholar]
- Bioresource Technology Manganese ferrite modified agricultural waste-derived biochars for copper ions adsorption. Bioresour. Technol.. 2023;367(October 2022)
- [CrossRef] [Google Scholar]
- Graphitic biochar as a cathode electrocatalyst support for microbial fuel cells. Bioresour. Technol.. 2015;195:147-153.
- [CrossRef] [Google Scholar]
- Biosorption of toxic heavy metals from aqueous solution by Ulva lactuca activated carbon. Egypt. J. Basic Appl. Sci.. 2016;3(3):241-249.
- [CrossRef] [Google Scholar]
- IMARC Group, Biomass Gasification Market: Global Industry Trends, Share, Size, Growth, Opportunity and Forecast 2018-2023, IMARC Group, United States, 2017. https://www.researchandmarkets.com/reports/4535020/biomass-gasification-market-global-industry.
- Feedstock choice, pyrolysis temperature and type influence biochar characteristics: a comprehensive meta-data analysis review. Biochar. 2020;2(4):421-438.
- [CrossRef] [Google Scholar]
- Efficient removal of Acid Green 25 dye from wastewater using activated Prunus Dulcis as biosorbent: Batch and column studies. J. Environ. Manage.. 2018;210:226-238.
- [CrossRef] [Google Scholar]
- A novel hay-derived biochar for removal of tetracyclines in water. Bioresour. Technol.. 2019;274(October 2018):162-172.
- [CrossRef] [Google Scholar]
- Characterization and adsorption performance evaluation of waste char by-product from industrial gasification of solid refuse fuel from municipal solid waste. Waste Manage.. 2019;91:33-41.
- [CrossRef] [Google Scholar]
- Sorption and desorption characteristics for the removal of a toxic dye, methylene blue from aqueous solution by a low cost agricultural by-product. J. Mol. Liq.. 2016;219:279-288.
- [CrossRef] [Google Scholar]
- Film and pore diffusion modeling for adsorption of reactive red 2 from aqueous solution on to activated carbon prepared from bio-diesel industrial waste. E-Journal Chem.. 2010;7(SUPPL. 1):175-185.
- [CrossRef] [Google Scholar]
- Production of porous activated carbons from Caesalpinia ferrea seed pod wastes : Highly efficient removal of captopril from aqueous solutions. J. Clean. Prod.. 2018;197:919-929.
- [CrossRef] [Google Scholar]
- Mesoporous activated carbon from Pentace species sawdust via microwave-induced KOH activation: optimization and methylene blue adsorption. Res. Chem. Intermed.. 2018;44(May):1-21.
- [CrossRef] [Google Scholar]
- Adsorption of remazol brilliant violet 5r dye from aqueous solution onto melunak and rubberwood sawdust based activated carbon: Interaction mechanism, isotherm, kinetic and thermodynamic properties. Desalin. Water Treat.. 2021;216:401-411.
- [CrossRef] [Google Scholar]
- Removal of phosphate and nitrate over a modified carbon residue from biomass gasification. Chem. Eng. Res. Des.. 2014;92(10):1923-1933.
- [CrossRef] [Google Scholar]
- Physical activation of carbon residue from biomass gasification : Novel sorbent for the removal of phosphates and nitrates from aqueous solution. J. Ind. Eng. Chem.. 2015;21:1354-1364.
- [CrossRef] [Google Scholar]
- Copper(II) adsorption by activated carbons from pecan shells: Effect of oxygen level during activation. Ind. Crops Prod.. 2009;30(1):72-77.
- [CrossRef] [Google Scholar]
- Equilibrium, kinetic and thermodynamic studies for dynamic adsorption of benzene in gas phase onto activated carbon produced from elaeagnus angustifolia seeds. J. Environ. Chem. Eng.. 2019;7:102947
- [CrossRef] [Google Scholar]
- CO2 Sorption. Boston: William Andrew Publishing; 2011. p. :293-339. Chapter 10
- About the theory of so-called adsorption of soluble substances. Sven. Vetenskapsakad. Handingarl. 1898;24:1-39.
- [Google Scholar]
- Valorization of coffee grounds into activated carbon using physic — chemical activation by KOH/CO2. J. Environ. Chem. Eng.. 2017;5(September):5061-5066.
- [CrossRef] [Google Scholar]
- Effect of wet chemical treatments on the distribution of surface oxides on carbonaceous materials. Carbon N. Y.. 2007;45(1):47-54.
- [CrossRef] [Google Scholar]
- The adsorption of gases on plane surfaces of glass, mica and platinum. J. Am. Chem. Soc.. 1918;40(9):1361-1403.
- [CrossRef] [Google Scholar]
- Municipal solid waste derived biochars for wastewater treatment: Production, properties and applications. Resour. Conserv. Recycl.. 2022;177(135):106003
- [CrossRef] [Google Scholar]
- Influences of equivalence ratio, oxygen concentration and fluidization velocity on the characteristics of oxygen-enriched gasification products from biomass in a pilot-scale fluidized bed. Int. J. Hydrogen Energy. 2018;43(31):14214-14225.
- [CrossRef] [Google Scholar]
- Char reactivity and kinetics based on the dynamic char structure during gasification by CO2. Fuel Process. Technol.. 2021;211(June 2020)
- [CrossRef] [Google Scholar]
- Modification of bio-char derived from fast pyrolysis of biomass and its application in removal of tetracycline from aqueous solution. Bioresour. Technol.. 2012;121:235-240.
- [CrossRef] [Google Scholar]
- Kinetics of Chemisorption of Gases on Solids. Chem. Rev.. Jun. 1960;60(3):267-312.
- [CrossRef] [Google Scholar]
- Dye adsorption characteristic of ultrasound pre-treated pomelo peel. J. Environ. Chem. Eng.. 2018;6(2):3502-3509.
- [CrossRef] [Google Scholar]
- Influence of surrounding conditions and fuel size on the gasification rate of biomass char in a fluidized bed. Fuel Process. Technol.. 2016;144:323-333.
- [CrossRef] [Google Scholar]
- Adsorption of diclofenac sodium onto commercial organoclay: Kinetic, equilibrium and thermodynamic study. Powder Technol.. 2019;345:140-150.
- [CrossRef] [Google Scholar]
- Activated carbon derived from carbon residue from biomass gasification and its application for dye adsorption: kinetics, isotherms and thermodynamic studies. Bioresour. Technol.. 2016;200:350-359.
- [CrossRef] [Google Scholar]
- Gasifier biochar effects on nutrient availability, organic matter mineralization, and soil fauna activity in a multi-year Mediterranean trial. Agric. Ecosyst. Environ.. 2016;215:30-39.
- [CrossRef] [Google Scholar]
- Porosity in Carbons: Modeling, in Activated Carbon. Oxford: Elsevier; 2006. p. :87-142.
- Equilibrium, kinetic and thermodynamic studies of a low-cost biosorbent for the removal of Congo red dye: acid and CTAB-acid modified celery (Apium graveolens) J. Mol. Struct.. 2019;1176:181-193.
- [CrossRef] [Google Scholar]
- Optimization of activated carbon production from sunflower seed extracted meal: Taguchi design of experiment approach and analysis of variance. J. Clean. Prod.. 2018;189:602-611.
- [CrossRef] [Google Scholar]
- Development of rice straw activated carbon and its utilizations. J. Environ. Chem. Eng.. 2018;6(4):5221-5229.
- [CrossRef] [Google Scholar]
- Mistakes and inconsistencies regarding adsorption of contaminants from aqueous solutions: a critical review. Water Res.. 2017;120:88-116.
- [CrossRef] [Google Scholar]
- Adsorption of Cadmium Ions by Wheat Bran Treated with Pectinase. Chem. Pharm. Bull. (Tokyo). 2011;59(11):1400-1402.
- [CrossRef] [Google Scholar]
- Adsorption capability of virgin and calcined wheat bran for molybdenum present in aqueous solution and elucidating the adsorption mechanism by adsorption isotherms, kinetics, and regeneration. J. Environ. Chem. Eng.. 2018;6(4):4459-4466.
- [CrossRef] [Google Scholar]
- Physical synthesis and characterization of activated carbon from date seeds for CO2 capture. J. Environ. Chem. Eng.. 2018;6(4):4245-4252.
- [CrossRef] [Google Scholar]
- Significance of biochar application to the environment and economy. Ann. Agric. Sci.. 2019;64(2):222-236.
- [CrossRef] [Google Scholar]
- Removal of malachite green from aqueous solution using pulverized teak leaf litter: equilibrium, kinetic and thermodynamic studies. Chem. Cent. J.. 2018;12(1):1-10.
- [CrossRef] [Google Scholar]
- Palies, P., 2020. “2 - Premixed combustion for combustors. In: Stabilization and Dynamic of Premixed Swirling Flames: Prevaporized, Stratified, Partially, and Fully Premixed Regimes, P. B. T.-S. and D. of P. S. F. Palies, Ed. Academic Press, pp. 57–103.
- Production and characterization of activated carbon from barley straw by physical activation with carbon dioxide and steam. Biomass and Bioenergy. 2018;115(January):64-73.
- [CrossRef] [Google Scholar]
- Utilization of fruit processing industry waste as green activated carbon for the treatment of heavy metals and chlorophenols contaminated water. J. Clean. Prod.. 2017;162:958-972.
- [CrossRef] [Google Scholar]
- Chars from wood gasification for removing H2S from biogas. Biomass and Bioenergy. 2020;142(September):105754
- [CrossRef] [Google Scholar]
- Preparation of an alternative adsorbent from Acacia Mearnsii wastes through acetosolv method and its application for dye removal. J. Cleaner Product.. 2018;180:386-394.
- [Google Scholar]
- Açaí waste beneficing by gasification process and its employment in the treatment of synthetic and raw textile wastewater. J. Clean. Prod.. 2019;240
- [CrossRef] [Google Scholar]
- Brilliant Green Dye Sorption onto Snail Shell-rice Husk: Statistical and Error Function Models as Parametric Isotherm Predictors. J. Environ. Sci. Technol.. 2019;12(2):65-80.
- [CrossRef] [Google Scholar]
- Chemical versus physical activation of coconut shell: a comparative study. Microporous Mesoporous Mater.. 2012;152:163-171.
- [CrossRef] [Google Scholar]
- Effects of biomass feedstocks and gasification conditions on the physiochemical properties of char. Energies. 2013;6(8):3972-3986.
- [CrossRef] [Google Scholar]
- Physical properties and reactivity of char obtained from downdraft gasification of sorghum and eastern red cedar. Fuel. 2015;143:383-389.
- [CrossRef] [Google Scholar]
- Effect of properties of activated carbon on malachite green adsorption. Fuel. 2019;249(October 2018):45-53.
- [CrossRef] [Google Scholar]
- Engineered/designer biochar for contaminant removal/immobilization from soil and water: potential and implication of biochar modification. Chemosphere. 2016;148:276-291.
- [CrossRef] [Google Scholar]
- Biosorption characteristics of methylene blue and malachite green from simulated wastewater onto Carica papaya wood biosorbent. Surf. Interfaces. 2018;10(September 2017):197-215.
- [CrossRef] [Google Scholar]
- A review on recent technological advancement in the activated carbon production from oil palm wastes. Chem. Eng. J.. 2017;314:277-290.
- [CrossRef] [Google Scholar]
- A novel, eco-friendly and green synthesis of PPAC-ZnO and PPAC-nZVI nanocomposite using pomegranate peel: Cephalexin adsorption experiments, mechanisms, isotherms and kinetics. Adv. Powder Technol.. 2020;31(4):1612-1623.
- [CrossRef] [Google Scholar]
- Application of adsorption process for effective removal of emerging contaminants from water and wastewater. Environ. Pollut.. 2021;280:116995
- [CrossRef] [Google Scholar]
- Residual gasification char applied to tar reforming in a pilot-scale gasifier: Performance and evolution of char properties for perspective cascade uses. Fuel Process. Technol.. 2020;210(April):106546
- [CrossRef] [Google Scholar]
- Waste chars from wood gasification and wastewater sludge pyrolysis compared to commercial activated carbon for the removal of cationic and anionic dyes from aqueous solution. Bioresour. Technol. Rep.. 2020;10(March):100421
- [CrossRef] [Google Scholar]
- Carbons prepared from coffee grounds by H3PO4 activation: characterization and adsorption of methylene blue and Nylosan Red N-2RBL. J. Hazard. Mater.. 2010;175(1–3):779-788.
- [CrossRef] [Google Scholar]
- Comparison of a homemade cocoa shell activated carbon for reactive violet 5 dye. Chem. Eng. J.. 2014;248:315-326.
- [Google Scholar]
- Activated carbon modifications to enhance its water treatment applications. An overview. J. Hazard. Mater.. 2011;187(1–3):1-23.
- [CrossRef] [Google Scholar]
- Phenol removal by activated carbon produced from avocado kernel seeds. Chem. Eng. J.. 2011;174:49-57.
- [Google Scholar]
- Biosorption of zinc (II) from synthetic wastewater by using Inula Viscosa leaves as a low-cost biosorbent: Experimental and molecular modeling studies. J. Environ. Manage.. Jan. 2023;326:116742
- [CrossRef] [Google Scholar]
- Chemically activated carbon residue from biomass gasification as a sorbent for iron(II), copper(II) and nickel(II) ions. J. Water Process Eng.. 2014;4:12-24.
- [CrossRef] [Google Scholar]
- Sulphate removal from water by carbon residue from biomass gasification: Effect of chemical modification methods on sulphate removal efficiency. BioResources. 2016;11(2):3136-3152.
- [CrossRef] [Google Scholar]
- Monolayer and multilayer adsorption isotherm models for sorption from aqueous media. Korean J. Chem. Eng.. 2015;32(5):787-799.
- [CrossRef] [Google Scholar]
- Recirculation of char from biomass gasification: effects on gasifier performance and end-char properties. Renew. Energy. 2020;147:806-813.
- [CrossRef] [Google Scholar]
- Efficient mercury removal from wastewater by pistachio wood wastes-derived activated carbon prepared by chemical activation using a novel activating agent. J. Environ. Manage.. 2018;223(July):1001-1009.
- [CrossRef] [Google Scholar]
- Adsorbent - Adsorbate Interactions in the Adsorption of Cd (II) and Hg (II) on Ozonized Activated Carbons. Environ. Sci. Technol.. 2002;36(17):3850-3854.
- [Google Scholar]
- Hybrid synthesis of novel material through acid modification followed ultrasonication to improve adsorption capacity for zinc removal. J. Clean. Prod.. 2018;172:92-105.
- [CrossRef] [Google Scholar]
- Performance of new mesoporous carbon sorbent prepared from grape industrial processing wastes for malachite green and congo red removal. Chem. Eng. Res. Des.. 2015;100:27-38.
- [CrossRef] [Google Scholar]
- Activated Carbon Market - Supply and Demand Update – Or The Carbon Conundrum. Tucson, Arizona: Water Conditioning & Purification; Jun. 2011.
- Monolayer-multilayer adsorption phenomenological model: Kinetics, equilibrium and thermodynamics. Chem. Eng. J.. 2016;284:1328-1341.
- [CrossRef] [Google Scholar]
- Textural and chemical factors affecting adsorption capacity of activated carbon in highly efficient desulfurization of diesel fuel. Carbon N. Y.. 2009;47(10):2491-2500.
- [CrossRef] [Google Scholar]
- Highly efficient adsorption of cationic dye by biochar produced with Korean cabbage waste. Bioresour. Technol.. 2017;224:206-213.
- [CrossRef] [Google Scholar]
- A review on surface modification of activated carbon for carbon dioxide adsorption. J. Anal. Appl. Pyrolysis. 2010;89(2):143-151.
- [CrossRef] [Google Scholar]
- Honeycomb structured activated carbon synthesized from Pinus roxburghii cone as effective bioadsorbent for toxic malachite green dye. J. Water Process Eng.. 2019;vol. 32, no. August:100931
- [CrossRef] [Google Scholar]
- Towards a sustainable paradigm of waste-to-energy process: enhanced anaerobic digestion of sludge with woody biochar. J. Clean. Prod.. 2016;135:1054-1064.
- [CrossRef] [Google Scholar]
- Optimization and characterization of sliced activated carbon prepared from date palm tree fronds by physical activation. Biomass and Bioenergy. 2015;73:124-134.
- [CrossRef] [Google Scholar]
- Mercury adsorption of modified mulberry twig chars in a simulated flue gas. Bioresour. Technol.. 2013;136:182-187.
- [CrossRef] [Google Scholar]
- Adsorption of CO2 on KOH activated carbon adsorbents: effect of different mass ratios. J. Environ. Manage.. 2019;250:109457
- [CrossRef] [Google Scholar]
- Adsorption of methyl violet in aqueous solutions by poly(acrylamide-co-acrylic acid) hydrogels. Radiat. Phys. Chem.. Feb. 2003;66(2):117-127.
- [CrossRef] [Google Scholar]
- Removal of emerging contaminants from the environment by adsorption. Ecotoxicol. Environ. Saf.. 2018;150:1-17.
- [CrossRef] [Google Scholar]
- Adsorption of pharmaceutical compounds and an endocrine disruptor from aqueous solutions by carbon materials. J. Environ. Sci. Heal., Part B Pestic., Food Contam., Agric. Wastes. 2012;47(7):640-652.
- [CrossRef] [Google Scholar]
- Removal of atenolol and isoproturon in aqueous solutions by adsorption in a fixed-bed column. Ind. Eng. Chem. Res.. 2012;51(13):5045-5055.
- [CrossRef] [Google Scholar]
- Adsorption of methylene blue on cashew nut shell based carbons activated with zinc chloride: the role of surface and structural parameters. J. Mol. Liquids. 2017;229:465-471.
- [CrossRef] [Google Scholar]
- Effect of activated carbons modification on porosity, surface structure and phenol adsorption. J. Hazard. Mater.. 2008;151(2–3):414-421.
- [CrossRef] [Google Scholar]
- Evaluation of the effectiveness and mechanisms of acetaminophen and methylene blue dye adsorption on activated biochar derived from municipal solid wastes. J. Environ. Manage.. 2018;210:255-262.
- [CrossRef] [Google Scholar]
- Preparation and characterization of activated carbon from rubber-seed shell by physical activation with steam. Biomass and Bioenergy. 2010;34(4):539-544.
- [CrossRef] [Google Scholar]
- Mesoporous activated carbon from starch for superior rapid pesticides removal. Int. J. Biol. Macromol.. 2019;121:806-813.
- [CrossRef] [Google Scholar]
- Batch and column studies for phenol removal from aqueous solutions using laboratory prepared low-cost activated carbon as an adsorbent. Chem. Technol. An Indian J.. 2017;12(2):1-32.
- [Google Scholar]
- Insight into the adsorption kinetics models for the removal of contaminants from aqueous solutions. J. Taiwan Inst. Chem. Eng.. 2017;74:25-48.
- [CrossRef] [Google Scholar]
- Adsorption of methylene blue onto biomass-based activated carbon by FeCl 3 activation: Equilibrium, kinetics, and thermodynamic studies. J. Anal. Appl. Pyrolysis. 2012;97:116-122.
- [CrossRef] [Google Scholar]
- Physical adsorption characterization of nanoporous materials. Chemie-Ingenieur-Technik. 2010;82(7):1059-1073.
- [CrossRef] [Google Scholar]
- Steam gasification of Miscanthus derived char: the reaction kinetics and reactivity with correlation to the material composition and microstructure. Energy Convers. Manag.. 2020;219(May):113026
- [CrossRef] [Google Scholar]
- Mechanistic study of atenolol, acebutolol and carbamazepine adsorption on waste biomass derived activated carbon. J. Mol. Liq.. 2017;241:386-398.
- [CrossRef] [Google Scholar]
- State equation of the solid-gas interface layers. Acta chim. hung.. 1971;69:311-328.
- [Google Scholar]
- Molecular modeling of cationic dyes adsorption on agricultural Algerian olive cake waste. J. Mol. Liq.. 2018;264:127-133.
- [CrossRef] [Google Scholar]
- Highly efficient activated carbon from Glebionis coronaria L. biomass: optimization of preparation conditions and heavy metals removal using experimental design approach. J. Environ. Chem. Eng.. 2016;4(4):4549-4564.
- [CrossRef] [Google Scholar]
- Insights into the mechanism of cationic dye adsorption on activated charcoal: The importance of Π-Π interactions. Process Saf. Environ. Prot.. 2017;107:168-180.
- [CrossRef] [Google Scholar]
- Removal of phenol and chlorine from wastewater using steam activated biomass soot and tire carbon black. J. Hazard. Mater.. 2019;365(May 2018):846-856.
- [CrossRef] [Google Scholar]
- Screening biochars for heavy metal retention in soil: Role of oxygen functional groups. J. Hazard. Mater.. 2011;190(1–3):432-441.
- [CrossRef] [Google Scholar]
- Adsorption performance and mechanism of cationic and anionic dyes by KOH activated biochar derived from medical waste pyrolysis. Environ. Pollut.. 2022;314(September):120271
- [CrossRef] [Google Scholar]
- Textile wastewater treatment by agro-industrial waste: Equilibrium modelling, thermodynamics and mass transfer mechanisms of cationic dyes adsorption onto low-cost lignocellulosic adsorbent. J. Taiwan Inst. Chem. Eng.. 2019;96:439-452.
- [CrossRef] [Google Scholar]
- Chemical evaluation of chars produced by thermochemical conversion (gasification, pyrolysis and hydrothermal carbonization) of agro-industrial biomass on a commercial scale. Biomass and Bioenergy. 2013;59:264-278.
- [CrossRef] [Google Scholar]
- Adsorption of methyl violet from aqueous solutions by the biochars derived from crop residues. Bioresour. Technol.. 2011;102:10293-10298.
- [CrossRef] [Google Scholar]
- Hydrogen peroxide modification enhances the ability of biochar (hydrochar) produced from hydrothermal carbonization of peanut hull to remove aqueous heavy metals: Batch and column tests. Chem. Eng. J.. 2012;200–202:673-680.
- [Google Scholar]
- Dye and its removal from aqueous solution by adsorption: a review. Adv. Colloid Interface Sci.. 2014;209:172-184.
- [CrossRef] [Google Scholar]
- Adsorption of paracetamol and ketoprofenon activated charcoal prepared from the residue of the fruit of Butiacapitate : Experiments and theoretical interpretations. Chem. Eng. J.. 2022;454(September):2023.
- [CrossRef] [Google Scholar]
- A critical review on sustainable biochar system through gasification: Energy and environmental applications. Bioresource Technology. 2017
- [CrossRef] [Google Scholar]
- Simultaneous removal of dye and heavy metal by banana peels derived hierarchically porous carbons. J. Taiwan Inst. Chem. Eng.. 2018;93:543-553.
- [CrossRef] [Google Scholar]
- Steam gasification of char derived from penicillin mycelial dreg and lignocellulosic biomass: influence of P, K and Ca on char reactivity. Energy 2021
- [CrossRef] [Google Scholar]
- Acridine orange adsorption by zinc oxide / almond shell activated carbon composite: operational factors, mechanism and performance optimization using central composite design and surface modeling. J. Environ. Manage.. 2018;206:383-397.
- [CrossRef] [Google Scholar]
- Gasification characteristics of sawdust char at a high-temperature steam atmosphere. Energy. 2017;128:509-518.
- [CrossRef] [Google Scholar]
- Handy synthesis of robust Ni/carbon catalysts for methane decomposition by selective gasification of pine sawdust. Int. J. Hydrogen Energy. 2018;43(42):19414-19419.
- [CrossRef] [Google Scholar]
- Methane decomposition over Ni/ carbon catalysts prepared by selective gasification of coal char. Energy Convers. Manage.. 2018;177(September):330-338.
- [CrossRef] [Google Scholar]
- Fuel gas production and char upgrading by catalytic CO2 gasification of pine sawdust char. Fuel. 2020;280(April):118686
- [CrossRef] [Google Scholar]
- Utilization of Crofton weed for preparation of activated carbon by microwave induced CO2 activation. Chem. Eng. Process. Process Intensif.. 2014;82:1-8.
- [CrossRef] [Google Scholar]
- Experimental study on gasification of oil sludge with steam and its char characteristic. J. Hazard. Mater. 2021
- [CrossRef] [Google Scholar]
- Effects of surface oxygen functional groups on activated carbon on the adsorption and photocatalytic degradation activities of a TiO2-AC hybrid for methylene blue and methylene orange. Carbon N. Y.. 2018;130:844-845.
- [CrossRef] [Google Scholar]
- Recent advances for dyes removal using novel adsorbents: a review. Environ. Pollut.. 2019;252:352-365.
- [CrossRef] [Google Scholar]


