

Translate this page into:
Geochemistry study of soil affected catastrophically by tsunami disaster triggered by 2004 Indian Ocean earthquake using a fourth harmonics (λ = 266 nm) Nd:YAG laser induced breakdown spectroscopy
⁎Corresponding authors. nasrullah.idris@unsyiah.ac.id (N. Idris), magondal@kfupm.edu.sa (M.A. Gondal)
-
Received: ,
Accepted: ,
This article was originally published by Elsevier and was migrated to Scientific Scholar after the change of Publisher.
Peer review under responsibility of King Saud University.
Abstract
In this work, laser induced breakdown spectroscopy (LIBS) analysis of the soil samples collected from Aceh, a place in Indonesia worst affected by 2004 Indian Ocean tsunami, was conducted. In the LIBS experimental system, a high energy pulsed laser beam was focused on the tsunami affected soil samples and the atomic emission lines, originating from the laser induced plasma were recorded using locally developed laser induced breakdown spectrometer. Our results show that the concentrations of many elements especially terrestrial markers, namely titanium, iron, and carbonate marker such as magnesium, are higher in the tsunami-affected samples than that in the unaffected samples collected from the same neighborhood. The quantification of Ti, Fe and Mg were carried out using Ti II 334.94, Fe I 438.35, and Mg I 277.98 nm atomic transition lines respectively by drawing the calibration curve by preparing the samples of known concentrations in unaffected soil matrix. In order to ensure accurate quantification, the local thermal equilibrium of the laser-induced plasma was verified using Mc Writher criterion, for which the plasma temperature was estimated using linearized Boltzmann plot for six iron atomic transition lines and the electron number density in the plasma was estimated using Stark broadened Fe I 540.4 nm atomic lines. The estimated temperature and electron number density of the laser induced plasma are 9642 K and 3.5 × 1016 cm−3 respectively. The concentrations of Ti, Fe and Mg in tsunami unaffected soil are 0.09, 3.2 and 0.02 w/w% and in tsunami affected soil are 0.14, 7.9 and 0.048 w/w% respectively. These values are in good agreement with XRF data. The elemental ratios extracted from LIBS signal intensity revealed that LIBS emission intensity ratios of several elements, such as Si/Ti, Al/Ti and Sr/Ba are potential candidates as the distinctive geochemical signature for identification the soil impacted and unimpacted by the 2004 Indian Ocean giant tsunami. The advantage of using LIBS for the elemental analysis is that the sample can be analyzed in its pristine form without any need cumbersome sample preparation method, which has the risk of bringing in external additives through chemicals used for the sample preparation. Other advantages of LIBS technique are that the analysis can be in situ and can be carried out remotely.
Keywords
LIBS
2004 Indian Ocean tsunami
Tsunami impacted soil
Elemental analysis
Environmental protection
Elemental ratio
Geochemical signature

1 Introduction
A massive undersea earthquake, measuring 9.1 in Richter scale with the epicentre at the offshore of Sumatra Island, Indonesia, set off the 2004 Indian Ocean tsunami on December 26, 2004, which initially hit the shoreline of Banda Aceh city, killing more than 100,000 people and this reduced the whole city into heaps of rubble. The giant tsunami then hit coastal region of various countries across Indian Ocean, causing a huge death toll and leaving catastrophic damage of properties and environment in the inundated land. The slipping of heavy ocean plate under a lighter continental plate that caused this earthquake made the ocean floor to rise as high as 40 m (Bilham, 2005; Lay et al., 2005; Meltzner et al., 2006; Chadha et al., 2005; Obura, 2006). This unusual geological upheaval deposited a large volume of sea sediments and salt that contains enormous amount of organic and inorganic materials and heavy metals (Tsuji et al., 2006; Moore et al., 2006; Paris et al., 2007; Hawkes et al., 2007). Many systematic studies carried out in the soil samples collected from the affected areas, including Thailand and Aceh, Indonesia indicated a large amount of hazardous organic and inorganic chemicals present in the impacted soil (Szczuciński et al., 2006; Chaerun et al., 2009; Idris et al., 2016). The soil loaded with new chemicals by the tsunami wave persists in the soil surface for a long time after the disaster, particularly in the low-lying landmasses and the places, which have no drainage systems and damaged drainage systems (McLeod et al., 2010; Marohn et al., 2012; Daly et al., 2017). Although, the organic contents in the inundated land enhance the fertility of the land, the chemical contamination in the cultivated crops and the dangers of human health and wellbeing are the serious cause for concern (Tsuji et al., 2006; Moore et al., 2006; Paris et al., 2007; Hawkes et al., 2007; Szczuciński et al., 2006; Chaerun et al., 2009; Idris et al., 2016; McLeod et al., 2010; Marohn et al., 2012; Daly et al., 2017). It is well known that sea water; sediment and marine biota accumulate radionuclides, both from natural and anthropogenic sources (El-Saharty, 2013; Zakaly et al., 2021; Carvalho, 2018). It is considered, radioactive elements are brought inland when the tsunami hits and is left in the tsunami-inundated area. Hence the periodic detection and the monitoring of the chemical contents in the impacted soil is of paramount importance, as it not only alerts the need for safety and precaution (Pongpiachan et al., 2013; Kozak and Niedzielski, 2013; Kozak and Niedzielski, 2017), but also gives insights about the bioremediation of the tsunami impacted soils (Santiago-Fandiño and Kim, 2015; Chagué-Goff et al., 2017).
In the case of elemental analysis, there are many techniques currently used like X-ray fluorescence (XRF), atomic emission spectroscopy (AAS) and inductively coupled plasma mass spectroscopy (ICP-MS) (Harris, 2015). All these elemental detection techniques involve time-consuming and complicated sample preparations, which may lead to inaccurate results due to the external chemicals used during the sample preparation. As the LIBS technique is rapid for multi elemental analysis, a large number of samples collected from the vast span of tsunami-affected area can be more easily analysed compared to the other cumbersome elemental analysis methods. Also, LIBS is a reliable method for elemental analysis, due its inherent simplicity, flexibility, sensitivity and selectivity; and this method is capable of analysing solid, liquid and gas samples in laboratory or remotely (Cremers and Chinni, 2009; Cremers and Radziemski, 2006; Miziolek et al., 2006; Yueh et al., 2000).
In this work, LIBS was used for the elemental analysis of the tsunami impacted soil samples taken from several regions in Aceh, a place in Indonesia severely destroyed by 2004 Indian Ocean tsunami. Although, it is quite important to analyse elemental soil composition after tsunami in agricultural and environmental point of view (Bañuelos and Ajwa, 1999; Sahuquillo et al., 2003; Swaine, 2000), in this work, as a first attempt, we restricted our focus mainly on three elements, namely terrestrial markers (Ti, Fe) and carbonate marker (Mg), and we continue working on other elements and will be reported in future. In agricultural perspective, the co-existence of titanium and iron in soil in the right proportion is very beneficial as these two elements have synergistic role to play. For example, when the level of Fe is depleted in the soil, Ti triggers to enzymes in the plant to increase the Fe intake. As a result, the presence of Ti in soil is very important during the Fe deficiency. On the other hand, if the level of Ti is beyond certain limit, then the soil becomes quite toxic and is harmful for the plant growth (Aubert and Pinta, 1977; Lyu et al., 2017; Simonin et al., 2016). Iron is one of the most essential nutrients for plant growth, whose deficiency hampers the plant health and causes chlorosis (Thompson and Troeh, 1973; Wallihan, 1966), and on the other hand excessive amount of Fe in the soil causes many kinds of metabolic disorders in plants (Wallihan, 1966; Brown and Jones, 1977). The level of iron in the soil varies from place to place depends on the type of soil, geological background, geographical location, history of natural disasters, and anthropogenic activities, and on average the unaffected natural soil contains nearly 4 % of iron content (Tanaka and Navasero, 1966). In addition, the excessive Mg content in soil is not favourable for the plant growth, although Mg is one of the important nutrient’s necessary agricultural products and for human beings when these products are taken as food (Guo et al., 2016; Kobayashi et al., 2005). Any gradual change of natural, environmental, climatic conditions in a geographical location, slowly alter the elemental and chemical composition of the soil in that area, and mostly plants and the bio system slowly adapts to this change of soil conditions. However, the sudden unexpected big disasters like tsunami trigger an abrupt and massive upheaval to the soil conditions, which may be bad for agriculture, health and wellbeing of animals and humans. Hence, it is important to closely monitor the chemical composition of the soil, water and air in the affected region not only for ensuring the quality of life and take precautionary measures to protect the health and the environment but also for disaster mitigation namely studying the characteristics of the recent and past tsunamis. It was found that geochemical proxies are useful to describe tsunami deposits and to track the maximum inundation limit of the tsunami both the recent and paleo tsunamis. The chemical signatures, such as Ca/Ti versus Sr/Ba, can be used to distinguish tsunami deposit from the surrounding soil. The saltwater indicators such as Cl, S can be used to trace tsunami maximum inundation limit, even beyond the sand deposit and long after the tsunami event (Chagué-Goff et al., 2015; Chagué-Goff et al., 2012). Geochemical proxies especially Na/Ti ratios are useful indicators of marine incursions both for the modern and paleotsunami deposits (Watanabe et al., 2020). This work in particular is the step towards this direction. There are many works on LIBS analysis of soil, in different perspectives like agriculture, geographical distribution and alike. The novelty of this work is that the LIBS soil analysis is carried out to study the changes in the elemental profile of the soil as a result of the upheaval of tsunami and earth quake.
2 Experiment setup
2.1 LIBS setup
The LIBS detection system used in this work is explained in our earlier works (Mehder et al., 2016). In LIBS, a focussed high energy pulsed laser creates a luminous plasma plume on the sample surface, which consists of ions, electrons, excited atoms and molecules. This laser induced plasma cools down after certain characteristic time delay, and regular atomic emissions from the neutral and ionized species take place and these emission lines are the fingerprints of the individual elements present in the sample. This plasma plume is directed on to the spectrograph equipped with an intensified charge coupled device (ICCD) camera system and the data acquisition is carried out after appropriate time delay.
In short, as shown in Fig. 1, the fourth harmonic (λ = 266 nm) of the pulsed Nd: YAG laser (Quantel, Brilliant B) with a pulse energy of 40 mJ/pulse, a pulse duration of 8 ns and a pulse repetition rate of 10 Hz was used as an excitation source. The laser beam was focused using a biconvex lens (f = +30 mm) onto the sample surface. The emission from the laser induced plasma was collected by a fiber optic cable attached with a built lens, which is directed to the entrance slit of the spectrograph (Andor Shamrock 500i-A), having grating of 1800 lines/mm groove density. The exit port of the spectrograph is attached to ICCD camera (Andor, iStar 320 T), which is attached with a Q- switch triggered built in delay generator to delay the acquisition of the ICCD, until the plasma cools down. As the laser ablates the sample, a tiny crater is formed on the sample surface, which destroys the optimum focal point and as a result, the LIBS signal is inadvertently reduced. In order to avoid this sample deterioration by crater formation, the sample is fixed on a X-Y translator and constantly moved while the acquisition is taking place. The LIBS signal was accumulated and averaged to 25 laser shots. The delay time between the laser excitation and the acquisition and the gate opening time (gate width) was kept at 250 ns and 2 microseconds respectively. The Gaussian beam quality factor of the laser beam is between 1.3 and 1.5. With this factor and pre focused beam diameter of about 5 mm, and the lens with the focal length of 50 mm, the focused laser beam on the sample surface should be around 10 µm for 266 nm laser. The X-ray fluorescence spectroscopy (XRF) used for this study is Elvatech (Elvax Pro).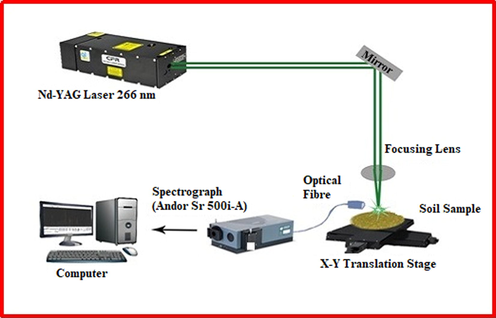
Schematic of experimental setup of the LIBS system used in this work.
2.2 Sample collection for LIBS analysis
The tsunami affected soil samples used in this work were collected from several regions of the main land of affected Aceh, Indonesia, namely Banda Aceh City, Aceh Besar Regency and West Aceh Regency. The sampling location is displayed in a map shown in Fig. 2. For the sake of comparison, the unaffected samples were also collected from the close neighbourhood of the location, where the former soil sample was collected. Banda Aceh is the capital of Aceh province, located at the northernmost part of Sumatera Island, Indonesia and during 2004 Indian Ocean tsunami, this city was badly devastated and the sea water inundated as far as 6 km inland (Tsuji et al., 2006; Moore et al., 2006; Paris et al., 2007). West Aceh Regency is the area closest to the epicentre of the mega 2004 Indian Ocean earthquake. The area was destroyed severely by the 2004 Indian Ocean tsunami. Coastal regions of Aceh Besar Regency were also devastated by the tsunami. The soil sample was collected from 3 points in Banda Aceh (Banda Aceh 4, Banda Aceh 5 and Banda Aceh 8), 4 points in West Aceh (Kp. Cot 4, Kp. Cot 5, Kp. Cot 6 and Kp. Cot 7) and 4 points in Aceh Besar (Aceh Besar 1, Aceh Besar 2, Aceh Besar 3 and Aceh Besar 9), respectively. The sampling points are located in positions about 2 km to 3 km in the affected land from the coastal line.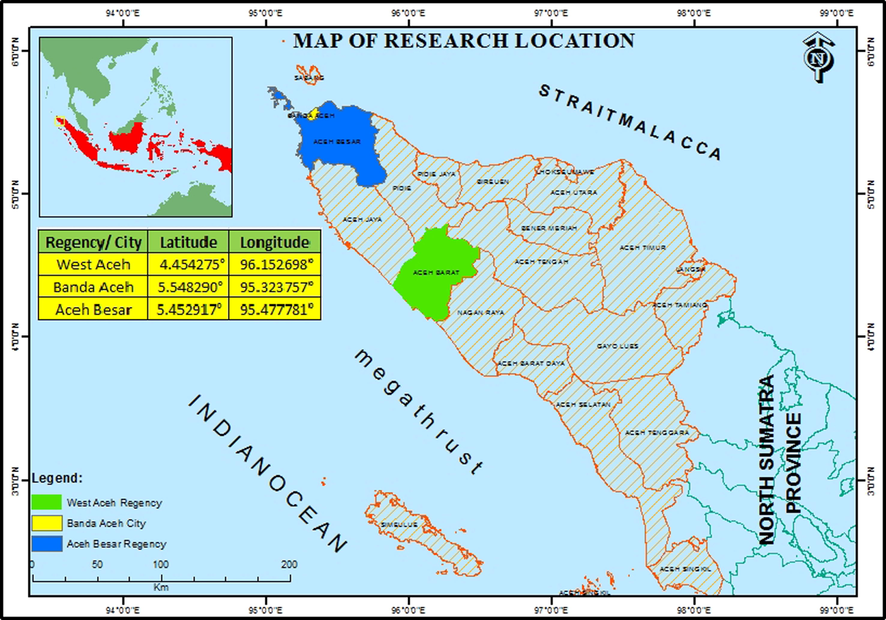
Location of tsunami affected soil sample collection.
The unaffected soil samples were collected from 3 points in Aceh Besar Regency, namely 1st point in Tungkop District (Tungkop), 2nd point in Ulee Kareng District (Pango) and 3rd point in Kuta Baro District (Blang Bintang). The location of each point is approximately about 5 km, 8 km and 10 km away from the coastal line, respectively. Thus, it is safe to consider that the sampled soils is not affected by 2004 Indian Ocean tsunami. In order to avoid the subsequent anthropogenic contamination after the tsunami struck, at each location, the soil samples were collected from the depth of 10 cm. It is assumed that the sampling site is preserved since there is no noticeable reconstruction and occupation has taken place in the site. The soil samples were sieved to get rid of organic solid matters like leaves, root and grass and the samples were then dried in an electric oven at 120 °C to eliminate moisture. The purified and dried soil samples were ground and sieved to obtain homogenous size of soil particles and these homogenized soil samples were made into pellet form with a dimension of 20 mm in diameter and 3 mm in thickness using a hydraulic press with 3-ton pressure.
3 Results and discussion
3.1 Optimization of LIBS spectrometer for the elemental analysis of tsunami affected soils
3.1.1 Optimization of time delay
In the LIBS analysis, the high power, pulsed laser imparts huge energy to the sample and as a result, the plasma of the sample is created on the surface. This laser induced plasma on the sample surface contains excited atoms, excited molecules, ionized atoms, ionized molecule and a cloud of electrons, and hence there are emissions from all these excited and ionized species, resulting in a featureless broad band emission. Under this condition of continuum emission, it is not possible to make some meaningful analysis of the material. But as the plasma cools down, most of the excited and ionized species recombine and at a particular time, it reaches a stage where only some of the neutral atoms and ions are in the excited state. At this time it is possible to observe the emissions purely from the excited atoms, which can give us an indication about the elements present in the sample. The time taken for the initial plasma to evolve into the state of pure excited atoms and ions depend on the experimental and laser parameters and also on the nature of the sample. So in order to carry out a meaningful analysis, it so important to start taking the acquisition after the plasma cools down, where the continuum background on which the elemental transitions are modulated disappears and gives out a clean spectral representation. Hence, the delay time between the laser excitation and the acquisition has to be optimized for every experiment. In our case, for the optimization of the time delay, we used the LIBS emission intensity of atomic transition line of titanium at 334.9 nm and collected the signal in the delay time range of 50 to 300 ns in steps of 50 ns. It is obvious from Fig. 3 that the intensity of Ti II 334.9 nm atomic transition line initially starts to increase with the increased delay time and at a particular delay time of 200 ns, the LIBS intensity attained the maximum value, after which it starts declining. Hence we found that 200 ns is the optimum delay between the laser excitation and the data acquisition and this value was used throughout this experiment for this sample. In our case the built in delay generator in the ICCD camera was triggered by the rising pulse of Q switch of the laser, and after the set delay time of 200 ns, the acquisition channel of the ICCD camera opens to collect the data. It should be noted that following the rising pulse of the Q-switch, the laser is fired within few nanoseconds.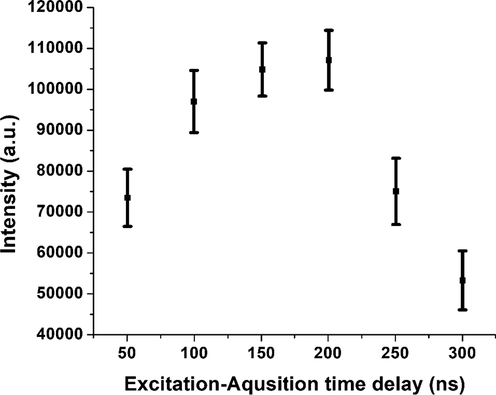
Dependence of LIBS emission intensity on delay time of the detector for Ti II 334.9 nm emission line obtained from the tsunami impacted soil sample.
3.1.2 Optimization of laser pulse energy
Another important experimental factor needs to be optimized is the laser pulse energy. This is because, when the pulse energy of the laser is very small, the produced plasma on the sample surface is too weak and as a result of it, the atomic emission intensities become very weak. On the other hand, when the laser pulse energy is very high the plasma produced is too intense, and as a result, the laser induced plasma cannot attain the local thermodynamic equilibrium condition and under this condition the plasma itself reabsorbs most of the emitted atomic radiations, thereby reducing the LIBS signal. Every sample matrix has its own optimum excitation energy, which depends on the mechanical, thermal properties and the chemical composition of the material. In our study, we carried out the energy dependence of the emission intensity of Ti II 334.9 nm atomic transition line and found 40 mJ/ pulse is the optimum energy of the excitation radiation as depicted in Fig. 4.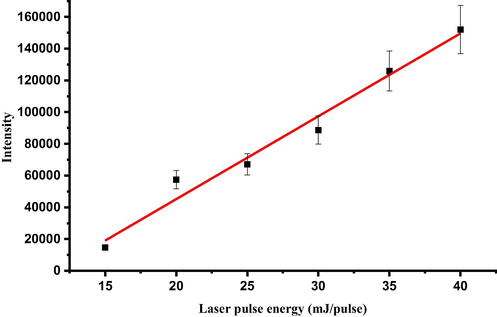
Dependence of LIBS emission intensity on laser energy for for Ti II 334.9 nm emission line obtained from the tsunami impacted soil sample.
3.1.3 Verification of local thermodynamic equilibrium of plasma
The establishment of the local thermodynamic equilibrium the soil sample is very important to realize a dependable quantitative and qualitative analysis of the tsunami affected soil samples. When the laser induced plasma of the soil sample is not in thermodynamic equilibrium, the plasma reabsorbs most of the atomic emissions and hence the LIBS spectrum thus produced cannot be true qualitative and quantitative representation of the elemental composition of the soil sample. So, one of the most important steps in the analysis of any sample by LIBS is to verify the local thermodynamic condition of the generated plasma. This can be done by the guideline proposed by McWhirter, which is known as McWhriter criterion for the local thermodynamic condition (Griem, 1997). As shown in the following Eq. (1).
As it is clear from Eq. (3), the number density can be directly calculated from the FWHM of the peak. In our case the electron number density calculated using Fe I 540.4 nm line, whose FWHM is 0.048 nm as depicted in Fig. 5, and the corresponding electron number density ne is 3.5 × 1016 cm−3, which is the left hand side value of the McWhriter criterion in Eq. (1). Fe I 540.4 nm line is selected for the number density determination from Stark broadening, as it is well resolved peak, free from the convolution of other emission peak, and has a good signal to noise ratio. This criterion is necessary to have a peak with clean Lorentian peak profile to find the full width half maximum as in Eq. (3).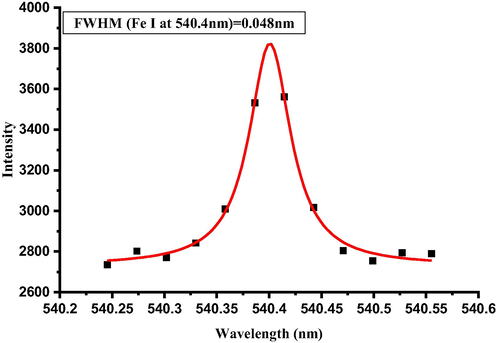
Profile of Stark broadening of neutral line of Fe (Fe I) at 540.4 nm for estimating the electron density (Ne).
The right hand side of the McWhriter criterion in Eq. (1) should be calculated using the plasma temperature. The plasma temperature can be estimated from the Boltzmann distribution of seven atomic transition lines of Fe. As we know, the population of the atoms in different energy levels obey the Boltzmann distribution, which is the function of temperature, energy of the levels and partition function. In our case, we use a set of intensities (Iij) of Fe atomic transitions normalized with the respective transition probabilities (Aij) and the degeneracy factor gij were taken from the literature (NIST Atomic Spectra, 2016). The intensity of the atomic transitions are proportional to the number of atoms occupying a particular state, and from this normalized intensity distribution for a set of atomic transition lines of Fe, we can estimate the plasma temperature. In order to make the plasma temperature estimation simpler, we transform the Boltzmann equation in linear form by taking natural logarithm on both sides as in equation.
As the intensities of the transitions are proportional to the respective radiant energies, the presence of λij in Eq. (4) is justified. The first term on the right hand side of the equation (B) contains all the constants like total number of atoms, partition function, Plank’s constant etc. If we plot the left hand side of the equation versus Ei, from the slope we can estimate the plasma temperature using Boltzmann constant k as depicted in Fig. 6. The estimated plasma temperature in our case using the transition lines of Fe is 9642 K. Using this plasma temperature, the right hand side of the McWhriter criterion in Eq. (1), is 1.9 × 1015 cm−3, which is lower than 3.5 × 1016 cm−3 and hence McWhriter criterion is satisfied and we can assure that the plasma system is in state of local thermodynamic equilibrium. Although the soil sample is a complicated sample, the produced plasma is in local thermodynamic equilibrium. It is reasonable to conclude that emission spectrum detected from plasma produced on the soil samples is deserved representative of the sample constituent and content. Thus, the LIBS signal can be used for carrying out qualitative and quantitative analysis.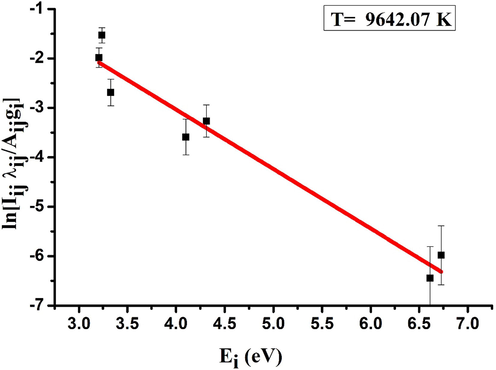
Linear Boltzmann plot of neutral iron emission lines (Fe I) for estimation of tsunami soil plasma temperature.
3.2 Qualitative and quantitative elemental analysis of tsunami affected soil
3.2.1 Qualitative LIBS analysis of tsunami affected soil
LIBS spectra were taken from the soil sample collected from three different regions of West Aceh, Banda Aceh and Aceh Besar. In general, we have observed emission spectra over a wide coverage wavelength, ranging from 200 nm to 900 nm, and we found that various organic and inorganic elements can be detected from soil samples both affected and unaffected samples by 2004 Indian Ocean tsunami. In general, we found that the emission intensity of these elements in the tsunami-affected sample is higher than in the non-tsunami-affected sample, implying its higher concentration in the tsunami affected sample. This finding is just consistent to previous study, namely the concentration of various organic and inorganic elements is significantly elevated in tsunami impacted soil as compared to unimpacted soil (Chaerun et al., 2009). In this initial report, we specifically try to look in more detail at the difference in emission intensity between the samples affected and not affected by the tsunami. In order to evaluate the possibility of getting the emission intensity ratios of these elements in the sample, we will focus on a representative emission spectrum of several elements, namely Ti, Fe and Mg. Representative LIBS spectra of tsunami affected and unaffected soil samples were comprised of some prominent transition lines of Ti, Fe and Mg in the relevant spectral region are presented in Fig. 7. The emission spectra were particularly enlarged for the respective regions of Ti, Fe and Mg emission presence. The spectra was taken from Banda Aceh 5 sample for affected soil and from Aceh Besar sample (Tungkop) for unaffected soil. The LIBS spectra for each sample were acquired by accumulating and averaging of 25 laser shots. It is obvious that in the tsunami-affected samples the LIBS signal of the transition lines of Ti, Fe and Mg is more intense than that of unaffected samples consistently in all the spectral regions of interest. In the case of Ti, the atomic transition line centred at 323.65 nm and 334.90 nm respectively in Fig. 7(a) and Fig. 7(b) indicates the enhanced level of Ti in the tsunami affected samples. For iron, for example, the atomic transition lines at 274.69 nm and 359.60 nm respectively in Fig. 7c and Fig. 7d show the enhancement of iron content in the tsunami affected soil samples. In the case of magnesium, the transition peaks centred at 279.55 nm and 518.36 nm respectively shown in Fig. 7e and Fig. 7f clearly indicate the increase of magnesium contents in tsunami affected samples. All these figures, it is quite clear that the enhancement brought in the concentrations of Ti, Fe and Mg is due to the tsunami effect. Followed by the mid sea earthquake, all these elements were brought from the sea and as the seawater flooded on the shore these minerals were deposited on the soil.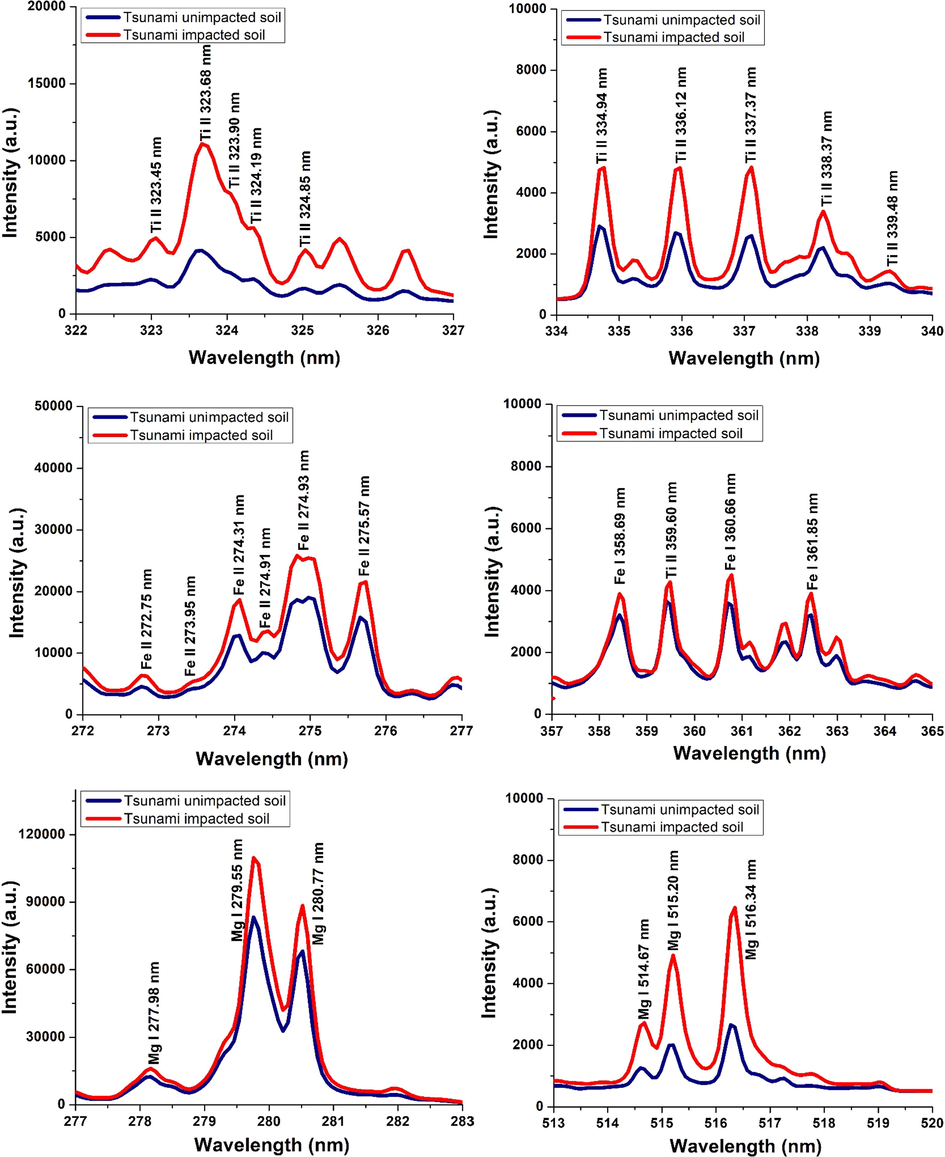
Emission line spectra of LIBS for main elements in the tsunami impacted and un-impacted in different wavelength ranges.
3.2.2 Quantitative LIBS analysis of tsunami affected soil
As mentioned in a previous section, under the local thermodynamic equilibrium condition there is a linear relation between the intensity of an atomic transition line of a particular element and the concentration of the element in the sample. Hence, the unknown concentration of an element in the tsunami affected soil sample can be estimated from the concentration versus LIBS intensity calibration curve. The calibration curves for Ti, Fe and Mg are shown in Fig. 8a, 8b, and 8c, which were drawn by spiking up the known concentrations of Ti, Fe and Mg respectively by preparing the samples of known concentrations in unaffected soil matrix. The atomic transition lines used for the calibration curves of Ti, Fe and Mg are Ti II 334.94 nm, Fe I 438.35 nm and Mg I 277.98 nm respectively. It is clear from Fig. 8 that the calibration curves are linear. From these curves we estimated the concentrations of Ti in tsunami unaffected soil and affected soil are 0.091 w/w% and 0.14 w/w% respectively, the concentrations of Fe in tsunami unaffected soil and affected soil are 3.2 w/w% and 7.9 w/w% respectively and the concentrations of Mg in tsunami unaffected soil and affected soil are 0.02 w/w% and 0.048 w/w% respectively. These values are in good agreement with XRF data. So we can observe that the level of iron increases considerably in the tsunami affected soil sample (Table 1).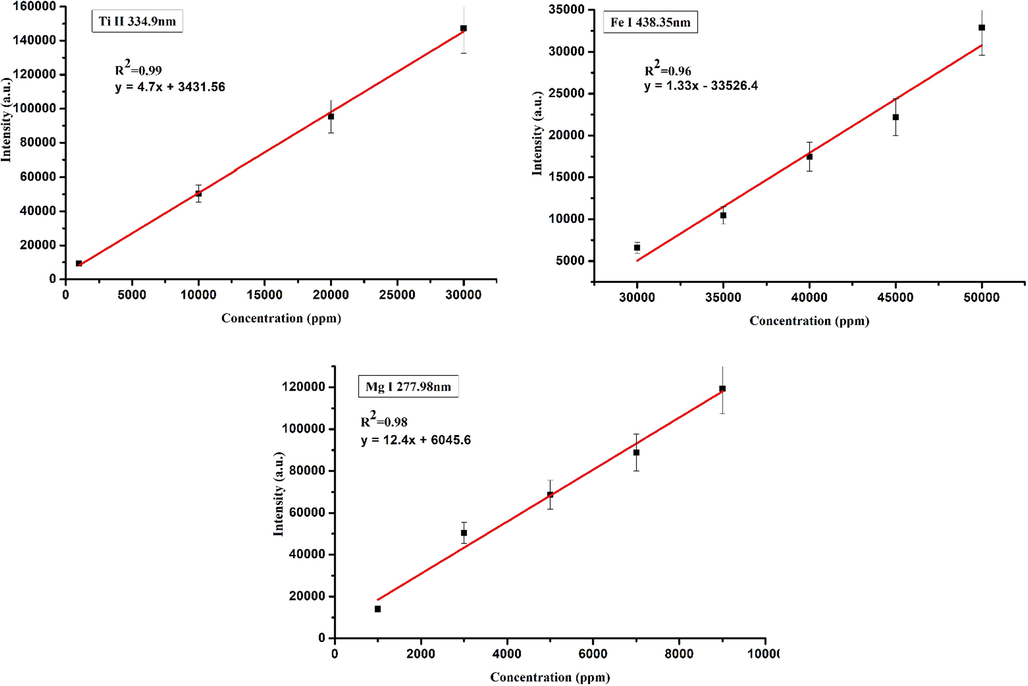
Calibration curves for several selected elements detected in the tsunami impacted soil samples; (a) Ti, (b) Fe and (c) Mg.
Elements
Affected soils (%)
Unaffected soils
(%)
Banda Aceh 1
Kuala Bubon 3
Kp. Cot 7
K
4.10 ± 0.1
–
–
Si
14.67 ± 1.7
18.58 ± 2.1
24.42 ± 1.1
Fe
5.5 ± 1.5
4.0 ± 1.09
3.5 ± 0.3
Mg
0.07 ± 0.01
0.03 ± 0.01
0.02 ± 0.03
Ti
0.25 ± 0.01
0.29 ± 0.02
0.21 ± 0.05
Al
2.40 ± 0.8
4.78 ± 1.3
3.56 ± 0.6
Sn
–
–
0.31 ± 0.06
Sb
–
–
0.12 ± 0.05
Mn
0.35 ± 0.14
0.22 ± 0.07
0.10 ± 0.03
Ni
0.88 ± 0.04
0.20 ± 0.05
0.09 ± 0.03
Cr
0.08 ± 0.03
0.04 ± 0.01
0.04 ± 0.03
Zn
0.08 ± 0.02
0.17 ± 0.03
0.08 ± 0.01
Zr
–
0.17 ± 0.09
0.05 ± 0.07
Pb
–
0.03 ± 0.05
0.01 ± 0.01
V
0.03 ± 0.01
–
–
Sr
0.42 ± 0.05
–
–
Cu
0.12 ± 0.01
0.01 ± 0.05
–
Ga
–
0.05 ± 0.03
–
The quantitative results promise a potential application of LIBS for monitoring agricultural activities in land that has been hit by tsunami. Moreover, the plasma characteristics fulfilling the local thermal equilibrium and the linier calibration curve obtained for Ti, Fe and Mg in LIBS analysis implies that LIBS signal intensity reflect linearly the amount of the respective element in the tsunami impacted soil samples. Thus, it is considered the emission intensity can be used to extract the relevant elemental ratio in the soil sample to find chemical signatures of tsunami event including element, compound and ratio. As mentioned above, chemical signatures of Ca/Ti versus Ba/Sr and also geochemical proxy of Na/Ti can be used for discriminating the tsunami deposit from the ordinary surrounding soil (Tanaka and Navasero, 1966; Guo et al., 2016; Kobayashi et al., 2005). Elemental ratios deduced from LIBS signal intensity were made, presented in Table 2. It can be seen LIBS emission intensity ratio of several elements detected from the soil plasma, namely Na/Ti, Ca/Ti, Mg/Ti, Si/Ti, Al/Ti, Fe/Ti and Sr/Ba. Although in the reference it is found that Ca/Ti, Na/Ti, Ba/Sr as chemical signatures for tsunami inundation, we deliberately extend to evaluate other elements because in LIBS spectrum we can get many emission lines from various elements simultaneously, something which is not easily obtained using the other analytical tool. The calibration of elemental concentration with LIBS signal intensity was carried out in unaffected soil matrix by externally spiking up with the known concentrations of the element under study. In the calibration study, the changing intensities of the concerned elemental transition are taken relative to the constant Ti II 334.68 nm peak intensity and this factor is further correlated to the respective concentration. The rationale for doing so was to ensure that the variation in LIBS signal intensity was only due to the elemental concentration and not due to fluctuations is any other experimental parameter. As mentioned before, tsunami deposits are generally characterized by increasing the concentration of Na, Mg, Ca, and K (Ono et al., 2014; Agus et al., 2012; Raja et al., 2009; Srinivasalu et al., 2010). Mangaia Cook Island tsunami could be marked by elevated concentration of Br, Cl, S, and Ca (Chagué-Goff et al., 2016). Moreover, the chemical signatures of 2009 South Pacific tsunami showed a high concentration of Ca and low concentration of Fe and Ti (Williams et al., 2011). By the passage of time, the concentration of chemical components in tsunami deposits can significantly change making it difficult to distinguish them from deposits of land origin. Furthermore, the distribution of single elements in stratigraphy is sometimes difficult to distinguish because it is influenced by external factors so that it does not provide clear conclusions. Therefore, several researchers have applied the concentration ratios of chemical elements to investigate the tsunami deposits. As it can be seen in Table 2, the ratio of LIBS emission intensity implies a strong relation to the tsunami, namely in the case of the soil sampled from the region affected by tsunami (Banda Aceh, West Aceh and Aceh Besar), the ratio distinctively differences in comparison with the case of soil sampled from the regions not affected by tsunami (Tungkop, Pango and Blang Bintang). A high concentration ratio of Na/Ti is found as a good indicator to investigate the tsunami deposits in the inundated land in Sendai, Japan, after being struck by the 2011 Tohoku tsunami (Watanabe et al., 2020). Na is the most abundant dissolved ion occurring in a marine environment, almost 80% of seawater contains Na and Cl ions. Na can be supplied from salt (NaCl, Na2SO4) and feldspar minerals from the seafloor carried during the tsunami waves, so the presence of Na in the soil indicates a strong marine influence. Moreover, Ti element is the main constituent of heavy minerals which are generally used as chemical proxies for markers of terrestrial sources. Therefore, the high ratio value of Na/Ti could be applied for evaluating the influence of tsunami seawater inland. On the other hand, the concentration ratio of Ca/Ti also has been widely employed for identifying the marine versus terrestrial signatures. A previous study on tsunami issues reported that a high concentration ratio of Ca/Ti was a good indicator for discriminating the tsunami deposits in Lavericks Bay, New Zealand (Donnelly et al., 2016) and paleotsunami histories (Willershäuser et al., 2015a; Vött et al., 2011a). Moreover, the ratio of Ca/Fe could be applied for investigating the tsunami influences in Kaifas Lagoon, Japan (Koster et al., 2015). The ratio of Sr/Ba was also found as a better marker for investigating the inundated land in Chile after Maule tsunami in 2010 (Chagué-Goff et al., 2015). Based on Table 2, it could be seen that the LIBS emission intensity ratio of Na/Ti (Na I 582.39 nm/Ti II 334.68 nm), Ca/Ti (Ca II 397.00 nm/Ti II 334.68 nm), Mg/Ti (Mg II 518.57 nm/Ti II 334.68 nm) and Fe/Ti (Fe II 262.89 nm/Ti II 334.68 nm) show no clear difference in the case of impacted and unimpacted soil. The most distinctive ratio is found for Si/Ti using the ionic emission lines of Si II 288.06 nm and Ti II 334.68 nm, displaying very high emission intensity ratio in the case of soil sampled from the tsunami affected region as compared to that from unaffected regions. Similar tendency although with relative lower degree can also be found for Al/Ti (Al II 396.36 nm/Ti II 334.68 nm) and Sr/Ba (Sr II 460.62 nm/Ba II 493.52 nm). Thus, these LIBS emission intensity ratios namely Si/Ti, Al/Ti and Sr/Ba are potential candidate as geochemical proxies of tsunami event. On the other hand, LIBS emission intensity ratio of Na/Ti (Na I 582.39 nm/Ti II 334.68 nm), Ca/Ti (Ca II 397.00 nm/Ti II 334.68 nm), Mg/Ti (Mg II 518.57 nm/Ti II 334.68 nm) and Fe/Ti (Fe II 262.89 nm/Ti II 334.68 nm) shows no clear difference in the case of impacted and unimpacted soil.
Location of Soil Sampling
LIBS Emission Intensity Ratio
Remarks
Na/Ti
Ca/Ti
Mg/Ti
Si/Ti
Al/Ti
Fe/Ti
Sr/Ba
Na I 582.39 nm
Ti II 334.68 nm
Ca II 397.00 nm
Ti II 334.68 nm
Mg II 518.57 nm
Ti II 334.68 nm
Si II 288.06 nm
Ti II 334.68 nm
Al II 396.36 nm
Ti II 334.68 nm
Fe II 262.89 nm
Ti II 334.68 nm
Sr II 460.62 nm
Ba II 493.52 nm
Banda Aceh 4
2: 1
10: 1
1: 1
15: 1
7: 1
6: 1
6: 1
Banda Aceh 5
2: 1
10: 1
2: 1
20: 1
11: 1
8: 1
10: 1
Banda Aceh 8
2: 1
10: 1
2: 1
11: 1
5: 1
4: 1
4: 1
Aceh Besar 1
6: 1
30: 1
1: 1
50: 1
26: 1
13: 1
14: 1
Aceh Besar 2
3: 1
13: 1
1: 1
17: 1
9: 1
6: 1
10: 1
Aceh Besar 3
8: 1
7: 1
1: 1
14: 1
10: 1
4: 1
3: 1
Aceh Besar 9
2: 1
18: 1
4: 1
25: 1
20: 1
6: 1
7: 1
Kp. Cot 4
2: 1
10: 1
1: 1
22: 1
9: 1
6: 1
6: 1
Kp. Cot 5
6: 1
12: 1
4: 1
24: 1
12: 1
6: 1
10: 1
Kp. Cot 6
6: 1
24: 1
4: 1
32: 1
26: 1
15: 1
15: 1
Kp. Cot 7
1: 1
12: 1
1: 1
12: 1
9: 1
4: 1
4: 1
Tungkop
1: 1
11: 1
1: 1
7: 1
8: 1
7: 1
3: 1
Unimpacted
Blang Bintang
2: 1
11: 1
1: 1
7: 1
8: 1
7:1
3: 1
Unimpacted
Pango Deah
1: 1
11: 1
1: 1
7: 1
8: 1
7: 1
3: 1
Unimpacted
4 Conclusion
In this work a laser induced break down spectroscopy system (LIBS) was developed, optimized and calibrated for the elemental detection of soil samples taken from the tsunami affected area in Banda Aceh city, Indonesia, the region most affected by deadly 2004 Indian Ocean giant tsunami. The laser induced plasma was verified for the local thermodynamic equilibrium condition to ensure reliable qualitative and quantitative analysis of the elements under study and found that the laser induced plasma of the tsunami affected soil sample was in the thermodynamic equilibrium according to McWrither criterion. This confirms that the plasma emission represent the elemental content of the sample. The system was optimized to detect Ti, Fe and Mg in the soil affected by tsunami and our result show the higher concentrations of these elements in the tsunami affected samples than that in the unaffected soils. The increase of the concentrations of these elements is attributed to the flooding of the element rich sea water to the shore and leaving the elemental deposits in the inundated soil. Considering geochemistry such as in term of the specific elemental ratios was used as a reliable tool for characterizing the past and present tsunami deposits, ratio of the LIBS emission intensity obtained from soil sampled from the 2004 Indian Ocean giant affected and unaffected regions was evaluated using several elements, namely Si, Ti, Al, Sr, Ba, Na, etc., revealing distinct difference of the ratio for several set of elements between the impacted and unimpacted soils. Thus, LIBS emission intensity ratios of several elements, such as Si/Ti, Al/Ti and Sr/Ba are potential candidates as the geochemical proxis for distinguishing the tsunami deposit from the surrounding soil.
Acknowledgments
The author (N. Idris) thanks to Research and Society Service Directorate (DP2M), Directorate General of the Research Strengthening and Developing, Ministry of Research, Technology and Higher Education, Government of Republic Indonesia, supporting financially research through World Class Professor Scheme A with contract number: T/46/D2.3/KK.04.05/2019 and World Class Research grant with a contract number: 102/UN11.2.1/PT.01.03/DRPM/2020 at Syiah Kuala University, Aceh, Indonesia. Prof. Gondal is thankful to KFUPM for supporting this work and KACARE for the fellowship.
Declaration of Competing Interest
The authors declare that they have no known competing financial interests or personal relationships that could have appeared to influence the work reported in this paper.
References
- The dynamics of Tsunami-affected soil properties in Aceh. Indonesia. J. Integr Field. Sci.. 2012;9:11-20.
- [Google Scholar]
- Aubert, H., Pinta, M. Eds., (1977). Titanium, Dev. in Soil Sci., Elsevier 7. pp. 73–77.
- Trace elements in soils and plants: An overview. J. Environ. Sci. Heal A. 1999;34(4):951-974.
- [Google Scholar]
- Manganese and iron toxicities dependent on soybean variety. Comm. Soil Sci. Plant. Anal.. 1977;8:1-15.
- [Google Scholar]
- Radionuclide concentration processes in marine organisms: a comprehensive review. J. Environ. Radioact.. 2018;186:124-130.
- [Google Scholar]
- The tsunami of the great Sumatra earthquake of M 9.0 on 26 December 2004 – Impact on the east coast of India. Cur. Sci.. 2005;88(8):1297-1301.
- [Google Scholar]
- Chaerun, S.K., Whitman, W.B., Wirth, S.J., Ellerbrock, R.H., (2009). the 2009 National Meeting of the American Society of Mining and Reclamation, Billings, MT, Revitalizing the Environment: Proven Solutions and Innovative Approaches May 30 – June 5, 2009. R.I. Barnhisel (Ed.) Published by ASMR, 3134 Montavesta Rd., Lexington, KY 40502.
- Insights from geochemistry and diatoms to characterize a tsunami's deposit and maximum inundation limit. Mar. Geol.. 2015;359:22-34.
- [Google Scholar]
- Late Holocene record of environmental changes, cyclones and tsunamis in a coastal lake, Mangaia, Cook Islands. Island Arc. 2016;25:333-349.
- [Google Scholar]
- Chagué-Goff, C., Andrew, A., Szczuciński, W., Goff, J., Nishimura, Y. 2012. Geochemical signatures up to the maximum inundation of the 2011 Tohoku-oki tsunami — Implications for the 869AD Jogan and other palaeotsunamis, Sediment. Geol., 282 pp. 65–77.
- Applications of geochemistry in tsunami research: A review. Earth-Sci. Rev.. 2017;165:203-244.
- [Google Scholar]
- Laser-Induced Breakdown Spectroscopy—Capabilities and Limitations. Appl. Spectro. Rev.. 2009;44:457-506.
- [Google Scholar]
- Handbook of Laser-Induced Breakdown Spectroscopy. England: John Wiley and Sons Ltd.; 2006.
- Rehabilitating coastal agriculture and aquaculture after inundation events: Spatial analysis of livelihood recovery in post-tsunami Aceh, Indonesia. Ocean Coast. Manage.. 2017;142:218-232.
- [Google Scholar]
- A record of local storms and trans-Pacific tsunamis, eastern Banks Peninsula, New Zealand. The Holocene. 2016
- [Google Scholar]
- Radioactive survey of coastal water and sediments across Alexandria and Rashid coasts. Egypt. J. Aquatic Res.. 2013;39(1):21-30.
- [Google Scholar]
- Griem, H.R. (1997). Principles of Plasma Spectroscopy (Cambridge University Press).
- Quantitative Chemical Analysis (ninth ed.). San Francisco: W.H. Freeman; 2015.
- Sediments deposited by the 2004 Indian Ocean Tsunami along the Malaysia-Thailand Peninsula. Mar. Geol.. 2007;242(1–3):169-190.
- [Google Scholar]
- Preliminary study on detection sediment contamination in soil affected by the Indian Ocean giant tsunami 2004 in Aceh, Indonesia using laser-induced breakdown spectroscopy (LIBS) AIP Conf. Proc.. 2016;1719:030051
- [Google Scholar]
- Effects of Excess magnesium on the growth and mineral content of rice and Echinochloa. Plant Prod. Sci.. 2005;8(1):38-43.
- [Google Scholar]
- Reicherter, Geoscientific investigations in search of tsunami deposits in the environs of the Agoulinitsa peatland, Kaiafas lagoon and Kakovatos (gulf of Kyparissia, western Peloponnese, Greece) Z. geomorphology.. 2015;59(suppl. 4):125-156.
- [Google Scholar]
- The evolution of December 2004 tsunami deposits: temporal and spatial distribution of potentially toxic metalloids. Chemosphere. 2013;93(9):1856-1865.
- [Google Scholar]
- The long term tsunami impact: Evolution of iron speciation and major elements concentration in tsunami deposits from Thailand. Chemosphere. 2017;181:37-43.
- [Google Scholar]
- The Great Sumatra-Andaman Earthquake of 26 December 2004. Science. 2005;308(5725):1127-1133.
- [Google Scholar]
- Titanium as a beneficial element for crop production. Front. Plant Sci.. 2017;8:597.
- [Google Scholar]
- Impacts of soil and groundwater salinization on tree crop performance in post-tsunami Aceh Barat, Indonesia. Nat. Hazard Earth Sys.. 2012;12(9):2879-2891.
- [Google Scholar]
- Soil salinity in Aceh after the December 2004 Indian Ocean tsunami. Agric. Water Manag.. 2010;97(5):605-613.
- [Google Scholar]
- Umair Baig, Qualitative and quantitative spectro-chemical analysis of dates using UV-pulsed laser induced breakdown spectroscopy and inductively coupled plasma mass spectrometry. Talanta. 2016;155:124-132.
- [Google Scholar]
- Uplift and subsidence associated with the great Aceh-Andaman earthquake of 2004. J. Geophys. Res.. 2006;111(B02407):1-8.
- [Google Scholar]
- Miziolek A.W., Palleschi V., Schechter I., eds. Laser-Induced Breakdown Spectroscopy (LIBS), Fundamentals and Applications. New York: Cambridge University Press; 2006.
- R, Sedimentary deposits of the 26 December 2004 tsunami on the northwest coast of Aceh. Indonesia Earth Planets Space. 2006;58(2):253-258.
- [Google Scholar]
- NIST Atomic Spectra Database. 2016, http://www.nist.gov/physlab/data/asd. cfm.
- Impacts of the 26 December 2004 tsunami in Eastern Africa. Ocean Coast. Manage.. 2006;49(11):873-888.
- [Google Scholar]
- Fluctuations in the concentration of exchangeable cations in tsunami-hit forest soils on the northeastern Pacific coast. J. Jpn. For. Soc.. 2014;96:301-307.
- [Google Scholar]
- Coastal sedimentation associated with the December 26, 2004 tsunami in Lhok Nga, west Banda Aceh (Sumatra, Indonesia) Mar. Geol.. 2007;238(1–4):93-106.
- [Google Scholar]
- Risk assessment of the presence of polycyclic aromatic hydrocarbons (PAHs) in coastal areas of Thailand affected by the 2004 tsunami. Mar. Poll. Bull.. 2013;76(1–2):370-378.
- [Google Scholar]
- Salinity status of tsunami-affected soil and water resources of South Andaman, India. Curr. Sci.. 2009;96:152-156.
- [Google Scholar]
- Overview of the use of leaching/extraction tests for risk assessment of trace metals in contaminated soils and sediments. Trac. Trends Anal. Chem.. 2003;22(3):152-159.
- [Google Scholar]
- Santiago-Fandiño, V., Kim, M.H. 2015. Tsunami and Environmental Pollution Hazards: A Note for the Restoration Process. In: Santiago-Fandiño V., Kontar Y., Kaneda Y. (Eds.) Post-Tsunami Hazard. Advances in Natural and Technological Hazards Research, vol 44. Springer.
- Optical emission studies of the mercury plasma generated by the fundamental, second and third harmonics of a Nd : YAG laser. J. Phys. D. Appl. Phys.. 2006;39:4377-4385.
- [Google Scholar]
- Titanium dioxide nanoparticles strongly impact soil microbial function by affecting archaeal nitrifiers. Sci. Rep.. 2016;6:33643.
- [Google Scholar]
- A study on pre-and post-tsunami shallow deposits off SE coast of India from the 2004 Indian Ocean Tsunami: a geochemical approach. Nat. Hazards. 2004;52(2010):391-401.
- [Google Scholar]
- Pol. J. Environ. Stud.. 2006;15(5):793-810.
- Interaction between iron and manganese in the rice plant. Soil Sci. and Plant Nut.. 1966;12(5):29-33.
- [Google Scholar]
- Soils and Soil Fertility (third ed.). McGraw-Hill Book; 1973.
- Damage and height distribution of Sumatra earthquake-tsunami of December 26, 2004, in Banda Aceh City and its Environs. J. Disaster Res.. 2006;1(1):103-115.
- [Google Scholar]
- Willershaueser, Olympia's harbour site pheia (Elis, Western Peloponnese, Greece) destroyed by tsunami impact. Erde.. 2011;142:259-288.
- [Google Scholar]
- Wallihan, E.F. (1966). Iron. In: H. D. Chapman, Diagnostic Criteria for Plants and Soils. University of California, Div. Agric. Sci., Riverside, CA, pp. 203–212.
- A geochemical approach for identifying marine incursions: Implications for tsunami geology on the Pacific coast of northeast Japan. Appl. Geochem.. 2020;18:104644
- [Google Scholar]
- Geo-scientific evidence of tsunami impact in the Gulf of Kyparissia (western Peloponnese, Greece) Z. Geomorphol.. 2015;59(Suppl. 4):43-80.
- [Google Scholar]
- Williams, S., Prasetya, G., Chagué-Goff, C., Goff, J., Cheung, K.F., Davies, T., Wilson, T. 2011. Characterizing diagnostic proxies for identifying palaeotsunamis in a tropical climatic regime, Samoan Islands. MTS/IEEE Oceans 2011 Conference, Kona, Hawaii (10 pp).
- Laser-induced breakdown spectroscopy, elemental analysis in Encyclopedia of Analytical Chemistry. Chichester: John Wiley&Sons Ltd.; 2000. p. :2066-2087.
- An extended assessment of natural radioactivity in the sediments of the mid-region of the Egyptian Red Sea coast. Marine Pollut. Bull.. 2021;171
- [Google Scholar]


