

Translate this page into:
Geographical origin discrimination of Anisodus tanguticus (Maxim.): Chemometrics methods applied to ICP-OES analysis
⁎Corresponding author at: CAS Key Laboratory of Tibetan Medicine Research, Northwest Institute of Plateau Biology, 23# Xinning Road, Xining 810008, China. zhougy@nwipb.cas.cn (Guoying Zhou)
-
Received: ,
Accepted: ,
This article was originally published by Elsevier and was migrated to Scientific Scholar after the change of Publisher.
Abstract
Anisodus tanguticus (Maxim.) Pascher, which is an important species used in traditional Tibetan medicine, is grown on the Qinghai–Tibet Plateau. A quantitative analysis of 18 elements in A. tanguticus and the soil was conducted using an inductively coupled plasma optical emission spectrometer. The elemental contents of A. tanguticus underwent principal component analysis, linear discriminant analysis, and orthogonal partial least-squares discriminant analysis. Furthermore, elemental accumulation and elemental transfer coefficients were calculated, and the correlation between environmental factors and elemental content was further explored. The multivariate statistical results indicated that A. tanguticus plants can be distinguished by their geographical origin. Elemental accumulation and transfer patterns differed significantly among the analysed elements. Some positive or negative correlation relationships were found between environmental factors and contents in root parts of A. tanguticus. The present study provides an efficient and practical method to discriminate the geographical origin of A. tanguticus from different regions.
Keywords
Multielement
Chemometric methods
Element accumulation
Element transfer

1 Introduction
Anisodus tanguticus (Maxim.) Pascher, a member of the Solanaceae family, is a significant medicinal herb predominantly found in the Gansu, Qinghai, Sichuan provinces, and the Tibet Autonomous Region of China (Wang et al., 2005). In traditional Tibetan medicine, it is known as “Tang Chun Na Bao” and is revered for its potent medicinal properties (Zhang and Wang, 2002). This herb is traditionally employed in the treatment of septic shock, for its analgesic properties, in combating motion sickness, and as an anesthetic. The medicinal value of A. tanguticus is primarily attributed to its content of tropane alkaloids, a class of nitrogenous organic compounds known for their substantial pharmacological effects. The key active tropane alkaloids found in A. tanguticus include atropine, anisodamine, anisodine, and scopolamine. These alkaloids have diverse therapeutic uses: they serve as narcotics, sedatives, analgesics, and antispasmodics. Furthermore, they are employed in the treatment of Parkinson’s disease, motion sickness, and asthma, showcasing the wide range of conditions that A. tanguticus can potentially address (Bores et al., 2010; Oniszczuk et al., 2013). However, the quality and efficacy of A. tanguticus vary among samples. Thus, determining the geographical origin of plants is important for maintaining the high quality of commercially produced herbs.
Geographical origin is recognized as a crucial quality parameter that significantly impacts the quality of herbs. This importance is attributed to the fact that variations in climate and soil conditions across different regions can directly affect the phytochemical composition and, consequently, the medicinal properties of herbs. To accurately determine the geographical origin of herbs, and thereby assure their quality, a range of sophisticated analytical techniques are employed. These include high-performance liquid chromatography (HPLC), gas chromatography (GC), HPLC coupled with mass spectrometry (MS), inductively coupled plasma optical emission spectrometry (ICP-OES), and inductively coupled plasma mass spectrometry (ICP-MS). When these analytical methods are combined with chemometric approaches-a set of techniques that utilize statistical methods to extract meaningful information from chemical data-they provide a powerful toolset for distinguishing the geographical origin of herbs, as well as other food and agricultural products. This ability to discriminate based on geographical origin plays a vital role in maintaining the high quality of commercially produced herbal medicines and food products, ensuring that consumers receive products that meet expected standards of efficacy and safety (Miao et al., 2019; Jiménez-Carveloa et al., 2019; Liu et al., 2020; Pierluigi et al., 2020; Long et al., 2021).
Elemental compositions in plants can reflect the environmental elemental compositions in different geographic locations. Unlike the chemical composition, the elemental composition of plants is an inherent property that is relatively stable. Elemental contents in plants are influenced by plant characteristics as well as environmental factors, including soil and climatic conditions (Cheng et al., 2020; Han et al., 2011; Thomas and Panorska, 2011). ICP–MS/OES has proven to appropriate for determining the geographical origin of foods and herbs (Maggi et al., 2011; Zhao et al., 2017; Ma et al., 2018). To date, there have been no studies that have systematically distinguished the geographical origins of A. tanguticus samples by using multiple–elements. In this study, we determined the multielement content and used multivariate statistical analysis to elucidate the geographical origins of A. tanguticus.
Soil is one of the main factors influencing the element fingerprints of plants. Regarding the dynamics of the soil–plant element system, plants absorb elements from the soil through their roots, after which the elements are transported to different tissues. The efficiency of absorption and subsequent transport of nutrients can significantly differ among plant species and is influenced by a variety of environmental conditions (Shen et al., 2013; Pepia et al., 2020; Squadrone et al., 2020). Therefore, it is necessary to study the relationships between different plant tissues and the soil.
In this study, we developed a rapid method utilizing ICP-OES for the comprehensive analysis of multiple elements in A. tanguticus and its corresponding soil samples from the Qinghai-Tibet Plateau. The study aimed to achieve the following objectives: (1) to quantify the elemental content across various parts of A. tanguticus, (2) to ascertain the geographical origins of A. tanguticus, and (3) to explore the interconnections among the elemental composition of A. tanguticus, the soil, and environmental factors influencing them. The findings furnish a theoretical framework for establishing the traceability of A. tanguticus's geographical origins and for understanding the model of element distribution within the plant.
2 Materials and methods
2.1 Materials
The aerial parts and roots of A. tanguticus were collected in August 2020 in Qinghai (QH), Gansu (GS), Sichuan (SC), and Tibet (XZ) in China (Fig. 1). Samples were collected at altitudes ranging from 2700 m to 4100 m above sea level (latitude: 30°–38°; longitude: 95°–102°)(Table S1). The sampling sites basically covered the entire geographic distribution area of A. tanguticus. At each site, 100 g of fresh leaves were collected from three A. tanguticus plants, and 100 g of soil samples were taken from 10 cm below the surface at the corresponding locations. Ultrapure water was obtained from a Milli-Q system (Millipore, USA), and ultrapure HNO3 and hydrogen peroxide were purchased from Jingrui (Suzhou, China). The mean annual precipitation (MAP) and mean annual temperature (MAT) of each site were extracted from WorldClim (https://www.worldclim.org/).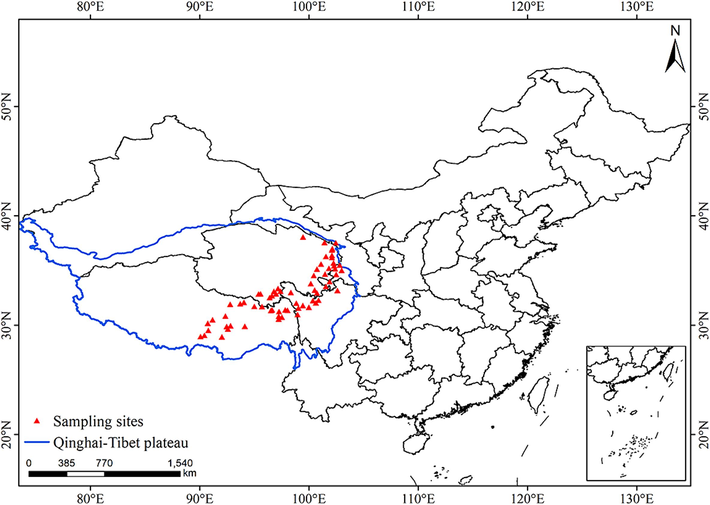
Geographical distribution of the regions of A. tanguticus were collected.
2.2 Sample preparation
Briefly, a 0.2 g sample of both A. tanguticus and soil was processed in separate polytetrafluoroethylene digestion vessels; the plant sample was mixed with 10 mL HNO3 and 2 mL hydrogen peroxide, while the soil sample was mixed with 10 mL HNO3, 5 mL hydrofluoric acid, and 5 mL perchloric acid. Both were then incubated for 12 h. The digestion vessels were inserted into the Microwave digestion system. The microwave digestion system was heated using 15 min of ramp and held for 20 min at temperatures ranging from 190° to 250 °C (Chen et al., 2014). After digestion, the solutions were diluted to 50 mL using ultrapure water and then stored in a tube until analysis.
A standard solution comprising Al, Ba, Be, Ca, Co, Cu, Fe, K, Li, Mg, Mn, Mo, Na, Ni, P, Sr, V, and Zn (National Research Center for Reference Materials, Beijing, China) was diluted to 0–200 µg/L using 5 % HNO3. The GBW10052 green tea standard was used to verify the precision and accuracy of the analysis.
2.3 Analytical procedure
The elemental contents of aerial parts (AAT), root parts (RAT) and soil were determined using the Optima 8000 ICP–OES system (PerkinElmer, Shelton, USA), with the following main conditions: RF power, 1300; auxiliary gas, 0.2 L/min; nebulizer gas, 1.2 L/min; and sample uptake, 1.0 L/min.
2.4 Statistical analysis
Graphs were created using SigmaPlot 12.5 (Systat Software, Inc., Point Richmond, CA, USA). Pearson’s correlation analysis, PCA, and LDA were performed using the SPSS 18.0 software package (SPSS, Inc., USA). Orthogonal partial least-squares discriminant analysis (OPLS-DA) was performed using SIMCA (Umetrics, Sweden). The elemental accumulation coefficient (AF) was calculated using the following formula:
where C = concentration of the element (mg/kg).
The elemental transfer coefficient (TF) was calculated using the following formula:
TF = Caerial /Croot.
where C = concentration of the element (mg/kg).
3 Results
3.1 General features of the analysed elements
The study presents comprehensive data on the multi-element contents across different plant parts and soil samples. The analysis covers 18 elements (Al, Ba, Be, Ca, Co, Cu, Fe, Li, K, Mg, Mn, Mo, Na, Ni, P, Sr, V, and Zn) in the AAT, RAT, and soil samples, with the data reported as the mean ± standard deviation. Significant variations were observed in the elemental contents among different parts of A. tanguticus and soil samples collected from various locations.
Several of the contents of the examined elements (Ca, Na, K, P, Mg, and Fe) of A. tanguticus were greater than 100 mg/kg. The mean Ca, Na, K, P, Mg and Fe contents at the different locations were 13085.2 mg/kg, 360.2 mg/kg, 14005.0 mg/kg, 1915.6 mg/kg, 5491.2 mg/kg, and 936.2 mg/kg in AAT, and 10744.8 mg/kg, 327.2 mg/kg, 4016.1 mg/kg, 2019.3 mg/kg, 2775.1 mg/kg, and 747.1 mg/kg in RAT, respectively. Calcium is important for preventing dyslipidemia, arterial hypertension, and osteoporosis (Moe, 2008). Potassium has important cellular functions, especially in the nervous system (Stone et al., 2016). Both Mg and Fe are essential micronutrients, with Mg being required for nucleic acid in protein synthesis and Fe mainly contributing to the synthesis of hemoglobin (Gröber et al., 2015; Maret, 2016). The Ca, Na, K, P, Mg, and Fe contents in the AAT and RAT samples determined in this study suggest that A. tanguticus is an important herb for mineral supplementation, especially for people with deficiencies in these minerals.
The mean values of Ba, Be, Cu, Li, Mn, Sr, V, and Zn were greater than 10 mg/kg, and elements at different locations were 27.7 mg/kg, 11.3 mg/kg, 12.2 mg/kg, 35.4 mg/kg, 68.8 mg/kg, 44.7 mg/kg, 29.2 mg/kg, and 23.9 mg/kg in AAT, and 35.8 mg/kg, 16.4 mg/kg, 19.2 mg/kg, 75.8 mg/kg, 36.2 mg/kg, 60.1 mg/kg, 19.1 mg/kg, and 36.1 mg/kg in RAT, respectively. The essential metals Cu and Zn serve as enzymatic cofactors that are crucial for the immune, central nervous, and reproductive systems (Roohani et al., 2013). There are several adverse effects associated with a lack of V, including anemia and abnormal iron metabolism (Gruzewska et al., 2014). The mean values of Co, Mo, and Ni at the different locations were 2.2 mg/kg, 4.8 mg/kg, 16.3 mg/kg in AAT, and 7.9 mg/kg, 0. 8 mg/kg, and 11.2 mg/kg in RAT, respectively.
Through variance analysis of the elemental content across four provinces (Table 1), we found that the concentrations of Zn, Ni, and Cu elements in AAT in Tibet significantly differ from those in the other three provinces. In Qinghai, the concentration of Be in AAT also shows significant differences compared to the other three provinces. Similarly, the concentrations of Be, Fe, Mo, and Mn in the RAT from Tibet exhibit significant differences compared to those from the other provinces. Additionally, there are instances where the elemental content differs between only two regions. For example, the calcium content in AAT from Gansu differs from that in Qinghai, and the Sr content in the RAT from Sichuan is significantly different from that in Gansu.
Element
AAT-SC
AAT-GS
AAT-QH
AAT-XZ
RAT-SC
RAT-GS
RAT-QH
RAT-XZ
AL(mg/kg)
527.5 ± 255a
583.9 ± 51a
735.5 ± 469a
943.6 ± 691a
327.1 ± 181a
272.7 ± 148a
396.3 ± 203a
1070.7 ± 437b
Ba(mg/kg)
23.7 ± 9a
26.2 ± 7a
27.06 ± 12a
29.8 ± 14a
40.4 ± 23a
30.5 ± 13a
33.5 ± 17a
37.9 ± 19a
Be(mg/kg)
10.6 ± 0.5a
9.9 ± 0.4ab
14.2 ± 2c
8.5 ± 0.4b
24.3 ± 8a
23.2 ± 17a
20.0 ± 6a
8.9 ± 0.6b
Ca(mg/kg)
13748 ± 1561ab
15877 ± 1414a
12113 ± 3390b
13535 ± 1552ab
9613 ± 4823a
10179 ± 4146ab
8759 ± 3673a
13394 ± 2234b
Co(mg/kg)
2.8 ± 0.9a
3.4 ± 0.4a
2.3 ± 0.3a
1.6 ± 0.2a
16.0 ± 9a
3.5 ± 0.2b
11.2 ± 7ab
2.4 ± 1bc
Cu(mg/kg)
14.3 ± 1.5a
15.1 ± 2.6a
13.96 ± 2.6a
9.2 ± 3.4b
26.5 ± 14a
14.0 ± 17a
20.4 ± 2a
16.5 ± 2a
Fe(mg/kg)
787.2 ± 441a
691.9 ± 367a
998.8 ± 641a
949.8 ± 665a
426.9 ± 258a
318.1 ± 99a
557.9 ± 487a
1122.8 ± 441b
Li(mg/kg)
26.5 ± 14ac
34.6 ± 14ab
51.2 ± 26b
20.5 ± 13ac
63.7 ± 40a
107.8 ± 50a
97.3 ± 56a
50.7 ± 37a
K(mg/kg)
13136 ± 6616a
14358 ± 7218a
14183 ± 4887a
14019 ± 5270a
4378 ± 1098a
3062 ± 1942a
3738 ± 1216a
4361 ± 851a
Mg(mg/kg)
5755 ± 3578ab
6326 ± 899ab
6294 ± 1809a
4385 ± 1738b
2379 ± 949ab
1784 ± 1056 a
2524 ± 1120 ab
3328 ± 999b
Mn(mg/kg)
73.7 ± 24ab
74.4 ± 10ab
79.9 ± 31a
54.06 ± 30b
39.3 ± 20a
23.8 ± 19a
33.7 ± 19a
40.1 ± 11a
Mo(mg/kg)
4.8 ± 4.2ab
3.2 ± 1.6ab
7.4 ± 4.4a
2.1 ± 1.8b
21.3 ± 13b
12.3 ± 18b
13.9 ± 8b
3.8 ± 2a
Na(mg/kg)
298.7 ± 206a
376.6 ± 203a
272.8 ± 116a
474.1 ± 421a
257.0 ± 310a
211.1 ± 159a
252.0 ± 222a
450.4 ± 353a
Ni(mg/kg)
9.6 ± 0.8a
9.4 ± 0.4a
6.8 ± 3.4a
4.3 ± 0.5b
20.2 ± 10c
10.8 ± 14ab
14.5 ± 9bc
4.9 ± 1a
P(mg/kg)
1981 ± 1350a
1680 ± 153a
1832 ± 528a
2024 ± 1175a
2088 ± 986a
1633 ± 805a
1612 ± 603a
2511 ± 837a
Sr(mg/kg)
42.66 ± 22a
63.4 ± 17a
42.7 ± 16a
44.8 ± 18a
44.4 ± 24a
77.6 ± 20b
64.4 ± 26ab
57.6 ± 24ab
V(mg/kg)
28.4 ± 17ab
29.9 ± 4ab
34.5 ± 10a
23.2 ± 8b
23.7 ± 23a
16.5 ± 11a
22.0 ± 8a
15.1 ± 8a
Zn(mg/kg)
9.0 ± 4a
9.3 ± 6a
22.9 ± 10a
31.9 ± 13b
37.3 ± 26a
28.0 ± 28a
30.0 ± 14a
43.7 ± 14a
Regarding the soil elemental abundance, the mean values of 18 elements in the soil were 59657.9 mg/kg, 370.7 mg/kg, 7.8 mg/kg, 13099.7 mg/kg, 32.7 mg/kg, 73.9 mg/kg, 32549.4 mg/kg, 66.7 mg/kg, 10124.9 mg/kg, 8747.6 mg/kg, 1268.8 mg/kg, 92.7 mg/kg, 11747.3 mg/kg, 107.5 mg/kg, 948.4 mg/kg, 155.5 mg/kg, 110.3 mg/kg, and 121.1 mg/kg.
3.2 Elemental relationship
All elements of each part were analysed by plotting the correlation matrix using Pearson’s associations (Fig. 2). This analysis was performed to understand the relationships among the element concentrations. Significant correlations were detected between the elemental contents. There were extremely significant (p < 0.01) correlations, such as between Al and Fe (r = 0.89), Fe and K (r = 0.59), Li and Mn (r = 0.53), Mg and V (r = 0.88), in AAT samples, as well as between Al and Fe (r = 0.84), Be and Cu (r = 0.75), Be and Mo (r = 0.93), Be and Ni (r = 0.91), Co and Ni (r = 0.77), Cu and Mn (r = 0.78), Cu and Mo (r = 0.82), Cu and Ni (r = 0.85), Mo and Ni (r = 0.94) in RAT samples. Most elements showed significant positive correlations, except Al and Be (r = -0.26), Be and Ca (r = -0.26), Be and Na (r = -0.29), Mo and Na (r = -0.29), Zn and Ni (r = -0.45), and P and V (r = -0.27), which showed significant negative correlations in the AAT samples. Most elements showed significant positive correlations, except Al and Be (r = -0.44), Al and Co (r = -0.49), Al and Mo (r = -0.35), Al and Ni (r = -0.30), Be and Ca (r = -0.26), Ca and Co (r = -0.35), Co and Fe (r = -0.43), Co and Mg (r = -0.34), Li and P (r = -0.25), and Li and V (r = -0.25), which showed significant negative correlations in the RAT samples.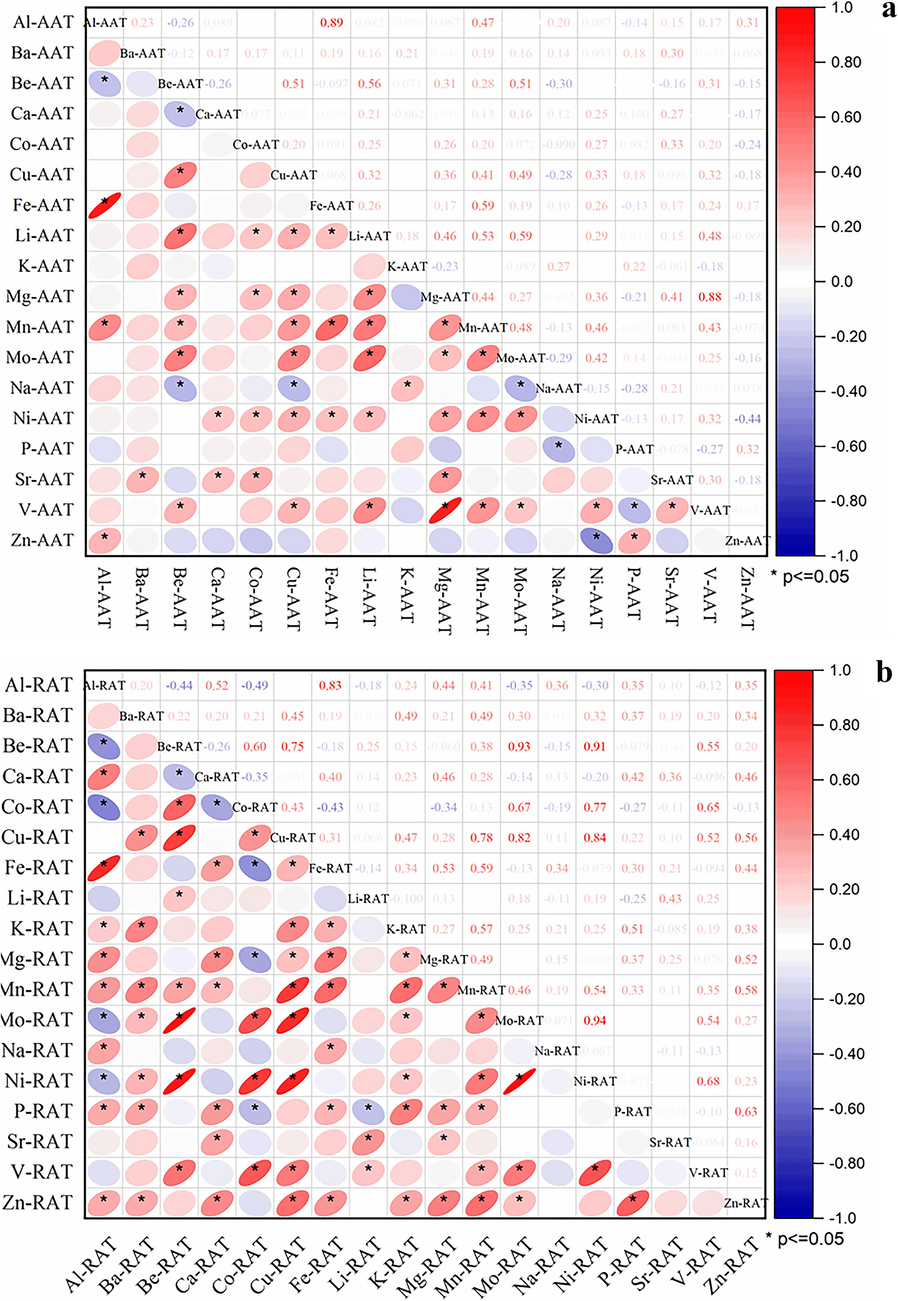
Correlation of multi-elements of aat (a) and rat (b) in a. tanguticus.
The elemental accumulation coefficient (AF) represents the capacity of plants to accumulate elements from the soil, whereas the elemental transfer coefficient (TF) reflects the transport of elements from the roots to aerial parts, which is important for growth and development (Senbayram et al., 2016). The mean AF and TF values at the different sampling locations are listed in Table 2. The AF values of Be, Ca, Li and P were larger than 1, showing that A. tanguticus has a high absorption capacity for these elements from soil. The AF values of Ba, Co, Cu, K, Mg, Mo, Ni, Sr, V, and Zn were larger than 0.1, showing that A. tanguticus has a medium absorption capacity for these elements. A. tanguticus showed a weak enrichment capacity for the other elements. The TF values of Al, Ca, Fe, K, Mg, Mn, Na, Ni, P, and V were larger than 1, showing that A. tanguticus has a high transportation capacity for these elements. The TF values of the other elements were larger than 0.1, showing that A. tanguticus has a medium transportation capacity for these elements.
Element
AF
TF
Al
0.01 ± 0.01
1.88 ± 1.82
Ba
0.21 ± 0.76
0.94 ± 0.59
Be
3.55 ± 3.98
0.8 ± 0.24
Ca
1.43 ± 4.05
1.52 ± 1.2
Co
0.36 ± 0.48
0.66 ± 0.7
Cu
0.38 ± 0.37
1.10 ± 1.94
Fe
0.02 ± 0.02
2.18 ± 2.72
Li
1.60 ± 1.60
0.59 ± 0.59
K
0.46 ± 0.22
4.01 ± 3.26
Mg
0.45 ± 0.59
2.31 ± 1.37
Mn
0.04 ± 0.03
2.64 ± 2.72
Mo
0.18 ± 0.21
0.80 ± 0.82
Na
0.03 ± 0.03
2.01 ± 2.12
Ni
0.13 ± 0.13
1.00 ± 0.87
P
2.48 ± 1.27
1.06 ± 0.53
Sr
0.55 ± 0.48
0.85 ± 0.47
V
0.20 ± 0.13
2.78 ± 5.11
Zn
0.36 ± 0.29
0.73 ± 0.38
To identify the relationship between elements of RAT and the environmental factors, Pearson correlation analysis was employed to assess whether positive/negative correlation patterns existed (Fig. 3). For some essential elements, the results showed that the Ca content in the RAT had significantly negative correlations with longitude (LON) and latitude (LAT) and significantly positive correlations with altitude (ALT). The Fe content in the RAT had significantly negative correlations with LON, LAT, MAP and MAT and significantly positive correlations with altitude (ALT). The K, Mg, Mo and P contents had significantly negative correlations with LON and LAT and significantly positive correlations with altitude (ALT).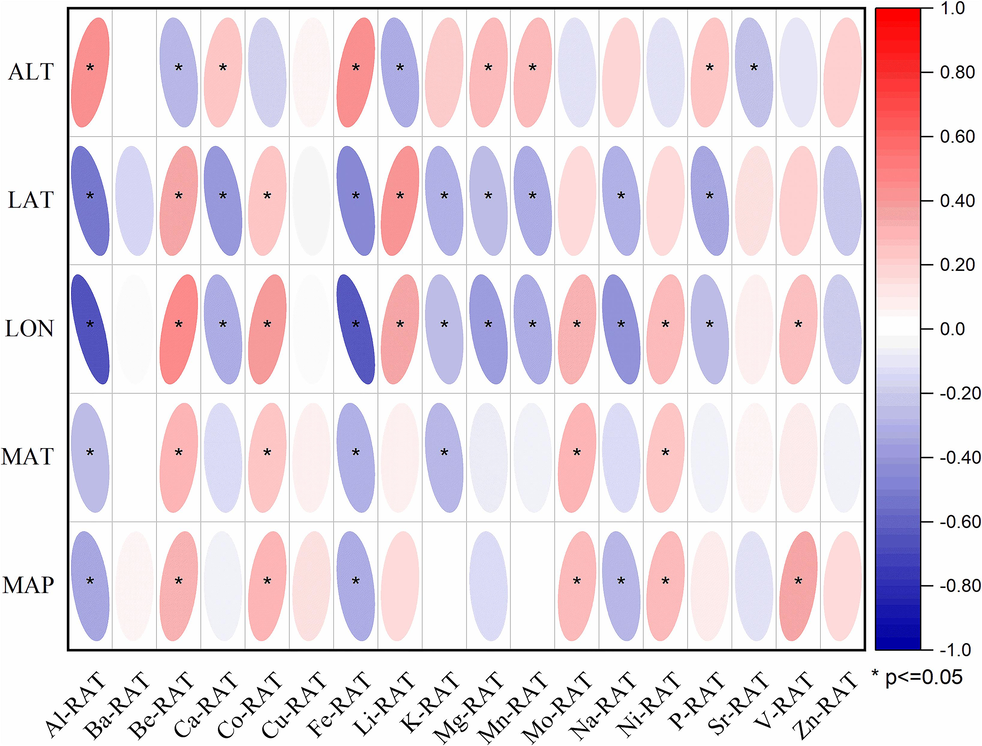
Correlation analysis of environmental factors and the elements in RAT of A. tanguticus.
3.3 Principal component analysis
Before PCA, the suitability of the elemental contents of AAT and RAT for factor analysis was checked. The Kaiser–Meyer–Olkin measure of sampling adequacy revealed a value of 0.604, greater than the recommended value of 0.500, with a statistical significance at p < 0.001. Both suggest that the correlation matrix was factored and appropriate for PCA.
PCA of the elemental contents of the AAT and RAT samples was conducted as an exploratory data analysis before classification modelling. The auto–scaled data matrix was applied for the PCA to facilitate a data structure study in a reduced dimension. Four extracted principal components (PCs) with eigenvalues explained 55.1 % of the total variance. More specifically, PC1, PC2 and PC3 explained 19.6 %, 16.2 % and 11.7 % of the total variance, respectively. Additionally, PC1 was associated with the most variables (Ca and Cu) in AAT samples, and (Al, Be, and Co) in RAT samples, whereas PC2 was associated with the most variables (Ba, Cu, K, Mn, Mo, and Zn) among the RAT samples.
The PCA score plot generated for 67 samples (Fig. 4a) clearly divided the samples from the various locations into three groups. The XZ samples could be distinguished from the GS, SC, and QH samples along the PC2 axis. Most GS samples could be distinguished from the SC samples along the PC1 axis. However, the QH samples could not be distinguished from the other samples along the PC1 axis. There was considerable overlap between the QH samples and SC samples as well as between the QH samples and GS samples. According to Fig. 4b, the XZ samples were negatively correlated with PC1, whereas the other samples were positively correlated with PC1. The Al, Fe, and Ca in RAT were negatively associated with PC1. The Be, Co, Ni, and Mo contents in the RAT samples and the Be and Cu contents in the AAT samples were positively associated with PC1. The Ca, Sr, and Fe contents in the AAT samples were highly negatively correlated with PC2, which in contrast to the highly positive correlations between the Mn, Ba, Zn, and K contents in the RAT samples and PC2. Hence, the XZ samples were mostly affected by Al, Fe, and Ca contents in RAT, whereas the GS, SC, and QH samples were mostly affected by Be, Co, Ni, and Mo contents in RAT and Be and Cu contents in AAT. Clearly, the results reflected the utility of the PCA for distinguishing A. tanguticus samples from different locations.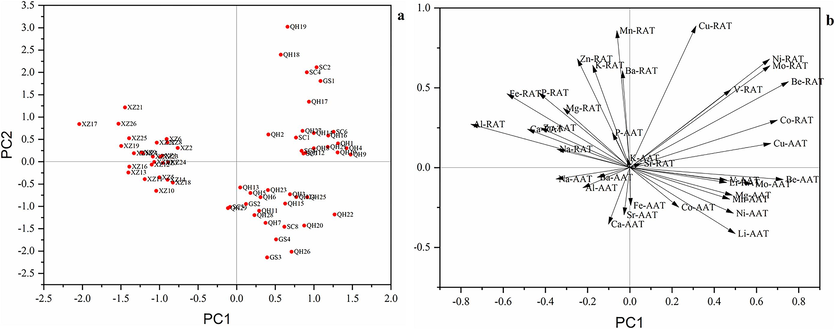
a) Score plot with the first two principal components of A. tanguticus. b) loading plot of PC1 and PC2 of A. tanguticus.
3.4 Linear discriminant analysis
The linear discriminant analysis (LDA) technique is a data processing method with supervised pattern recognition. LDA was further used to determine the contents of elements to achieve better classification and identification of the A. tanguticus samples. The stepwise discriminant procedure was carried out to extract the best discriminant variable separating A. tanguticus samples from different origins. Two discriminant functions were constructed that explained 100 % of the variance (79.4 % for function 1 and 20.6 % for function 2) with p < 0.01. Discriminant functions are shown as follows:
Function 1 = -9.97 + 0.383*Be-AAT + 0.153*Co-AAT + 0.194*Ni-AAT + 0.217*Be-RAT + 0.148*Co-RAT + 0.014*Ni-RAT-0.001*P-RAT.
Function 2 = -2.126 + 0.282*Be-AAT + 0.546*Co-AAT + 0.243*Ni-AAT + 0.062*Be-RAT −0.076*Co-RAT −0.174*Ni-RAT.
Fig. 5 shows the scatter plot of A. tanguticus samples by discriminant functions. The XZ samples were clearly separated from the GS, SC, and QH samples. Therefore, LDA can be a reliable method for discriminating A. tanguticus samples from different locations. To further evaluate the predictive ability of LDA, the generated model was validated through leave-one-out cross-validation. The predictive ability of the origin and cross-validation (percentage of the training set correctly classified) was 100 % and 100 %.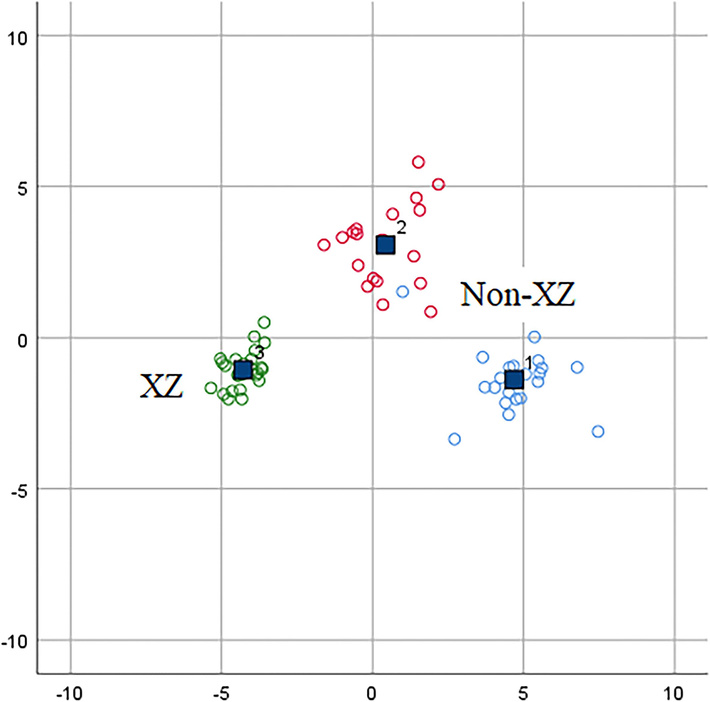
Scatter plots of A. tanguticus based on the linear discriminant analysis.
3.5 Orthogonal partial least squares discriminant analysis
OPLS–DA of the AAT, and RAT elemental contents was conducted to further separate the A. tanguticus samples according to their geographical origins. The OPLS–DA model presented the sample classification results in a score chart. An R2Y of 0.915 revealed that the two predictive PCs of this model had an explanatory power of 91.5 % for the variation in Y variables, and a Q2 of 0.865, which indicated that the two predictive PCs of this model had predictive power of 86.5 % for A. tanguticus, suggesting that the model was appropriate for generating accurate predictions (Wu et al., 2015).
Two principal component scores of A. tanguticus samples from 67 regions in the OPLS–DA model is shown in Fig. 6a. The samples from the different regions were classified into two groups. The XZ samples were clearly separated from the GS, SC, and QH samples. There was some overlap between the GS, QH, and SC samples. The XZ samples were positively correlated with PC1, whereas the other samples were negatively correlated with PC1 (Fig. 6b). Hence, the XZ samples were mostly affected by Al and Fe contents in RAT whereas the GS, SC, and QH samples were mostly affected by Be, Co, Ni, and Mo contents in RAT and Be and Cu contents in AAT. In the OPLS–DA model, the variable importance of the projection plot identified the following as the most important discriminant variables: Al, Be, Co, Fe Ca, Ni and Mo in the RAT samples; and Be and Cu in the AAT samples.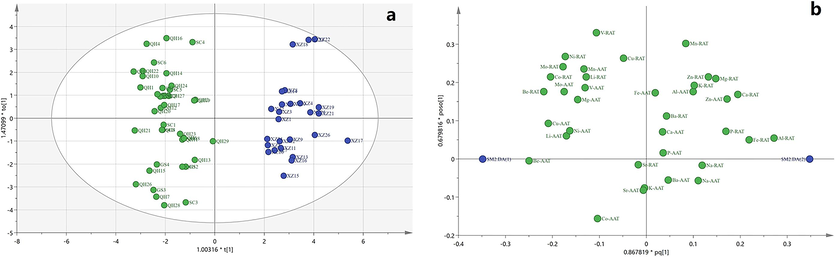
Comparison of OPLS-DA results from multi-elements of A. tanguticus. Score plot (a), loading plot from OPLS-DA (b).
4 Discussion
To understand the relationship of elemental contents among A. tanguticus and soil, some analyses were performed. Elements play an important role in several physiological processes in A. tanguticus. The soil is the source of elements, which accumulate through the root system. In this study, the observed difference in the ability of plants to take up various elements from the soil may reflect the differential importance of the elements for A. tanguticus growth, development, and metabolism. Ca and P are the high absorption elements that are essential for plant growth. The least absorbed element was Al, which can inhibit plant growth; therefore the A. tanguticus reduced its absorption to protect itself. The other elements were recognized as essential elements because they are important for enzymes and proteins in plant growth, and when the contents of these elements were high, they could produce a toxic action. Thus, A. tanguticus depends on their growth needs to absorb elements to meet their growth and reduce the toxic action. The TF values of Al, Ca, Fe, K, Mg, Mn, Na, Ni, P, and V were greater than 1.0, implying that these elements are needed by aerial plant parts. At the same time, the transport of elements in plant tissues and organs involves processes: movement into phloem and xylem, accumulation, and storage. Intraspecific differences in the elemental contents of the roots and aerial parts may be associated with the natural ability of plants to select elements from the soil and transport them to the aerial tissues and organs (Ma et al., 2020).
In the element accumulation process, except for soil factors, the elements of plants are also influenced by environmental factors. Some positive or negative correlation relationships have been found in the RAT of A. tanguticus. However, correlation analysis does not consider whether there is an interaction between variables. Thus, future work should investigate how environmental factors affect the content of elements in A. tanguticus.
Different parts of A. tanguticus from different regions showed different mean elemental contents, and thus it is impossible to determine geographical origin by elemental contents. Therefore, we integrated the elemental content of AAT and RAT data using three chemometric methods PCA, LDA, and OPLS–DA to better characterize the origin of A. tanguticus. PCA is an unsupervised method, and is generally regarded as a useful first step in many statistical analyses. LDA and OPLS–DA are supervised methods. XZ samples and the other samples with better discriminatory ability were obtained when the three methods were analysed separately. The sampling sites in China were geographically separated, with different climatic and soil conditions as well as distinct elemental characteristics. From the above results, we concluded that elemental contents of AAT and RAT, based on PCA, LDA and OPLS-DA, could establish reliable discrimination models to discriminate geographical origins. By discriminating A. tanguticus based on its geographical origin, stakeholders can ensure the traceability of the herb. Traceability is crucial for maintaining consistent quality, as the environmental conditions of different growing regions can significantly impact the plant's phytochemical and elemental composition.
5 Conclusions
A rapid method involving ICP–OES for the analysis of multiple–elements in different parts of A. tanguticus and their soil samples was developed. The results indicated that A. tanguticus from different areas had distinct element contents that could be used to discriminate samples from different geographical origins. Furthermore, multi-element signatures were used to divide samples with different geographical origins into XZ samples and the other samples using PCA, LDA and OPLS–DA methods. The method developed in this study may be useful for identifying various herbs and determining their geographical origins. Furthermore, the multielement content in A. tanguticus depends on the soil conditions in a particular geographic region.
Funding
This work was supported by Qinghai Science and Technology Achievement Transformation Project (2021–SF–149).
Authors’ contributions
GZ designed the experiments; CC and BW established and validated the methods. FX and YMX were involved in writing of the manuscript. All authors read and approved the final manuscript.
Acknowledgements
We thank Xiaoyan Jia (Chinese Academy of Sciences Key Laboratory of Tibetan Medicine Research, Northwest Institute of Plateau Biology, Xining, China), and Shoulan Bao (Chinese Academy of Sciences Key Laboratory of Tibetan Medicine Research, Northwest Institute of Plateau Biology, Xining, China) for sampling assistance.
Declaration of competing interest
The authors declare that they have no known competing financial interests or personal relationships that could have appeared to influence the work reported in this paper.
References
- LC–MS quantitative determination of atropine and scopolamine in the floral nectar of Datura species. Chromatogra.. 2010;71:43-49.
- [Google Scholar]
- Trace elements in Lycium barbarum L. leaves by inductively coupled plasma mass spectrometry after microwave assisted digestion and multivariate analysis. Spectrosc. Lett.. 2014;48:775-780.
- [Google Scholar]
- Modeling of stable isotope and multi-element compositions of jujube (Ziziphus jujuba mill.) for origin trace ability of protected geographical indication (PGI) products in Xinjiang. China. J. Food Compos. Anal.. 2020;92:103577-103589.
- [Google Scholar]
- Essentiality and toxicity of vanadium supplements in health and pathology. J. Physiol. Pharm.. 2014;65:603-611.
- [Google Scholar]
- Biogeography and variability of eleven mineral elements in plant leaves across gradients of climate, soil and plant functional type in China. Ecol. Lett.. 2011;14:788-796.
- [Google Scholar]
- Comparative chemometric analysis of fluorescence and near infrared spectroscopies for authenticity confirmation and geographical origin of argentinean extra virgin oliv. Food Control. 2019;96:22-28.
- [Google Scholar]
- Improved geographical origin discrimination for tea using ICP–MS and ICP–OES techniques in combination with chemometric approach. J. Sci. Food Agr.. 2020;100:3507-3516.
- [Google Scholar]
- Fast identification of the geographical origin of Gastrodia elata using excitation-emission matrix fluorescence and chemometric methods. spectrochim acta Part a: Mol. and bio. Spect.. 2021;258:119798-119805.
- [Google Scholar]
- Discrimination of three Ephedra species and their geographical origins based on multi-element fingerprinting by inductively coupled plasma mass spectrometry. Sci. Rep.. 2018;8:10271-10280.
- [Google Scholar]
- Effects of location, climate, soil conditions and plant species on levels of potentially toxic elements in chinese prickly ash pericarps from the main cultivation regions in China. Chemosphere. 2020;244:125501-125512.
- [Google Scholar]
- Geographical origin differentiation of saffron spice (Crocus sativus L. stigmas)-Preliminary investigation using chemical and multi-element (H, C, N) stable isotope analysis. Food Chem.. 2011;128:543-548.
- [Google Scholar]
- The metals in the biological periodic system of the elements: concepts and conjectures. Int. J. Mol. Sci.. 2016;17:66-73.
- [Google Scholar]
- Discrimination of the geographical origin of the lateral roots of Aconitum Carmichaelii using the fingerprint, multicomponent quantification, and chemometric methods. Molecules. 2019;24:4124-4137.
- [Google Scholar]
- Disorders involving calcium, phosphorus, and magnesium. Primary Care. 2008;35:215-237.
- [Google Scholar]
- Influence of sample preparation methods on the quantitation of selected TAs from herb of Datura innoxia mill. by HPTLC. Acta Chromatogr.. 2013;25:545-554.
- [Google Scholar]
- Relationship among geochemical elements in soil and grapes as terroir fingerprintings in Vitis vinifera L. cv. “glera”. Geochemistry. 2017;77:121-130.
- [Google Scholar]
- Assessment of geographical origin and production period of royal jelly by NMR metabolomics. Chem. Biol. Technol. Ag.. 2020;7:24-37.
- [Google Scholar]
- Zinc and its importance for human health: an integrative review. J. Res. Med. Sci.. 2013;18:144-157.
- [Google Scholar]
- Role of magnesium fertilizers in agriculture: plant-soil continuum. Crop Pasture Sci.. 2016;66:1219-1229.
- [Google Scholar]
- Determination of the geographical origin of rice by element fingerprints and correlation analyses with the soil of origin. Anal. Methods. 2013;5:6177-6185.
- [Google Scholar]
- Distribution and bioaccumulation of trace elements and lanthanides in apples from northwestern Italy. J. Trace Elem. Med. Biol.. 2020;62:646-653.
- [Google Scholar]
- Potassium intake, bioavailability, hypertension, and glucose control. Nutrients. 2016;8:444-457.
- [Google Scholar]
- Environmental controls on stable isotope precipitation values over Mali and Niger. West Africa. Environ. Earth Sci.. 2011;62:1749-1759.
- [Google Scholar]
- Comparative study of contents of four TAs in cultural and wild Anisodus tanguticus. Acta Bot. Boreal.. 2005;25:575-577.
- [Google Scholar]
- Effects of berberine and pomegranate seed oil on plasma phospholipid metabolites associated with risks of type 2 diabetes mellitus by UHPLC Q-TOF-MS. J. Chromatogr. B. 2015;1007:110-120.
- [Google Scholar]
- The variation of the contents of four TAs in Anisodus tanguticus. Acta Bot. Boreal.. 2002;22:630-634.
- [Google Scholar]
- Discrimination of geographical origin of cultivated Polygala tenuifolia based on multi-element fingerprinting by inductively coupled plasma mass spectrometry. Sci. Rep.. 2017;7:12577-12584.
- [Google Scholar]
Appendix A
Supplementary data
Supplementary data to this article can be found online at https://doi.org/10.1016/j.arabjc.2024.105730.
Appendix A
Supplementary data
The following are the Supplementary data to this article:Supplementary data 1
Supplementary data 1


