

Translate this page into:
α-glucosidase inhibitory, antioxidant activity, and GC/MS analysis of Descurainia sophia methanolic extract: In vitro, in vivo, and in silico studies
⁎Corresponding authors. shakourmehdi@gmail.com (Mehdi Shakouri Khomartash), gorgani59@gmail.com (Sattar Gorgani-Firuzjaee)
-
Received: ,
Accepted: ,
This article was originally published by Elsevier and was migrated to Scientific Scholar after the change of Publisher.
Peer review under responsibility of King Saud University.
Abstract
Abstract
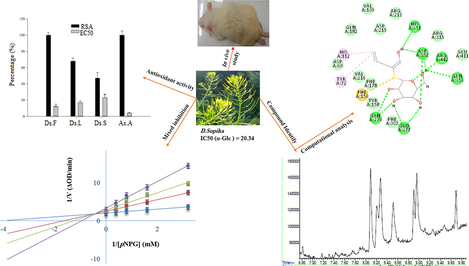
Due to the presence of various phenolic compounds in D.sophia, this plant may have an inhibitory effect on α-Glc and ultimately diabetes control. Therefore, this work aims to scrutinize total phenolic, flavonoid contents, antioxidant capacity, and α-Glc inhibitory activity in aerial parts of methanolic D.sophia extract. The methanolic flower extracts were selected from among aerial parts for the experimental study of anti-diabetic effects by α-Glc inhibitory assays. The flower extracts were also studied by GC/MS to detect the compounds. The total phenolic and flavonoid contents were 21.38 ± 0.93 GAE/g and 96.2 ± 0.20 QE/g, respectively. The IC50 value of flower extract for α-Glc inhibition with mixed (Competitive/non-competitive) mode was found to be 20.34 ± 0.11 mg/ml. Furthermore, in-vivo studies showed that the blood glucose level reduced after consumption of flower extract compared to the control group. Twenty-one compounds were identified by GC/MS technique. These compounds were assessed for high docking scores against α-Glc in silico. Docking score calculations exhibited that the DES-α-Glc complex had a significantly higher binding energy (-6.13 Kcal/mol) than other compounds. The DES-α-Glc complex which displayed a higher docking energy value than the ACR was subjected to MDs studies. The findings of this study suggest that the flower extract of D.sophia can be used as a suitable additive in syrups or foods with anti-diabetic capacity.
Keywords
α-glucosidase
Descurainia sophia
Desolphosinigrin
Molecular docking
Molecular dynamics simulation

- D. sophia
-
Descurainia sophia
- α-Glc
-
α-glucosidase
- GC/MS
-
Gas chromatography-mass spectrometry
- GAE
-
Gallic acid equivalents
- QE
-
Quercetin equivalents
- DES
-
Desulphosinigrin
- ACR
-
Acarbose
- MDs
-
Molecular dynamic simulation
- DM
-
Diabetes mllitus
- AGIs
-
α-glucosidase inhibitors
- ALX
-
Alloxan
- RMSD
-
Root Mean Square Deviations
- RMSF
-
Root Mean Square Fluctuations
- Rg
-
Radius of gyration
- RSA
-
Radical scavenging activity
- As.A
-
Ascorbic Acid
- Ds.F
-
Descurainia sophia Flower
- Ds.L
-
Descurainia sophia Leaf
- Ds.S
-
Descurainia sophia Stem
- BGL
-
Blood glucose levels
- RT
-
Retention time
- Mw
-
Molecular weight
- PDB
-
Protein data bank
- ROS
-
Reactive oxygen species
- DPPH
-
2,2-diphenyl-l-picrylhydrazyl
- BSA
-
Bovine serum albumin
- TCA
-
Trichloroacetic acid
Abbreviations
1 Introduction
DM is a metabolic disease characterized by high blood glucose levels (hyperglycemia) and lack or insufficient insulin secretion. Hyperglycemia is related to atherosclerotic disease and enhanced occurrence of microvascular complications in diabetic people. Chronic hyperglycemia can activate the non-enzymatic glycosylation and the diabetic complication (Shim et al., 2003, Becerra-Jiménez and Andrade-Cetto 2012). Furthermore, evidence indicated that long-time exposure to chronic high glucose levels stimulates the generation of ROS that has a pivotal role in diabetic complications. Moreover, diabetes also changes the activity of antioxidant enzymes in some tissues, such as the liver, aorta, and kidney (Fatehi-Hassanabad et al., 2010, Anichini et al., 2020).
Controlling blood glucose levels is an effective method to delay hyperglycemia. This is correlated to the breakdown of carbohydrates including α-Glc (Cakar et al., 2017, Čakar et al., 2018). The α-Glc enzyme, a membrane-bound enzyme, is present in the brush border of the small intestine, which catalyses the hydrolysis of 1,4-α bonds of oligo and disaccharides and converts them into absorbable monosaccharides (Han et al., 2017, Ni et al., 2019, Sadeghi and Zarei 2020). Therefore, α-Glc inhibition can be an effective way to delay absorption and control blood glucose levels. Several AGIs such as metformin, ACR, thiazolidinediones, meglitinides, and sulfonylureas have been advanced to reduce postprandial blood glucose levels. However, continued use of these AGIs leads to numerous side effects including diarrhea, flatulence, and abdominal pain. (Cai et al., 2020, Xu et al., 2020). Thus, the use of natural resources such as plant-derived compounds with low side effects can be an interesting approach to reducing the blood glucose level in diabetic patients.
Some biologically active compounds derived from plants, foods, and fruits such as flavonoids, phenolic acids, stilbenoids, C-glycosylflavonoids, and terpenoids have been considered important sources of α-glucosidase inhibitors (Đorđević et al., 2018, Fettach et al., 2019, Aalim et al., 2021). Numerous pharmaceutical herbs have been used for several years to control diabetes in different countries. Iran is one of the countries with a great diversity in plant species, which grow across different regions (Sadat-Hosseini et al., 2017). The Descurainia sophia (L.) Webb ex Prantl (D.sophia) belongs to the Brassicaceae family in The Plant List (https://www.theplantlist.org/), a commonly used herbal medicine in Iranian folk medicine, is known as Khakshir (khak-e shir) (Amiri and Joharchi 2013, Zarshenas et al., 2013). Some reports have shown that the secondary metabolites of D.sophia include phenolics, cardiac glycosides, flavonoids, and sulfur glycosides (Amiri and Joharchi 2013). In Iran, Khakshir with other complementary syrups is used as a beverage (Mohammadinia et al., 2012, Pasalar et al., 2013).
The α-Glc inhibitory activity hexane extract of D.sophia has been reported (Zarei and Poursharifi 2015) but the hexane extract is not used as part of Khakshir. Due to the abundance of D.sophia in the Kurdistan region of Iran, it will be very interesting to investigate the inhibitory effects of its relevant extracts on α-Glc and the subsequent reduction in blood glucose levels. Hence, the present study aimed to determine phenolic and flavonoid contents, antioxidant activities, and α-Glc inhibitory of the aerial parts of D.sophia, as well as to characterize the potent extracts, in vivo investigation, GC/MS analysis, followed by molecular docking and molecular dynamics simulation for compounds with potential inhibitory effect.
2 Materials and methods
2.1 Chemicals
p-Nitrophenyl α-D-glucopyranoside (pNPG), Saccharomyces cerevisiae α-Glc, ACR, DPPH, sodium carbonate, and BSA, was purchased from Sigma Aldrich Chemical Co. London, UK. Alloxan, Aluminium chloride, quercetin, ascorbic acid, gallic acid, ferric chloride, Folin–Ciocalteau’s reagent, TCA, and potassium acetate were purchased from Merck Co. Darmstadt, Germany.
2.2 Plant materials
The plant's aerial parts were collected from the central areas of Kurdistan Province, Iran, from June to July 2018. Voucher specimens have been deposited in the Herbarium of the Kurdistan Agricultural and Natural Resources Research & Education Center (HKC), Sanandaj, Iran. Their flowers, leaves, and stems were separated from each other. Separated aerial parts were dried and grinded by an electric grinder (Dolatabadi et al., 2011, Khan et al., 2018).
2.3 Preparation of crude extract
To determine the enzyme inhibitory and antioxidant activities of the crude extracts, 40 g of each ground powder was soaked in 200 ml methanol for 24 h with sporadic shaking. The soaked plant materials were filtered through a Whatman filter paper (grade No, 42). The solvent was evaporated with the rotary evaporator. The residues were air-dried under the chemical hood and finally collected in small microfuge tubes. A stock solution (200 mg/ml) was prepared, then diluted to different concentrations.
2.4 Determination of total phenolics
The total phenolics were measured according to Shahidi and Naczk (Shahidi and Naczk 1995). Briefly, 0.5 ml of 100 ppm the extract was mixed with 0.5 ml of Folin-Ciocalteu reagent and incubated for 2 min, followed by adding 10 ml Na2CO3 (7:100, v/v). Subsequently, the absorbance of samples was measured at 765 nm after heating at 45 °C water for 60 min. The total Phenolic contents were expressed as mg of Gallic acid equivalents per g of dry weight.
2.5 Determination of total flavonoid
The content of flavonoid compounds was measured by the Chang-Yang method and according to the aluminium chloride colorimetric method (Chang et al., 2002). Briefly, 0.5 ml of diluted samples were mixed with 0.1 ml of 10% AlCl3 methanol solution, 0.1 ml potassium acetate 1 M, and 2.8 ml of distilled water. After incubating at RT for 30 min, the absorbance was measured at 415 nm. The flavonoid content was calculated from a Quercetin standard curve and expressed in mg Quercetin equivalent per g of dry mass.
2.6 DPPH free radical-scavenging capacity
Free radical scavenging activity was calculated using the method described by Prakash et al with a few modifications (Prakash et al., 2007). Briefly, a methanolic solution (0.1 ml) of the sample at different concentrations was added to 0.1 ml of DPPH (0.1 mM) solution. The reaction mixture was incubated at RT for 30 min with gentle shaking, the absorbance was measured at 517 nm. The percentage (%) of RSA was determined using the following formula:
The Ascorbic acid concentrations of 0.031, 0.25, 0.5, 1.0, 2.0, 5.0, 8.0, and 12.0 μg/ml were used as positive controls and also the DPPH solution was used as a negative control. EC50 values indicate the concentration of the sample needed to scavenge 50% of the DPPH free radicals.
2.7 Determination of reducing power
The reduction power of the extracts was measured according to the method of Yen et al (Yen and Chen 1995). Briefly, 2.5 ml of phosphate buffer (0.2 M, pH 6.6) and 2.5 ml of potassium ferricyanide (1% v/v) were added to 2.5 ml extract solutions (50–800 µg/ml). After 30 min incubation at 45 °C, 2.5 ml of 10% trichloroacetic acid was added to the mixture and centrifuged for 10 min at 2300 g. Thereafter, 2.5 ml of the supernatant was mixed with 2.5 ml distilled water and 0.5 ml FeCl3 (0.1%), and finally, absorbance was measured at 700 nm.
2.8 α-Glc inhibition assay
α-Glc inhibitory activity was assayed according to Pistia-Brueggeman et al, with a few changes (Pistia-Brueggeman and Hollingsworth 2003). Briefly, 20 μl of each plant extract dilution (5.0, 10.0, 15.0, 20.0, 25.0, 50.0, 100.0, and 200.0 mg/ml), 50 μl of phosphate buffer (50 mM; pH 6.8), 10 μl of α-Glc (1 U/ml) were mixed together in a well of 96-well microplate, then incubated at 37 °C for 5 min. subsequently, 20 μl of pNPG (1 mM) substrate was added to the mixture and after incubation at 37 °C for 30 min, the reaction was stopped by the addition of 50 μl of 0.1 M Na2CO3. ACR was used as the positive control. Each experiment was performed in three replicates with appropriate blanks. The percentage of inhibition of α-Glc was obtained as follows:
The IC50 was estimated using nonlinear regression analysis using SigmaPlot software. All values are expressed as Mean ± Standard Deviation.
2.9 Kinetic analysis
The inhibition kinetics of plant extracts were analysed by the same method as described above for the α-Glc activity assay. The inhibitory method was considered by the effects of seven variant concentrations (5.0, 15.0, 20.0, 25.0, 50.0, 100.0, and 200 mg/ml) of plant extracts solutions. The maximum velocity (Vmax) and Michaelis–Menten constant (Km) were calculated by the Lineweaver–Burk (LB) curve in equation (1) (Lin et al., 2015). Equations (2) and (3) were used to find the inhibition type of the extract and the kinetic constants (Kik and Kiv), respectively (Yang et al., 2013).
2.10 Animals
Male Wistar rats weighing 190 to 230 g were purchased from the Isfahan Royan Institute. Animals were housed in standard conditions with free access to water, food, and adequate light. All animal protocols were approved by the AJA University of medical sciences Animal Ethics Committee (ethical certificate: IR.AJAUMS.REC.1401.035). The rats became diabetic with an oral administration of alloxan (Rats 130 mg/kg body weight) and definite by blood glucose level (>210 mg/dl) (Kalaivani et al., 2012).
2.11 Induced diabetes
Induction of diabetes with ALX was performed by previous studies with few modifications (Macdonald Ighodaro et al., 2017). The diabetes was induced by oral administration of ALX 130 mg/kg. Five groups of rats were selected (n = 5). Group I: As negative group, during the test period received 0.5 ml of 60% in NaCl (5 g/l) and did not receive any drug treatment. Group II: As diabetic group, received oral administration ALX 130 mg/kg dissolved at 60% in NaCl (5 g/l), and during the trial period they did not receive any drug treatment. Group III: As under treatment with oral administration of acarbose (10 mg/kg) and ALX (130 mg/kg) dissolved at 60% in NaCl (5 g/l). Group IV: As under treatment with oral administration of extract (2.25 g/kg) and ALX (130 mg/kg) dissolved at 60% in NaCl (5 g/l). Group V: As under treatment with oral administration of extract (4.50 g/kg) and ALX (130 mg/kg) dissolved at 60% in NaCl (5 g/l).
2.12 GC/MS study
To determine natural components of D.sophia flower, the considered extract was analyzed by GC/MS using an Agilent gas chromatograph model GC 7890A coupled with a mass spectrometer model MS 5973A (Schlawis et al., 2018). The column conditions were as follows: Elite-1 Capillary Column, 3 m × 0.25 mm I.D × 0.25 μm, working in electron influence method at 60 eV. A fixed stream of 1.32 ml/min and an additional volume of 1 μl of helium gas was used as carrier gas. The ion source and injector temperatures were adjusted to 210 °C and 250 °C, respectively. The control of the oven temperature was as follows: First, the oven temperature started from 60 °C with a rise of 20 °C/min to 310 °C/min and then finished with isotherm for 10 min at 310 °C. MS spectra were recorded at 60 eV, with a scan value of 30–1100 m/z.
2.13 Molecular docking
The S.cerevisiae α-Glc 3A4A (PDB ID) was downloaded from Protein Data Bank (https://www.rcsb.org/structure/3A4A) and the pattern quality and validation were checked by the PROCHECK server (Laskowski et al., 2006). Then the desired pattern was selected as the docking input file. The structures of the ACR and compounds in the D.sophia flower were downloaded from PubChem (https://pubchem.ncbi.nlm.nih.gov/). All the water molecules were deleted and added the hydrogen bond, compute Gasteiger and atoms assign AD4 type with the AutoDock tools software (version 4.2). All docking parameters including Grid box (110 × 115 × 110), algorithm type, and runs (1000 runs) were calculated. Then, the docking score was calculated for each compound. Finally, Discovery Studio (DS version 3.5) software was used to analyze the inhibitor/enzyme interactions.
2.14 MD simulation
MD simulation with Gromacs was used to obtain further comprehensive binding information. The AMBER99SB-ILDN protein and the general amber force field were added to charge α-Glc and ligand, respectively. Ligand topology was created by Prodrg. The complex was solvated in SPC/E Water Models (Mark and Nilsson 2001). After adding the water, the complex was neutralized by adding thirty Na+ and ten Cl−. The covalent contacts between the atoms were limited by short energy minimization. Then the system was equilibrated in two stages. The first stage contained a fixed number of particles, volume, and temperature (NVT). The second stage included a constant number of particles, pressure, and temperature (NPT). Finally, the simulation was performed at 300 K and 1 bar pressure for 100 ns. MD simulation protocol between receptor-ligand complex was analysed according to the previous reports (Ni et al., 2020). Finally, the stability of the system was computed the RMSD, RMSF, Rg, and hydrogen bonding analysis.
2.15 Statistical analysis
The data and results of the experiments were analyzed using SigmaPlot software, version 12. ANOVA was used to assess the significant differences between groups; A value of p < 0.05 were considered significant. And all the data from the experiment were replicated and their values were reported as Mean ± Standard Deviation.
3 Results and discussion
3.1 Phenolic and flavonoid contents
Flavonoids and other Phenolic are secondary metabolites found in some plants with antioxidant properties. The antioxidant activity of these compounds is due to the presence of hydroxyl groups in the aromatic ring structure and also using non-coupled electrons around the ring to eliminate free radicals (Alam et al., 2007). Previous studies have shown a positive correlation between phenolic and flavonoids content and their relative anti-diabetic activities (Ahmed et al., 2014). The amount of total phenolic and flavonoid compounds in the aerial parts of the D.sophia was calculated (Table 1). The highest levels of Phenolic and flavonoid contents were quantified in flower part of D.sophia as 21.38 ± 0.93 mg GAE/g and 35.85 ± 0.73 QE/g, respectively. Therefore, due to the relationship between phenolic and flavonoid contents with α-Glc inhibition (Dirar et al., 2019), it is expected that this part will show more inhibition.
Name
Aerial part
Total phenolic content (µg/ml)
Total flavonoid content (µg/ml)
D. sophia
Flower
21.38 ± 0.93
35.85 ± 0.73
Leaf
2.96 ± 0.68
12.81 ± 0.87
Stem
0.89 ± 0.07
4.53 ± 0.46
Added report corroborated the presence of flavonoid and phenolic complexes in the methanol extract of D.sophia as 41.77 ± 0.17 QE/g and 25.44 ± 0.53 mg GA/g, respectively (Mahomoodally et al., 2018). In this work, the D.sophia flower extract exhibited a low amount of flavonoid and phenolic compounds than the previous studies. This variation is possibly due to aspects such as environmental settings, solubility degree in the solvents, degree of polymerization of flavonoid and phenolic compounds, seasonal differences, etc (Medini et al., 2014). Most previous studies of plant extracts containing high flavonoid and phenolic compounds revealed good antioxidant capacity and AGI ability (Chen et al., 2019, Sarikurkcu et al., 2019). Thus, the present work was attentive on the antioxidant capacity and AGI identification from D.sophia.
3.2 Antioxidant activity
To evaluate the antioxidant activity, two common methods including free RSA and reducing power of plant extracts were employed. The first approach is to trap the DPPH radicals by the ability of hydrogen donation (Đorđević et al., 2018). In the second method, the reducing power of the material in the extract is assessed by reducing iron III into II. Iron reducing is often used as an electron-donating potential measurement, which is a suitable method for evaluating the antioxidant activity of phenolic compounds (Franco et al., 2018). RSA and EC50 values were determined for aerial parts of D.sophia (Fig. 1A). The flower extract has the highest RSA and the lowest EC50, which is similar to ascorbic acid. The results of the reducing power test is displayed in Fig. 1B. The range of reducing power in flower extract was 0.43 to 1.78, while it was lower in other aerial parts. Therefore, the antioxidant results showed that flower extract may have potential antioxidant activity due to higher RSA and power reducing levels as well as lower EC50. Given the association between antioxidant potency and α-Glc inhibition (Girish et al., 2012), it is expected that flower extract may show more inhibition.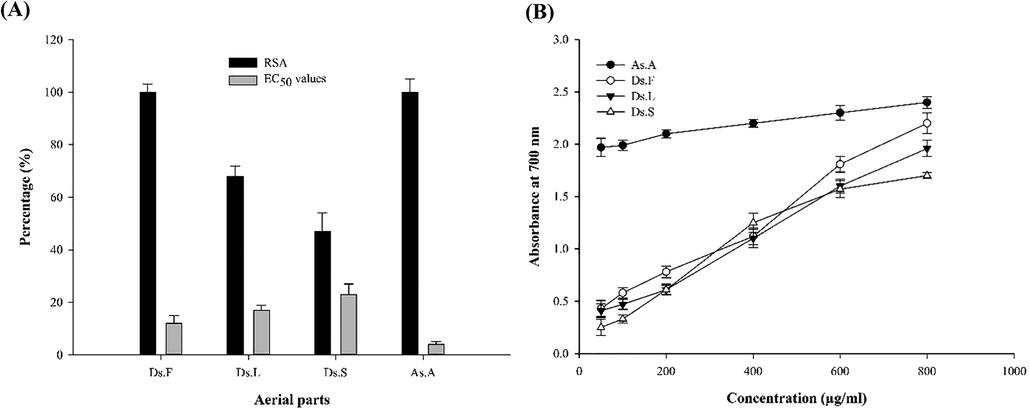
Antioxidant activity results. (A) RSA and EC50 values for different aerial parts of extracts (B) Reducing power graph of aerial pars of extracts. Results are expressed as mean ± SD in triplicate measurements.
3.3 In vitro α-Glc inhibitory ability
The AGI abilities of aerial parts methanol extracts were signified in Fig. 2. The methanolic flower extract displayed good ability with an IC50 value of 20.34 ± 0.11 mg/ml. The AGI ability of flower extract exhibited the highest ability of the other aerial parts. Further, the control ACR (IC50 = 6.12 ± 0.13 mg/ml) revealed a very good inhibitory ability of α-Glc which are significantly better than flower extract. The purity of compounds could minor role in their inhibitory effects. But it depends simply on the nature of the compounds. If one compound in the crude extract owns a strong affinity to the active center, with a proper concentration the extract could have a low IC50 despite its complexity. There are numerous studies on the AGI ability of the aerial part extracts from other plants. The methanolic extract from lpomoea alba has shown AGI ability with an IC50 value of 17.12 ± 0.18 mg/ml against the α-Glc enzyme (Rosas-Ramírez et al., 2020). The flower and leaf extracts from Psychotria malayana revealed AGI ability with IC50 values of 14.23 ± 0.16 and 21.16 ± 0.12 mg/ml respectively (Nipun et al., 2021).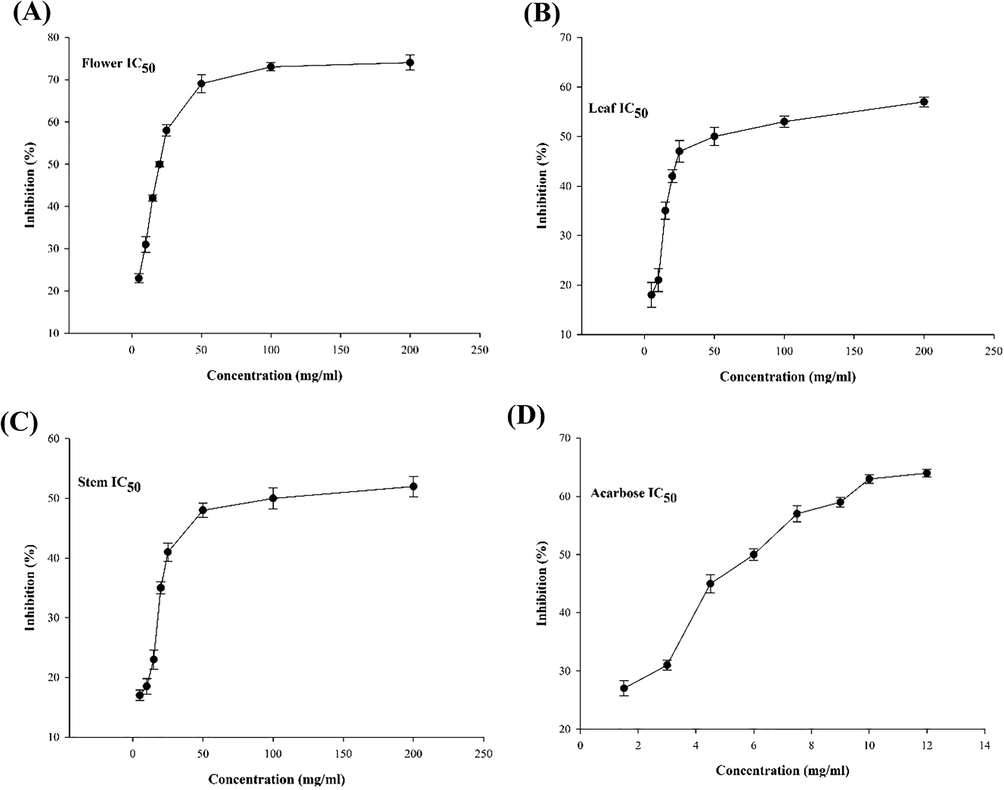
The α-Glc inhibitory activity of aerial part extracts. (A) flower, (B) leaf, (C) stem, (D) ACR, positive control was ACR (IC50 = 6.12 ± 0.13 mg/ml). The results are presented as IC50 versus concentration and determined as mean ± SD.
3.4 Inhibition kinetics mediated by flower extract
Due to the high phenolic and flavonoid contents, antioxidant capacity, and a significant amount of α-Glc inhibitors in the D.sophia flower extract, the inhibition type of the α-Glc enzyme was determined for this part. The LB diagram was used to evaluate the inhibition type and kinetic parameters (Xiong et al., 2018). Fig. 3 shows the α-Glc activity in the presence of various concentrations of substrate and different amounts of flower extract. The lines intersect at a common point indicating a mixed (competitive/non-competitive) mode of inhibition (Beedessee et al., 2013).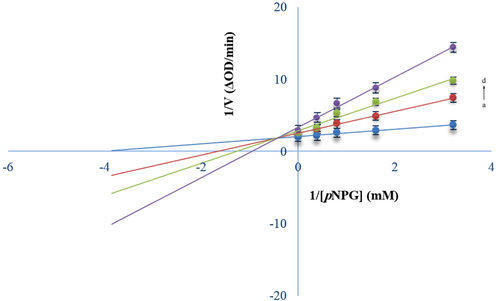
LB plots. c(α-glucosidase) = 3.28 × 10⁻⁷ mol/L, and c(flower extract) = 0, 50.0, 100.0, and 200.0 mg/ml for Curves a → d, respectively.
The amount of Km and Vmax increases and decreases respectively, calculated by equation (1) with increasing of [I0], indicating a mixed inhibition by the flower extract (Table 2). In addition, the inhibition type of flower extract was further checked by Equation (2) and Equation (3) according to Johnson's theory (Johnson and Goody 2011). Kiv into Kik (Kiv/Kik) ratios can also be used to detemine the type of inhibition. If this value is between 2.0 and 5.0, it indicates the mixed mode of inhibition (Ni et al., 2020). The mentioned ratios were 2.03 to 3.79, which signifies this type of inhibition on α-Glc.
[I0] (Extract)/mg.ml−1
Km (mg)
Vmax (mg.ml−1.min−1)
Kiv/Kik
0
2.63 ± 0.08
5.31 ± 0.14
–
50
5.93 ± 0.79
3.01 ± 1.03
2.3
100
6.71 ± 0.67
3.64 ± 1.06
3.14
200
8.03 ± 0.93
2.19 ± 0.58
3.79
3.5 In vivo study of blood glucose level
Among the aerial parts of D.sophia, methanolic flower extract had more α-Glc inhibitory and antioxidant capacity. Therefore, in the present work, the hypoglycemic effect mediated by D.sophia flower extract was investigated in diabetic rats. BGL was in the range of 85–94 mg/dl in all rat groups at the time of 0 h. The oral administration of the alloxan (130 mg/kg body weight) was utilized to heighten BGL; thirty-six hours after administration, it reached a maximum value of 466 mg/dl (Fig. 4). The rats that received ACR (oral administration 10 mg/kg body weight) exhibited a reduction of the BGL in comparison with the alloxan group. Rats given D.sophia flower extract (oral administration 2.25 g/kg body weight) showed a considerable reduction in BGL up to 273 mg/dl at 36 h post-administration. Moreover, intake of D.sophia flower extract (oral administration 4.50 g/kg body weight) in rats reduced the BGL up to 206 mg/dl at 36 h post-administration. Accordingly, the ACR (10 mg/kg body weight) and flower extract (4.5 g/kg body weight) groups showed the lowest BGL in comparison with the diabetic group (p-value < 0.05). Therefore, our results propose that ACR and D.sophia flower extract can prevent the hydrolysis of the disaccharide and reduce the BGL. These findings may be due to structural similarity between ACR and compounds of D.sophia flower extract in α-Glc inhibition.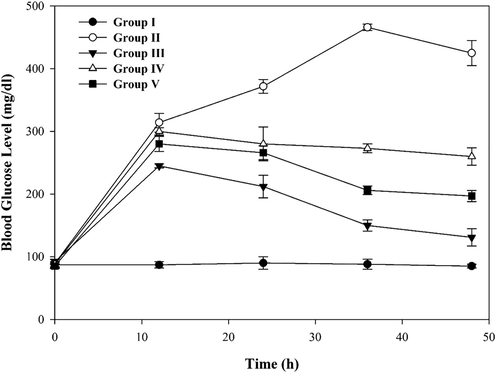
Effect of D.sophia flower extract on blood glucose level in ALX diabetic rats. Thirty rats were divided into five groups: Negative Control (Group I), ALX diabetic (Group II), under treatment with ALX and ACR (Group III), under treatment with ALX and EXT 2.25 g/kg (Group IV), and treatment with ALX and EXT 4.50 g/kg (Group V). BGL was measured at 0, 12, 24, 36, and 48 h after administration of ALX according to the injection ALX test method described in the text. Oral administration dose; ALX at 130 mg/kg body weight, EXT at 2.25 g/kg body weight, EXT at 4.50 g/kg body weight, and ACR at 10 mg/kg body weight. Each dot signifies mean ± S.D.
3.6 Phytochemistry
Among the aerial parts of D.sophia, methanolic flower extract had more α-Glc inhibitory potency and antioxidant properties. Therefore, the D.sophia flower compounds were identified through GC/MS technique. The different compounds were recognized by analyzing the spectral data obtained from GC/MS (Fig. 5A, 5B) and comparing them with the information of the National Institute of Standard and Technology (NIST). The compound’s name, RT, formula, peak area, Mw, PubChem CID, and the structure of the flower extract were shown (Table 3). Most plants and their components can lower the blood glucose amount due to their diversity of flavonoid, phenolic, tannins, and terpenoids compounds (Osadebe et al., 2010). Natural compounds described by GC/MS study were found to have potential hypoglycemic effects. Numerous healing compounds were recognized through GC/MS by many scientists. These compounds possess antifungal, antibacterial, antioxidant, anti-diabetic, anticancer, and anti-inflammatory properties (Kalaivani et al., 2012, Gopinath et al., 2013). From the prior reports, it was established that quercetin (Kim et al., 2017), isoeugenol (Topal 2019), isorhamnetine (Shibano et al., 2008), and Isovanillic acid (Choi et al., 2020) are important natural compounds with antioxidant and α-Glc inhibitory activity. GC/MS investigation of dichloromethane extract of Ferulago bracteata exhibited the presence of bergapten, 4,7-Octadecadiynoic acid, methyl ester, Cinnamylaldehyde and other compounds with α-Glc inhibitory capacity (Karakaya et al., 2018). Hence, in consistent with the previous studies, our findings demonstrated the presence of natural compounds with α-Glc inhibitory activity in the D.sophia flower methanolic extract. According to GC/MS study, there are twenty-one compounds. In next step, molecular docking was performed to bind affinity each of these compounds to the α-Glc enzyme.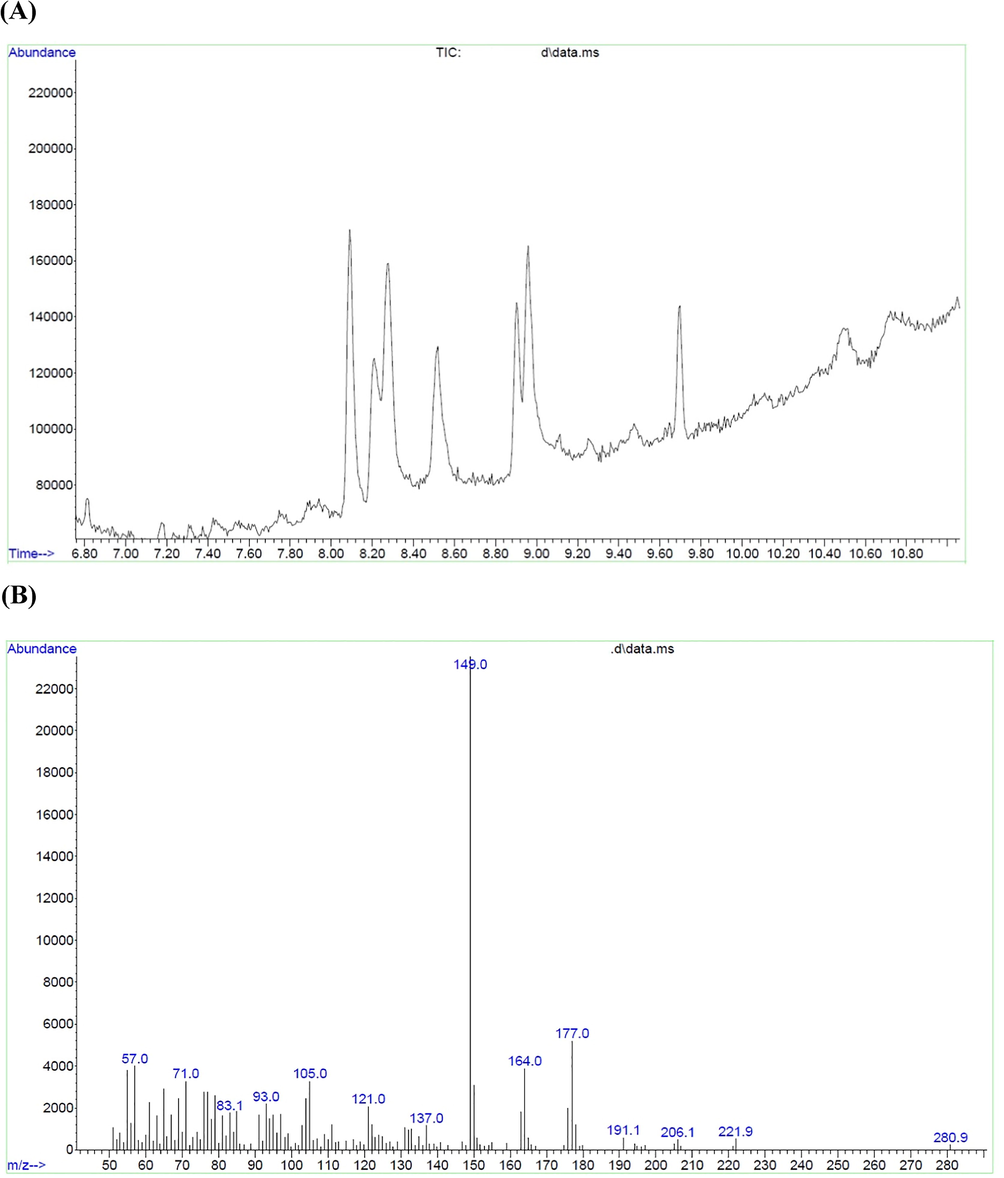
GC/MS of flower extract of D.sophia. (A) Chromatogram of abundance versus RT (min), (B) Chromatogram of abundance versus m/z.
S.No.
RT
Peak area (%)
Compounds
Formula
PubChem CID
Mw (g/mol)
1.
6.82
0.63
Descurainin
C16H18O6
101857593
306.31
2.
7.16
1.78
Desulphosinigrin
C10H17NO6S
9601716
279.31
3.
–
1.73
9-Octadecen-12-ynoic acid, methyl ester
C19H32O2
5363161
292.5
4.
7.88
2.36
5-Bromoadamantan-2-one
C10H13BrO
590905
229.11
5.
–
2.31
1-Methyl-1-hydroxymethyladamantane
C12H20O
590910
180.29
6.
8.00
0.51
Cinnamylaldehyde
C9H8O
637511
132.16
7.
8.20
42.13
Benzylidenemalonaldehyde
C10H8O2
583063
160.17
8.
–
42.17
Ethyl 3-(3-pyridyl) propenoate
C10H11NO2
5371888
177.2
9.
8.33
14.17
Bicyclohexyliden-2-one
C12H18O
13892
178.27
10.
8.50
11.18
Quercetin
C15H10O7
5280343
302.23
11.
–
11.14
8,11,14-Eicosatrienoic acid, (Z,Z,Z)-
C20H34O2
5282826
306.5
12.
–
12.19
Tricyclo[4.3.1.1(3,8)]undecane-3-carboxylic acid
C12H18O2
541957
194.27
13.
8.11
3.45
Isovanillic acid
C8H8O4
12575
168.15
14.
8.17
9.14
Isorhamnetine
C16H12O7
5281654
316.26
15.
8.90
7.66
(E)-Isoeugenol
C10H12O2
853433
164.2
16.
9.11
15.43
Bergapten
C12H8O4
2355
216.19
17.
–
16.05
Phthalic acid, butyl undecyl ester
C23H36O4
6423450
376.5
18.
–
16.88
Phthalic acid, hexyl tetradecyl ester
C28H46O4
6423379
446.7
19.
9.46
6.48
4,7-Octadecadiynoic acid, methyl ester
C19H30O2
569159
290.4
20.
9.69
3.66
Phen-1,4-diol, 2,3-dimethyl-5-trifluoromethyl
C9H9F3O2
590850
206.16
21.
10.5
9.14
Pterin-6-carboxylic acid
C7H5N5O3
135403803
207.15
3.7 Molecular docking studies
The molecular binding approach has been widely used to gain a better understanding of the receptor-ligand interactions (Şöhretoğlu et al., 2018, Li et al., 2022). Moreover, the position of D.sophia flower compounds into the active site of α-Glc was prophesied by this method. In this respect, the lowest docking score between α-Glc with D.sophia flower compounds was selected to carry out MDs in the next stage. The docking score was regarded as the comparison criterion and ACR (Standard drug) was considered as a control compound. The docking score of ACR with α-Glc was −5.23 kcal/mol (Table 4). However, among the twenty-one D.sophia flower compounds, DES showed a better docking score than ACR.
S.No.
Compounds
Binding energy (kcal/mol)
1.
Descurainin
−4.13
2.
Desulphosinigrin
−6.13
3.
9-Octadecen-12-ynoic acid, methyl ester
−3.98
4.
5-Bromoadamantan-2-one
−4.17
5.
1-Methyl-1-hydroxymethyladamantane
−4.33
6.
Cinnamylaldehyde
−5.03
7.
Benzylidenemalonaldehyde
−4.99
8.
Ethyl 3-(3-pyridyl) propenoate
−4.17
9.
Bicyclohexyliden-2-one
−4.13
10.
Quercetin
−5.14
11.
8,11,14-Eicosatrienoic acid, (Z,Z,Z)-
−4.76
12.
Tricyclo[4.3.1.1(3,8)]undecane-3-carboxylic acid
−3.19
13.
Isovanillic acid
−4.97
14.
Isorhamnetine
−5.08
15.
(E)-Isoeugenol
−5.11
16.
Bergapten
−3.78
17.
Phthalic acid, butyl undecyl ester
−4.08
18.
Phthalic acid, hexyl tetradecyl ester
−3.66
19.
4,7-Octadecadiynoic acid, methyl ester
−3.17
20.
Phen-1,4-diol, 2,3-dimethyl-5-trifluoromethyl
−4.19
21.
Pterin-6-carboxylic acid
−3.77
22.
ACR (control)
−5.23
Although no collected work is existing on the docking score of this compound, the docking energy of DES with the α-Glc enzyme is very promising. If the DES retains effective docking energy against human α-Glc similar to this work, there would be a prospect to improve this compound into a new AGI. Many compounds such as quercetin, isorhamnetine, bergapten, etc. have been reported and isolated in the Brassicaceae family for diverse biological actions including the antidiabetic ability (Mahomoodally et al., 2018). Nonetheless, a detailed study on the anti-diabetic ability of isolated compounds from D.sophia is lacking. In this work, the α-Glc inhibition potential of the D.sophia flower was assessed using experimental and computational studies signifying that there are active inhibitors present in the D.sophia flower extract. This work would be a motivation for more comprehensive studies on these identified compounds to expand them as natural AGI.
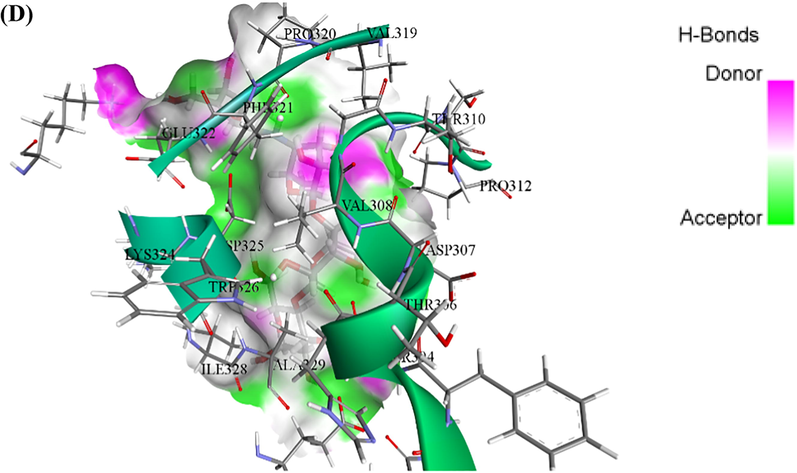
ASP69, ASP215, PHE303, ARG315, HIS351, and ARG442 were found at the active site of the α-Glc enzyme (Ning et al., 2019). The α-Glc-DES docked complex exhibited the minimum docking score (-6.13 kcal/mol). The interaction type of enzyme residues with the ligand can be divided into four groups: van der Waal, Conventional H-bonds, carbon-hydrogen, and pi-alkyl. Among the residues, GLU277, GLN279, HIS351, ASP352, GLN353, HIS351, and ARG442 were observed to interact through a conventional hydrogen bond. VAL109, GLN182, ARG213, ASP215, ARG315, and GLU411 residues formed van der Waals bond. ASP69, TYR158, and PHE303 residues can interact with DES by carbon-hydrogen bond formation. Furthermore, TYR72 and HIS112 formed pi alkyl bonds with DES (Fig. 6A, 6B). in the case of α-Glc-ACR complex, TYR158, GLN182, ARG213, HIS280, ARG315, and ARG442 residues were seen to interact through a conventional hydrogen bond. HIS351 and GLN353 formed carbon-hydrogen bonds and GLU277 and ASP215 can be interacted with ACR by Pi anion bond formation. Fourteen residues involved in the formation of van der Waals bonds can be seen too (Fig. 6C, 6D). It is observed that the conventional hydrogen bond number in the α-Glc-DES is more than α-Glc-ACR complex. Therefore, considering the importance of conventional hydrogen bonds compared to other bonds, it is expected that the α-Glc-DES docking score is better than the α-Glc-ACR complex.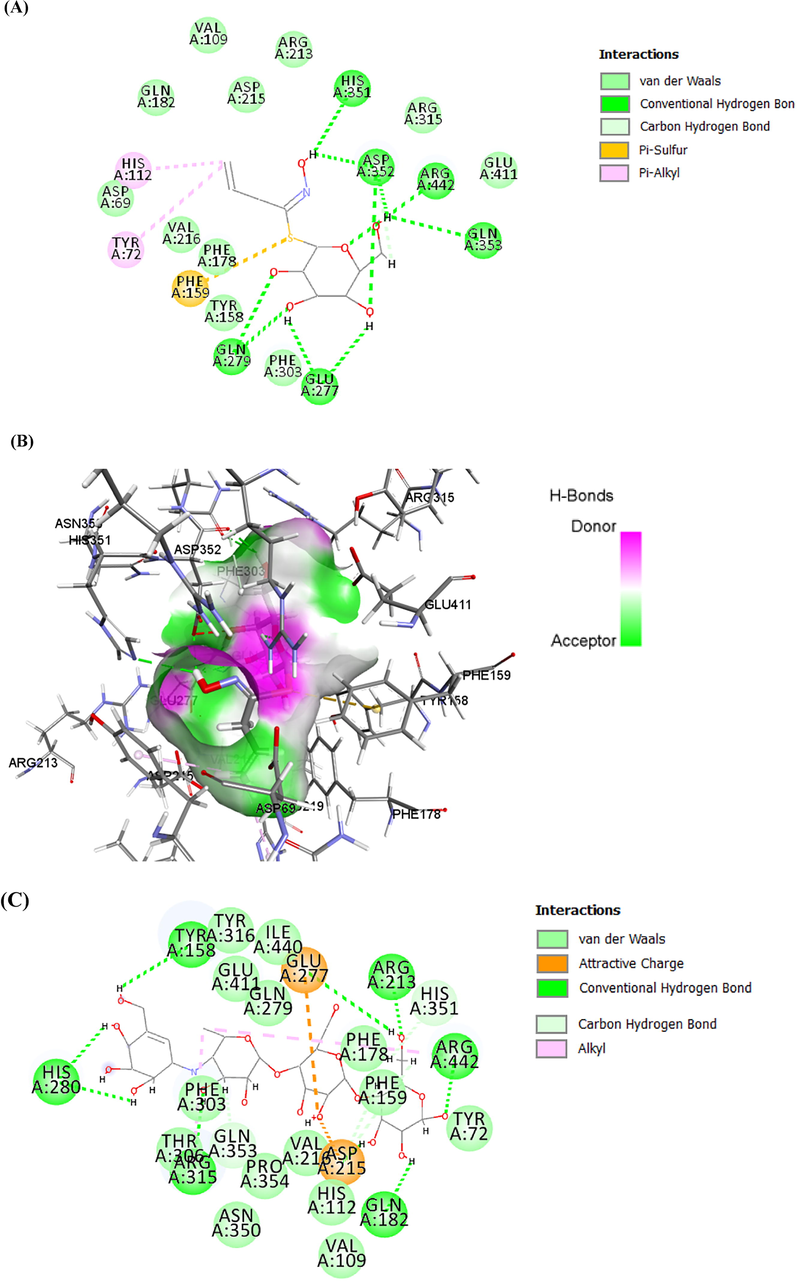
Interaction results. (A, B) 2D and 3D interaction between α-Glc-DES complex, respectively. (C, D) 2D and 3D interaction between α-Glc-ACR complex, respectively.
Interaction results. (A, B) 2D and 3D interaction between α-Glc-DES complex, respectively. (C, D) 2D and 3D interaction between α-Glc-ACR complex, respectively.
3.8 Molecular dynamics simulation analysis
MDs are used to study the binding of a ligand to an enzyme over some time at the atomic level. Several factors, such as RMSD, RMSF, Rg, and hydrogen bonds, give more information about how the enzyme and ligand interact (Sneha and Doss 2016). The RMSD shows a broad view of the stability of a structural complex. Therefore, an RMSD study for α-Glc was performed in the presence of DES, ACR, and free. According to our results, it can be seen that both complexes (α-Glc-DES complex and α-Glc-ACR complex) have maintained their equilibrium concerning the single enzyme and show a slight deviation during 100 ns (Fig. 7A). The RMSD level in α-Glc free, α-Glc-DES complex, and α-Glc-ACR complex fluctuated around the mean values of 0.1719 ± 0.0112, 0.1791 ± 0.0141, and 0.1856 ± 0.0174 respectively, which are almost similar. The lower RMSD level of the α-Glc-DES complex shows more stability than that of the α-Glc-ACR complex.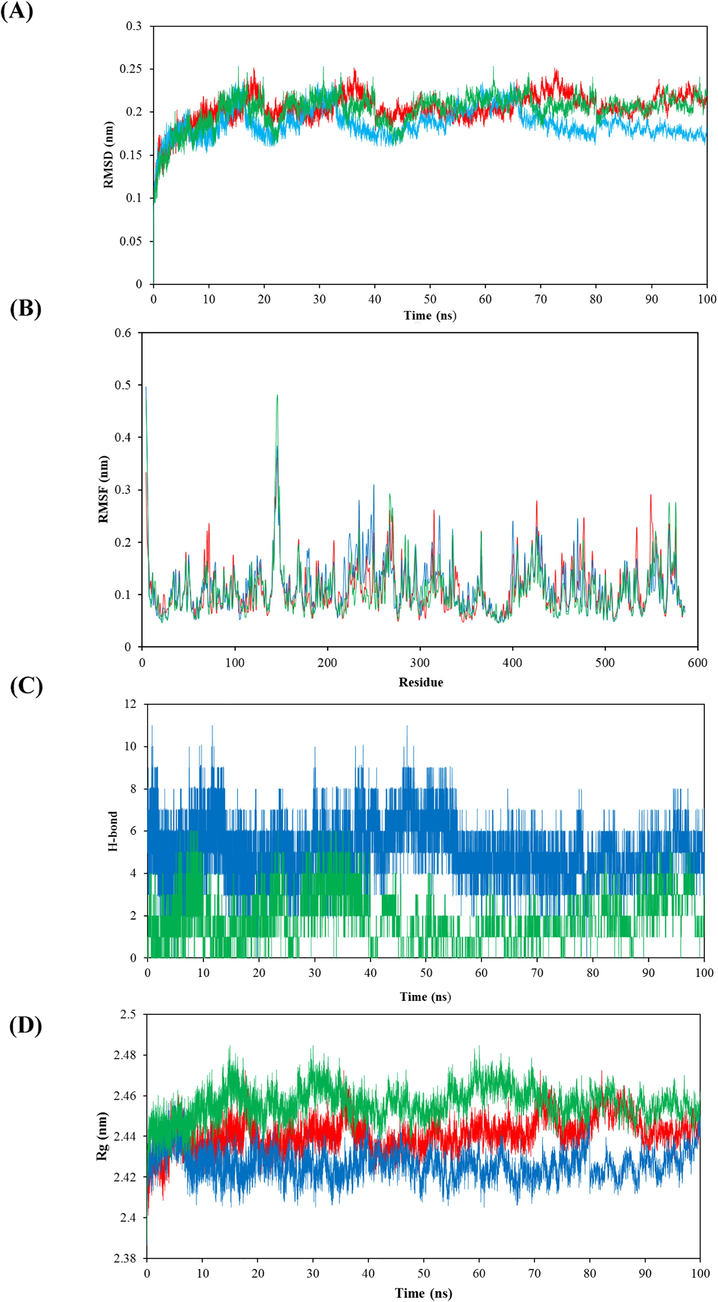
Molecular dynamics simulation results. (A) RMSD values for α-Glc free, α-Glc-DES complex, and α-Glc-ACR complex during 100 ns molecular dynamics simulation. (B) RMSF of residues of α-Glc free, α-Glc-DES complex, and α-Glc-ACR complex all amino acids. (C) The number of hydrogen bonds between α-Glc-DES complex, and α-Glc-ACR complex for 100 ns. (D) Rg values for the α-Glc free, α-Glc-DES complex, and α-Glc-ACR complex during 100 ns MD simulation. The red, blue, and green colors represent α-Glc free, α-Glc-DES complex, and α-Glc-ACR complex, respectively.
RMSF studies the flexibility among the α-Glc in the presence of DES and ACR. Fig. 7B displayed the RMSF level of the α-Glc free, α-Glc-DES complex, and α-Glc-ACR complex. From the RMSF level, it was observed that the α-Glc-DES complex displayed a lesser fluctuation than the α-Glc-ACR complex illustrating the restricted movements during the simulation.
Hydrogen bonds play an important role in the stability of the enzyme structure. Analysis of hydrogen bonds was performed for both complexes (α-Glc-DES complex and α-Glc-ACR complex) and the results are shown in Fig. 7C. Our studies showed that both complexes contained a lot of hydrogen bonds during the simulation period, but the α-Glc-DES complex had a higher number of hydrogen bonds. Therefore, the α-Glc-DES complex is more stable in the structure of the enzyme.
The Rg value indicates the dimensions of the system and the amount of compactness (Sneha and Doss 2016). From the Rg, it can be seen that the protein is compacted or enlarged during the simulation. As shown in Fig. 7D, the value of the Rg level of the α-Glc-ACR complex started at 2.38 and continued up to 2.49, while the α-Glc-DES complex started at 2.38 and continued up to 2.45. Therefore, fewer fluctuations have taken place in the α-Glc-DES complex. It is clear from the figure that the α-Glc-DES complex shows a lower Rg level than the α-Glc-ACR complex, indicating slight structural changes during the simulation period.
3.9 Desulphosinigrin data
DES is a thiohexopyranose compound found naturally in plants such as Hybanthus enneaspermus, Arabidopsis thaliana, Vitis vinifera, Melastoma malabathricum, Euphorbia lathyrus, and Annona reticulate (Andersson et al., 2009, Rout and Kar 2014, Kadhim et al., 2017). Antibacterial, antiasthmatic, and anticancer properties of DES have been reported. It is also known as an inhibitor of Cyclin-dependent kinases and urease enzymes (Nile et al., 2021). However, the inhibition of this compound has not been investigated on the α-Glc enzyme. Due to the better docking score and the optimal parameters of the α-Glc-DES complex simulation, it is expected that by performing in vitro and in vivo tests can be introduced as an anti-diabetic compound. Mass Spectra and data of Desulphosinigrin are given in Fig. 8.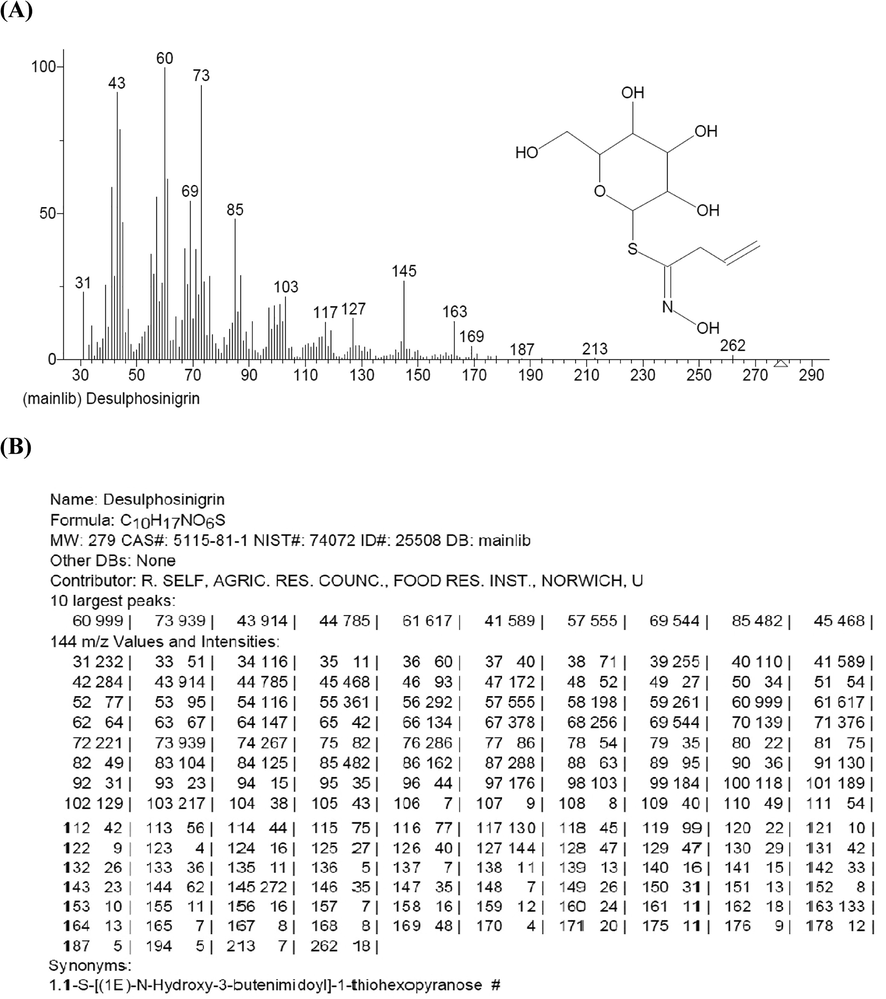
Mass Analysis. (A) Mass Spectra of Desulphosinigrin, (B) Mass data of Desulphosinigrin.
4 Conclusions
Our present work confirmed the phenolic and flavonoid contents, α-Glc inhibitory effect, and antioxidant capacity of methanolic flower extract of D.sophia. The results displayed that flower extract of D.sophia was an effective α-Glc inhibitor with the IC50 was 20.34 ± 0.11 mg/ml, and this inhibiting process was mediated through a mixed inhibition pattern. Moreover, In vivo investigation exhibited that flower extract of D.sophia has a significant effect on decreasing the blood glucose level in diabetic rats. The GC/MS analysis identified twenty-one compounds. Molecular docking of these compounds displayed that the DES compound has a better docking score comparing other compounds. The analysis of MD simulations illustrated that the interaction of DES to α-Glc was even more favorable than ACR. Therefore, in vivo and in vitro studies may be used as the next step to understand its practical application in diabetes management. Furthermore, this study proposed the flower extract of D.sophia might be introduced as a suitable additive in syrups or foods with anti-diabetic capacity.
Acknowledgement
We thank the Research Council of AJA University of Medical Sciences for financial support of this investigation.
Declaration of Competing Interest
The authors declare that there are no conflicts of interest.
References
- Black rice (Oryza sativa L.) processing: Evaluation of physicochemical properties, in vitro starch digestibility, and phenolic functions linked to type 2 diabetes. Food Res. Int.. 2021;141:109898.
- [Google Scholar]
- Target guided isolation, in-vitro antidiabetic, antioxidant activity and molecular docking studies of some flavonoids from Albizzia Lebbeck Benth. bark. BMC Complement. Alternat. Med.. 2014;14:155.
- [Google Scholar]
- Eruca sativa seeds possess antioxidant activity and exert a protective effect on mercuric chloride induced renal toxicity. Food Chem. Toxicol.. 2007;45:910-920.
- [Google Scholar]
- Ethnobotanical investigation of traditional medicinal plants commercialized in the markets of Mashhad, Iran. Avicenna J. Phytomed... 2013;3:254.
- [Google Scholar]
- Myrosinases from root and leaves of Arabidopsis thaliana have different catalytic properties. Phytochemistry. 2009;70:1345-1354.
- [Google Scholar]
- Physician experts in diabetes are natural team leaders for managing diabetic patients with foot complications. A position statement from the Italian diabetic foot study group. Nutrition, Metabol. Cardiovasc. Dis.. 2020;30:167-178.
- [Google Scholar]
- Effect of Opuntia streptacantha Lem. on alpha-glucosidase activity. J. Ethnopharmacol.. 2012;139:493-496.
- [Google Scholar]
- Acetylcholinesterase-Inhibitory Activities of the Extracts from Sponges Collected in Mauritius Waters. Chem. Biodivers.. 2013;10:442-451.
- [Google Scholar]
- Phenolic profiles and screening of potential α-glucosidase inhibitors from Polygonum aviculare L. leaves using ultra-filtration combined with HPLC-ESI-qTOF-MS/MS and molecular docking analysis. Ind. Crops Prod.. 2020;154:112673.
- [Google Scholar]
- Impact of vinification procedure on fruit wine inhibitory activity against α-glucosidase. Food Biosci.. 2018;25:1-7.
- [Google Scholar]
- Fruit wines inhibitory activity against α-glucosidase. Curr. Pharm. Biotechnol.. 2017;18:1264-1272.
- [Google Scholar]
- Estimation of total flavonoid content in propolis by two complementary colorimetric methods. J. Food Drug Anal.. 2002;10
- [Google Scholar]
- Phytochemical analysis, cellular antioxidant and α-glucosidase inhibitory activities of various herb plant organs. Ind. Crops Prod.. 2019;141:111771
- [Google Scholar]
- Effects of Maclura tricuspidata (Carr.) Bur fruits and its phytophenolics on obesity-related enzymes. J. Food Biochem.. 2020;44:e13110
- [Google Scholar]
- Effects of extraction solvents on total phenolic and flavonoid contents and biological activities of extracts from Sudanese medicinal plants. S. Afr. J. Bot.. 2019;120:261-267.
- [Google Scholar]
- Effects of Piriformospora indica and Sebacina vermifera on growth and yield of essential oil in fennel (Foeniculum vulgare) under greenhouse conditions. J. Basic Microbiol.. 2011;51:33-39.
- [Google Scholar]
- Antioxidant activity of selected polyphenolics in yeast cells: The case study of Montenegrin Merlot wine. Molecules. 2018;23:1971.
- [Google Scholar]
- Reactive oxygen species and endothelial function in diabetes. Eur. J. Pharmacol.. 2010;636:8-17.
- [Google Scholar]
- Phenolic content, acute toxicity of Ajuga iva extracts and assessment of their antioxidant and carbohydrate digestive enzyme inhibitory effects. S. Afr. J. Bot.. 2019;125:381-385.
- [Google Scholar]
- Antioxidant and anti-glycation capacities of some medicinal plants and their potential inhibitory against digestive enzymes related to type 2 diabetes mellitus. J. Ethnopharmacol.. 2018;215:140-146.
- [Google Scholar]
- Nutrient distribution, phenolic acid composition, antioxidant and alpha-glucosidase inhibitory potentials of black gram (Vigna mungo L.) and its milled by-products. Food Res. Int.. 2012;46:370-377.
- [Google Scholar]
- GC-MS analysis of bioactive constituents of Hypericum mysorense (Hypericaceae) J. Current Chem. Pharmaceut. Sci.. 2013;3:6-15.
- [Google Scholar]
- Inhibitory effect of phloretin on α-glucosidase: Kinetics, interaction mechanism and molecular docking. Int. J. Biol. Macromol.. 2017;95:520-527.
- [Google Scholar]
- The original Michaelis constant: translation of the 1913 Michaelis-Menten paper. Biochemistry. 2011;50:8264-8269.
- [Google Scholar]
- Determination of bioactive compounds of methanolic extract of vitis vinifera using GC-MS. Int. J. Toxicol. Pharmacol. Res.. 2017;9:113-126.
- [Google Scholar]
- GC-MS studies on Andrographis paniculata (Burm. f.) Wall. Ex Nees—a medicinally important plant. Int J Med Arom Plants.. 2012;2:69-74.
- [Google Scholar]
- The α-amylase and α-glucosidase inhibitory activities of the dichloromethane extracts and constituents of Ferulago bracteata roots. Pharm. Biol.. 2018;56:18-24.
- [Google Scholar]
- Dyeing of silk fabric with natural dye from camphor (Cinnamomum camphora) plant leaf extract. Color. Technol.. 2018;134:266-270.
- [Google Scholar]
- Plasma-induced degradation of quercetin associated with the enhancement of biological activities. J. Agric. Food. Chem.. 2017;65:6929-6935.
- [Google Scholar]
- Laskowski, R., MacArthur, M., Thornton, J. 2006. PROCHECK: validation of protein-structure coordinates.
- Bio-affinity ultra-filtration combined with HPLC-ESI-qTOF-MS/MS for screening potential α-glucosidase inhibitors from Cerasus humilis (Bge.) Sok. leaf-tea and in silico analysis. Food Chem.. 2022;373:131528
- [Google Scholar]
- Dietary flavonoids as xanthine oxidase inhibitors: Structure–affinity and structure–activity relationships. J. Agric. Food. Chem.. 2015;63:7784-7794.
- [Google Scholar]
- Alloxan-induced diabetes, a common model for evaluating the glycemic-control potential of therapeutic compounds and plants extracts in experimental studies. Medicina.. 2017;53:365-374.
- [Google Scholar]
- Phytochemical profile and antioxidant properties of two Brassicaceae species: Cardaria draba subsp. draba and Descurainia sophia. Biocatal. Agric. Biotechnol.. 2018;16:453-458.
- [Google Scholar]
- Structure and dynamics of the TIP3P, SPC, and SPC/E water models at 298 K. J. Phys. Chem. A.. 2001;105:9954-9960.
- [Google Scholar]
- Total phenolic, flavonoid and tannin contents and antioxidant and antimicrobial activities of organic extracts of shoots of the plant Limonium delicatulum. J. Taibah Un. Sci.. 2014;8:216-224.
- [Google Scholar]
- The effect of consumption of Sisymbrium-seeds at the end of pregnancy on the rate of cesarean delivery and apgar score. Iranian J. Obstet., Gynecol. Infertil.. 2012;15:8-13.
- [Google Scholar]
- Inhibitory mechanism of vitexin on α-glucosidase and its synergy with acarbose. Food Hydrocolloids 2020:105824.
- [Google Scholar]
- Inhibitory effect of corosolic acid on α-glucosidase: kinetics, interaction mechanism, and molecular simulation. J. Sci. Food Agric.. 2019;99:5881-5889.
- [Google Scholar]
- Spiraeoside extracted from red onion skin ameliorates apoptosis and exerts potent antitumor, antioxidant and enzyme inhibitory effects. Food Chem. Toxicol.. 2021;154:112327.
- [Google Scholar]
- Identification of α-glucosidase inhibitors from cyclocarya paliurus tea leaves using UF-UPLC-Q/TOF-MS/MS and molecular docking. Food Funct.. 2019;10:1893-1902.
- [Google Scholar]
- GC-MS-and NMR-Based Metabolomics and Molecular Docking Reveal the Potential Alpha-Glucosidase Inhibitors from Psychotria malayana Jack Leaves. Pharmaceuticals.. 2021;14:978.
- [Google Scholar]
- Seasonal variation for the antidiabetic activity of Loranthus micranthus methanol extract. Asian Pacific J. Tropical Med.. 2010;3:196-199.
- [Google Scholar]
- Pasalar, M., Bagheri Lankarani, K., Mehrabani, D., et al., 2013. The effect of Descureania Sophia L. and Prunus Domestica L. in prevention of constipation among Iranian Hajj Pilgrims, Saudi Arabia.
- The use of the o-nitrophenyl group as a protecting/activating group for 2-acetamido-2-deoxyglucose. Carbohydr. Res.. 2003;338:455-458.
- [Google Scholar]
- Antioxidant and free radical-scavenging activities of seeds and agri-wastes of some varieties of soybean (Glycine max) Food Chem.. 2007;104:783-790.
- [Google Scholar]
- Identification of α-glucosidase inhibitors from Ipomoea alba by affinity-directed fractionation-mass spectrometry. Revista Brasileira de Farmacognosia.. 2020;30:336-345.
- [Google Scholar]
- Identification of chemical compounds present in different fractions of Annona reticulata L. leaf by using GC–MS. Nat. Prod. Res.. 2014;28:1786-1788.
- [Google Scholar]
- Ethnopharmacological studies of indigenous medicinal plants in the south of Kerman, Iran. J. Ethnopharmacol.. 2017;199:194-204.
- [Google Scholar]
- Molecular docking studies of some flavone analogues as α-Glucosidase inhibitors. J. Medicinal Plants.. 2020;19:55-64.
- [Google Scholar]
- Phenolic profile, enzyme inhibitory and antioxidant activities of two endemic Nepeta species: Nepeta nuda subsp. glandulifera and N. cadmea. S. Afr. J. Bot.. 2019;120:298-301.
- [Google Scholar]
- Structural Elucidation of Trace Components Combining GC/MS, GC/IR, DFT-Calculation and Synthesis—Salinilactones, Unprecedented Bicyclic Lactones from Salinispora Bacteria. Angew. Chem. Int. Ed.. 2018;57:14921-14925.
- [Google Scholar]
- Food Phenolics. Technomic Pub. Co; 1995.
- Antioxidant constituents in the dayflower (Commelina communis L.) and their α-glucosidase-inhibitory activity. J. Nat. Med.. 2008;62:349-353.
- [Google Scholar]
- Inhibitory effect of aqueous extract from the gall of Rhus chinensis on alpha-glucosidase activity and postprandial blood glucose. J. Ethnopharmacol.. 2003;85:283-287.
- [Google Scholar]
- Molecular dynamics: new frontier in personalized medicine. Adv. Protein Chem. Struct. Biol.. 2016;102:181-224.
- [Google Scholar]
- Discovery of potent α-glucosidase inhibitor flavonols: Insights into mechanism of action through inhibition kinetics and docking simulations. Bioorg. Chem.. 2018;79:257-264.
- [Google Scholar]
- Anticholinergic and antidiabetic effects of isoeugenol from clove (Eugenia caryophylata) oil. Int. J. Food Prop.. 2019;22:583-592.
- [Google Scholar]
- Inhibitory effect of raspberry ketone on α-glucosidase: Docking simulation integrating inhibition kinetics. Int. J. Biol. Macromol.. 2018;113:212-218.
- [Google Scholar]
- Synthesis and biological evaluation of coumarin derivatives as α-glucosidase inhibitors. Eur. J. Med. Chem.. 2020;189:112013
- [Google Scholar]
- Classification of difference between inhibition constants of an inhibitor to facilitate identifying the inhibition type. J. Enzyme Inhib. Med. Chem.. 2013;28:205-213.
- [Google Scholar]
- Antioxidant activity of various tea extracts in relation to their antimutagenicity. J. Agric. Food. Chem.. 1995;43:27-32.
- [Google Scholar]
- Searching for Alpha-Glucosidase Inhibitory Activity in Hexane Extracts by some Plants from Kurdistan Province. Int. J. Adv. Biol. Biomed. Res.. 2015;3:291-296.
- [Google Scholar]
- Types of headache and those remedies in traditional persian medicine. Pharmacogn. Rev.. 2013;7:17.
- [Google Scholar]


