

Translate this page into:
Glycerol acetylation over yttrium oxide (Y2O3) catalyst supported on palm kernel shell-derived carbon and parameters optimization studies using response surface methodology (RSM)
⁎Corresponding author at: Department of Chemistry, Faculty of Science, Universiti Putra Malaysia, 43400 UPM Serdang, Selangor, Malaysia.
-
Received: ,
Accepted: ,
This article was originally published by Elsevier and was migrated to Scientific Scholar after the change of Publisher.
Peer review under responsibility of King Saud University.
Abstract
A biomass derived carbon supported yttrium oxide catalyst (Y2O3/PKS-T700) was synthesized and evaluated in glycerol acetylation reaction using four-factor, two-level face-centred central composite design (24 CCD) of the response surface methodology (RSM). The catalyst exhibited high glycerol conversion (GC) (99.8%) and product selectivity of 11.1%, 60.2%, and 29.6% monoacetin (MA), diacetin (DA) and triacetin (TA) under optimized conditions of temperature 130 ℃, glycerol-to-acetic acid molar ratio 1:12 and catalyst loading 0.5 g in 5 h reaction time. The catalyst was synthesized via carbonization of palm kernel shell (PKS), impregnated with 15 wt% yttrium oxide (Y2O3) and calcined appropriately. The synthesized catalyst was further characterized by N2 physisorption analysis (BET surface area), X-ray diffraction (XRD), thermogravimetric analysis (TGA), scanning electron microscopy coupled with energy dispersive X-ray spectroscopy (SEM-EDX), Fourier transform infra-red (FTIR), and temperature programmed desorption-ammonia (TPD-NH3). Results revealed that the catalyst is more of mesoporous material with large surface area, good pore volume and average size distributions. It is thermally stable with good acidity and various functional groups. On subjecting the catalyst to a reusability test in three (3) reaction cycles under the optimal conditions, it was found to maintain good acetylation reaction with little degradation.
Keywords
Heterogeneous catalyst
Acetylation
Glycerol
Palm kernel shell
Yttrium oxide

1 Introduction
Acetylation reaction involving glycerol with acetic acid results in monoacetin (MA), diacetin (DA), and triacetin (TA) as the main products. These are esters with excellent industrial usage. MA and DA are utilized as effective constituents in polyesters, cryogenics, cosmetics, leather, and food processing. TA is employed anti-microbial agent and as additives to improve the anti-knocking property of gasoline and viscosity and cold flow properties of biofuel. (Abida and Ali, 2022, Setyaningsih et al., 2018, Tao et al., 2015). The production of these industrial chemicals requires the deployment of heterogeneous catalysts in view of their thermal stability, ease of separation, recyclability, non-corrosive, versatile, and adaptable to a wide range of uses (Reinoso and Boldrini, 2020, Waclawek et al., 2018).
The use of metal and or metal oxide supported heterogenous catalyst in glycerol acetylation have been reported with different findings. Metal oxides including Bi2O3, Sb2O3, SnO2, TiO2, Nb2O5 and Sb2O5 were studied as catalysts in glycerol acetylation (Hu et al., 2015). Under optimized conditions, Sb2O5 yielded 96.8% glycerol conversion with selectivity of 33.2, 54.2 and 12.6% MA, DA, and TA, respectively. The catalytic performance was attributed to the Bronsted acid sites of the catalyst. Reddy et al. (2012) experimented acetylation reaction with glycerol and acetic acid using CeO2–ZrO2, CeO2– Al2O3, SO42-/CeO2–ZrO2, and SO42-/CeO2–Al2O3 solid acid catalysts at 120 ℃, 1 h reaction time, 1:6 M ratio of glycerol to acetic acid and catalyst weight of 5 wt%, respectively. The SO42-/CeO2–ZrO2 showed superior performance at approximately 100% glycerol conversion, 25.8%, 57.7% and 16.5% MA, DA and TA selectivity and was attributed to improved acidity as a result of the sulfonation. However, amongst the unsulfonated groups, the CeO2–ZrO2 catalyst was better with low performance of 68.1% glycerol conversion, 75.2, 22.7 and 2.1% MA, DA and TA selectivity. Khayoon et al. (2014) utilized series of yttrium (1–3.5%) containing silica material SBA-3 (Y/SBA-3) as catalysts for the acetylation of glycerol at temperature of 100 ℃, reaction time of 2.5 h, mole ratio of glycerol to acetic acid at 1:4, and catalysts load of 0.05 g. The 3%Y/SBA-3 catalyst exhibited the best catalytic activity with 100% glycerol conversion and selectivity of 11, 34 and 55% of MA, DA and TA, respectively. Kulkarni et al. (2020) reported that the use of cerium/zirconium mixed metal oxide catalyst (CeO2-ZrO2) is not very effective in acetylation of glycerol with acetic acid as only 58% conversion of glycerol was reported with selectivity towards MA, DA and TA at 86, 14 and 0.5%, respectively, at 100 ℃ reaction temperature, catalyst loading of 5 wt%, glycerol to acetic acid molar ratio of 1:10 in 3 h reaction time. A good improvement was only noticed when the combined catalyst of the metal oxide (CeO2-ZrO2) was sulfonated. The glycerol conversion improved to 99.1% with selectivity of 21.5, 57.3 and 21.3% MA, DA and TA, respectively. In another recent study, a magnetic catalyst (Fe3O4@SiO2@SO42-) was prepared and deployed in glycerol acetylation with acetic acid (Abida et al., 2020). 100% selectivity towards triacetin was achieved within 45 min at 80 ℃. The catalyst was also found to be effective in a six consecutive reaction cycles with 90% glycerol conversion and 50% triacetin selectivity. However, the catalyst preparation process is tedious and involve several stages. The use of sulfated alumina catalyst was reported by Arun et al. (2016). The authors further develop empirical models using response surface methodology (RSM) to boost the acetylation of glycerol experimental parameters. The numerical optimization resulted in 76.1% combined selectivity of DA and TA with 99.1% conversion of glycerol at enhanced reaction temperature of 108.8 °C, catalyst load of 0.36 g, glycerol to acetic acid mole ratio of 1:12 and reaction time of 5 h over 2 M SO42−/γ-Al2O3 catalyst. Similarly, Zhou et al. (2013) also developed an empirical process model using RSM for the optimization of glycerol acetylation reaction with acetic acid over Amberlyst-15 catalyst. Of all the parameters studied, the acetic-acid/glycerol molar ratio and temperature had positive effects on the reaction. At the optimal conditions (110 ℃, acetic acid to glycerol molar ratio of 1:9, catalyst load of 2.65 g and time of reaction at 4.5 h), the glycerol conversion and corresponding selectivity towards MA, DA, TA and DA + TA predicted by the nonlinear models (98.47%, 8.65%, 46.56%, 44.79% and 91.35%) were all valid and in consonance with the values of experiments.
Findings from the above catalytic studies showed that there is the need to deploy more metal oxide catalysts and to also employ Design of Experiment (DOE) in the optimization of the process variables to improve glycerol acetylation to especially DA and TA due to their application as bio-additive to improve anti-knocking property of gasoline and cold flow properties of biofuel as earlier indicated. The new catalyst to be deployed should be cheap, sustainable and provide versatility in reactions with robust active sites. For the first time a study is explored on the use of yttrium oxide supported on carbon derived from palm kernel shell (PKS) as functionalized catalyst for glycerol acetylation with acetic acid. The PKS and glycerol are abundantly available in Malaysia and are usually released into the environment leading to physical contamination. Therefore, low-cost valorization of these materials will lead to friendly environment. Furthermore, RSM was utilized to optimize the reaction conditions in order to have to improve selectivity of DA and TA, respectively.
2 Experimental
2.1 Chemicals and materials
The palm kernel shells (PKS) was obtained from a cottage industry in Serdang, Selangor state, Malaysia. Chemicals were obtained from R&M Chemicals Limited, Malaysia. The chemicals include acetone (99.5%), ethanol (99.7%), hydrochloric acid (37%), ortho-phosphoric acid (85%), sodium chloride (99.9%), sodium hydroxide (99%), sodium silicate (chemically pure), glacial acetic acid (99.8 %) and anhydrous glycerol (99.8%).
2.2 Catalyst synthesis and glycerol acetylation activity
2.2.1 Catalyst synthesis
The PKS was cleaned by washing with warm water and liquid detergent to remove oil and other impurities. The washed PKS was dried overnight in oven at 100 ℃, later pulverized, sieved to obtain a 250 µm sized powdered PKS and was stored in a dry plastic vessel. The carbonization of the PKS was done using the template method as reported by Nda-Umar et al. (2021) with little modification. A silica template agent was made in-situ by mixing Na2SiO3 and H2O at 80 ℃. 200 g of the powdered PKS and 300 mL of 1 M HCl were mixed and added to the templating agent with stirring to form a dense solid mass. It was kept in oven at 50 ℃ for two days to age. Thereafter, 40 g of the formed substance was carbonized at 700 ℃ in a tubular furnace under nitrogen atmosphere. The carbonized solid was stirred with 2 M NaOH solution for three hours at 100 ℃ and later washed with hot water to filter out the templating agent. The resultant product was dried in the oven at 120 ℃ for 24 h and later labelled PKS-T700. PKS denotes palm kernel shell, T denotes the template-carbonization method and the 700 is the carbonization temperature. The carbonized PKS (PKS-T700) was impregnated with 15 wt% Y2O3 to form carbon supported yttrium oxide catalyst. Typically, 7.62 g of Y2O3 was dissolve in 10 mL of deionized water to form solution A. Solution B was formed by dissolving 20 g of PKS-T700 in 20 mL ethanol. Solution A was added to solution B. The resultant mixture was mixed and dried in oven at 105 ℃ for 12 h and subsequently calcined at 700 ℃ for 4 h under nitrogen atmosphere in a tubular furnace in accordance with various literature reports with little modifications (Shen et al., 2003; Khayoon and Hameed, 2013; Abdullah et al., 2020). The dried carbon-based solid catalyst, was further pulverized, sieved, and stored in an airtight bottle, and labelled as Y2O3/PKS-T700.
2.2.2 Catalyst characterization
The X-ray diffraction (XRD) analysis of the catalyst was recorded using Shimadzu, model-XRD6000 powder X-ray diffractometer with Cu Kα radiation (λ = 1.54 Å) at a scanning speed of 4° min−1 and 2θ scan range of 10 − 80° at 30 kV and 30 mA. The functional groups on the catalyst were identified by attenuated total reflectance mode of Fourier transform infrared (FTIR) spectrometer Shimadzu, IRTracer-100 over a scanning range of 400 – 4000 cm−1. The textural properties (BET surface areas, pore volume, and average pore distribution) of the catalyst were obtained through the N2 physisorption measurement at (77 K) using micrometric analyzer (Tristar II Plus) after pre-treatment at 150℃ for 7 h. The surface morphology and the elemental analysis were recorded using scanning emission microscopy coupled with energy dispersive X-ray (SEM-EDX) spectrometer (JEOL, JSM-6400) after drying and coating the material with gold, while the thermal analysis (thermogravimetric analysis (TGA) and derivative thermogravimetric analysis (DTA)) were carried out with Mettler (Toledo 851e model) within the temperature range of 50 to 1000 °C at the heating rate of 10 °C min−1 under N2 flow at 50 mL/min.
2.2.3 Glycerol acetylation to produce acetin
The synthesized catalyst (Y2O3/PKS-T700) was utilized in acetylation of glycerol with acetic acid in a batch reaction under atmospheric pressure as reported in literature (Monteiro et al., 2018; Spataru et al., 2021; Nda-Umar et al., 2021). In a typical set up, 5 g of glycerol (G) and 18.6 mL of acetic acid (AA) (molar ratio 1:6) were placed in a round bottom flask, and 0.5 g of the catalyst was added. Before application, the catalyst was dried in oven for 1 h at 120 ℃. The flask was fitted with reflux condenser and magnetic stirrer and heated in oil bath up to 100 ℃ with stirring at 450 rpm for 5 h. At the end of the reaction, the liquid product was centrifuged for 10 min at 3000 rpm and later filtered.
2.2.4 Analysis of produced acetin
The components of the acetin products (MA, DA, and TA) were identified using a gas chromatograph coupled with a mass spectrometer (GC–MS) (Shimadzu QP2010 Plus, ZB5ms 30 m × 0.25 mm × 0.25 µm column), while a gas chromatography with flame ionization detector (GC-FID) (Agilent 7890A, FID, DB-Wax 30 m × 0.25 mm ID × 0.25 µm) was used to analyse the product distribution using 1,4-butanediol as the internal standard and acetonitrile as the solvent. The column of the GC-FID was initially set at 80 ℃ for 3 min followed by ramping at 10 ℃ min−1 to 260 ℃ and later injected with 1 µL of the final sample. The detector and the injection temperatures were fixed at 310 ℃ and 280 ℃, respectively, while helium was used as the mobile phase at a flow rate of 1.3 mL min−1. Each sample analysis was for 24 min and the glycerol conversion (GC) and product selectivity (MA, DA, and TA) were determined using Eqs. (1) and (2) (Nda-Umar et al., 2021).
2.3 Numerical analysis and optimization by response surface method (RSM)
Purpose of RSM is to perform several experiments to determine the direction towards optimum parameters that provides the best experimental yields (Shahbaz et al., 2016). The procedure involves the repetition of experiments to construct a mathematical model that suites conditions for experimental validation (Nda-Umar et al., 2021).
2.3.1 Design of experiment (DOE)
The design-expert version 11.0.5.0 (Stat-Ease Inc.) software was used for the optimization task. The four-factor, two-level face-centred central composite design (24 CCD) was employed for the analysis of factor interactions and effects to yield high-level glycerol conversion and selectivity of the products MA, DA and T. The independent factors considered were four (4) variables, namely temperature (X1), catalyst loading (X2), time (X3), and the molar ratio of glycerol/acetic acid (X4). The experiments were conducted randomly, as generated by the software, to significantly reduce inaccuracies that could arise from variable trends (Somidi et al., 2016). The complete experimental design of the experiment in terms of actual independent variables and the experimental results are presented in section 3.
2.4 Catalyst’s reusability test
The catalyst’s reusability was tested in three reaction cycles under optimal conditions. After each typical acetylation reaction of glycerol, the catalyst was reclaimed by centrifuge at 3000 rpm and filtered. The reclaimed catalyst was washed with 70 mL water and afterward with 30 mL acetone to remove impurities. The resultant catalyst was dried at 150 ℃ for 1 h and recycled in another glycerol acetylation experiment without further pre-treatment. The catalysts were recycled for another two rounds after the first round.
2.5 Characterization of the catalyst
The precursor material (PKS) and synthesized catalysts were characterized for their textural properties (BET surface area, pore volume, and pore size) after degassing at 120 °C for 8 h using Micrometrics analyzer (TriStar II Plus model). The functional groups were determined using the attenuated total reflectance (ATR) mode Fourier transform infrared spectrometer (Perkin Elmer, 1650 Spectrometer) within the scanned range of 400–4000 cm−1, while the catalysts morphologies were examined by scanning electron microscopy (SEM) integrated with EDX spectroscopy (JEOL, JSM-6400) after drying and gold coated. The EDX component was applied to analyse the carbon, oxygen and yttrium contents.
3 Results and discussion
3.1 Modelling and optimization of glycerol acetylation reaction
Table 1, provides the details of the experimental design matrix and their corresponding responses obtained. GC = Glycerol conversion, MA = Monoacetin, DA = Diacetin, TA = Triacetin.
S/N.
Temperature
Catalyst loading
Time
Molar ratio
GC
MA
DA
TA
(℃)
(g)
(Hour)
(%)
(%)
(%)
(%)
1
130
0.5
5
12
99.76
11.02
58.08
29.04
2
140
0.1
3
4
99.29
16.33
66.31
16.47
3
115
0.65
5.5
8
98.84
24.03
59.56
15.59
4
115
0.54
5.5
9
99.23
35.79
49.27
13.86
5
140
1.2
3
4
99.31
36.41
52.51
10.97
6
115
0.65
6
9
98.63
28.59
56.12
14.49
7
90
1.2
3
4
98.25
47.66
44.36
3.90
8
90
1.2
3
15
96.91
41.57
45.76
7.28
9
140
1.2
8
15
97.58
17.95
53.70
26.01
10
90
0.1
8
15
95.84
47.57
49.01
3.17
11
90
1.2
8
4
97.15
54.34
40.48
3.46
12
140
0.1
3
15
99.49
16.02
57.42
25.36
13
140
0.1
8
4
98.23
21.07
58.25
20.16
14
115
0.65
5
9
99.01
27.63
56.65
14.78
15
90
0.1
3
15
94.35
45.09
44.36
5.79
16
140
1.2
3
15
98.79
19.66
55.85
22.63
17
90
1.2
8
15
99.57
40.15
49.07
10.21
18
90
0.1
3
4
99.05
29.19
55.11
14.42
19
115
0.65
5.5
10
98.86
27.29
56.57
15.04
20
120
0.65
5.5
9
99.47
25.53
57.34
16.53
21
110
0.65
5.5
9
99.05
29.49
55.67
13.91
22
115
0.76
5.5
9
99.14
37.89
47.82
12.87
23
140
0.1
8
15
97.11
18.21
56.62
23.18
24
90
0.1
8
4
96.78
39.77
52.58
8.42
Each response of GC, MA, DA, and TA were evaluated using analysis of variance (ANOVA), regression model, and model fitness. Furthermore, ANOVA confirms the significance of statistical quadratic model terms based on the probability value (p-value) and the Fisher F-test (F-value). The p-value < 0.05 is considered significant (Nda-Umar et al., 2021). The regression models are obtained from multiple regression analysis, and the final equation was taken based on the significant factors (individual and interactive). Coefficient of determination (R2) and fitness of model were the yardstick applied to determine the convergence of predicted and experimental values (Han et al., 2019).
3.1.1 Analysis of variance (ANOVA), regression model and optimization for glycerol conversion (GC).
The ANOVA report for the significance of the GC quadratic model is computed on Table 2.
Sum of
Mean
F
p-value
Source
Squares
df
Square
Value
Model
41.64
14
2.97
135.92
< 0.0001
significant
X1-Temperature
6.02
1
6.02
275.07
< 0.0001
X2-Catalyst Load
0.2019
1
0.2019
9.23
0.0141
X3-Time
7.06
1
7.06
322.64
< 0.0001
X4-Mole Ratio
2.91
1
2.91
132.93
< 0.0001
X1X2
8.22
1
8.22
375.48
< 0.0001
X1X3
8.75
1
8.75
399.81
< 0.0001
X1X4
0.0813
1
0.0813
3.71
0.0860
X2X3
1.00
1
1.00
45.81
< 0.0001
X2X4
8.70
1
8.70
397.82
< 0.0001
X3X4
8.23
1
8.23
376.18
< 0.0001
4.95
1
4.95
226.04
< 0.0001
0.0080
1
0.0080
0.3640
0.5612
0.0000
1
0.0000
0.0005
0.9822
0.9872
1
0.9872
45.12
< 0.0001
Residual
0.1969
9
0.0219
Cor Total
41.83
23
Std. Dev.
0.1479
R2
0.9953
Mean
98.32
Adjusted R2
0.9880
C.V. %
0.1504
Predicted R2
0.8595
Adeq. Precision
46.7582
Table 2 indicates that the overall quadratic model for GC is significant as buttressed by the p-value < 0.0500. In the case of model terms, the linear terms X1 (temperature), X2 (catalyst loading), X3 (time), X4 (molar ratio), interactive terms, X1X2, X1X3, X2X3, X2X4, X3X4, and quadratic terms, , are significant with p-value < 0.0500 thereby forming the GC quadratic model. Values with<95% level of confidence indicate the model terms are not significant and do not add meaningfully to the overall reaction towards GC (Nda-Umar et al., 2021).
The experimental data were applied to obtain the coefficient of the polynomial equation for the GC quadratic model. The full model equation for the GC, without the significant terms, is provided in Eq. (3);
Amongst the linear terms (individual factors), time (X3) is the most significant factor for GC with F-value of 322.64 followed by temperature (X1) with F-value of 275.07, while in the interactive factors, the interaction of temperature and time (X1X3) produced the most significant effect for GC with F-value of 399.81 with the catalyst loading and molar ratio (X2X4) interaction next. Whereas amongst the interactive factors, the interaction of temperature and glycerol/acetic acid (G/AA) mole ratio (X1X4) produced the weakest effect with F-value of 3.71 indicating a weak synergistic effect on the overall conversion of glycerol. The fitness of the GC obtained from the quadratic model indicate coefficient of determination with an R2 of 0.9953 which shows that the model is fit, thus it accounts for the obtained response of 99.8% for GC. The predicted R2 of 0.8595 is in agreement with adjusted R2 value of 0.9880 (difference is < 0.2), while the adequate precision is greater than 4 which is statistically desirable. The ratio of 46.7582 means the signal to noise ratio is adequate to navigate the design space (Aghbashlo et al., 2018; Rastegari and Ghaziaskar, 2015).
Furthermore, the three-dimensions (3D) plot of RSM (Fig. 1) shows an interactive response towards favourable glycerol conversion (GC) at 99.8%.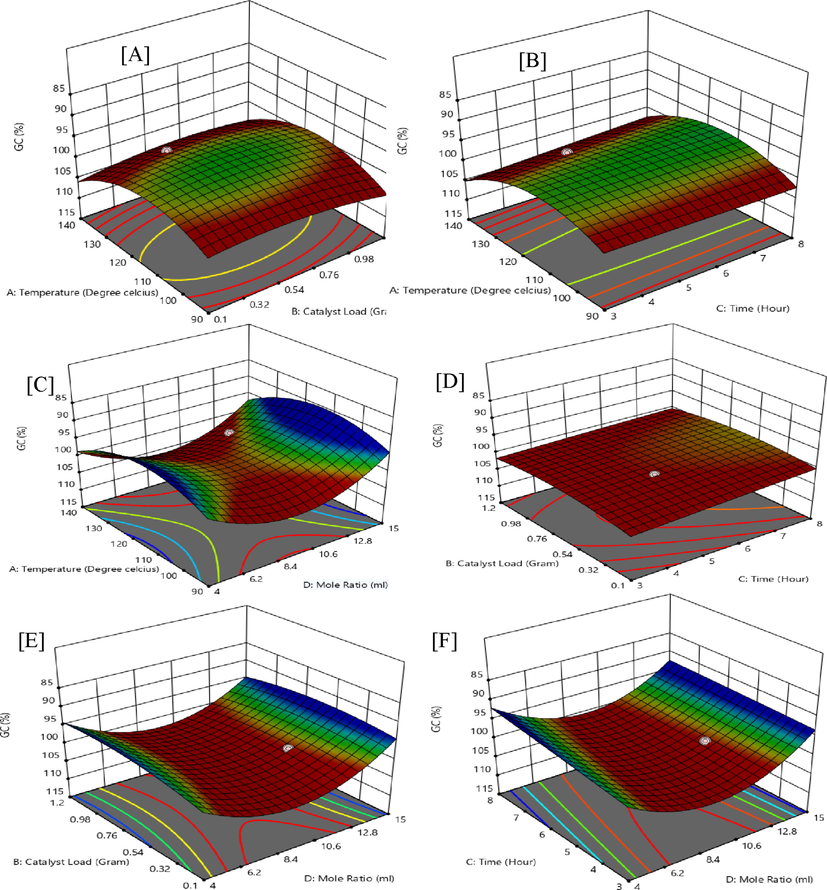
Interactive experimental factors for 3D surface plots of glycerol conversion (GC).
Fig. 1 (A) shows that the interactive response of temperature (X1) at 130 ℃ and catalyst-loading (X2) at 0.5 g is statistically significant with an F-value of 375.48 and an effectual p-value below 0.0001. Fig. 1 (B) indicate the highest influence at temperature (X1) at 130 ℃ and time (X3) of 5 h leading to favourable quadratic outcome on GC with p-value below 0.001 and an F-value of 399.81. Temperature (X1) parameter at 130 ℃ and G/AA molar ratio (X4) of 12 has a weak outcome on GC with F-value of 3.71 and a p-value greater than 0.0001 with coefficient of 0.0821 in the 2nd order polynomial equation which is shown in Fig. 1 (C). Furthermore, Fig. 1 (D) shows a rather slow interaction between catalyst-loading (X2) and time (X3) on the response of GC, with F-value of 45.81. The catalyst loading (X2) and G/AA molar ratio (X4) interactive effect proves to be highly effective with a p-value below 0.001 and an F-value of 397.82 as shown in the 3D plot of Fig. 1 (E). The interactive effects of time (X3) and G/AA molar ratio (X4) (Fig. 1 (F)) at a lower level have proven to be influential in the acetylation of glycerol in the study.
3.1.2 Analysis of variance (ANOVA), regression model and optimization for monoacetin (MA) selectivity.
The ANOVA provided in Table 3 shows RSM model for MA selectivity. The model is significant at 95% confidence level with a p-value < 0.05. All linear terms such as temperature (X1), catalyst-loading (X2), time (X3), and G/AA molar ratio (X4) are significant with levels of confidence all above 95% (p-values < 0.05). Similarly, all the interaction and quadratic terms are significant except the temperature and time (X1X3) interaction and temperature terms which insignificant to the quadratic model. MA regression model in terms of coded factors is a function of all parameters except the insignificant terms as indicated in Eq. (4).
Sum of
Mean
F
p-value
Source
Squares
df
Square
Value
Model
3170.05
14
226.43
218.42
< 0.0001
Significant
X1-Temperature
1275.81
1
1275.81
1230.68
< 0.0001
X2-Catalyst Load
240.06
1
240.06
231.56
< 0.0001
X3-Time
58.60
1
58.60
56.53
< 0.0001
X4-Mole Ratio
60.31
1
60.31
58.18
< 0.0001
X1X2
38.92
1
38.92
37.54
0.0002
X1X3
0.0086
1
0.0086
0.0083
0.9293
X1X4
83.28
1
83.28
80.34
< 0.0001
X2X3
13.04
1
13.04
12.58
0.0062
X2X4
340.79
1
340.79
328.73
< 0.0001
X3X4
48.77
1
48.77
47.04
< 0.0001
3.80
1
3.80
3.67
0.0878
121.45
1
121.45
117.15
< 0.0001
36.65
1
36.65
35.35
0.0002
160.65
1
160.65
154.97
< 0.0001
Residual
9.33
9
1.04
Cor Total
3179.38
23
Std. Dev.
1.02
R2
0.9971
Mean
30.76
Adjusted R2
0.9925
C.V. %
3.31
Predicted R2
0.8630
Adeq Precision
53.0490
The temperature (X1) and catalyst-loading (X2) linear terms are significant to the selectivity of MA with F-values of 1230.68 and 231.56, respectively. Catalyst-loading and G/AA mole ratio (X2X4) interaction produced a good interactive effect on the selectivity of MA with an F-value of 328.73. However, the interaction of temperature and time (X1X3) produced the least effect with an F-value of 0.0083 indicating the weakest antagonistic interaction on the selectivity of MA.
The ANOVA report for MA selectivity with an R2 0.9971 indicates that the fitted model is significant for MA selectivity. Similarly, the predicted R2 of 0.8630 is in consonance with adjusted R2 of 0.9925 and the adequate precision of 53.0490 confirms the signal to noise ratio adequacy and is able to navigate the model design space. The RSM values provide an R2 value of 0.9971 which account for MA experimental yield of 54.34%.
Figure 2 (A-F), reports on the 3D surface plots that correspond to the response of quadratic model interactions of temperature, catalytic-load, time, and the G/AA molar ratio on selectivity to MA. From Fig. 2 (A), the interactive response of temperature (X1) at 90 ℃ and catalyst-load (X2) of 1.2 g has an F-value of 37.54 and a p-value of 0.0002 which demonstrates effectiveness in the selectivity of MA.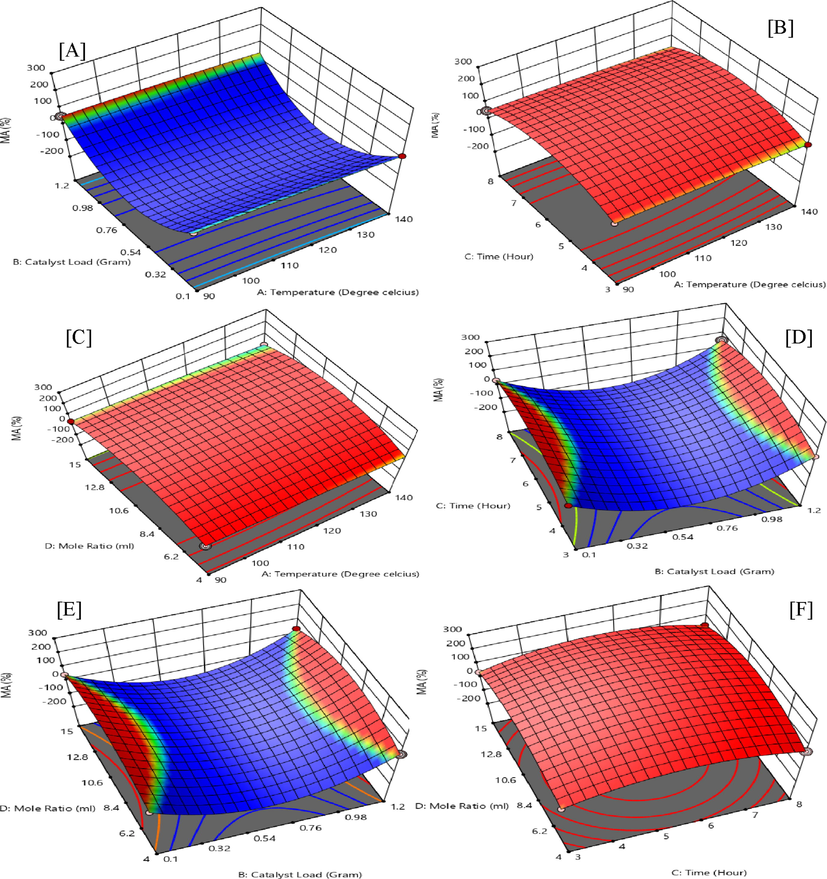
Interactive experimental factors for 3D surface plots of monoacetin (MA) selectivity.
Fig. 2 (B) is an interactive effect of temperature (X1) of 90 ℃ and time (X3) of 8 h. The figure proves a weak quadratic response value of MA with an unfavourable p-value of 0.9293 and an F-value of 0.0083. The interactive effect of temperature (X1) at 90 °C and G/AA molar ratio (X4) of 4, the interaction has an increasing effect on the response yield of MA with an F-value of 80.34 and a p-value below 0.0001, with a coefficient of 2.63 as shown in Fig. 2(C).
Fig. 2 (D) demonstrates a weak interaction between catalyst-load (X2) and time (X3) on the response of MA, with an F-value of 12.58. The interaction between catalyst-loading (X2) and G/AA molar ratio (X4) proves to be highly effective with a p-value below 0.001 and an F-value of 328.73 as in Fig. 2 (E). The interactive effects of time (X3) and G/AA molar ratio (X4) also prove as one of the most important factors with an f-value of 47.04 Fig. 2 (F).
3.1.3 Analysis of variance (ANOVA), regression model and optimization for diacetin (DA) selectivity
The ANOVA report for the statistical implications of the DA quadratic model is presented in Table 4.
Sum of
Mean
F
p-value
Source
Squares
df
Square
Value
Model
830.73
14
59.34
121.66
< 0.0001
Significant
X1-Temperature
194.33
1
194.33
398.43
< 0.0001
X2-Catalyst load
134.67
1
134.67
276.11
< 0.0001
X3-Time
16.70
1
16.70
34.23
0.0002
X4-Mole ratio
0.0409
1
0.0409
0.0839
0.7787
X1X2
7.20
1
7.20
14.77
0.0040
X1X3
22.29
1
22.29
45.71
< 0.0001
X1X4
2.55
1
2.55
5.22
0.0481
X2X3
1.04
1
1.04
2.13
0.1785
X2X4
105.03
1
105.03
215.33
< 0.0001
X3X4
37.60
1
37.60
77.09
< 0.0001
0.8494
1
0.8494
1.74
0.2195
101.09
1
101.09
207.26
< 0.0001
55.95
1
55.95
114.70
< 0.0001
80.13
1
80.13
164.28
< 0.0001
Residual
4.39
9
0.4877
Cor Total
835.12
23
Std. Dev.
0.6984
R2
0.9947
Mean
53.36
Adjusted R2
0.9866
C.V. %
1.31
Predicted R2
0.7547
Adeq Precision
46.3957
From Table 4, the DA quadratic model is significant with p-values < 0.0500 indicating the fitness of the model. In the quadratic equation model of the selectivity of DA, factors such as X1, X2, X3, X1X2, X1X3, X1X4, X2X4, X3X4, , , are the significant terms in the experiments for the selectivity of DA in the acetylation of glycerol with acetic acid.
Hence, a full model equation of the DA without the insignificant terms is provided in Eq. (5):
p-values with level of confidence above 0.05 indicates insignificance of the model, as such their reduction may improve the model. Such insignificant models include X4, X2X3, and , respectively.
From Table 4, the most effective linear parameter is temperature (X1) with F-value of 398.43, while the least effective is G/AA molar ratio with F-value of 0.0839. The most effective interactive parameter is catalyst-loading and G/AA molar ratio (X2X4) with an F-value of 215.33, while catalyst-load and time (X2X3) with an F-value of 2.13 proves to be the least effective interactive parameters. The experimental R2 of 0.9947 means there has been a significant response between experimental factors. Adequate precision ratio of 46.3957 indicates an adequate signal since only a ratio greater than 4 is desirable. The model is significant to navigate the design space. The selectivity of DA reported from the experimental and predicted data were 66.31% and 65.97%, respectively.
Figure 3 (A-F), reports on the 3D surface plots that correspond to the response of quadratic interactions of temperature, catalytic-loading, time, and the G/AA molar ratio on DA selectivity. From Fig. 3 (A), temperature (X1) at 130 ℃ and catalyst-load (X2) at 0.1 g gives an F-value of 14.77 and a p-value 0.004 leading to significant interactive response of actual factors. Fig. 3(B) is an interactive effect of temperature (X1) at 130 ℃ and time (X3) of 3 h. Such interactive response records a favourable quadratic effect on the response value of MA with a p-value below 0.0001 and an F-value of 45.71. Temperature (X1) at 130 ℃ and G/AA molar ratio (X4) at 4, has an increasing effect on the response yield of DA with an F-value of 5.22 and a p-value of 0.048 as shown in Fig. 3 (C).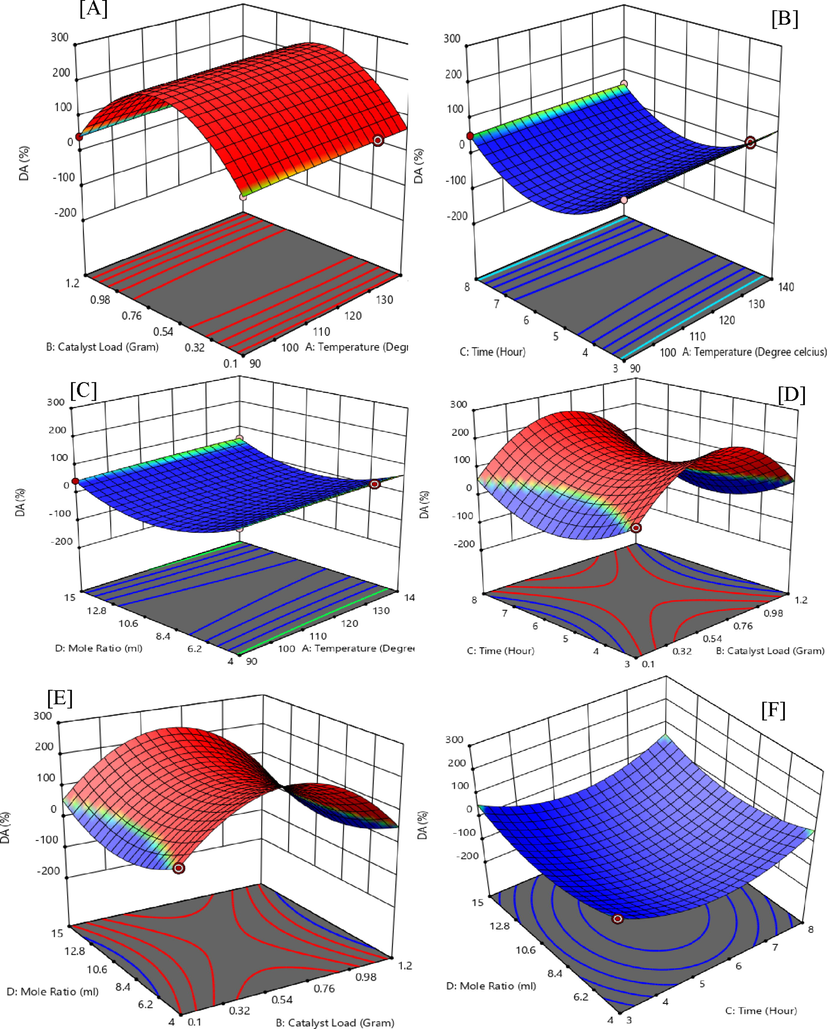
Interactive Experimental factors for 3D surface plots of diacetin (DA).
Fig. 3 (D) shows a rather slow response between catalyst-load (X2) and time (X3) towards the response of DA, with an F-value of 2.13. The interaction of catalyst-load (X2) and G/AA molar ratio (X4) proves to be highly effective with a p-value below 0.0001 and an F-value of 215.33 as shown in the 3D plot of Fig. 3 (E). The interactive effects of time (X3) and G/AA molar ratio (X4) also prove to be one of the most important factors with an F-value of 77.09 as indicated in Fig. 3 (F).
3.1.4 Analysis of variance (ANOVA), regression model and optimization for triacetin (TA) selectivity
The statistical report as indicated in ANOVA Table 5 indicates that quadratic model is significant.
Sum of
Mean
F
p-value
Source
Squares
df
Square
Value
Model
1222.91
14
87.35
598.70
< 0.0001
Significant
X1-Temperature
563.85
1
563.85
3864.60
< 0.0001
X2-Catalyst Load
42.59
1
42.59
291.93
< 0.0001
X3-Time
5.21
1
5.21
35.73
0.0002
X4-Mole Ratio
30.89
1
30.89
211.72
< 0.0001
X1X2
12.98
1
12.98
88.94
< 0.0001
X1X3
0.0596
1
0.0596
0.4086
0.5386
X1X4
50.93
1
50.93
349.05
< 0.0001
X2X3
24.14
1
24.14
165.48
< 0.0001
X2X4
100.46
1
100.46
688.56
< 0.0001
X3X4
8.38
1
8.38
57.44
< 0.0001
22.03
1
22.03
150.96
< 0.0001
1.65
1
1.65
11.29
0.0084
2.40
1
2.40
16.44
0.0029
16.03
1
16.03
109.85
< 0.0001
Residual
1.31
9
0.1459
Cor Total
1224.23
23
Std. Dev.
0.3820
R2
0.9989
Mean
14.51
Adjusted R2
0.9973
C.V. %
2.63
Predicted R2
0.9499
Adeq Precision
86.7108
From Table 5, the overall quadratic model is significant as shown by the p-value. In the quadratic model of the selectivity of TA, factors X1, X2, X3, X4, X1X2, X1X4, X2X3, X2X4, X3X4,
, , , are the significant model terms in the acetylation of glycerol with acetic acid.
Hence, a full model equation of the TA is provided in equation [6] and as earlier indicated, insignificant terms are reduced to improve the model.
The most effective single factor on Table 5, is the temperature (X1) with an F-value of 3864.60, followed by catalyst-loading (X3) and G/AA molar ratio (X4) at 291.93 and 211.72 respectively. Furthermore, temperature ( ) and G/AA molar ratio ( ) with an F-value of 150.96 and 109.85 respectively are the most effective single-multiple (quadratic) parameters. The catalyst-loading and G/AA molar ratio (X2X4) with an F-value of 688.56 are the most effective interactive parameters. Time (X1) with an F-value of 35.73 is the least effective single parameter and the least effective interactive parameters are time and G/AA molar ratio (X3X4) with an F-value of 57.44. The experimental R2 of 0.9989 indicates a significant response between the experimental factors. Adequate precision ratio of 86.711 indicates adequacy of noise to signal ratio and is able to navigate the quadratic model design space. The selectivity towards TA from the experimental and predicted data are 29.63% and 29.34% respectively.
Fig. 4 (A-F), reports on the 3D surface plots that correspond to the response of quadratic model interactions of temperature, catalytic-load, time, and the G/AA mole ratio on selectivity to TA.
From Fig. 4 (A), the interactive response of temperature (X1) at 130 ℃ and catalyst-load (X2) at 0.5 g with an F-value of 88.94 and a p-value below 0.0001 proves effective in the selectivity towards TA and prevails in the 2nd order polynomial equation of actual factors. Fig. 4 (B) demonstrates the interaction between temperature (X1) at 130 ℃ and time (X3) for 5 h which shows unfavourable quadratic outcome on the selectivity of TA with a p-value above 0.5386 and F-value of 0.4086. The interactive effect of temperature (X1) at 130 ℃ and G/AA molar ratio (X4) of 12 have the highest influence on the yield of TA with an F-value of 349.05 and a p-value<0.0001 as indicated in the 3D interactive plot in Fig. 4 (C).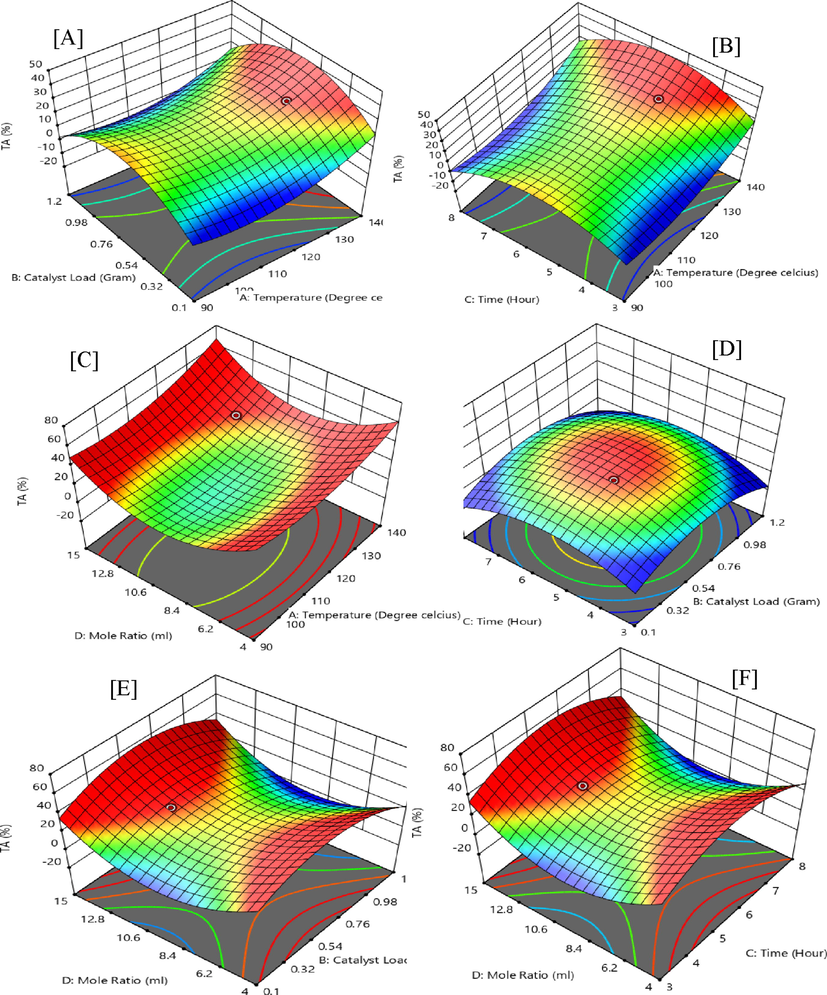
Interactive experimental factors for 3D surface plots of triacetin (TA).
Fig. 4 (D) demonstrates a weak interactive influence of catalyst-loading (X2) and time (X3) on the selective response of MA, with an F-value of 165.48. The catalyst-loading (X2) and G/AA molar ratio (X4) interactive effect proves to be highly effective with a p-value<0.001 and an f-value of 688.56 as shown in the 3D plot in Fig. 4 (E). The interactive effects of time (X3) and G/AA molar ratio (X4) also prove as one of the most important factors with an F-value of 55.44 Fig. 4 (F).
The finding from this study shows some similarities with reports in literature. Kulkarni et al. (2020) reported 99.1% GC, 22, 57, and 21% selectivity to MA, DA and TA, respectively at the optimum conditions (1):10 G/AA molar ratio, 5 wt% catalyst, 100 ℃ temperature and 3 h reaction time over a sulfated CeO2–ZrO2 mixed-oxide catalyst. Optimized glycerol conversion and acetin selectivity were obtained under the reaction conditions of temperature 108.8 ℃, G/AA molar ratio 1:12, catalyst load of 0.36 g and 5 h reaction time over sulfated alumina (Arun et al., 2016). On the use of RSM to study the reaction parameters, the authors also reported that the effect of the reaction parameter followed the order: acetic acid/ glycerol mole ratio > interaction term as a result of the mole ratio and temperature > reaction temperature > catalyst amount with all the empirical models showing good fit with R2 greater than 0.95. Similarly, Nda-Umar et al. (2021) reported models with good fit R2 greater than 0.95 and adequate signal-to-noise ration greater than 4 in RSM optimization of glycerol acetylation using organosulfonic acid-functionalized carbon as catalyst. The performance of the synthesized catalyst (Y2O3/PKS-T700) was compared with other heterogeneous catalysts reported in various literature (Table 6). The synthesized catalyst has shown good potential especially when the mixture of DA and TA is taken into consideration. The mixture of DA and TA is used as fuel additive (Nda-Umar et al., 2021, Kulkarni et al., 2020, Khayoon et al., 2014). Following the production of more DA in this study, the reaction pathway is presented in Scheme 1. *Non-microwave instant heating method while others used reflux method.
Catalyst
Parameters
Selectivity (%)
Reference
MR
T
(℃)
CL
t (h)
GC
(%)
MA
DA
TA
DA + TA
*30NiO/TiO2
1:10
170
0.04 g
0.5
90.2
19.6
14.5
65.9
80.4
Appaturi et al., 2021
Fe3O4@SiO2@SO4 2-
1:6
80
5wt.%G
0.75
100
–
–
100
100
Abida et al., 2020
SO42-/CeO2-ZrO2)
1:10
100
5wt.%G
3
99
22
57
21
78
Kulkarni et al., 2020
10Ru-10Cu/MCM-41
1:20
110
80 mg
5
91.4
43.9
26.0
30.1
56.1
Ramalingam et al., 2020
Solid acid catalyst (SBA-15)
1:9
110
0.7 g
6
95
19
59
22
81
Goscianska and Malaika, 2020
20% SO4/K10
1:12
120
0.4 g
5
99
23
56
15
71
Kakasaheb et al., 2018
Al-clays
1:3
120
1 g
1
60
41
10
9
19
Venkatesha et al., 2016
Sb2O5
1:6
120
0.1 g
1
94.5
48
47
5
52
Hu et al., 2015
12%ZrO2/ KIL-2 silica
1:10
100
0.1 g
1
80.9
60.9
27.9
11.1
39
Popova et al., 2014
SO4 2−/CeO2 -Al2O3
1:6
120
5wt.%G
1
79.9
58.9
35.5
5.6
41.1
Reddy et al., 2012
SO42−/CeO2 -ZrO2
1:6
120
5wt.%G
1
100
25.8
57.7
16.5
74.2
Reddy et al., 2012
Y2O3/PKS-T700
1:12
130
0.5 g
5
99.8
11.1
60.2
29.6
89.9
This study
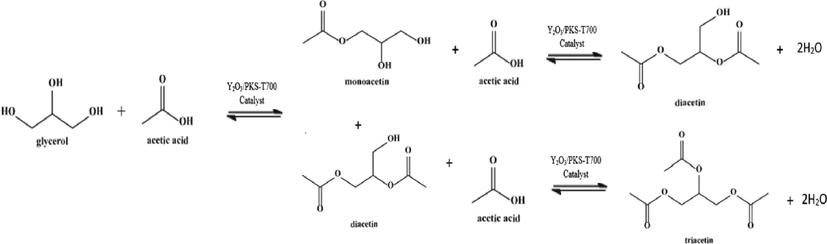
Reaction pathway for the acetylation of glycerol with acetic acid over synthesized catalyst.
3.2 Catalyst characterization
3.2.1 Elemental analysis
The result of elemental analysis as obtained from the energy dispersive X-ray (EDX) technique is shown in Table 7 which indicates that the carbonized precursor material (PKS-T700) has a very high content of carbon (C) and oxygen (O) without the presence of yttrium metal. However, on successful functionalization (impregnation), the carbon content decreased with a clear presence of yttrium (13.01%). The presence of yttrium oxide (Y = O) must have acted as the active cite of the catalyst (Y2O3/PKS-T700) as earlier reported in literature (Khayoon and Hameed, 2013).
Sample
Elemental composition
Textural properties
C
(%)
O
(%)
Y
(%)
BET surface area
(m2/g)
Pore volume
(cm3/g)
Mean pore size
(nm)
PKS-T700
88.35
11.65
0.00
369
0.253
5.7
Y2O3/PKS-T700
71.33
15.66
13.01
503
0.452
2.5
3.2.2 N2 adsorption–desorption analysis
The textural properties (the BET surface area, pore volume and pore size distribution) of the carbonized PKS and the synthesized catalyst (Y2O3/PKS-T700) were obtained from the physisorption isotherms indicated in Fig. 5, while their characteristic values are reported in Table 6. The N2 physisorption isotherms are similar and are of type IV with H3 hysteresis loop which is characteristic of mesoporous materials (Kulkarni et al., 2020; Vázquez et al., 2020). Similar report by Appaturi et al., (2021) confirmed the exhibition of a type IV isotherm with a finite multilayer formation which is usually associated with presence of mesopores. The presence of mesopores on the surface of the catalyst aid the formation of bulky structures such as MA, DA, and TA. Both the PKS-T700 and Y2O3/PKS-T700 shows similar hysteresis loops as indicated in Fig. 5(a). The loop is characteristic of a typical mesoporous materials attributed to capillary condensation.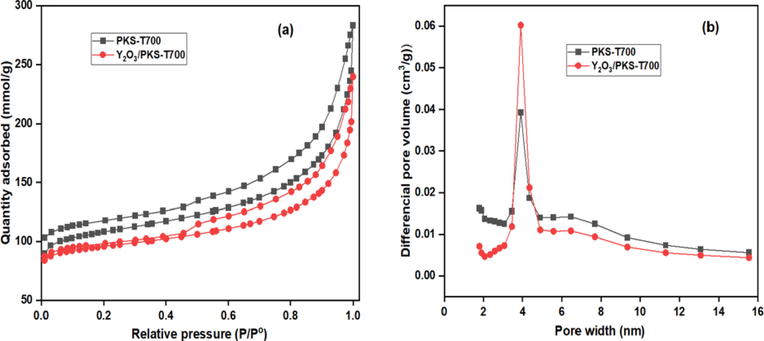
The N2 physisorption Isotherms (a) and the BJH pore size distributions (b) of carbonized PKS (PKS-T700) and the synthesized catalyst (Y2O3/PKS-T700).
Meanwhile, the mean pore-size distribution (Fig. 5 (b)) as analysed by the Barrett–Joyner–Halenda (BJH) method, shows a narrow pore-size distribution with more of the mesopores occurring on the catalyst (Y2O3/PKS-T700). The textural properties as indicated on Table 7 shows the surface area of the carbonized PKS to be 369 m2/g with a pore volume of 0.253 cm3/g which improved after transformation of the material to catalyst with surface area of 503 m2/g and a pore volume of 0.452 cm3/g. These observations may be due to the high temperature of calcination used leading to high structural disorder of the carbon material (Nda-Umar et al., 2021). However, the average pore size distribution decreased from 5.7 to 2.5 nm due to successful impregnation of the Y2O3 on the PKS material. Generally, the textural properties further support the mesoporous structure nature of the catalyst (Konwar et al., 2015, Tao et al., 2015, Chong et al., 2020; Armandi, 2010).
3.2.3 FTIR analysis
Fig. 6 shows the functional group present in the carbonized PKS and the synthesized catalyst (Y2O3/PKS-T700). The spectra indicates that all the samples exhibit stretching vibration of O–H at 3750 cm−1, C–H stretching vibrations of alcoholic or phenolic and methyl/methylene groups at 2968 cm−1, C-O stretching vibrations of carbonyl/carboxylic groups attached to the aromatic ring at 1739 cm−1, while the band around 1544 cm−1 is assigned to C = C of the aromatic compound. The foregoing vibrations confirms the polycyclic aromatic skeleton of cellulose and hemicellulose structures associated with carbon-based materials (Chellappan et al., 2018; Goscianska and Malaika, 2020). The bands at 1104 and 789 cm-1 are assigned to symmetric and asymmetric stretching vibrations of Y = O exhibited by the synthesized catalysts only which confirms the successful functionalization of the carbonized PKS with the metal oxide (Y2O3).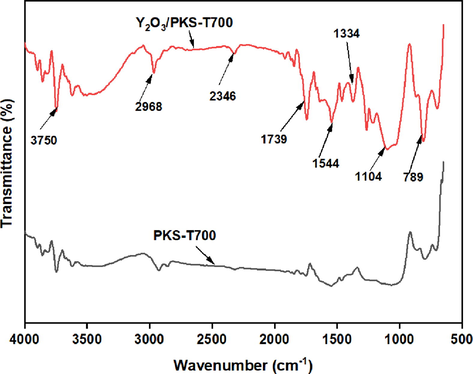
FTIR spectra of the carbonized PKS (PKS-T700) and the synthesized catalysts.
3.2.4 XRD analysis
The XRD pattern of the carbonized PKS, the metal oxide (Y2O3) and the synthesized catalyst (Y2O3/PKS-T700) are depicted in Fig. 7. The carbonized PKS (PKS-T700) exhibited a broad hump diffraction peak around 2θ = 23.39° and subsequently 2θ peaks at 44.16°, 64.2°, and 77.4°, respectively. These peaks are attributed to hemicellulose and cellulose structures of the carbonized biomass materials (Azri et al., 2021; Nda-Umar et al., 2021). The metal oxide (Y2O3) exhibited several sharp and weak diffraction peaks at 2θ = 20°, 30°, 33°, 36°, 39.5°, 48.5° and 58° ascribed to reflexes (2 1 1), (2 2 2), (4 0 0), (4 1 1), (3 2 2), (4 4 0) and (6 2 2) can be indexed to the cubic Y2O3 (JCPDS card no. 72–0927) (Zhang et al., 2011, Zhang et al., 2012). On impregnating the carbonized PKS with the Y2O3, the point of diffraction peaks remains the same but the intensity reduced in the catalyst attributed to the interaction of the yttrium oxide with the carbon support.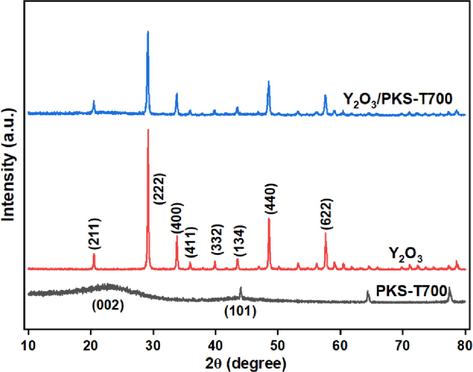
XRD diffractograms for carbonized PKS (PKS-T700), Y2O3 and the synthesized catalyst (Y2O3/PKS-T700).
3.2.5 TGA and DTG analysis
The thermal stability of both the carbonized PKS and the catalyst are indicated in Fig. 8 (a) and (b). The PKS-T700 exhibited two stages of decomposition. The first stage occurred between 100 and 150 ℃ and was attributed to the adsorbed moisture or water molecules, while the second decomposition which occurred around 800 ℃ was attributed to the decomposition of the hard components of the PKS (such as lignin and other hard fibrous contents) (Abdullah et al., 2020; Thiagarajan et al., 2018, Nda-Umar et al., 2021). However, the catalyst (Y2O3/PKS-T700) exhibited only one stage decomposition which can easily be seen in the DTG profile (Fig. 3 b). The decomposition occurred around 800 ℃ and was rapid attributable to the physically release volatile matter in the form of carbon–metal oxide bond decomposition (Thiagarajan et al., 2018). The catalyst is very dry and very stable within the acetylation reaction temperature (100–130 ℃).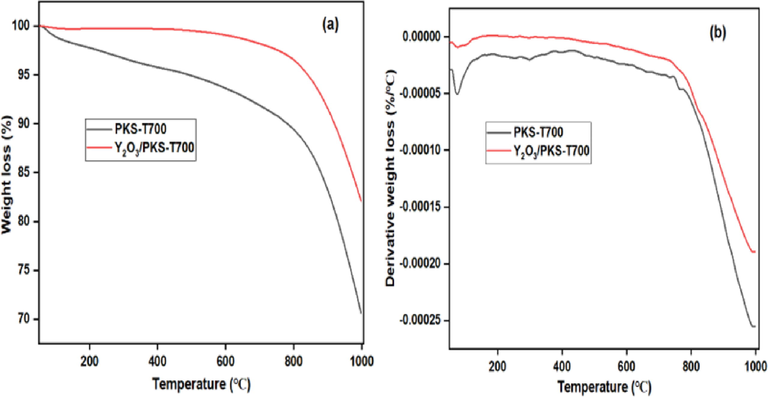
TGA profile (a) and DTG profile (b) of carbonized PKS (PKS-T700) and the synthesized catalyst (Y2O3/PKS-T700).
3.2.6 SEM analysis
The morphology of the carbonized PKS (PKS-T700), Y2O3 and the synthesized catalyst (Y2O3/PKS-T700) as revealed by the scanning electron microscopy (SEM) is shown in Fig. 9. The micrograph of PKS-T700 (Fig. 9a) exhibited small to large agglomerated rough particles of irregular shape with some porous surface, while the Y2O3 (Fig. 9b) exhibited block rock-like structure with a relatively smooth surface, rough edges and it is non-porous. However, on impregnation of the carbonized PKS with Y2O3 (Fig. 9c), the resultant product shows aggregation of the catalyst particles with a soft spongy-like structure with tiny pores which is typical of mesoporous arrangement (Tao et al., 2015). The resultant morphology is also in line with textural properties as obtained the N2 adsorption–desorption isotherms (Dalla et al., 2016; Liu et al., 2016).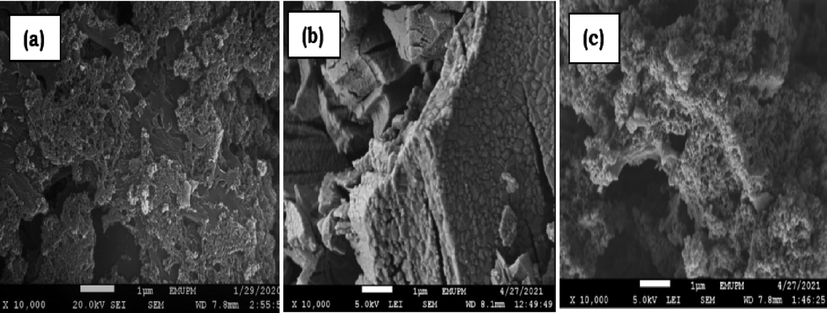
SEM micrographs (a) PKS-T700 (b) Y2O3 (c) Y2O3/PKS-T700.
3.3 Catalyst reusability (recycling)
The capacity to reuse Y2O3/PKS-T700 as a heterogeneous catalyst in the acetylation of glycerol with acetic acid was carried out three (3) times under optimal conditions of temperature 130 ℃, G/AA molar ratio 1:12, catalyst load 0.5 g, and 5 h reaction time. The result is presented in Fig. 10 and it showed that the glycerol conversion (GC) was 99.8%, 97.3, and 95.3% for the 1st, 2nd and 3rd cycle of glycerol acetylation. The selectivity towards monoacetin (MA) was 11.1%, 9.0%, and 6.5% for the 1st, 2nd and 3rd cycle of glycerol acetylation. The selectivity towards diacetin (DA) was 60.2%, 54.3%, and 48.7% for the 1st, 2nd and 3rd cycle of glycerol acetylation. The selectivity towards triacetin (TA) was 29.6%, 25.8%, and 19.4% for the 1st, 2nd and 3rd cycle of glycerol acetylation. The catalyst showed a good recyclability in the GC and MA, DA and TA selectivity for the three reaction cycles in view of the fact that only little reduction was observed after each cycle. The little reduction can be attributed to the weakening or leaching of the active sites (Y = O) as observed in the FTIR spectrum of the spent catalyst (Fig. 11). Similar findings have been reported in literature using various catalysts (Nda-Umar et al., 2021; Kulkarni et al., 2020; Arun et al, 2016; Tao et al., 2015).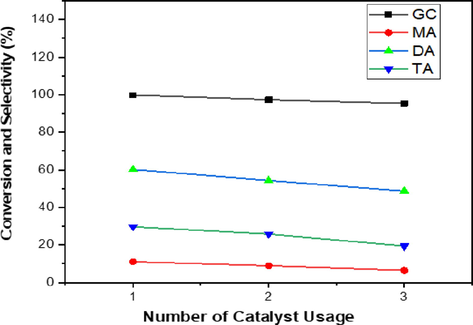
Recycling of Y2O3/PKS-T700 catalyst.
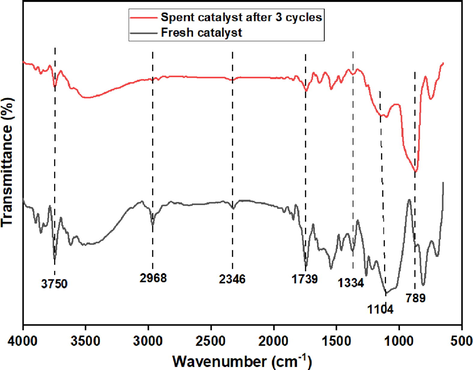
FTIR spectra of the fresh catalyst (Y2O3/PKS-T700) and the spent catalyst after 3 cycles.
4 Conclusion
Palm kernel shell (PKS) from the mill industry has been repurposed as a viable mesoporous catalyst’s support. It was subjected to carbonization at 700 ℃ (PKS-T700) and subsequently functionalized with yttrium oxide (Y2O3/PKS-T700). The characterization of both the carbonized PKS and the synthesized catalyst revealed the transformation that occurred. On evaluation of the synthesized catalyst (Y2O3/PKS-T700), it exhibited excellent conversion of glycerol and higher selectivity of DA and TA (89.9 %) when compared to many earlier literature reports. Similarly, the catalyst demonstrated relatively good recyclability in three acetylation reaction cycles under the optimised conditions. Only a slight reduction in the GC and the product selectivity were observed which was attributed to minor degradation of the catalyst as revealed by the FTIR spectrum of the spent catalyst.
Acknowledgments
Authors of this article appreciate the Universiti Putra Malaysia for financial support via Putra Fast Track Grant (GP/2020/9692400).
Declaration of Competing Interest
The authors declare that they have no known competing financial interests or personal relationships that could have appeared to influence the work reported in this paper.
References
- Synthesis of bifunctional nanocatalyst from waste palm kernel shell and its application for biodiesel production. RSC Adv.. 2020;2020(10):27183-27193.
- [CrossRef] [Google Scholar]
- A review on catalytic role of heterogeneous acidic catalysts during glycerol acetylation to yield acetins. Journal of Indian Chemical Society. 2022;99(6):100459
- [CrossRef] [Google Scholar]
- Development and functionalization of magnetic nanoparticles as stable and reusable catalysts for triacetin synthesis. New J. Chem. 2020
- [CrossRef] [Google Scholar]
- Exergy-based sustainability analysis of acetins synthesis through continuous esterification of glycerol in acetic acid using Amberlyst®36 as catalyst. J. Clean. Prod.. 2018;183:1265-1275.
- [CrossRef] [Google Scholar]
- Selective synthesis of triacetyl glyceride biofuel additive via acetylation of glycerol over NiO-supported TiO2 catalyst enhanced by non-microwave instant heating. Appl. Surf. Sci.. 2021;545:149017
- [CrossRef] [Google Scholar]
- Acetylation of Glycerol over Sulfated Alumina: Reaction Parameter Study and Optimization Using Response Surface Methodology. Energy Fuel. 2016;30(1):584-593.
- [CrossRef] [Google Scholar]
- Synthesis, optimization and characterization of biochar based catalyst from sawdust for simultaneous esterification and transesterification. Chin. J. Chem. Eng. 2018:2654-2663.
- [Google Scholar]
- A review over the role of catalysts for selective short-chain polyglycerol production from biodiesel derived waste glycerol. Environ. Technol. Innov.. 2020;19:100859
- [CrossRef] [Google Scholar]
- Sulfonic functionalized SBA-15 catalysts in the gas phase glycerol dehydration. Thermal stability and catalyst deactivation. Microporous Mesoporous Mater.. 2016;230:66-75.
- [CrossRef] [Google Scholar]
- A facile post-synthetic modification of ordered mesoporous carbon to get efficient catalysts for the formation of acetins. Catal. Today. 2020;357:84-93.
- [CrossRef] [Google Scholar]
- Selective catalytic synthesis of glycerol monolaurate over silica gel-based sulfonic acid functionalized ionic liquid catalysts. Chem. Eng. J.. 2019;359:733-745.
- [CrossRef] [Google Scholar]
- Selective esterification of glycerol with acetic acid to diacetin using antimony pentoxide as reusable catalyst. Journal of Energy Chemistry. 2015;24(5):632-636.
- [CrossRef] [Google Scholar]
- Synthesis of oxygenated fuel additives via acetylation of bio-glycerol over H2SO4 modified montmorillonite K10 catalyst. Prog. Petrochem. Sci.. 2018;1:1-5.
- [Google Scholar]
- Yttrium-grafted mesostructured SBA-3 catalyst for the transesterification of glycerol with methyl acetate to synthesize fuel oxygenates. Appl. Catal. A. 2013;460–461:61-69.
- [CrossRef] [Google Scholar]
- Improved production of fuel oxygenates via glycerol acetylation with acetic acid. Chem. Eng. J.. 2014;243:473-484.
- [CrossRef] [Google Scholar]
- Shape selectivity and acidity effects in glycerol acetylation with acetic anhydride: Selective synthesis of triacetin over Y-zeolite and sulfonated mesoporous carbons. J. Catal.. 2015;329:237-247.
- [Google Scholar]
- Kinetic studies on the synthesis of fuel additives from glycerol using CeO2-ZrO2 metal oxide catalyst. Biofuel Res. J.. 2020;7(1):1100-1108.
- [Google Scholar]
- Effects of CeO2 and Y2O3 on the interfacial diffusion of Ti/Al2O3 composites. J. Alloy. Compd.. 2016;656:929-935.
- [CrossRef] [Google Scholar]
- Glycerol from biodiesel production: Technological paths for sustainability. Renew. Sustain. Energy Rev.. 2018;88:109-122.
- [CrossRef] [Google Scholar]
- Organosulfonic acid-functionalized biomass-derived carbon as a catalyst for glycerol acetylation and optimization studies via response surface methodology. J. Taiwan Inst. Chem. Eng.. 2021;118:355-370.
- [CrossRef] [Google Scholar]
- Glycerol acetylation on mesoporous KIL-2 supported sulphated zirconia catalysts. Cat. Sci. Technol.. 2014;4(11):3993-4000.
- [CrossRef] [Google Scholar]
- Ramalingam, R. J., Appaturi, J. N., Pulingam, T., Al-Lohedan, H. A., Al-dhayan, D. M. 2020. In-situ incorporation of ruthenium/copper nanoparticles in mesoporous silica derived from rice husk ash for catalytic acetylation of glycerol. https://doi.org/10.1016/j.renene.2020.06.095.
- From glycerol as the by-product of biodiesel production to value-added monoacetin by continuous and selective esterification in acetic acid. J. Ind. Eng. Chem.. 2015;21:856-861.
- [CrossRef] [Google Scholar]
- Selective acetylation of glycerol over CeO2–M and SO42−/CeO2–M (M=ZrO2 and Al2O3) catalysts for synthesis of bioadditives. J. Ind. Eng. Chem.. 2012;18(2):648-654.
- [CrossRef] [Google Scholar]
- Kinetic study of fuel bio-additive synthesis from glycerol esterification with acetic acid over acid polymeric resin as catalyst. Fuel. 2020;264:116879
- [CrossRef] [Google Scholar]
- Esterification of glycerol with acetic acid over Lewatit catalyst. MATEC Web Conf.. 2018;154:01028.
- [CrossRef] [Google Scholar]
- Application of response surface methodology to investigate the effect of different variables on conversion of palm kernel shell in steam gasification using coal bottom ash. Appl. Energy. 2016;184(2016):1306-1315.
- [CrossRef] [Google Scholar]
- The effect of temperature on the mesopore development in commercial activated carbon by steam activation in the presence of yttrium and cerium oxides. Colloids Surf A Physicochem Eng Asp. 2003;229(1–3):55-61.
- [Google Scholar]
- One-pot synthesis of canola oil based biolubricants catalyzed by MoO3/Al2O3 and process optimization study. Chem. Eng. J.. 2016;293:259-272.
- [CrossRef] [Google Scholar]
- Acetylation of biodiesel glycerin using glycerin and glucose derived catalysts. J. Clean. Prod.. 2021;297:126686
- [CrossRef] [Google Scholar]
- Fabrication of sulfonated carbon catalyst from biomass waste and its use for glycerol esterification. Fuel Process. Technol.. 2015;138:355-360.
- [CrossRef] [Google Scholar]
- Thermal behavior and pyrolytic kinetics of palm kernel shells and Indian lignite coal at various blending ratios. Bioresource Technology Reports. 2018;4:88-95.
- [Google Scholar]
- Obtaining of value added chemicals from catalityc dehydration of glycerol. Catal. Today. 2020;356:349-358.
- [Google Scholar]
- Volume accessibility of acid sites in modified montmorillonite and triacetin selectivity in acetylation of glycerol. RSC Adv.. 2016;6:45819-45828.
- [CrossRef] [Google Scholar]
- Major advances and challenges in heterogeneous catalysis for environmental applications: A review. Ecol. Chem. Eng. S. 2018;1(25):9-34.
- [Google Scholar]
- Zhang, H., Chu, W., & Zou, C. 2011. Promotion Effects of Platinum and Ruthenium on Carbon Nanotube Supported Cobalt Catalysts for Fischer – Tropsch Synthesis. 438–444.
- Synthesis and luminescence properties of Y2O3: Eu with flower-like microstructure Synthesis and luminescence properties of Y 2 O 3: Eu with flower-like microstructure. J. Alloy. Compd.. 2012;517:149-156.
- [Google Scholar]
- Catalytic characteristics and parameters optimization of the glycerol acetylation over solid acid catalysts. Fuel. 2013;103:617-625.
- [CrossRef] [Google Scholar]


