

Translate this page into:
Glycerol as an efficient plasticizer to increase the DC conductivity and improve the ion transport parameters in biopolymer based electrolytes: XRD, FTIR and EIS studies
⁎Corresponding author at: Hameed Majid Advanced Polymeric Materials Research Lab., Physics Department, College of Science, University of Sulaimani, Qlyasan Street, Sulaimani 46001, Kurdistan Regional Government, Iraq. shujahadeenaziz@gmail.com (Shujahadeen B. Aziz)
-
Received: ,
Accepted: ,
This article was originally published by Elsevier and was migrated to Scientific Scholar after the change of Publisher.
Peer review under responsibility of King Saud University.
Abstract
In the current work Plasticized sodium ion conducting solid polymer electrolytes (SPEs) based on polyvinyl alcohol: methylcellulose (PVA: MC) and sodium iodide (NaI) as the electrolytic salt are fabricated. The SPE films are created using a renowned solution casting procedure, and the results of the experiments are provided. The development of polymers-salt complexes is supported by the Fourier-transform infrared transform (FTIR) analysis. The degrees of crystallinity of the polymers are noticeably decreased as a result of the glycerol plasticizer, according to X-ray diffraction test. The sample inserted with 40 wt% glycerol has the maximum ionic conductivity, according to electrical impedance spectroscopy (EIS). Electrical equivalence circuits (EEC) are used to explore the electrolytes circuit components. For the highest conducting electrolyte, the number density (n), mobility (µ), and diffusion coefficient (D) of ions are found to be 2 × 10²¹, 1.79 × 10⁻⁶, and 4.59 × 10⁻⁸, respectively. A high dispersion of the real component of dielectric permittivity at a lower frequency are used to infer the space charge influence induced by stainless-still (SS) electrodes. The tangent loss spectra show that the bouncing chance per unit time decreases as the glycerol concentration rises.
Keywords
Plasticized polymer electrolyte
PVA
MC
XRD & FTIR
Transport parameters
Dielectric properties

1 Introduction
Energy storage devices, such as those that power our mobile gadgets and computers, are almost ubiquitous in high-energy-consumption areas. In sophisticated chemical energy storage equipment, such as supercapacitors, solar cells, protonic, and fuel cells, polymer electrolyte (PE) is widely used (Hadi et al., 2021). Due to its processability, dimensional stability, electrochemical stability, flexibility, long life, and safety, solid polymer electrolyte (SPE) is predicted to replace the traditional organic sol–gel electrolyte in the future (Hema et al., 2009). As supramacromolecular systems with a higher degree of hydrogen bonding and complicated positions, PEs have superior electrical conductivity (Schrote and Frey, 2013). SPEs, gel polymer electrolytes (GPEs), and composite polymer electrolytes (CPEs) are the three main types of PEs.
Due to the low conductivity of composite polymer electrolytes and limited conductivity of SPEs, GPEs with increased conductivity were created. Plasticized-polymer electrolytes or gelionic SPEs are known as two types of GPEs (Sharma and Kulshrestha, 2015). SPEs offer far greater long-term stability than liquid or gel electrolytes. Furthermore, a lot of PEs are bendy and effortless to work with (Schrote and Frey, 2013; Sharma and Kulshrestha, 2015; Rzayev et al., 2016).
Researchers have attempted a variety of methods to improve conductivity in PEs because it is an important feature. Increasing the ionic conductivity of PEs through blending is a possible option (Buraidah and Arof, 2011). Therefore, many researchers have been interested in polymer blends. This is owing to the fact that polymer mixtures can be used to create new materials. The characteristics of the blend are distinct from and superior to those of the single polymer (Kadir et al., 2011).
PEs have been developed using a diversity of polymers including as PVA, PMMA, PVP, PAN, PEO, and PVDF (Radha et al., 2013). As a well-known water-soluble polymer with high transparency and excellent mechanical qualities, poly(vinyl alcohol) (PVA) has been used in a variety of personal, industrial, and electronic applications (Karbowiak et al., 2006). Because of its ease of manufacture and biodegradability, PVA is a polyhydroxy polymer that is widely employed in useful applications. PVA also has the ability to form films, is hydrophilic, and has a high density of reactive chemical functionalities, making it ideal for cross-linking via chemical, irradiation, or thermal treatments (Park et al., 2001; Qiao et al., 2010). The O-H bonds in PVA facilitate in the development of polymer complexes. PVA also possesses a number of positive characteristics, including high mechanical strength, great ionic conductivity, non-toxicity, biocompatibility, biodegradability, and ease of preparation (Nofal et al., 2021; Aziz et al., 2020; Aziz et al., 2015).
To host proton conduction, methyl cellulose (MC), an amorphous polymer with a high glass transition temperature (Tg) (184–200 °C), was utilized. The oxygen atoms of MC have lone pair electrons, which can be used to form complexes with the salt's cation. A polymer's ability to host ionic conduction is determined by the existence of lone pair electrons (Shuhaimi et al., 2010).
Since the early 1800s, plasticizers have been commonly utilized to modify polymers. These are organic molecules with a low molecular weight that are relatively non-volatile that increase polymer workability and durability by reducing polymer-polymer contact, lowering the rigidity of the three-dimensional configuration of polymers, and therefore increasing deformation ability without rupture (Tyagi and Bhattacharya, 2019; Mekonnen et al., 2013). Manoj Kumar and Sekhon investigated the impacts of various plasticizers on the characteristics of PEO-based electrolytes, including dimethyl carbonate (DMC), ethylene carbonate (EC), dimethylformamide (DMF), propylene carbonate (PC), dimethylacetamide (DMAc), and diethyl carbonate (DEC) (Radha et al., 2013). Nevertheless, no comprehensive research on PVA:MC doped with NaI and plasticized using glycerol plasticizer has been reported.
Film-forming compounds like polysaccharides are generally mixed with a plasticizer molecule to increase their mechanical and structural qualities in most of these applications. Plasticizers' effects on the mechanical properties of edible films have been well established in scientific literature (Karbowiak et al., 2006).
Electrolytes based on sodium complexed films have been attempted a few times. Aside from the scientific aspect, sodium has other advantages over its lithium counterparts, including the availability of sodium in large quantities at a lower cost. Because sodium does not form an alloy with aluminum, it may be possible to generate solid electrolytes with appropriate conductivity by using this metal as a current collector rather than the more expensive and heavier nickel. Moreover, the materials' softness makes contact with other components in the battery easier to create and sustain (Bhargav et al., 2007). As a result, based on PVA mix electrolyte, we present the production and characterization of sodium-conducting PEs. The structural, vibrational, and electrical properties of the produced PEs were investigated.
2 Experimental details
2.1 Materials and electrolyte preparation
The host polymeric raw materials were polyvinyl alcohol (PVA) and methylcellulose (MC) powders, the ionic source was sodium iodide (NaI) salt, and the plasticizer was glycerol. Sigma-Aldrich provided all of the chemical components (Kuala Lumpur, Malaysia). The primary solution set was made by dissolving 0.6 g of PVA (at 80 °C) and 0.4 g of MC at ambient temperature in distilled (40 mL) water in closed caps separately using a solution cast process. For 24 h, using a magnetic stirrer the solutions were constantly stirred till a homogeneous aqueous solution was achieved. The PVA solution was then cooled to room temperature before being combined with MC. The procedure is completed by stirring the PVA:MC mixing till flawless solutions is obtained.
The solution was then given a constant weight percent of 50 wt% of NaI salt. Lastly, plasticized ion-conducting PEs was made with glycerol. Different amounts of glycerol plasticizer (10, 20, 30, and 40 wt%) were added to the PVA:MC:NaI solution independently, and then stirred continuously for 24 h in closed caps until clear solution was achieved. An image of the prepared sample is shown in Fig. 1. The solutions were placed in numerous Petri dishes (8 cm in diameter) and allowed to rest at room temperature to generate a dry film free of solvent. The flexible films were then made with a thickness of roughly 0.026–0.03 cm. PVA:MC-NaI systems plasticized with different levels of glycerol were coded as PNVI0, PNVI1, PNVI2, PNVI3, and PNVI4, which linked to 0, 10, 20, 30, and 40 percent of glycerol, respectively. The films compositions are revealed in Table 1.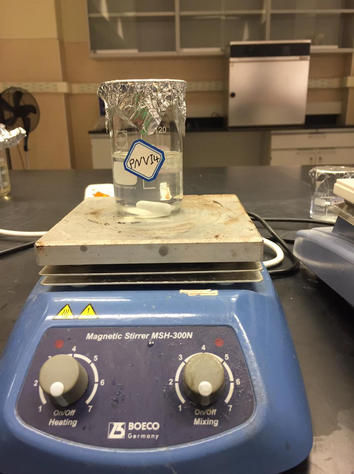
Image of the PVNI4 sample.
Designation
PVA:MC (wt.%)
PVA:MC (g)
NaI (wt.%)
NaI (g)
Glycerol (wt.%)
Glycerol (g)
PNVI0
(0.6:0.4)
0.6:0.4
50
1
0
0
PNVI1
(0.6:0.4)
0.6:0.4
50
1
10
0.222
PNVI2
(0.6:0.4)
0.6:0.4
50
1
20
0.5
PNVI3
(0.6:0.4)
0.6:0.4
50
1
30
0.857
PNVI4
(0.6:0.4)
0.6:0.4
50
1
40
1.333
2.2 Structural and impedance analyses
Using a Siemens D5000 X-ray diffractometer (1.5406 Å), X-ray diffraction (XRD) was taken to investigate the structure of the materials. Fourier transform infrared spectroscopy (Spotlight 400 Perkin-Elmer spectrometer) was used with a 1 cm−1 resolution in the range 750 to 4000 cm−1. Electrical impedance spectroscopy (HIOKI 3532-50 LCR Hi-TESTER) was used to investigate the samples' electrical properties in the frequency range of 50 Hz to 5 MHz. The samples were sandwiched between two stainless steel electrodes for electrical evaluation.
The conductivity of the sample was calculated using the Eq. (1) (Asnawi et al., 2021), based on the results of electrical impedance spectroscopy experiments and the dimensions of the samples:
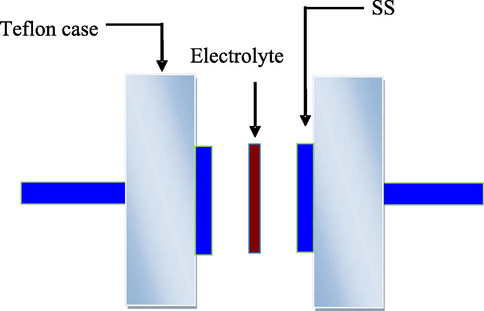
Diagram of the cell used for EIS measurement.
3 Result and discussion
3.1 FTIR analysis
The high absorption between 3000 and 3800 cm−1 is thought to be due to hydroxyl stretching vibration. C—H rocking in PVA has been allocated to the peak at the 850 cm−1 (Fig. 3). In doped PE solutions, this peak is displaced. The bands at 1094 cm−1 and 1320 cm−1 relate to the pure PVA's —C—O— stretching and C—H deformation, respectively (Rajendran et al., 2004). In the complexed systems of polymer/salt materials, this peak is disappeared (Fig. 3). In the electrolyte system, CH2 bending exhibited at 1432 cm−1 in pure PVA is moved to higher wave number (Awadhia and Agrawal, 2007). In the SPE system, a powerful and broad absorption peak positioned at 3376 cm−1 is shifted, which would be attributed to the OH stretching with powerful hydrogen bonding of inter and intra form of PVA (Aziz et al., 2021a).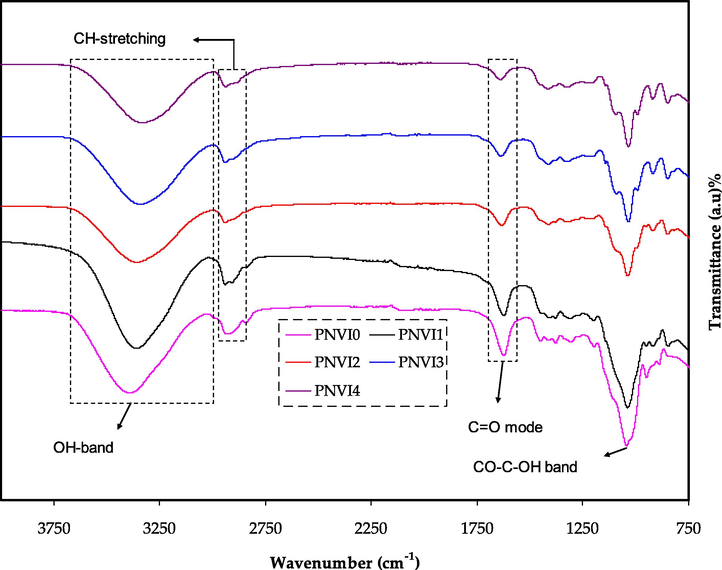
FTIR spectra for all plasticized electrolyte films. The strength of the peaks decreased as the glycerol concentration increased.
In the doped system, the C⚌O stretching of PVA at 1736 cm−1 is observed to be displaced to smaller wave number. This evidently demonstrates that the interaction between PVA and NaI is caused not just by the O—H groups of pure PVA, but also by the C—O groups (Yua et al., 2003). The interaction between the salt and C—H bond of the backbone of the polymer is revealed by the disappearance of the peaks. Furthermore, the lack of a week peak at 1701 cm−1 (identified as C—O stretching mode) indicates that the carbonyl functional group plays a role in proton transport in polymer complexes (Liew et al., 2015).
Changes in the vibrational spectra are also noticeable, the O—H stretching of PVA at 3315 cm−1 significantly decreased, along with the distinctive vibrational spectra modifications. At 1105 cm−1, it was accompanied by an increase in the (C—O) ester mode. Aldehydes are also linked to two major peaks in (C—H) extending at 2934 and 2862 cm−1. These and other FT-IR spectrum shifts illustrated in Fig. 3 reveal that there is strong cross-linking and acetal yields at the OH sites of PVA with aldehyde groups (—CHO) (Qiao et al., 2005).
3.2 XRD analysis
The results of XRD examination for various glycerol concentrations are shown in Fig. 4. A large XRD peak at 19.5° correlates to the amorphous form of pure PVA, according to previous observations (Malathi et al., 2010). The strength of the peak of PVA diminishes with the loading of salt concentration, and the wide nature of the peak is found to be increased in the current investigation (Hodge et al., 1996). The amorphous nature of the PEs is confirmed by this result. The amorphous appearance of the films is revealed by the broadening of the peak. Hodge et al. mentioned a relation between the degree of crystallinity and height of the peak, can be used to interpret these findings (Hodge et al., 1996; Hema et al., 2008). There are no further peaks in the plasticized system, indicating that the salt has completely dissociated in the polymer matrix. The amorphous nature of the PVA:MC:NaI:glycerol PEs was discovered as a result of the rupture of the PVA:MC crystallinity.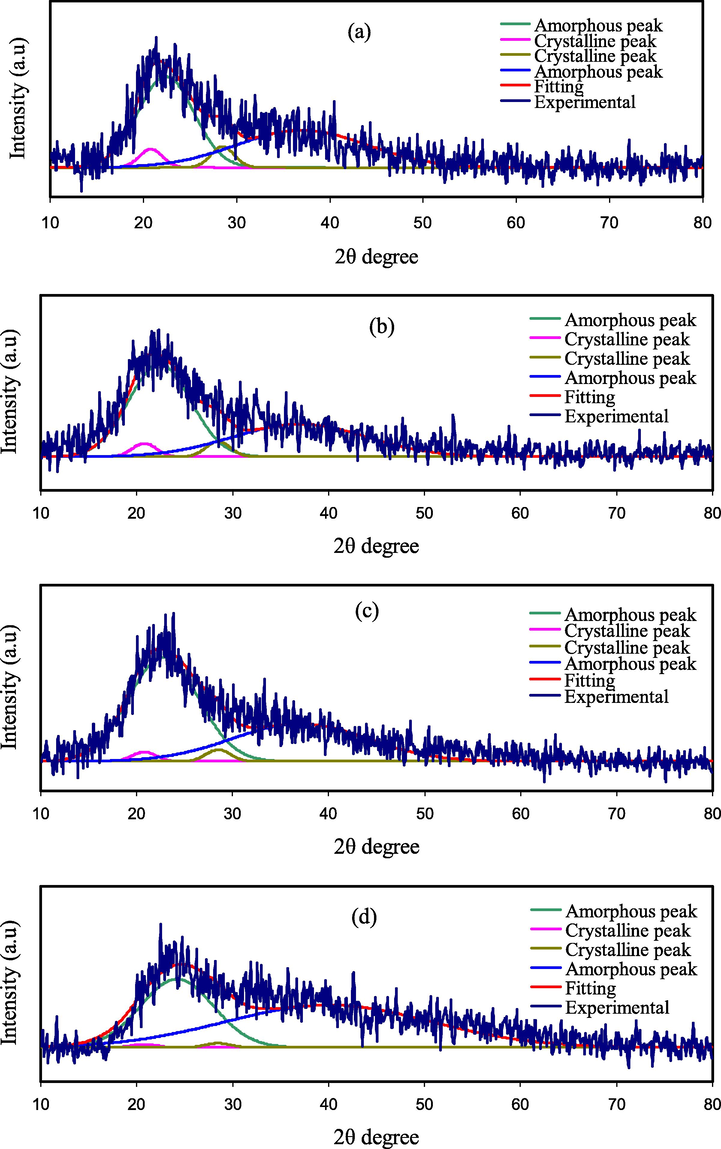
X-ray pattern for (a) PNVI1, (b) PNVI2, (c) PNVI3, and (d) PNVI4.
For some systems, this amorphous nature causes to increase ionic diffusion with high ionic conductivity (Bhargav et al., 2009; Ahad et al., 2012). As a result of the XRD investigation, the complex development in the polymer matrix is revealed. In the current study, the XRD pattern revealed two hallows and smaller crystalline peaks (Fig. 4). PVA:MC is not as crystalline as pure PVA, as evidenced by the wide hallows, and its structure is nearly amorphous (Aziz et al., 2010; Yusuf et al., 2016). According to earlier research, the amorphous structure of PEs is linked to wide diffraction peaks (Malathi et al., 2010; Nofal et al., 2021; Aziz, 2016). It is crucial to deconvolute the XRD pattern for each film to discover the areas of the crystalline and amorphous peaks in order to calculate the crystallinity degree (Aziz, 2016). Eq. (2) was used to calculate the degree of crystallinity (Xc), which is reported in Table 2 (Wan et al., 2003);
Electrolyte composition
Degree of crystallinity
PVNI1
8.378
PVNI2
6.40
PVNI3
3.93
PVNI4
1.25
3.3 Impedance study
The impedance spectra for the plasticized samples are shown in Fig. 5. Clearly, the conductivity improved as the glycerol content increases, reaching a maximum of 2.53 × 10⁻⁴ for a 40 wt% of glycerol. As shown in Table 3, the highest conductivity can be linked to the maximum amorphousness reported for this composition. Due to the minimal amount of free charge carriers in the electrolytes at low glycerol concentration, conductivity is low. The number density of charge carriers increases when the concentration of glycerol increases, which improves conductivity. It's possible that the low conductivity at low glycerol levels is due to the presence of neutral ion aggregates that do not participate to ionic conduction (Qiao et al., 2010; Hadi et al., 2020; Noor et al., 2014).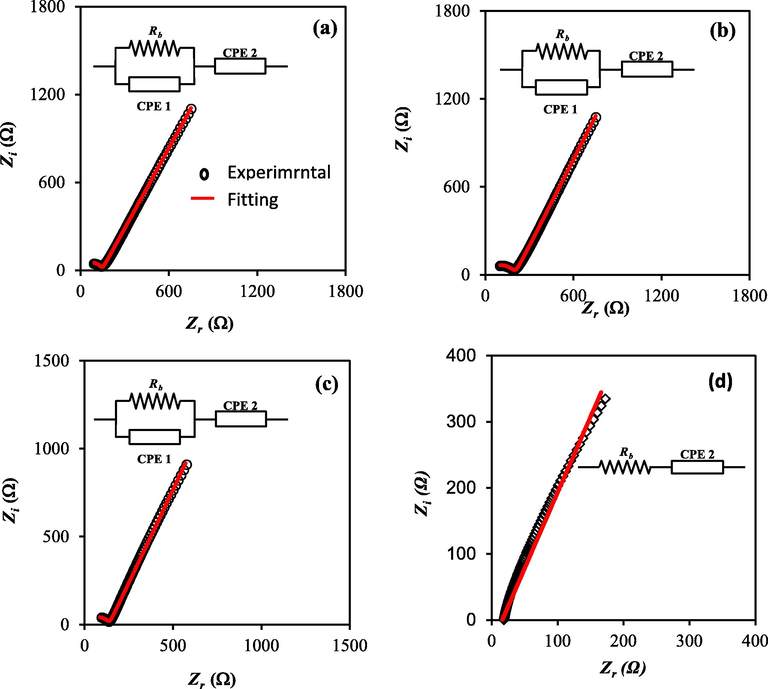
Impedance plot for (a) PNVI1, (b) PNVI2, (c) PNVI3, and (d) PNVI4.
Sample
CPE1
CPE2
σdc (S/cm)
PVNI1
1.11 × 10⁻⁸
6.13 × 10⁻⁶
1.07 × 10⁻⁴
PVNI2
3.33 × 10⁻⁸
5.56 × 10⁻⁶
7.98 × 1−5
PVNI3
5.00 × 10⁻⁸
5.81 × 10⁻⁶
1.11 × 10⁻⁴
PVNI4
1.00 × 10⁻⁵
2.53 × 10⁻⁴
The inclusion of plasticizers improves ionic conductivity by increasing segmental mobility (Noor et al., 2014; Girish Kumar and Munichandraiah, 2000). The membrane conductivity at ambient temperature was shown to be dependent on the glycerol concentration. Because of the hydrophilic nature of glycerol (Qiao et al., 2010), excess NaI may be able to stay fixed in the polymer matrix interspaces, resulting in increased conductivity.
The polymer chain, on the other hand, obtains quicker internal modes as the amorphous area grows, in which bond rotations cause segmental motion. As a result, hopping intra-chain and inter-chain movements are favored, and the polymer's conductivity rises (Bhargav et al., 2007). The experimental impedance data are simulated with electrical equivalent circuit (EEC) to verify our view, as shown in Fig. 5. The fitting parameters are also shown in Table 3. It is important to note that the semicircle has totally vanished for 40 wt% of glycerol in the high frequency region, as illustrated in Fig. 5(d).
It can be concluded the polymer host body only responds to the resistive component of the measured impedance spectrum (Samsudin and Isa, 2012). The electrical behavior of the system is represented in this example by the electrolyte film resistor in series with the capacitor of the double-layer capacitance.
As a result, the energy barrier is lowered, and ion movement is enhanced (Sahli and Bin Ali, 2012). The electrolyte conductivity is dependent on both the mobility and number of ions (Samsudin et al., 2011). Table 4 shows that as glycerol content increased, both diffusion and mobility increased. DC will improve by either increasing carrier density or increasing mobility. The system mechanism under study can be easily dealt with by fitting and analyzing experimental spectrum by the EEC method (Aziz et al., 2021b; Pradhan et al., 2011). Fig. 5 (a-d) shows the experimental impedance graphs for the electrolyte films. The electrical characteristics of solid-based electrolyte polymers may be calculated and understood using this approach.
Sample
D (cm2 s−1)
µ (cm2 V−1 s)
n (cm−3)
PVNI1
2.90 × 10⁻⁹
1.13 × 10⁻⁷
1.34 × 10²⁰
PVNI2
2.07 × 10⁻⁹
8.08 × 10⁻⁸
1.09 × 10²²
PVNI3
2.15 × 10⁻⁹
8.37 × 10⁻⁸
1.05 × 10²²
PVNI4
4.59 × 10⁻⁸
1.79 × 10⁻⁶
2.00 × 10²¹
In the high frequency region, two elements, Rb and CPE1, are obtained; put it differently, both are replied in the high frequencies, whilst CPE2 is linked to the low frequency spike region. The impedance of ZCPE can be calculated as (Aziz et al., 2019a; Shukur et al., 2014; Aziz et al., 2019b; Teo et al., 2012; Aziz et al., 2019c; Aziz and Abdullah, 2018):
CPE capacitance is denoted by C, angular frequency is represented by ω, and p in complex impedance graphs is related to the plot's displacement from the vertical axis.
It is worth noting that in the context of EEC modeling, CPE is the most usually used acronym instead of capacitor. It is possible to express the real (Zr) and imaginary (Zi) complex impedance (Z*) values for the PVNI1, PVNI2 and, PVNI3 systems in the analogous circuit using the following mathematical expression (Aziz et al., 2019a; Shukur et al., 2014; Aziz et al., 2019b; Teo et al., 2012; Aziz et al., 2019c):
Rb is the bulk resistance in this case. The impedance charts in the experiments are properly replicated using Eqs. (5) and (6), as seen in Fig. 5, and the EECs are shown in Fig. 5. Table 3 shows the blend electrolytes' corresponding circuit element properties. The whole conductivity, attributable to massive ion movement, is the reasonable justification for this outcome, where the semicircle vanished at the high frequency region for the PVNI4 system (Rajendran et al., 2008; Aziz et al., 2019d). The values of Zr and Zi are connected to the EEC in the PVNI4 system, and can be stated mathematically as (Aziz et al., 1994):
As the PVNI1, PVNI2, and PVNI3 systems composed of a tail and a semicircle, the diffusion coefficient (D), mobility (μ), and number density (n) of ions are determined by the given equations (Brza et al., 2021; Brza et al., 2020):
The D of the ions in PVNI1, PVNI2, and PVNI3 systems is obtained using the relation,
The µ of the ions is calculated using the relation of Nernst–Einstein,
Since σDC is shown by
So, the n of ions is determined using Eq. (11):
As the system of PVNI4 composed of only a tail, the D is determined using Eq. (12) (Brza et al., 2021; Brza et al., 2020):
Here is the electrolyte thickness, ωmin is the angular frequency corresponding to the minimum Zi. Table 4 shows the ion transport parameters for the polymer electrolyte systems.
Based on Table 4, the value of D is observed to increase (from 2.90 × 10⁻⁹ to 4.59 × 10⁻⁸ cm2 s−1) when the glycerol increased from 10 wt% to 40 wt%. The same trend is observed by μ as shown in Table 4. The increase of μ (from 1.13 × 10⁻⁷ to 1.79 × 10⁻⁶ cm2 V−1 s) and D is associated to the engagement of the polymer chains flexibility with the presence of glycerol while the number density of ions decreased (Brza et al., 2020). Glycerol was used in this work to improve the conductivity of ions owing to the three hydroxyl groups (OH) presence. The glycerol dielectric constant of 42.5 is considered to be large, which causes a decrease in the attraction force among the anions and cations of the salt, and among the polymer chains (Brza et al., 2020). The increase of the amorphous nature of the PE was considered to improve the ions mobility by creating a large free volume through the electrolyte. This causes the segmental movement of the polymer chains to increase due to the increase in the flexibility of the polymer chains. This can then improve the mobility and conductivity of the electrolyte systems (Brza et al., 2020; Yusof et al., 2019). When the glycerol increased, the values of D and μ increased which lead to the increase of conductivity. These results are in agreement with the results obtained from the FTIR test and the degree of crystallinity that measured from the XRD deconvolution.
3.4 Dielectric properties
By the following relationships, the real and imaginary parts of complex permittivity (ε*) were determined from the real (Z′) and imaginary (Z″) parts of complex impedance (Z*) (Nofal et al., 2020; Aziz and Abidin, 2015; Aziz and Abidin, 2014);
The frequency dependence of the complex dielectric constant for plasticized systems is seen in Figs. 6 and 7. By comparing with the other samples, the system incorporating 40 wt% glycerol has the uppermost dielectric constant. The high charge carrier concentration and the system amorphous nature can explain the increase in dielectric constant.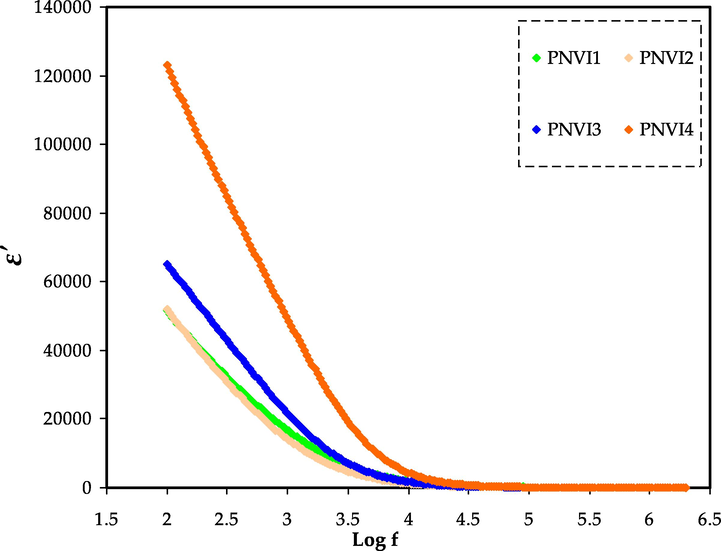
Dielectric constant v log (f) for all samples.
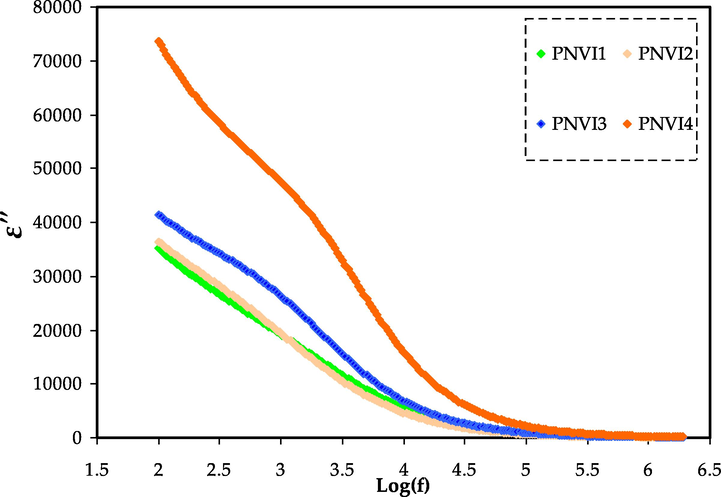
Dielectric loss v log (f) for all samples.
Both dielectric constant (ɛ′) and dielectric loss (ɛ″) drop with frequency, with the fall being rapid at low frequency and saturation appearing at high frequency, as shown in the figurers. In PEs, this is a common pattern (Hema et al., 2009; Hadi et al., 2020). This can be explained by the fact that the drop in ɛ′ and ɛ″ with frequency can be attributed to dipoles' incapability to rotate quickly, resulting in a lag among the frequency of the applied field and oscillating dipole.
The variance designates that the dielectric constant is high at low frequencies due to interfacial polarization, and the dielectric loss (ε″) increases dramatically due to free charge migration within the material. Values of ε′ have been shown to be high at low frequencies. The dielectric constant has been found to be constant at higher frequencies due to the space charge effect presence, which are supplied by the concentration of carriers close to the electrodes (Abdullah et al., 2021).
This is due to charge carriers' failure to follow the electric field periodic reversal. The migration of carriers within the material is responsible for the significant value of ε″. The fluctuation of ɛ′ was different for polar and nonpolar materials. Polar polymers have a high ɛ′, which varies depending on temperature and plasticizer. The ɛ′ value rises as the plasticizer content of polar materials increases, owing to the ease with, which dipoles can be oriented and the increased carriers mobility, which be likely to pass easily as the temperature rises (Bhargav et al., 2009; Ahad et al., 2012).
Moreover, the frequency reliance of the dielectric loss tangent (tan δ) for electrolytes can be determined in order to have a better understanding of the electrolyte relaxation processes.
As formerly affirmed, the Zr and Zi data were extracted from the EIS data and then employed to resolve the ɛ′ and ɛ″ data. The tan δ is calculated using the dielectric parameters. The tan δ, also called the dissipation factor, is a ratio of dispersed energy to stored energy in a periodic field. The tan δ is calculated using the formula below (Pawlicka et al., 2019).
Loss tangent peaks are used to study the relaxation processes of polymer materials in great detail. Dielectric relaxation can be used to depict the dipoles in polymer electrolytes (Aziz and Abdullah, 2018; Marf et al., 2020). At room temperature, Fig. 8 illustrates the dielectric relaxation of the loss tan δ vs. frequency curve for each film. The loss tangent peak shifts to a high-frequency area in the figure, indicating the dielectric relaxation existence.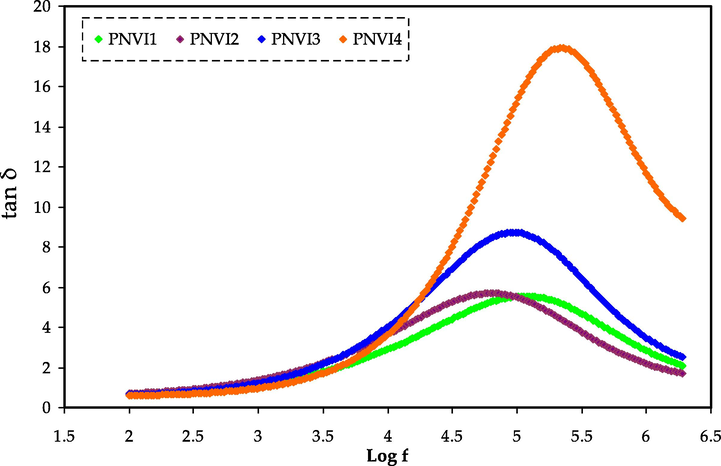
Tangent loss spectra versus frequency measured at ambient temperature for the PNVI electrolytes.
The conductivity and dielectric relaxation peaks are caused by induced or persistent dipoles, according to this research. Induced diploes were also shown to hide the polarization relaxation of charge carriers in a material. (Aziz and Abdullah, 2018; Woo et al., 2012). The peaks in Fig. 8 represent translational ion dynamics, which is linked to mobile ion conductivity relaxation. For ion transport, this is favorable in electrolyte segmental motion (Aziz and Abdullah, 2018). The tan δ appears to rise as the frequency increases, which is owing to the active element's (ohmic) dominance over the reactive element (capacitive).
In light of the events, the lowering of tan δ at a higher frequency is most likely due to the active element's independency from the frequency, causing the reactive element to grow in response (Idris et al., 2007). The non-Debye behavior of the system is suggested by the relaxation process of the electrolytes, which is depicted by the tan δ plot (Mustafa et al., 2020). Furthermore, the tan δ value at the highest frequency is known as the tan δ maximum, tan δmax value, which is used to calculate the angular frequency, ωpeak of the relaxation peak. As a result, each electrolyte's relaxation time (tr) may be estimated by inverting the ωpeak (1/ωpeak).
Because electrode polarization is linked to the generation of charges near the electrodes, the electrical modulus analysis (Singh et al., 2011) can also be utilized to evaluate the dielectric characteristics produced by ion relaxation.
Using the following relationships, the real (Z′) and imaginary (Z″) parts of complex electric modulus (M*) were computed from the real (Z′) and imaginary (Z″) parts of complex impedance (Z*) (Aziz et al., 2021c; Marzantowicz et al., 2007; Asnawi et al., 2020);
Fig. 9 and Fig. 10 show that the electrical modulus standards in both graphs stay around zero at low frequencies. The long tail seen at low frequencies shows that electrolytes have a capacitive characteristic in which substantial electrode polarization occurs without any dispersion (Pawlicka et al., 2019; Saminatha Kumaran et al., 2018).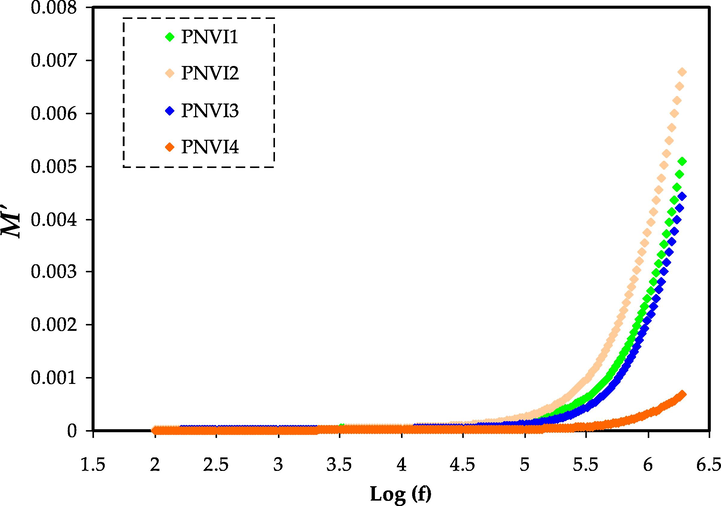
Electric modulus plot of M′ against log (f) for the PNVI samples.
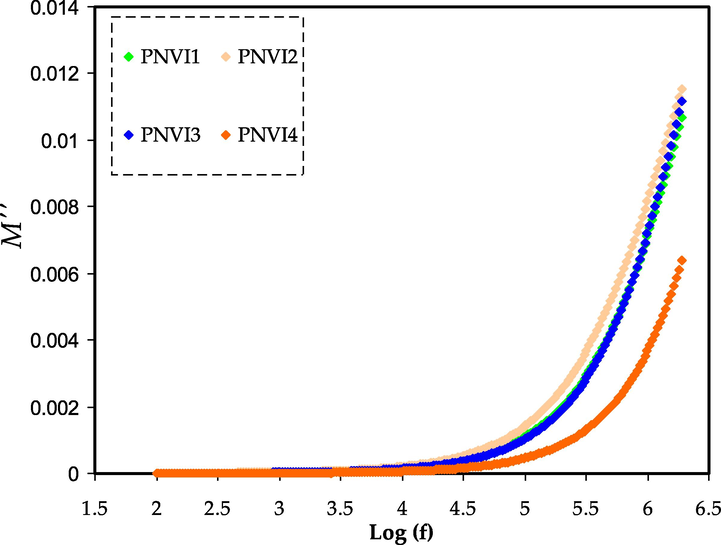
Electric modulus plot of M″ against log (f) for the PNVI samples.
The bulk effect reasons the M′ and M″ standards of the electrolytes to rise as the frequency increases. At high frequencies, the highest conducting electrolyte had the lowest electrical modulus values. Mustafa et al. and Saminatha Kumaran et al. have also reported similar observations (Mustafa et al., 2020; Saminatha Kumaran et al., 2018). Due to the irrelevant effect of electrode polarization, both M′ and M″ fall towards low frequencies. The enormous capacitance associated with the electrode causes the presence of a lengthy tail.
3.5 AC conductivity study
Fig. 11 shows the conductance spectra for plasticized systems with varying glycerol content. For three of the electrolytes, the spectra are divided into three regions: a low frequency dispersive zone, a plateau region, and a dispersive region at high frequency. Low frequency dispersion is detected at high glycerol content (40 wt%) because of electrode polarization effects.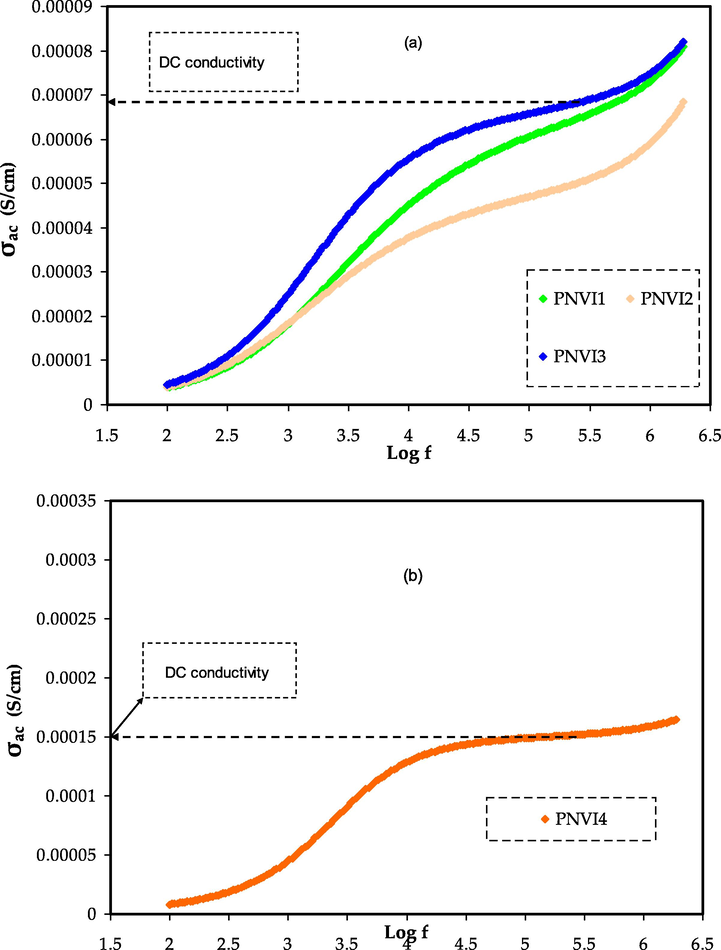
σdc (S. cm−1) versus log (f) for (a) PNVI1, PNVI2, and PNVI3 samples and (b) PNVI4 sample.
The ionic conductivity is high enough at this glycerol concentration to cause a development of charges at the electrode's surface, lowering the applied electric field effect through the samples and thus the apparent conductivity (Aziz et al., 2021d; Ramesh and Arof, 2001). The dc conductivity is represented by the plateau. The period of the field is very short to create charges at higher frequencies, hence the ac conductivity is assumed to have independent on frequency, which is equivalent to dc conduction.
When the frequency drops, more charge gathers at the electrode' surface resulting in a reduction in the number density of ions and, finally, a decline in conductivity at low frequencies. The mobility of carriers is significant in the high frequency area, thus conductivity rises with frequency (Ramesh and Arof, 2001). The dc conductivity increases as the temperature rises, implying that the free volume surrounding the polymer chains is responsible for ion and polymer segment mobility (Miyamoto and Shibayama, 1973).
4 Conclusion
The structure and electrical behavior of glycerol plasticized sodium ion-conducting SPEs comprising PVA-MC-NaI were characterized. The change in intensity, position, and shape of the FTIR peaks indicated the interaction and complexation between the electrolyte components. The XRD deconvolution revealed a decline of crystallinity upon increasing plasticizer. With increasing glycerol concentration, the amorphous nature seemed to increase, and their peak intensity has consistently dropped at 40 wt% glycerol. For the PNVI4 sample, the EIS revealed the highest ambient-temperature ionic conductivity of (2.53 × 10⁻⁴) S/cm. Electrical equivalence circuits (EEC) were used to explore the electrolytes' circuit components further. When glycerol concentrations were increased, the transport parameters of (n), (µ), and (D) improved. The conductivity patterns were further confirmed by a study of dielectric characteristics. In low-frequency regions, the dielectric constant ε′ and loss ε″ values were both found to be high. The presence of relaxation was demonstrated by the appearance of peaks in the loss tangent spectra at a specific frequency. When a large concentration of glycerol was introduced, the dielectric modulus was found to be lower.
Acknowledgments
We would like to acknowledge all support for this work by the University of Sulaimani, Charmo University, King Saud University, and Komar University of Science and Technology. The authors express their gratitude to the Researchers Supporting Project Number (RSP-2021/348), King Saud University, Riyadh, Saudi Arabia.
Declaration of Competing Interest
The authors declare that they have no known competing financial interests or personal relationships that could have appeared to influence the work reported in this paper.
References
- Structural and electrical properties of polyvinyl alcohol (PVA): Methyl cellulose (MC) based solid polymer blend electrolytes inserted with sodium iodide (NaI) salt. Arab. J. Chem.. 2021;14(11):103388
- [CrossRef] [Google Scholar]
- Structural, thermal, and electrical properties of Pva-sodium salicylate solid composite polymer electrolyte. J. Nanomater.. 2012;2012
- [CrossRef] [Google Scholar]
- Glycerolized Li+ ion conducting chitosan-based polymer electrolyte for energy storage EDLC device applications with relatively high energy density. Polymers (Basel). 2020;12(6):1-19.
- [CrossRef] [Google Scholar]
- The Study of Plasticized Sodium Ion Conducting Polymer Blend Electrolyte Membranes Based on Chitosan/Dextran Biopolymers: Ion Transport, Structural, Morphological and Potential Stability. Polymers. 2021;13:383.
- [Google Scholar]
- Structural, thermal and electrical characterizations of PVA:DMSO:NH4SCN gel electrolytes. Solid State Ionics. 2007;178(13–14):951-958.
- [CrossRef] [Google Scholar]
- Role of dielectric constant on ion transport: Reformulated Arrhenius equation. Adv. Mater. Sci. Eng.. 2016;2016
- [CrossRef] [Google Scholar]
- Non suitability of silver ion conducting polymer electrolytes based on chitosan mediated by barium titanate (BaTiO3) for electrochemical device applications. Electrochim. Acta. 2019;296:494-507.
- [CrossRef] [Google Scholar]
- Increase of metallic silver nanoparticles in Chitosan:AgNt based polymer electrolytes incorporated with alumina filler. Results Phys.. 2019;13(May):102326
- [CrossRef] [Google Scholar]
- Development of Polymer Blends Based on PVA:POZ with Low Dielectric Constant for Microelectronic Applications. Sci. Rep.. 2019;9(1):1-12.
- [CrossRef] [Google Scholar]
- Fabrication of energy storage EDLC device based on CS:PEO polymer blend electrolytes with high Li+ ion transference number. Results Phys.. 2019;15(July):102584
- [CrossRef] [Google Scholar]
- Crystalline and amorphous phase identification from the tanδ relaxation peaks and impedance plots in polymer blend electrolytes based on [CS:AgNt]x:PEO(x–1) (10 ≤ x ≤ 50) Electrochim. Acta. 2018;285:30-46.
- [CrossRef] [Google Scholar]
- Electrical and morphological analysis of chitosan:AgTf solid electrolyte. Mater. Chem. Phys.. 2014;144(3):280-286.
- [CrossRef] [Google Scholar]
- Ion-transport study in nanocomposite solid polymer electrolytes based on chitosan: Electrical and dielectric analysis. J. Appl. Polym. Sci.. 2015;132(15):1-10.
- [CrossRef] [Google Scholar]
- Bio-Based Plasticized PVA Based Polymer Blend Electrolytes for Energy Storage EDLC Devices: Ion Transport Parameters and Electrochemical Properties. Materials. 1994;2021:14.
- [Google Scholar]
- Effect of silver nanoparticles on the DC conductivity in chitosansilver triflate polymer electrolyte. Phys. B Condens. Matter. 2010;405(21):4429-4433.
- [CrossRef] [Google Scholar]
- PVA based gel polymer electrolytes with mixed iodide salts (K+I- and Bu4N+I-) for dye-sensitized solar cell application. Electrochim. Acta. 2015;182:217-223.
- [CrossRef] [Google Scholar]
- The study of plasticized amorphous biopolymer blend electrolytes based on polyvinyl alcohol (PVA): Chitosan with high ion conductivity for energy storage electrical double-layer capacitors (EDLC) device application. Polymers (Basel). 2020;12
- [CrossRef] [Google Scholar]
- Impedance, FTIR and transport properties of plasticized proton conducting biopolymer electrolyte based on chitosan for electrochemical device application. Results Phys.. 2021;29:104770
- [CrossRef] [Google Scholar]
- A polymer blend electrolyte based on cs with enhanced ion transport and electrochemical properties for electrical double layer capacitor applications. Polymers (Basel).. 2021;13:1-18.
- [CrossRef] [Google Scholar]
- Structural, electrical and electrochemical properties of glycerolized biopolymers based on chitosan (Cs): Methylcellulose (mc) for energy storage application. Polymers (Basel). 2021;13
- [CrossRef] [Google Scholar]
- Bio-Based Plasticized PVA Based Polymer Blend Electrolytes and Electrochemical Properties. Materials (Basel).. 2021;14:1994.
- [Google Scholar]
- Structural, electrical and optical characterization of pure and doped poly (vinyl alcohol) (PVA) polymer electrolyte films. Int. J. Polym. Mater. Polym. Biomater.. 2007;56(6):579-591.
- [CrossRef] [Google Scholar]
- Investigations on electrical properties of (PVA:NaF) polymer electrolytes for electrochemical cell applications. Curr. Appl. Phys.. 2009;9(1):165-171.
- [CrossRef] [Google Scholar]
- Structural, Ion Transport Parameter and Electrochemical Properties of Plasticized Polymer Composite Electrolyte Based on PVA: A Novel Approach to Fabricate High Performance EDLC Devices. Polym. Test.. 2020;106813
- [Google Scholar]
- Characteristics of a Plasticized PVA-Based Polymer Electrolyte Membrane and H+ Conductor for an Electrical Double-Layer Capacitor. Membranes. 2021;11:296.
- [Google Scholar]
- Characterization of chitosan/PVA blended electrolyte doped with NH 4I. J. Non. Cryst. Solids. 2011;357(16–17):3261-3266.
- [CrossRef] [Google Scholar]
- Effect of plasticizers on magnesium-poly(ethyleneoxide) polymer electrolyte. J. Electroanal. Chem.. 2000;495(1):42-50.
- [CrossRef] [Google Scholar]
- Electrochemical impedance study of proton conducting polymer electrolytes based on PVC doped with thiocyanate and plasticized with glycerol. Int. J. Electrochem. Sci.. 2020;15:4671-4683.
- [Google Scholar]
- Investigation of ion transport parameters and electrochemical performance of plasticized biocompatible chitosan-based proton conducting polymer composite electrolytes. Membranes (Basel). 2020;10:1-27.
- [CrossRef] [Google Scholar]
- Design of plasticized proton conducting Chitosan: Dextran based biopolymer blend electrolytes for EDLC application: Structural, impedance and electrochemical studies. Arab. J. Chem.. 2021;14:103394
- [CrossRef] [Google Scholar]
- Structural, vibrational and electrical characterization of PVA-NH4Br polymer electrolyte system. Phys. B Condens. Matter. 2008;403(17):2740-2747.
- [CrossRef] [Google Scholar]
- FTIR, XRD and ac impedance spectroscopic study on PVA based polymer electrolyte doped with NH4X (X = Cl, Br, I) J. Non. Cryst. Solids. 2009;355(2):84-90.
- [CrossRef] [Google Scholar]
- Water absorption and states of water in semicrystalline poly(vinyl alcohol) films. Polymer (Guildf). 1996;37(8):1371-1376.
- [CrossRef] [Google Scholar]
- Dielectric spectra of LiTFSI-doped chitosan/PEO blends. Ionics (Kiel). 2007;13(4):213-217.
- [CrossRef] [Google Scholar]
- FTIR studies of plasticized poly(vinyl alcohol)-chitosan blend doped with NH4NO3 polymer electrolyte membrane. Spectrochim. Acta - Part A Mol. Biomol. Spectrosc.. 2011;78(3):1068-1074.
- [CrossRef] [Google Scholar]
- Effect of plasticizers (water and glycerol) on the diffusion of a small molecule in iota-carrageenan biopolymer films for edible coating application. Biomacromolecules. 2006;7(6):2011-2019.
- [CrossRef] [Google Scholar]
- Electrical and structural studies of ionic liquid-based poly(vinyl alcohol) proton conductors. J. Non. Cryst. Solids. 2015;425:163-172.
- [CrossRef] [Google Scholar]
- Structural, thermal and electrical properties of PVA-LiCF3SO3 polymer electrolyte. J. Non. Cryst. Solids. 2010;356(43):2277-2281.
- [CrossRef] [Google Scholar]
- Structural, morphological, electrical and electrochemical properties of PVA: CS-based proton-conducting polymer blend electrolytes. Membranes (Basel). 2020;10(4):1-25.
- [CrossRef] [Google Scholar]
- Conductivity and dielectric properties of polymer electrolytes PEO:LiN(CF3SO2)2 near glass transition. J. Non. Cryst. Solids. 2007;353:4467-4473.
- [CrossRef] [Google Scholar]
- Progress in bio-based plastics and plasticizing modifications. J. Mater. Chem. A. 2013;1(43):13379-13398.
- [CrossRef] [Google Scholar]
- Free-volume model for ionic conductivity in polymers. J. Appl. Phys.. 1973;44(12):5372-5376.
- [CrossRef] [Google Scholar]
- Electrochemical characteristics of glycerolized PEO-based polymer electrolytes. Membranes (Basel). 2020;10(6):1-16.
- [CrossRef] [Google Scholar]
- Synthesis of porous proton ion conducting solid polymer blend electrolytes based on PVA: CS polymers: Structural, morphological and electrochemical properties. Materials (Basel).. 2020;13:1-21.
- [CrossRef] [Google Scholar]
- A study of methylcellulose based polymer electrolyte impregnated with potassium ion conducting carrier: Impedance, eec modeling, ftir, dielectric, and device characteristics. Materials (Basel).. 2021;14
- [CrossRef] [Google Scholar]
- Polymer composites with 0.98 transparencies and small optical energy band gap using a promising green methodology: Structural and optical properties. Polymers (Basel). 2021;13:1648.
- [CrossRef] [Google Scholar]
- An optimized poly(vinylidene fluoride-hexafluoropropylene)-NaI gel polymer electrolyte and its application in natural dye sensitized solar cells. Electrochim. Acta. 2014;121:159-167.
- [CrossRef] [Google Scholar]
- A dynamic mechanical and thermal analysis of unplasticized and plasticized poly(vinyl alcohol)/methylcellulose blends. J. Appl. Polym. Sci.. 2001;80(10):1825-1834.
- [CrossRef] [Google Scholar]
- Dielectric behavior and FTIR studies of xanthan gum-based solid polymer electrolytes. Electrochim. Acta. 2019;305:232-239.
- [CrossRef] [Google Scholar]
- Effect of plasticizer on structural and electrical properties of nanocomposite solid polymer electrolytes. Ionics (Kiel). 2011;17(2):127-134.
- [CrossRef] [Google Scholar]
- New highly proton conductive polymer membranes poly(vinyl alcohol)-2-acrylamido-2-methyl-1-propanesulfonic acid (PVA-PAMPS) J. Mater. Chem.. 2005;15(41):4414-4423.
- [CrossRef] [Google Scholar]
- Alkaline solid polymer electrolyte membranes based on structurally modified PVA/PVP with improved alkali stability. Polymer (Guildf). 2010;51(21):4850-4859.
- [CrossRef] [Google Scholar]
- Synthesis and impedance analysis of proton-conducting polymer electrolyte PVA:NH4F. Ionics (Kiel). 2013;19(10):1437-1447.
- [CrossRef] [Google Scholar]
- Investigations on the effect of various plasticizers in PVA-PMMA solid polymer blend electrolytes. Mater. Lett.. 2004;58(5):641-649.
- [CrossRef] [Google Scholar]
- Investigations on PVC/PAN composite polymer electrolytes. J. Memb. Sci.. 2008;315(1–2):67-73.
- [CrossRef] [Google Scholar]
- Ionic conductivity studies of plasticized poly(vinyl chloride) polymer electrolytes. Mater. Sci. Eng. B Solid-State Mater. Adv. Technol.. 2001;85(1):11-15.
- [CrossRef] [Google Scholar]
- Novel colloidal nanofiber semiconductor electrolytes from solution blends of PVA/ODA-MMT, poly (itaconic anhydride-alt-2-vinyl-1,3-dioxalan) and its Ag-carrying polymer complex by reactive electrospinning. Colloids Surf. A Physicochem. Eng. Asp.. 2016;492:26-37.
- [CrossRef] [Google Scholar]
- Effect of lithium triflate salt concentration in methyl cellulose-based solid polymer electrolytes. CHUSER 2012–2012 IEEE Colloq. Humanit. Sci. Eng. Res. No. Chuser 2012:739-742.
- [CrossRef] [Google Scholar]
- The conductivity and dielectric studies of solid polymer electrolytes based on poly (acrylamide-co-acrylic acid) doped with sodium iodide. Ionics (Kiel). 2018;24(7):1947-1953.
- [CrossRef] [Google Scholar]
- Characterization of carboxy methylcellulose doped with DTAB as new types of biopolymer electrolytes. Bull. Mater. Sci.. 2012;35(7):1123-1131.
- [CrossRef] [Google Scholar]
- Investigation of the potential of proton-conducting biopolymer electrolytes based methyl cellulose-glycolic acid. Int. J. Polym. Anal. Charact.. 2011;16(7):477-485.
- [CrossRef] [Google Scholar]
- Effect of irradiation on poly(3,4-ethylenedioxythiophene): poly(styrenesulfonate) nanofiber conductivity. Polymer (Guildf). 2013;54(2):737-742.
- [CrossRef] [Google Scholar]
- Synthesis of highly stable and high water retentive functionalized biopolymer-graphene oxide modified cation exchange membranes. RSC Adv.. 2015;5(70):56498-56506.
- [CrossRef] [Google Scholar]
- Transport studies of NH4NO3 doped methyl cellulose electrolyte. Synth. Met.. 2010;160(9–10):1040-1044.
- [CrossRef] [Google Scholar]
- Electrical characterization of corn starch-LiOAc electrolytes and application in electrochemical double layer capacitor. Electrochim. Acta. 2014;136:204-216.
- [CrossRef] [Google Scholar]
- Present status of solid state photoelectrochemical solar cells and dye sensitized solar cells using PEO-based polymer electrolytes. Adv. Nat. Sci.: Nanosci. Nanotechnol. 2011:023002.
- [CrossRef] [Google Scholar]
- Conductivity and dielectric studies of Li2SnO3. Ionics (Kiel). 2012;18(7):655-665.
- [CrossRef] [Google Scholar]
- Role of plasticizers in bioplastics. MOJ Food Process. Technol.. 2019;7(4):128-130.
- [CrossRef] [Google Scholar]
- Synthesis, characterization and ionic conductive properties of phosphorylated chitosan membranes. Macromol. Chem. Phys.. 2003;204(5–6):850-858.
- [CrossRef] [Google Scholar]
- Dielectric properties and morphology of polymer electrolyte based on poly(ε-caprolactone) and ammonium thiocyanate. Mater. Chem. Phys.. 2012;134(2–3):755-761.
- [CrossRef] [Google Scholar]
- Preparation and properties of poly(vinyl alcohol)-clay nanocomposite materials. Polymer (Guildf). 2003;44(12):3553-3560.
- [CrossRef] [Google Scholar]
- Plasticized solid polymer electrolyte based on natural polymer blend incorporated with lithium perchlorate for electrical double-layer capacitor fabrication. Ionics 2019
- [CrossRef] [Google Scholar]
- From crab shell to solar cell: A gel polymer electrolyte based on N-phthaloylchitosan and its application in dye-sensitized solar cells. RSC Adv.. 2016;6(33):27714-27724.
- [CrossRef] [Google Scholar]


