Translate this page into:
Gravimetric, electrochemical, and morphological studies of an isoxazole derivative as corrosion inhibitor for mild steel in 1M HCl
⁎Corresponding authors. drjeenataslam@outlook.com (Jeenat Aslam), jaslam@taibahu.edu.sa (Jeenat Aslam), drrubyaslam@gmail.com (Ruby Aslam)
-
Received: ,
Accepted: ,
This article was originally published by Elsevier and was migrated to Scientific Scholar after the change of Publisher.
Peer review under responsibility of King Saud University.
Abstract
In present study, an isoxazole derivative, namely, (Z)-4-(4-hydroxy-3-methoxybenzylidene)-3-methylisoxazol-5(4H)-one referred here as (IOD) has been studied as an environment-friendly corrosion inhibitor for mild steel (MS) in acidic medium (1 M HCl). The present work was investigated by gravimetric, electrochemical impedance spectroscopy (EIS), potentiodynamic polarization (PDP), fourier-transform infrared (FT-IR) spectroscopy techniques. Atomic force microscopy (AFM), scanning electron microscopy (SEM), and energy-dispersive X-ray spectroscopy (EDS) confirmed the surface morphologies of the MS surface with and without IOD in the acid medium. The inhibition efficiency (I.E.) of IOD was increased by rising its concentration attaining maximum value (96.6%) at 300 ppm at 30 °C and decreases with increasing temperature from 30 °C to 60 °C. The adsorption of studied inhibitor followed Langmuir adsorption isotherm model. The PDP study revealed that the IOD acts as a mixed-type inhibitor with predominating anodic effect. The EIS study confirmed that increasing IOD concentration enhances the charge transfer resistance (Rct) and then reduces the double layer capacitance (Cdl) owing to the development of a protective layer on the MS surface.
Keywords
Metal corrosion
Acid inhibition
Eco-friendly compound
Mix-type inhibitor
Electrochemical study
1 Introduction
Corrosion is commonly described as the deterioration of a metal caused by the reaction with environment. Hence, corrosion could cause very harmful and costly damage to petrochemical industries, public buildings, and bridges. In 2016, the NACE international revealed the “International measures of prevention, application and economics of corrosion technology (IMPACT)” study, in which it was declared that the global annual cost of corrosion was around US $ 2.5 trillion, which is approximately 3.4% of the world wide gross domestic product (GDP) (Koch et al., 2016).
Mild steel (MS) is one of the materials that are used broadly in manufacturing tools associated to industrial applications for example petrochemical production systems, oil pipes and tanks, power plants etc. Though, it has the drawback of weak susceptibility against corrosion in aggressive conditions and demands to be protected to ensure a viable lifespan (Kowsari et al., 2014). Many acids such as HCl and H2SO4, or H3PO4 are readily used as pickling agents for metals' surface cleaning in order to remove unwanted scales and corrosion dust. Unfortunately, these acidic solutions are corrosive which cause serious damage to the metal, causing its degradation, and thus reducing its lifetime (EIS, 2006). Numerous scientists and scholars seek to discover logical solutions to decrease its corrosion and give the optimal protection (Finsgar and Jackson, 2014). Among them corrosion inhibitors are used widely to protect the MS surface from corrosion in aggressive media. The corrosion inhibitors are inorganic or organic compounds which are used in small amount to retard the corrosion rate substantially (Goyal and Kumar, 2018). When inhibitor is added in the aggressive media, it protects the MS surface from corrosion by adsorbing on the surface of MS thus making a barrier for charge and mass transfer. Inhibitors exhibit an increasing trend in corrosion protection efficiency of metal while increasing the concentration of inhibitor in corrosive medium. This can be clarified via the fact that on raising the inhibitor concentration, larger fraction of MS surface gets occupied by the inhibitor molecules. But this happens up to certain optimum concentration because of a saturation point is reached and further increase in inhibitor concentration makes an insignificant change in the inhibition performance (Kaya et al., 2016).
Generally, an efficient corrosion inhibitor should be nontoxic, easy electron donor and cost-effective (Ye et al., 2020; Ye et al., 2020). Especially, molecules with electron–rich π– bonds, —NH2, —SH and —OH groups with high electron density make it easy to adsorb on the metallic surface and form thin protective film that saturates the active sites and slows down the process of anodic and cathodic reactions on the mild steel surface. However, traditional inhibitors showed drawbacks such as toxicity and risky effects. Therefore, the researches on green and eco-friendly corrosion inhibitors have been oriented towards effective and less expensive molecules with minimum impact on the environment (Ye et al., 2020; Yea et al., 2019; Ye et al., 2020; Lin and Zuo, 2019). In this regard, more studies have focused on a variety of compounds such as schiff bases, triazepines, thio-semicarbazones, hydroxyquinoline derivatives, amino acids, triazole, imidazole, pyrazoline, oxazole derivatives and natural plant extracts (Ansari and Quraishi, 2014; El Kacimi et al., 2018; Idouhli et al., 2018; Rbaa et al., 2018; Mobin et al., 2019; Mobin et al., 2016; Lgaz et al., 2020; El-Hajjaji et al., 2018; Paul et al., 2020; Saraswat et al., 2020; Shaw et al., 2019). Among them isoxazoles and its derivatives can be proved as a potential corrosion inhibitor. This is because of their polar groups and their capability to complex with the metal surface, which make them likely to reinforce the adsorption on the metal surfaces in aggressive media. Moreover, they possess various antitubercular, antiviral, antibacterial activities (Alagawadi et al., 2005; Tyrkov and Sukhenko, 2004; Brahmayya et al., 2013; Zhou et al., 2010). Isoxazoles have also been reported as herbicides (Reddy et al., 2013; Parveen et al., 2020). All these properties manifested their anti-toxic nature.
In the present study, weight loss and electrochemical measurements have been performed on MS in hydrochloric acid medium with isoxazole derivative namely, (Z)-4-(4-hydroxy-3-methoxybenzylidene)-3-methylisoxazol-5(4H)-one, referred as, IOD; to study the corrosion inhibition behavior. These methods help in calculating the inhibition efficiency and corrosion rate. To finish the experimental procedures, the state of inhibitor adsorption is observed via studying the immersion time, concentration, and temperature effects. FT-IR study was done to ensure the functional groups responsible for the adsorption. Also, morphological studies for the metal surface are carried out using atomic force microscopy (AFM), scanning electron microscopy (SEM) coupled to energy dispersive X-ray spectroscopy (EDS) methods to describe the surface roughness, film formation, and morphology of the observed MS specimens when they are uninhibited and inhibited.
2 Experimental section
2.1 Materials & methods
2.1.1 Preparation of MS samples for corrosion measurements
All the experimental results were done on the mild steel (ASTM A1020) samples possessing the chemical composition in % wt.: C-0.061, P-0.017, Mn-0.181, Mo-0.053, Cr-0.035, V-0.033, Al-0.017. The mild steel samples of the dimension 2.5 × 2 × 0.1 cm3 (exposed surface area-10.9 cm2) were used for the gravimetric measurements. The spherical samples with the exposed surface area of 1 cm2 were used for electrochemical measurements. All the samples were mechanically polished with emery papers of grades (320, 400, 600 and 1200). Then the polished MS samples were cleaned with deionized water, degreased with alcohol and acetone (AR grade) and lastly dried in the warm air.
2.1.2 Test solution preparation
The test solution of 1 M HCl was prepared from the dilution of 37% HCl (AR grade) by deionized water. Using 1 M HCl, various concentrations of IOD in the range of 50–300 ppm was prepared.
2.2 Synthesis method of IOD
To a mixture of 0.5 mmol of sodium acetate in aq. C2H5OH and 5.5 mmol of hydroxylamine hydrochloride taken in 100 ml round bottom flask, 5 mmol of ethyl acetoacetate and 4–5 mmol of hydroxy-3-methoxy benzaldehyde were added. The reaction mixture was stirred for 30 min at room temperature. The reaction was observed by TLC. Then the reaction mixture was gradually poured into ice water. Stirring is continued a few minutes more and then mixture was filtered. Furthermore, the purification was carried out via recrystallization from chloroform-methanol mixture (Scheme 1). IOD structure was elucidated by the elemental analysis, 1H NMR and FT-IR spectroscopy (Parveen et al., 2020). 1H NMR spectra of compound is given in Fig. 1.
Schematic representation of the synthesis procedure of IOD.
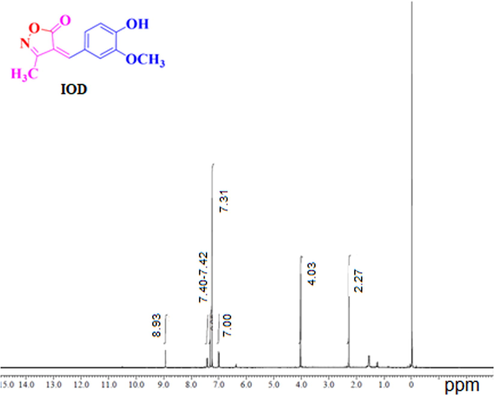
1H NMR spectra for IOD.
Anal. Calcd. for C12H11NO4: 61.80, C; 4.75, H; 6.01, N; 27.44, O; found: 61.78, C; 4.72, H; 5.99, N; 27.40, O.
1H NMR (400 MHz, DMSO-d6, δ, ppm): 2.27 (s, 3H, —CH3), 4.03 (s, 3H, —OCH3), 7.00 (d, 1H, —ArH, J = 8 Hz), 7.40–7.42 (dd, 2H, —ArH, J = 8 Hz), 7.31 (s, 1H, ⚌CH), 8.93 (s, 1H, —OH).
FT-IR (KBr cm−1): 3417 (—OH); 3082 (⚌CH); 2849 (—CH); 1704 (C⚌O); 1558, 1499 (C⚌C); 1386, 1196 (C—O).
2.3 Gravimetric measurements
The initial weights of the prepared polished coupons were recorded. The coupons were dipped in 250 ml test solution (1 M HCl) and solution of various concentrations of IOD prepared in 1 M HCl solution for 6 h of duration at 30 °C. Further, the optimum concentration was chosen to report the effect of temperatures from 40 °C to 60 °C on the inhibition efficiency (I.E.) of mild steel imparted by the IOD. After 6 h, MS samples were taken out, and the corrosion product formed on the metal surface was mechanically cleared by scrubbing using a nylon brush under running water following standard procedure (Practice, 1999). Then coupons were washed with deionized water and ethanol/acetone mixture and finally dried to record their final weight loss. The weight loss (ΔW) was calculated by the results of subtraction between initial and final weights. Average corrosion rates were computed from taking the average of the triplicate sets. The corresponding standard deviation is also reported. The calculation of corrosion rate (υ), surface coverage (θ) and % I.E. were done using the following equations:
2.4 Electrochemical measurements
A conventional three electrode cell assembly was used to perform the electrochemical analysis. The tests were carried out with the help of Autolab Potentiostat/Galvanostat Model 128 N and the result interpretations were carried out on NOVA 2.1 software. In the present study, Ag/AgCl saturated with KCl as a reference electrode, Pt wire as counter electrode and MS coupon as working electrode. The disc shaped MS coupons with an exposed area of 1 cm2 were embedded in polytetrafluoroethylene (PTFE). Before commencement of any measurement, the coupon was maintained in a test solution for 30 min to achieve a stable open circuit potential (OCP). All the measurements were recorded at 30 °C. The electrochemical impedance was carried out between frequency 10−2 to 105 Hz having 10 mV perturbation. Nyquist plots obtained was used to calculate the charge transfer resistance (Rct) which ultimately used to calculated inhibition efficiency. The polarization plots were derived by changing the potential from −250 mV to 250 mV at the scan rate of 0.1 mV s−1.
2.5 FT-IR analysis
FT-IR spectra of pure IOD and the IOD adsorbed on the MS surface (Fe2+-IOD) was obtained using a Perkin Elmer Spectrum instrument after 6 h immersion in 1 M HCl in the range of 400 to 4000 cm−1. The film scrapped from the MS surface was combined with KBr and modified into pellets for the adsorbed (Fe2+-IOD) inhibitor spectrum.
2.6 Surface analysis- AFM/SEM/EDS
To compare the extent of damage caused by the corrosion on the MS surface, the pre-cleaned MS coupons were immersed for 6 h in uninhibited and inhibited solution of 300 ppm of IOD at 30 °C. Subsequently retrieved and properly rinsed with double distilled water, air-dried, and submitted for the surface examination under AFM/SEM/EDS studies. The AFM micrographs of MS in uninhibited and inhibited media were taken employing AFM-Dimension icon ScanAsyst equipped with Nanoscope V. The measurement was carried out at room temperature in tapping mode in the air and a scan rate of 0.4 Hz with scanning area 50 × 50 μm. JEOL SEM instrument with model: JSM-6510LV along with EDS attachment of model INCA, Oxford was utilized.
3 Results and discussion
3.1 Gravimetric measurements
3.1.1 Effect of acid and inhibitor concentration on I.E.
Table 1 is showing the values of corrosion rates of MS along with inhibition efficiency of IOD in 1 M HCl corrosive solution at 30 °C without and with different concentration of IOD. It can be observed from the table that the speed of MS dissolution declines and % I.E. increases with rise in all inhibitor concentrations used in the study i.e. 50–300 ppm (Fig. 2(a)). It happens because of the more coverage of the vulnerable surface of MS from the aggressive corroding medium. Maximum I.E. (96.62%) exhibited at 300 ppm concentration by IOD in 1 M HCl. It is clear from Table 1 that the corrosion rate is reduced from 0.149 (mg cm−2h−1) to 0.005 (mg cm−2h−1) on the addition of 300 ppm of IOD. This may be due to the protective film formation over the mild steel by the adsorption of IOD molecules.
C
(ppm/M)υ
(mg cm−2h−1)θ
I.E. (%)
0
0.149 ± 0.0021
----
----
50/2.1 × 10−4
0.0625 ± 0.0011
0.580
58.1
100/4.2 × 10−4
0.0439 ± 0.0004
0.712
71.2
150/6.4 × 10−4
0.0290 ± 0.0003
0.805
80.5
200/8.5 × 10−4
0.0150 ± 0.0001
0.898
89.8
250/1.0 × 10−3
0.0062 ± 0.0001
0.958
95.8
300/1.2 × 10−3
0.0050 ± 0.0001
0.966
96.6
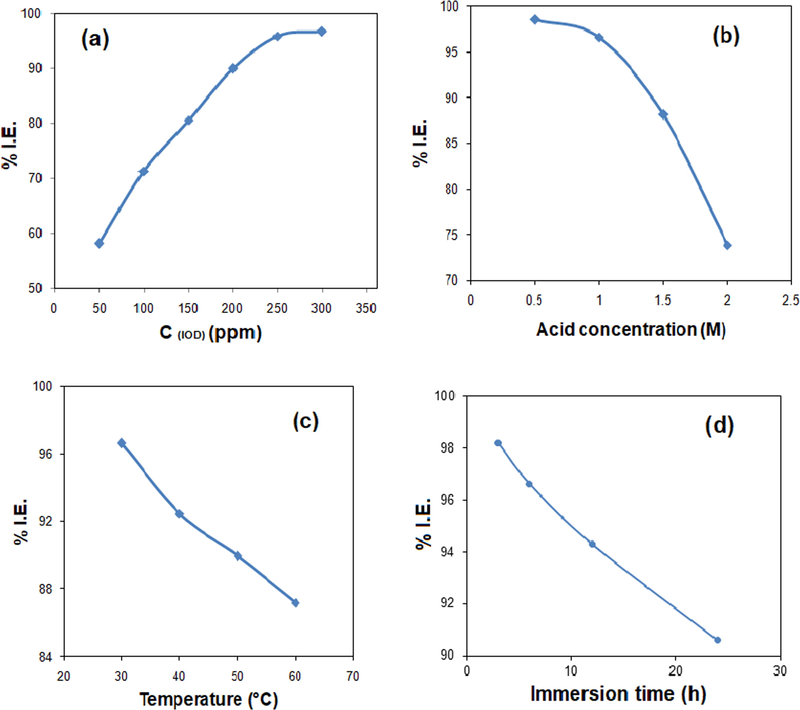
Variation of I.E. for MS corrosion with different concentrations of (a) IOD in 1 M HCl at 30 °C after 6 h immersion, (b) different acid concentration at 300 ppm IOD at 30 °C after 6 h immersion, (c) different temperature range at 300 ppm IOD after 6 h immersion in 1 M HCl and (d) different immersion time at 300 ppm IOD in 1 M HCl at 30 °C.
The variation of %I.E. with rise in acid concentration from 0.5 to 2 M is displayed in Fig. 2(b). It is evident that the variation in acid concentration from 0.5 to 2 M, I.E. differs from 98.5% to 73.8%. This variation in the I.E. offers that the compound is effective corrosion inhibitor up to 1 M HCl.
3.1.2 Temperature effect on I.E.
The effect of solution temperature on %I.E. is presented in Fig. 2(c) in the presence of 300 ppm of IOD. It is observed that %I.E. of IOD reduces with the rise in solution temperature from 30 to 60 °C. Decreases in %I.E. on increasing the temperature of the corrosive medium implies that on increasing the temperature, inhibitor molecules gets desorbed from the MS surface (Lgaz et al., 2020).
3.1.3 Immersion time effect on I.E.
The immersion time effect on the %I.E. is revealed in Fig. 2(d). It is found that the I.E. reduces from 98.2% to 90.6% with rise in immersion time from 3 to 24 h. This observation suggests that desorption of inhibitor takes place with rise in immersion time.
3.2 Adsorption isotherm
Adsorption isotherms models were used by several authors to probe the adsorption mechanism and interaction strength of inhibitor molecule on the metal surface. Generally there are various adsorption isotherm models (Mobin and Aslam, 2017); choice of the preferred model for a system is usually accomplished by making use of the linear regression coefficient (R2) value. For an ideal situation, R2 = 1. In the present study, Langmuir adsorption isotherm was observed to be the preferred model that explains the adsorption method of IOD on the MS surface. R2 value obtained from the linear plot of C/θ vs. C (Fig. 3) was near unity. This adsorption isotherm suggests that there is a mutual interaction among the adsorbed molecules and the adsorption energy is dependent on the surface coverage (θ). So, it could be summarized that the IOD molecules occupies more than one adsorption sites on the surface of MS. Langmuir adsorption isotherm has the form (Bashir et al., 2018):
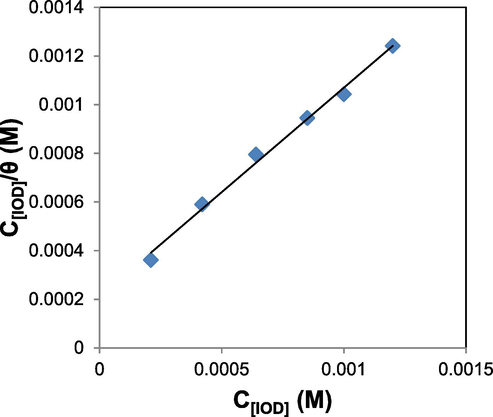
Langmuir adsorption isotherm for IOD adsorption on MS in 1 M HCl solution.
The calculated values of Kads and ΔG⁰ads are shown in Table 2. Normally, the values of ΔG⁰ads ≤ − 20 kJ/mol are assigned for the occurrence of electrostatic interactions between inhibitor molecules and the charged metal surface (physisorption). Moreover, the values of ΔG⁰ads ≥ − 40 kJ/mol suggests charge sharing or charge transferring from an organic molecule to the metal surface to form a coordinate type bond (chemisorption) (Özkır et al., 2012). In the current study, the calculated ΔG⁰ads value is ≥ − 40 kJ/mol, suggesting chemisorption (Saraswat et al., 2020; Fouda et al., 2009). Moreover, the negative ΔG°ads value supports the spontaneous adsorption of the studied inhibitor on MS surface (Saraswat et al., 2020).
R2
Slope
Kads (mol−1L)
ΔG°ads (KJ mol−1)
0.995
0.868
5000
−31.57
3.3 Electrochemical spectroscopy
3.3.1 EIS study
EIS has been conducted to know the kinetics of the process occurring at metal-solution interface in inhibited as well as in uninhibited medium. The data attained from EIS measurement is used to construct the Nyquist and Bode plots shown in Fig. 4(a–c), respectively. The diameter of capacitive loop along with the values of impedance magnitude and phase angle (Fig. 4(a-c)) significantly rises with raising the inhibitor concentrations, representing better protection of inhibitor. The designed equivalent circuit for the fitting of the impedance data is given in Fig. 4(d), here Rct, Rs and Cdl represents charge transfer resistance, solution resistance and double layer capacitance, respectively. The fitting standard of equivalent circuit was checked by the chi-square (χ2) values. Generally the values of χ2 among 10−3 and 10−5 suggests an ideal fit (Lgaz et al., 2020; Saraswat et al., 2020). The proposed equivalent circuit provided fairly small (<1 × 10⁻³) χ2 values, suggesting satisfactory fitting of obtained impedance spectra to proposed equivalent circuit. The derived (Rs, Rct) impedance parameters from this circuit and computed (Cdl, %I.E.) parameters are recorded in Table 3. The %I.E. was calculated by following equation.
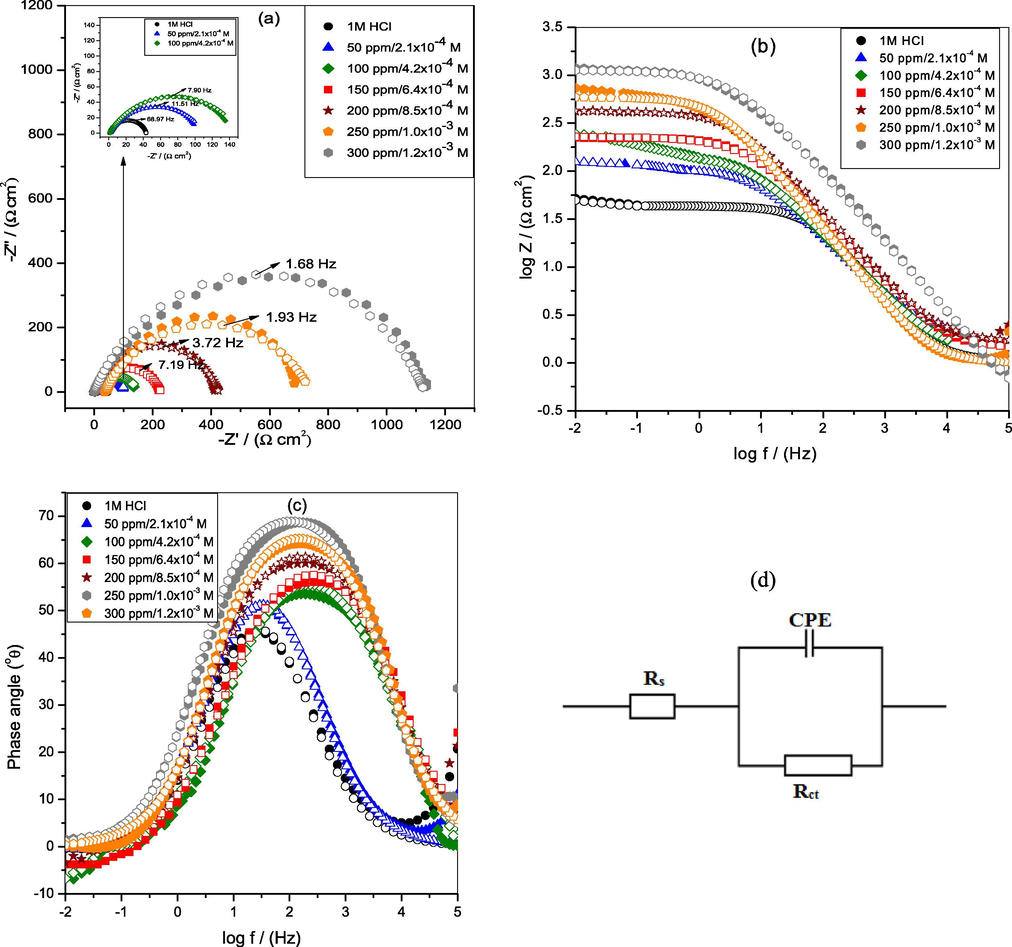
(a) Nyquist (Inset shows the Nyquist diagram of mild steel at lower concentrations) (b) Bode impedance and (c) Bode phase angle plots of MS in 1 M HCl at 30 °C (d) Equivalent circuit model used to fit the impedance data. Solid and open symbol shows experimental and fitted data, respectively.
C
(ppm/M)
Rs
(Ω cm2)
Rct
(Ω cm2)CPE
Cdl × 10−4
(Fcm−2)χ2 × 10⁻⁴
-S
ϕ°
I.E.[EIS](%)
Yo × 10−4
(Ω−1sncm−2)
n
0
0.96 ± 0.001
42.8 ± 0.2
8.1 ± 0.01
0.9940 ± 0.004
7.81
1
0.426
45.6
----
50/2.1 × 10−4
1.12 ± 0.002
104.3 ± 0.3
4.1 ± 0.01
0.9954 ± 0.00
54.05
3
0.571
50.9
58.93
100/4.2 × 10−4
1.62 ± 0.002
144.4 ± 0.4
1.3 ± 0.01
0.9956 ± 0.006
1.26
6
0.591
53.5
70.33
150/6.4 × 10−4
2.60 ± 0.002
224.6 ± 0.8
0.9 ± 0.01
0.9959 ± 0.002
0.98
1
0.610
56.0
80.92
200/8.5 × 10−4
2.78 ± 0.002
412.9 ± 1.2
0.8 ± 0.01
0.9966 ± 0.002
0.85
2
0.649
60.0
89.62
250/1.0 × 10−3
5.63 ± 0.005
660.1 ± 3.4
0.1 ± 0.001
0.9968 ± 0.001
0.10
3
0.706
64.2
93.50
300/1.2 × 10−3
6.65 ± 0.006
1135.1 ± 7.6
0.09 ± 0.001
0.9975 ± 0.002
0.094
2
0.746
68.7
96.22
Moreover, Nyquist plots displays single semicircle loop for each concentration which were depressed at the centers. This imperfection in the shape of the capacitive loop is due to surface irregularities, inhomogeneity and defects (Yadav et al., 2013). The constant phase element (CPE) is generally used to give a more precise fitting result in place of a pure capacitor. The impedance function of CPE is defined as (El Aoufir et al., 2018):
The n values varies from 0.9954 ± 0.005 to 0.9975 ± 0.002 in the presence of IOD inhibitor, which are higher than that of the blank (0.9940 ± 0.004), signifying that surface inhomogeneity reduces owing to the development of protective layer produced via the adsorption of studied IOD inhibitor on the MS surface (Scully et al., 1188). Furthermore, the proximity of n values to unity implies that the CPE of the MS/electrolyte interface in the current investigation acts as a pseudocapacitor.
Table 3 shows the higher Rs values in the presence of inhibitor as compared to the blank solution. This is ascribed to reduction in solution conductivity by the addition of the tested inhibitor. The values of Rct increase by raising the inhibitor concentrations, which suggests to the larger blocking of the active area at the metal surface because of the adsorption of the inhibitor molecules and the displacement of the H2O molecules from the surface. Although, the Cdl values were showed a downward trend. The similar trend is also observed by the other researchers (Bashir et al., 2018; Lgaz et al., 2019). The reduction in Cdl may result from a reduction in local dielectric constant and/or a rise in the thickness of the electrical double layer. When more inhibitor molecules get adsorbed on the metal surface, it reduces the exposed surface area and therefore Cdl decreases. There existed a gradual replacement method of H2O and other adsorbed ions on the metal surface which eventually led to decrease in Cdl values (Oguzie et al., 2007). The %I.E. of IOD attained from this method (Table 3) is analogous with those derived from gravimetric measurements (Table 1). The maximum IOD concentration i.e., 300 ppm exhibited the best inhibition efficiency of 96.2% for MS.
In the Bode diagrams, log [Z] and phase angle (ϕ°) are plotted against log f (Fig. 4b and c). The Bode diagram suggests only one phase maxima explaining that the corrosion process is occurring through one step equivalent to one time constant. Moreover, in Bode modulus plot (Fig. 4b), the impedance modulus was examined to rise with raising the concentrations of inhibitor which shows the decreased rates of corrosion in inhibited HCl solutions. The plot of phase angle (Fig. 4c) exhibited the more negative value of phase angle (ϕ°) approaching to − 90° on increasing IOD concentration explains the capacitive behavior of the electrochemical process. In general, an ideal capacitive behavior would result if a slope (−S) value attain −1 and ϕ° value attain −90° at the intermediate frequency (Saha et al., 2015; Aslam et al., 2020). It can be observed from the Table 3, the slope values of Bode modulus plot in the presence of IOD raised from − 0.571 to − 0.746 (Table 3) in comparison to the absence (− 0.426) of inhibitor. In the intermediate frequency region of the phase angle plot, the attained phase angle values are in the range of − 50.9° to −68.7° with increasing concentration of IOD. This implies that the inhibitor does not act ideally but approaches towards ideal capacitive behavior as minor surface deviations are present in the path (Srivastava et al., 2017).
3.3.2 PDP study
Fig. 5 represents the PDP plot of MS specimens immersed in uninhibited and inhibited medium of different concentrations of IOD. This measurement helps to interpret the kinetics of cathodic and anodic both the reactions. Several polarization parameters namely corrosion current density (Icorr), corrosion potential (Ecorr), anodic and cathodic Tafel slopes (βa, βc) deduced by the extrapolation technique are given in Table 4. The %I.E. was calculated by the following Eq. (McCafferty, 2005):
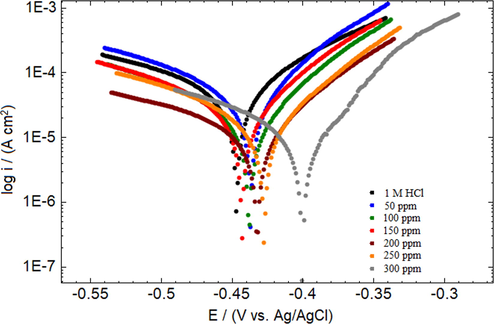
Potentiodynamic polarization measurement curves of MS in 1 M HCl at 30 °C.
C
(ppm/M)
Ecorr
(mV vs. Ag/AgCl)
βa
(mV dec−1)
βc
(mV dec−1)
Icorr
(μA cm−2)
Rp
(Ωcm2)
υ
(mmpy)I.E.[PDP] (%)
0
−447 ± 5.3
277 ± 1.2
112 ± 0.2
90.22 ± 0.8
384 ± 4.2
1.041 ± 0.001
----
50/2.1 × 10−4
−437 ± 4.8
91 ± 0.9
55 ± 0.2
34.42 ± 0.3
437 ± 4.3
0.399 ± 0.001
61.9
100/4.2 × 10−4
−438 ± 4.0
115 ± 0.7
89 ± 0.3
24.84 ± 0.3
880 ± 7.1
0.288 ± 0.001
72.5
150/6.4 × 10−4
−433 ± 2.7
87 ± 0.4
62 ± 0.3
17.45 ± 0.2
904 ± 5.5
0.202 ± 0.001
80.6
200/8.5 × 10−4
−443 ± 1.8
152 ± 0.7
66 ± 0.5
13.37 ± 0.1
1497 ± 6.1
0.155 ± 0.001
85.2
250/1.0 × 10−3
−428 ± 2.2
85 ± 0.9
54 ± 0.4
9.38 ± 0.1
1539 ± 4.3
0.109 ± 0.001
89.6
300/1.2 × 10−3
−401 ± 2.8
68 ± 0.6 cc
48 ± 0.4
7.35 ± 0.1
1683 ± 1.2
0.085 ± 0.001
91.9
From Fig. 5, it is observed that the Ecorr values moves towards the less negative potentials with the different concentrations of the IOD. However, the difference in the shift of Ecorr as compare to blank is < 85 mV, suggesting that IOD is acting like a mixed-type inhibitor (Gopiraman et al., 2012) with predominant anodic effectiveness. Data in Table 4 showed that the values of βa and βc had changed with the addition of IOD and exhibited a change of 222 mV dec−1 and 73 mV dec−1, respectively between blank and the largest concentration of inhibitor. The large difference in the values of βa further supported the anodic behavior of IOD.
The addition of 50 ppm of IOD decreased the Icorr value (34.42 ± 0.3 μA cm−2) relative to the blank (90.22 ± 0.8 μA cm−2) and protected the metal surface by 61.9%. The inhibition becomes better upon increasing the IOD concentrations. When the concentration of the IOD was increased from 50 to 300 ppm, the Icorr value further declined to 7.35 ± 0.1 μA cm−2 which correspond to the protection efficacy of 91.9%. This probably due to the significant adsorption and restriction of dissolution reaction by blocking the active sites and decreasing the attack of Cl− ions at metal–acid interface (Goulart et al., 2013). From the Table 4, it is also seen, the presence of various concentration of IOD reduced the corrosion rate (υ) of the mild steel from 1.041 ± 0.001 mmpy (in blank) to 0.085 ± 0.001 mmpy (in 300 ppm IOD). This may have been possible due to the adsorption of IOD molecules on the metal surface that raised the polarization resistance (Rp) from 384 ± 4.2 Ωcm2 (blank) to 1683 ± 1.2 Ωcm2 (300 ppm IOD). Moreover, increased Rp values in the presence of IOD imply the formation of a non-conducting physical barrier of the inhibitor on the MS surface (Gopi et al., 2014).
3.4 Comparison of the protection efficacy of IOD with oxazole derivatives and other heterocyclic compounds based inhibitors
Table 5 shows the result of comparative study of corrosion inhibition behavior of oxazole derivatives and other heterocyclic compounds examined as corrosion inhibitors for mild steel in acidic medium (Eddy and Ebenso, 2010; Quraishi and Sardar, 2002; El-Naggar, 2007; Rahmani et al., 2018; Dina, 2019; Ammal et al., 2018; Hemapriya et al., 2016; Ahmed et al., 2019; Daoud et al., 2015; Chakib et al., 2016; Abboud et al., 2007; Singh et al., 2016; El kalai et al., 2020; Ghazoui et al., 2016; Tribak et al., 2017; Ahmed et al., 2018). On comparing the results, it is clear that the prepared compound has significantly increased potency relative to their oxazole counterparts and other heterocyclic compounds. This aspect adds to the practicality of using the inhibitor under investigation. Furthermore, the cost effectiveness can be explained based on the fact that these inhibitors are used in low concentrations in comparison to previously reported heterocyclic corrosion inhibitors.
S. No.
Inhibitors
T (°C)
Medium
Conc. (M)
I.E. (%)
Ref
1.
IOD
30
1 M HCl
1.2 × 10⁻³
96.6
This study
Oxazole derivatives
2.
{(6R) −6- [3-(2-Chlorophenyl) – 5 – methylisoxazole-4-carboxamido] penicillanic
acid}30
0.1 M H2SO4
12 × 10−4
88.4
(Rahmani et al., 2018)
3.
2-Hydroxyphenyl-5-mercapto-1-oxa-3,4-diazole (HMO)
25
1 N HCl
2.5 × 10⁻³
65.0
(Dina, 2019)
4.
2-Phenyl-5-mercapto-1-oxa-3,4-diazole (PMO)
25
1 N HCl
2.8 × 10⁻³
78.0
(Dina, 2019)
5.
2-Cinnamyl-5-mercapto-1-oxa-3,4-diazole (CMO)
25
1 N HCl
2.2 × 10⁻³
90.0
(Dina, 2019)
6.
sulfamethoxazole
25
1 N HCl
1.0 × 10⁻³
92.3
(Ammal et al., 2018)
7.
(4-ethyl-2-phenyl-4,5-dihydro-1,3-oxazol-4-yl)-methanol (C1)
35
1 M HCl
1.0 × 10⁻³
76.0
(Hemapriya et al., 2016)
8.
4-{[(4-ethyl-2-phenyl-4,5-dihydro-1,3-oxazol-4-yl)methoxy]methyl}-benzene-1-sulfonate (C2)
35
1 M HCl
1.0 × 10⁻³
93.0
(Hemapriya et al., 2016)
9.
4-[(azidoxy)methyl]-4-ethyl-2-phenyl-4,5-dihydro-1,3-oxazole (C3)
35
1 M HCl
1.0 × 10⁻³
84.0
(Hemapriya et al., 2016)
10.
Schiff base 2-thioacetic acid–5-pyridyl-1,3,4-oxadiazole
35
1 M HCl
1.9 × 10⁻³
89.7
(Ahmed et al., 2019)
11.
5-((2-methl-1H-benzo[d]imidazol-1-yl) methyl)-1, 3, 4-oxadiazole-2-thiol(MBIMOT)
30
1 M HCl
7.6 × 10⁻⁴
86.9
(Daoud et al., 2015)
Other heterocyclic compounds
12.
2-phenylquinazolin-4(3H)-one(PQO)
30
1 M H2SO4
0.01
52.9
(Chakib et al., 2016)
13.
2-phenyl-4H-benzo[d]oxazin-4-one(POO)
30
1 M H2SO4
0.01
61.7
(Chakib et al., 2016)
14.
4-(4-amino-5-mercapto-4H-1,2,4-triazole-3-yl) phenol (ATT 1)
30
0.5 M HCl
0.001
69.2
(Abboud et al., 2007)
15.
4-amino-5-(4-aminophenyl)-4H-1,2,4-triazole-3-thiol (ATT 2)
30
0.5 M
0.001
67.9
(Abboud et al., 2007)
16.
4-amino-5-(4-((4-nitrobenzylidene)amino) phenyl)-4H-1,2,4-triazole-3-thiol (ATT 4)
30
0.5 M
0.001
65.0
(Abboud et al., 2007)
17.
4-amino-5-(4-((4-chlorobenzylidene)amino)phenyl)-4H-1,2,4-triazol-3-thiol (ATT 5)
30
0.5 M
0.001
50.4
(Abboud et al., 2007)
18.
4-amino-5-(3,4-diaminophenyl)-4H-1,2,4-triazole-3-thiole (ATT6)
30
0.5 M
0.001
81.1
(Abboud et al., 2007)
19.
4-((4-nitrobenzylidene)amino)-5-(4-(((Z)-4-nitrobenzylidene)amino)phenyl)-4H-1,2,4-triazole-3-thiol (ATT 3)
30
0.5 M
0.001
60.4
(Abboud et al., 2007)
20.
(E,E)-N,N'-dibenzo[b,d]thiene-2,8-diylbis[1-(thiophen-2-yl)methanimine] Schiff base
25
1MHCl
1 × 10⁻³
89.1
(Singh et al., 2016)
21.
4Z)-2,5-dimethyl-4-(4- methylpyrimido[1,2-a]benzimidazol- 2(1H)-ylidene)-2,4-dihydro-3Hpyrazol- 3-one (P1)
35
1 M HCl
1 × 10⁻³
90.0
(El kalai et al., 2020)
22.
2,3-Quinoxalinedione (QD)
25
1 M HCl
1 × 10⁻³
87.1
(Ghazoui et al., 2016)
23.
4(N,N-dimethylamino) benzaldehyde nicotinic acidhydrazone (ABNH)
30
1 M HCl
6 × 10⁻³
95.0
(Tribak et al., 2017)
24.
(E)-6-(4-chlorostyryl)-4-(4-(trifluoromethyl) -benzyl)pyridazin-3(2H)-one
25
1 M HCl
1 × 10⁻³
71.9
(Ahmed et al., 2018)
25.
(E)-4-(3-chlorobenzyl)-6-(3-chlorostyryl)
pyridazin-3(2H)-one (3b)25
1 M HCl
1 × 10⁻³
86.1
(Ahmed et al., 2018)
26.
(E)-6-(4-chlorostyryl)-4-(4-methylbenzyl)pyridazin-3(2H)-one (3
25
1 M HCl
1 × 10⁻³
62.3
(Ahmed et al., 2018)
27.
ethyl (6-methyl-3-oxopyridazin-2-yl)
acetate35
1 M HCl
1 × 10⁻³
83.1
(Parveen et al., 2018)
28.
5-chloro-1-octylindoline-2,3-dione
35
1 M HCl
1 × 10⁻³
90.0
(Mobin and Aslam, 2018)
29.
(4-(3-mercapto-5,6,7,8-tetrahy dro-[1,2,4]triazolo[4,3- b][1,2,4,5]tetrazin-6-yl)phenol)
30
1 M HCl
5 × 10⁻⁴
59.4
(Yüce and Kardas, 2012)
3.5 FT-IR analysis
In order to demonstrate the electron rich moieties in IOD responsible for the corrosion inhibition kinetics, FT-IR spectra were obtained for (a) pure IOD and (b) adsorbed IOD onto the metal surface (IOD + Fe2+) (Fig. 6a and b). Fig. 6(a) shows the peak of O-H near the wave number 3417 cm−1. The C⚌O and C—O peaks were detected at 1704 cm−1 and 1196 cm−1, respectively. The peaks at 1499, 1558 is ascribed to aromatic C⚌C stretching. Fig. 6(b) shows the FT-IR spectrum of the layer formed at the surface of steel after immersion in 1 M HCl containing IOD. It is shown that all intensities are decreased and pushed towards the lower wave numbers. Besides, metal-inhibitor activity is generally followed by a quite significant decline in the frequency of carbonyl and hydroxyl peaks. The strong C⚌O stretch vibration band observed at 1704 cm−1, is shifted to lower frequency, i.e., 1629 cm−1 whereas O—H vibration band observed at 3417 cm−1, shifted to 3413 cm−1. The results suggest that O—H and C⚌O are likely involved in the complex formation of Fe2+ inhibitor on the surface of MS, resulting in efficient adsorption and corrosion protection (Parveen et al., 2018).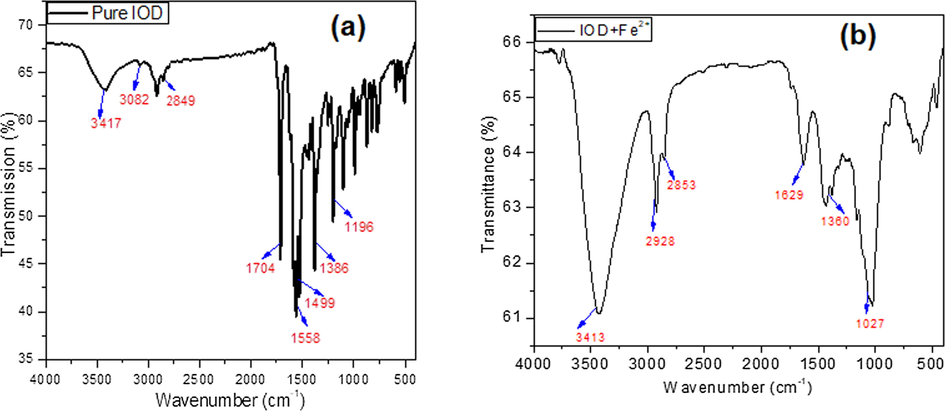
FT-IR spectra of (a) Pure IOD (b) IOD adsorbed on MS surface (IOD + Fe2+).
3.6 Surface characterization- AFM/SEM-EDS study
The surface topographies of the polished MS immersed in the presence and absence of tested compounds were evaluated by AFM (Fig. 7). Fig. 7(a-i) illustrates 3-D, 2-D, and height profile AFM micrographs of MS surface. Fig. 7(a,b) display the untreated polished MS surface which is smooth and homogenous and the average surface roughness (Ra) value was 81 nm. The mild steel specimen surface dipped in 1 M HCl was damaged severely due to the acid attack and Ra value was 413 nm (Fig. 7(d,e)). After contact to 1 M HCl containing IOD for 6 h, it is apparently revealed in Fig. 7(g,h) that the MS sample surface was smooth with a reduction in Ra values (169 nm). The minimum value of calculated roughness in presence of IOD specified that this compound prepared a thin layer and effectively protected the MS surface. The findings are further supported via height profiles curve (Mobin and Aslam, 2018) (Fig. 7(c,f,i)). As compared to the specimen immersed in 1 M HCl solution, which is exhibited to display uneven height profile (Fig. 7f), the MS samples immersed in inhibited NaCl solution have smoother height profile graph (Fig. 7i).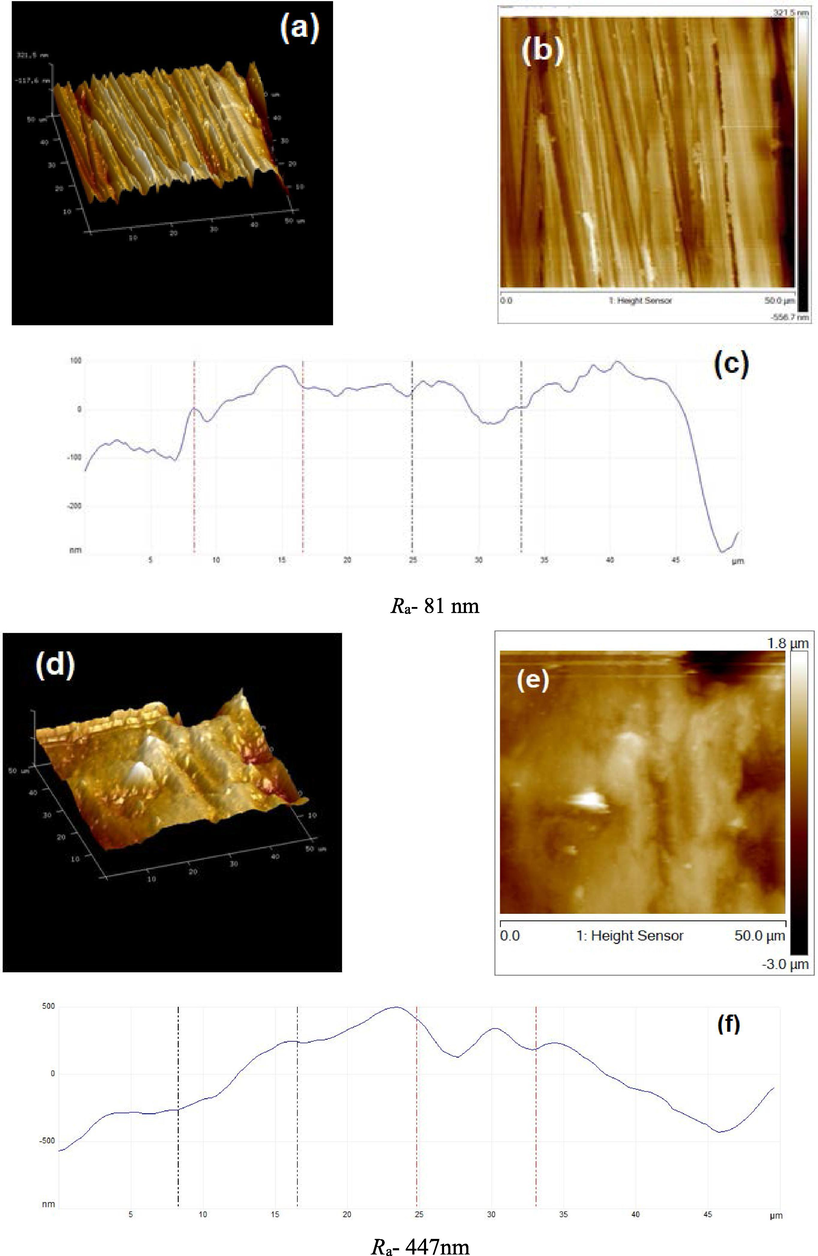
AFM micrographs (3-D, 2-D, and height profile images) of MS; (a,b,c) before to immersion, (d,e,f) after immersion in HCl, (g,h,i) with 300 ppm IOD.
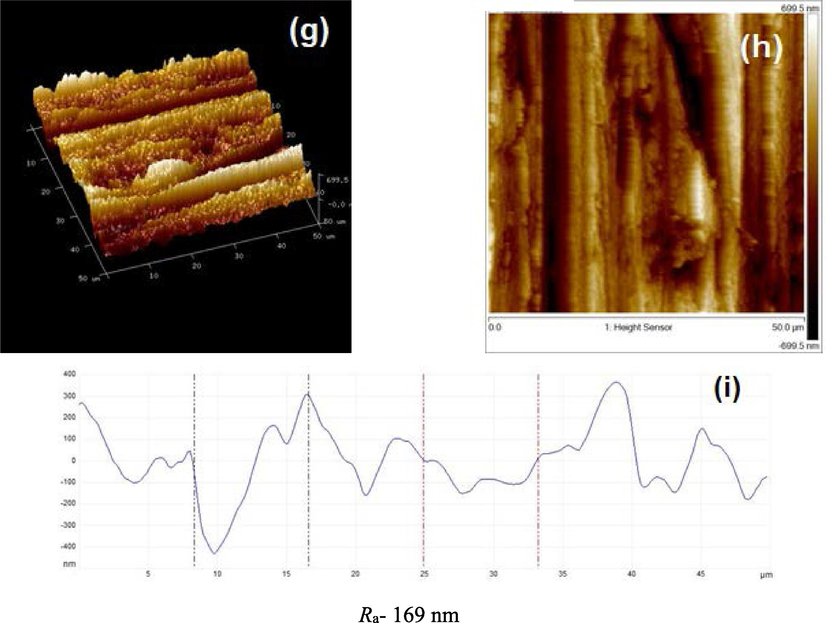
AFM micrographs (3-D, 2-D, and height profile images) of MS; (a,b,c) before to immersion, (d,e,f) after immersion in HCl, (g,h,i) with 300 ppm IOD.
SEM images and EDS charts of inhibited and uninhibited systems were taken and considered to illustrate the corrosion inhibition behavior of IOD (Fig. 8(a–f). Fig. 8(a) is the polished mild steel surface which is free from defects however some polishing lines are visible. The corresponding EDS chart of the polished surface exhibited the constituting peaks of mild steel (Fig. 8(b)). Comparing the SEM micrographs of MS surfaces after immersion in uninhibited and IOD inhibited acid solution for 6 h, it is clear that the mild steel surface immersed in uninhibited solution is severely corroded having corrosion cracks and pores (Fig. 8 (c)). The corresponding EDS chart (Fig. 8(d)) exposed that the surface layer comprises mostly Fe with low percentages of O, Cl and C. Moreover, the content of Fe is significantly decreased from 94.45% (for polished mild steel) to 75.13% (for mild steel in acid solution) which leads to the suppression of Fe peak. This phenomenon suggested that the corrosion of Fe takes place through the iron oxides or iron chlorides formation. In contrast, the surface morphology of the sample immersed in IOD inhibited solution is improved significantly (Fig. 8e). In existence of inhibited solution, surface of mild steel is clean, devoid of any pit formation or roughness except for the polishing lines. EDS chart of MS immersed in the presence of IOD (Fig. 8f), display extra N peak, and an improvement in the Fe peaks intensity to 92.60%. This supports that IOD imparted anti-corrosive effect via forming an adsorption layer over the surface of MS.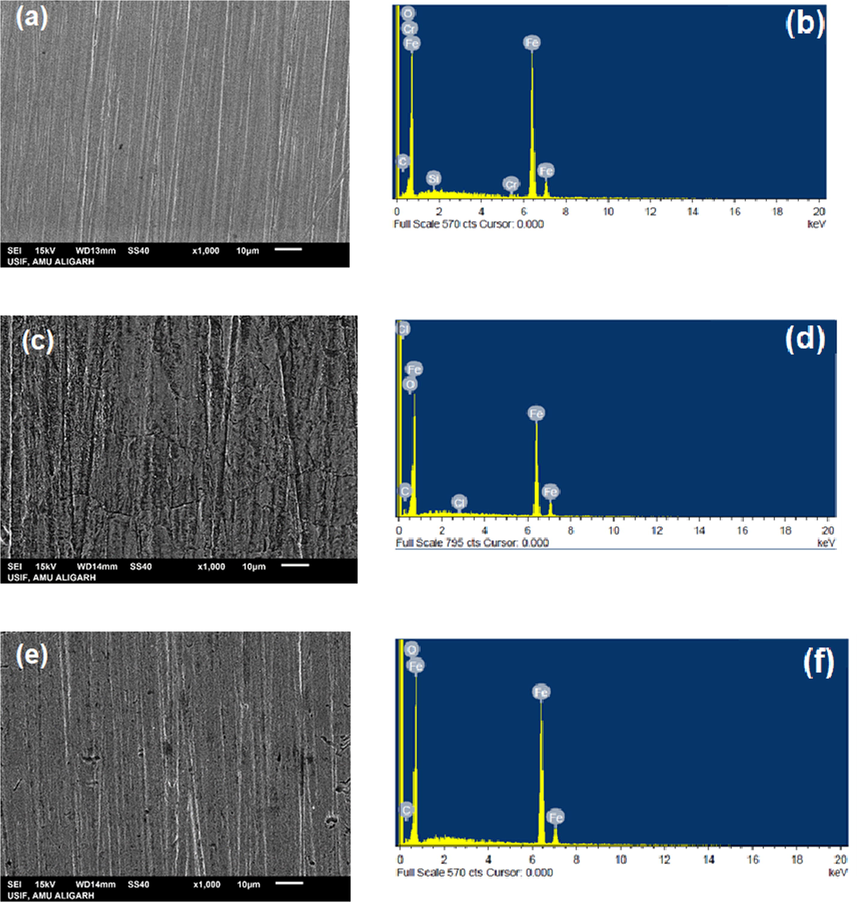
SEM/EDS images of MS before (a,b) and after immersion in HCl without (c,d) and with 300 ppm IOD (e,f).
3.7 Inhibition mechanism
In acid media, the studied compound could be protonated to provide cationic species, predominantly attacking the nitrogen atom. The adsorption of the cationic inhibitor species on the metal surface would depend on the charge of metal surface which can be defined by the position of the open circuit potential with respect to the potential of zero charge (PZC). If the net charge (φ) is negative, φ = Ecorr − Epzc where Ecorr is the corrosion potential and Epzc is the potential of zero charge (Yüce and Kardas, 2012), the adsorption of cation is favoured. However, the adsorption of anion is favoured if the net charge is positive. In the present investigation, the obtained Ecorr value of MS in 1 M HCl is − 447 mV (Ag/ AgCl), whereas Epzc of iron in HCl solution is reported to be − 498 mV (Ag/AgCl) (Pavithra et al., 2016). Since the difference between Ecorr and Epzc (+51 mV vs. Ag/AgCl) is greater than zero, the mild steel surface in 1 M HCl solution would be positively charged. Also, the chloride ions existing in the test solution are more readily adsorbed on the positively charged MS surface, which makes the MS surface negatively charged (Pavithra et al., 2016; Mobin et al., 2017). Chloride ions adsorbed at the MS/solution interface allow the adsorption of protonated IODH+ via the mean of physical interactions (physisorption) (Oguzie et al., 2007) (Fig. 9). In addition, on the basis of ΔG°ads, adsorption of IOD molecules through chemisorption can also be supported. According to which, the neutral form IOD may be absorbed through the sharing of electrons between nitrogen and oxygen atoms and π-bond interactions between the inhibiting molecules to form a connection with the unoccupied 3d orbitals available on Fe atoms (Mobin et al., 2017). The –COOH group present in the structure of IOD is an electron donor group which participates in electrons donating, leading to strong bonding with mild steel surface.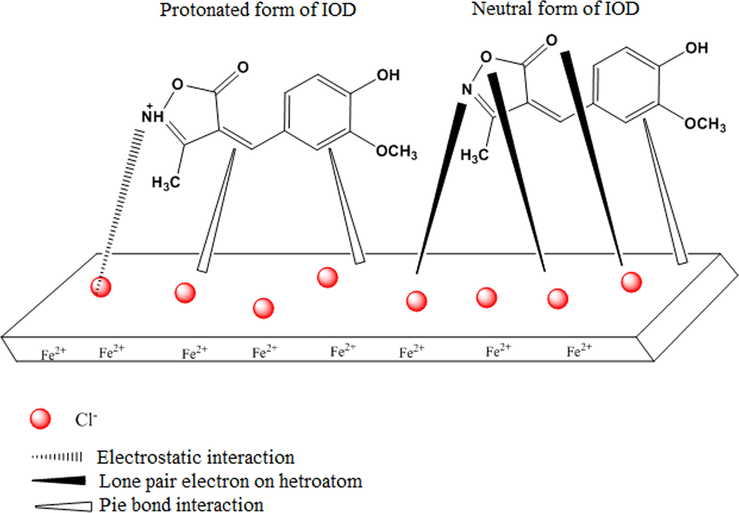
Schematic representation of inhibition mechanism of mild steel by IOD.
4 Conclusion
On the basis of the present study, IOD is established as an effective eco-friendly corrosion inhibitor for mild steel in 1 M HCl solution. In static condition, inhibition efficiency of 96.6% was attained at 300 ppm concentration of IOD at 30 °C. The adsorption on the surface of metal follows the Langmuir adsorption isotherm. PDP result suggested that IOD behave as a mixed-type inhibitor with predominating anodic effectiveness. EIS curves revealed the adsorption of IOD molecules that is confirmed by the rise in charge transfer resistance and reduction in the values of double layer capacitance. The FT-IR spectra and AFM/SEM-EDS images further suggested the adsorption of IOD molecules on the metallic surface.
Declaration of Competing Interest
The authors declare that they have no known competing financial interests.
References
- NACE IMPACT, International measures of prevention, application, and economics of corrosion technologies study, houston. TX: NACE International; 2016.
- Task-specific ionic liquid as a new green inhibitor of mild steel corrosion. Appl. Surf. Sci.. 2014;289:478-486.
- [Google Scholar]
- R.S.B. Mohammed A. Amin, Sayed S. Abd El-Rehim, E.E.F. El-Sherbini, The inhibition of low carbon steel corrosion in hydrochloric acid solutions by succinic acid Part I. Weight loss, polarization, EIS, PZC, EDX and SEM studies, Electrochim. Acta. 52 (2006) 3588-3600.
- Application of corrosion inhibitors for steels in acidic media for the oil and gas industry: A review. Corros. Sci.. 2014;86:17-41.
- [Google Scholar]
- Organic corrosion inhibitors for industrial cleaning of ferrous and non-ferrous metals in acidic solutions: A review. J. Mol. Liq.. 2018;02:45-71.
- [Google Scholar]
- Determination of corrosion inhibition effects of amino acids: Quantum chemical and molecular dynamic simulation study. J. Taiwan Inst. Chem. Eng.. 2016;58:528-535.
- [Google Scholar]
- An effective corrosion inhibitor of N doped carbon dots for Q235 steel in 1M HCl solution. J. Alloys Comp.. 2020;815:152338
- [Google Scholar]
- A high-efficiency corrosion inhibitor of N-doped citric acid-based carbon dots for mild steel in hydrochloric acid environment. J. Hazardous Mat.. 2020;381:121019
- [Google Scholar]
- Evaluation of the inhibition behavior of carbon dots on carbon steel in HCl and NaCl solutions. J. Mat. Sci. Tech.. 2020;43:144-153.
- [Google Scholar]
- A green and effective corrosion inhibitor of functionalized carbon dots. J. Mat. Sci. Tech.. 2019;35:2243-2253.
- [Google Scholar]
- A feasible method to improve the protection ability of metal by functionalized carbon dots as environment-friendly corrosion inhibitor. J. Cleaner Produc.. 2020;264:121682
- [Google Scholar]
- Corrosion inhibition of carboxylate inhibitors with different alkylene chain lengths on carbon steel in an alkaline solution. RSC Adv.. 2019;9:7065-7077.
- [Google Scholar]
- Bis-Schiff bases of isatin as new and environmentally benign corrosion inhibitor for mild steel. J. Ind. Eng. Chem.. 2014;20:2819-2829.
- [Google Scholar]
- Electrochemical and computational studies of some triazepine carboxylate compounds as acid corrosion inhibitors for mild steel. J. Bio- Tribo-Corrosion.. 2018;4:2-18.
- [Google Scholar]
- Electrochemical studies of monoterpenic thiosemicarbazones as corrosion inhibitor for steel in 1 M HCl. Int. J. Corros.. 2018;1155:1-15.
- [Google Scholar]
- Chemical and electrochemical studies of novel quinazolinone derivatives based on 8-hydroxyquinoline as corrosion inhibitor for mild steel in 1.0 M HCl Solution. Anal. Bioanal. Electrochem.. 2018;10:1328-1354.
- [Google Scholar]
- Pineapple stem extract (Bromelain) as an environmental friendly novel corrosion inhibitor for low carbon steel in 1M HCl. Measurement. 2019;134:595-605.
- [Google Scholar]
- L-Phenylalanine methyl ester hydrochloride as a green corrosion inhibitor for mild steel in hydrochloric acid solution and the effect of surfactant additive. RSC Adv.. 2016;6:5890-5902.
- [Google Scholar]
- Ill-Min Chung, Exploring the potential role of pyrazoline derivatives in corrosion inhibition of mild steel in hydrochloric acid solution: Insights from experimental and computational studies. Construc. Build. Mat.. 2020;233:117320
- [Google Scholar]
- Adsorption and corrosion inhibition effect of 2-mercaptobenzimidazole (surfactant) on a carbon steel surface in an acidic medium: Experimental and monte carlo simulations. Port. Electrochim. Acta.. 2018;36:197-212.
- [Google Scholar]
- Investigation on corrosion protection behavior and adsorption of carbohydrazide-pyrazole compounds on mild steel in 15% HCl solution: Electrochemical and computational approach. J. Mol. Liq.. 2020;314:113513
- [Google Scholar]
- Investigations on eco-friendly corrosion inhibitors for mild steel in acid environment: Electrochemical, DFT and Monte Carlo Simulation approach. Colloids Surf. A.. 2020;599:124881
- [Google Scholar]
- Functionalized 2-hydrazinobenzothiazole with carbohydrates as a corrosion inhibitor: electrochemical, XPS, DFT and Monte Carlo simulation studies. Mater. Chem. Front.. 2019;3:931-940.
- [Google Scholar]
- Synthesis of 5-aryl-2-acylthio-1,3,4-oxadiazoles and their antibacterial activity. Indian J. Heterocyclic Chem.. 2005;14:315.
- [Google Scholar]
- Synthesis and antimicrobial activity of substituted nitro-1,2,4-oxadiazole-5-carbaldehyde hydrazones. Pharmaceut. Chem. J.. 2004;38:376.
- [Google Scholar]
- Synthesis and fungicidal activity of novel 5-aryl-4-methyl-3yl (imidazolidin-1yl methyl, 2-ylidene nitro imine) isoxazoles. J. Pharm. Res.. 2013;7:516-519.
- [Google Scholar]
- Synthesis, structures, and herbicidal activity of isoxazole derivatives. J. Heterocyclic Chem.. 2010;47:1310-1316.
- [Google Scholar]
- Synthesis, characterization, and in vitro antimicrobial activity of methyleneamine-linked bis-heterocycles. J. Hetero Chem.. 2013;50:727-733.
- [Google Scholar]
- A facile & convenient route for the stereo selective synthesis of Zisoxazol-5(4H)-ones derivatives catalysed by sodium acetate: Synthesis, multispectroscopic properties, crystal structure with DFT calculations, DNA-binding studies and molecular docking studies. J. Mol. Stru.. 2020;1200:127067
- [Google Scholar]
- Standard Practice for preparing, cleaning, and evaluating corrosion test specimens, designation: G 1–90 (Reapproved 1999).
- Ester-based pyridinium gemini surfactants as novel inhibitors for mild steel corrosion in 1 M HCl Solution. Tenside Surf. Deterg.. 2017;54:486.
- [Google Scholar]
- The inhibition action of analgin on the corrosion of mild steel in acidic medium: A combined theoretical and experimental approach. J. Mol. Liq.. 2018;263:454-462.
- [Google Scholar]
- The inhibition effect of Azure A on mild steel in 1M HCl. A complete study: adsorption, temperature, duration and quantum chemical aspects. Corros. Sci.. 2012;56:143-152.
- [Google Scholar]
- Role of some thiadiazole derivatives as inhibitors of the corrosion of C-steel in 1M H2SO4. J. Appl. Electrochem.. 2009;39:391-402.
- [Google Scholar]
- Experimental and quantum chemical studies on the corrosion inhibition performance of benzimidazole derivatives for mild steel inHCl. Ind. Eng. Chem. Res.. 2013;52:6318-6328.
- [Google Scholar]
- The effect of the alkyl chain length on corrosion inhibition performances of 1,2,4-triazole-based compounds for mild steel in 1.0M HCl: Insights from experimental and theoretical studies. J. Mol. Liq.. 2018;303:112631
- [Google Scholar]
- Technical Note: Concerning the conversion of the constant phase element parameter Y0 into a capacitance. Corr.. 2001;57:747-748.
- [Google Scholar]
- J.R. Scully, D.C. Silverman, K.W. Martin, Electrochemical impedance: analysis and interpretation, 1188. Fredericksburg VA: ASTM Publication PCN 04-011880-27 (1993) 433-4.
- On the understanding of the adsorption of Fenugreek gum on mild steel in an acidic medium: Insights from experimental and computational studies. Appl. Surf. Sci.. 2019;463:647-658.
- [Google Scholar]
- Corrosion inhibition and adsorption behavior of methionine on mild steel in sulfuric acid and synergistic effect of iodide ion. J. Colloid Interf. Sci.. 2007;310:90-98.
- [Google Scholar]
- Adsorption and corrosion inhibition effect of Schiff base molecules on the mild steel surface in 1 M HCl medium: a combined experimental and theoretical approach. Phys. Chem. Chem. Phys.. 2015;17:5679-5690.
- [Google Scholar]
- Inhibitory effect of 2-Nitroacridone on corrosion of low carbon steel in 1 M HCl solution: An experimental and theoretical approach. J. Mater. Res. Technol.. 2020;9:4061-4075.
- [Google Scholar]
- Amino acid based imidazolium zwitterions as novel and green corrosion inhibitors for MS: experimental, DFT and MD studies. J. Mol. Liq.. 2017;244:340-352.
- [Google Scholar]
- Validation of corrosion rates measured by the Tafel extrapolation method. Corros. Sci.. 2005;47:3202-3215.
- [Google Scholar]
- Chemical and physical interactions of 1-benzoyl-3, 3-disubstituted thiourea derivatives on mild steel surface: corrosion inhibition in acidic media. Ind. Eng. Chem. Res.. 2012;51:7910-7922.
- [Google Scholar]
- Experimental and theoretical evaluation of semicarbazones and thiosemicarbazones as organic corrosion inhibitors. Corr. Sci.. 2013;67:281-291.
- [Google Scholar]
- Experimental and theoretical investigations on the inhibition of mild steel corrosion in the ground water medium using newly synthesized bipodal and tripodal imidazole derivatives. Mater. Chem. Phy.. 2014;147:572-582.
- [Google Scholar]
- Adsorption and quantum chemical studies on cloxacillin and halides for the corrosion of mild steel in acidic medium. Int. J. Electrochem. Sci.. 2010;5:731-750.
- [Google Scholar]
- Corrosion inhibition of mild steel in acid solutions by some aromatic oxadiazoles. Mater. Chem. Phys.. 2002;78:425-431.
- [Google Scholar]
- Corrosion inhibition of mild steel in acidic medium by some sulfa drugs compounds. Corr. Sci.. 2007;49:2226-2236.
- [Google Scholar]
- Experimental, quantum chemical studies of oxazole derivatives as corrosion inhibitors on mild steel in molar hydrochloric acid medium. Int. J. Corros. Scale Inhib.. 2018;7:509-527.
- [Google Scholar]
- Najeeb, Inhibition efficiency and corrosion rate studies of mild steel in nitric acid using 2-thioacetic acid–5-pyridyl-1,3,4-oxadiazole complexes. Int. J. Corros. Scale Inhib.. 2019;8:717-725.
- [Google Scholar]
- Effect of substitution and temperature on the corrosion inhibition properties of benzimidazole bearing 1, 3, 4-oxadiazoles for mild steel in sulphuric acid: Physicochemical and theoretical studies. J. Environ. Chem. Engg.. 2018;6:1072-1085.
- [Google Scholar]
- Chung, Dry and wet lab analysis on benzofused heterocyclic compounds as effective corrosion inhibitors for mild steel in acidic medium. J. Ind. Engg. Chem.. 2016;40:106-117.
- [Google Scholar]
- Synthesis and investigations of heterocyclic compounds as corrosion inhibitors for mild steel in hydrochloric acid. Internat. J. Ind. Chem.. 2019;10:159-173.
- [Google Scholar]
- Corrosion inhibition of mild steel by two new S-heterocyclic compounds in 1 M HCl: Experimental and computational study. Corr. Sci.. 2015;94:21-37.
- [Google Scholar]
- Electrochemical, gravimetric and theoretical evaluation of (4Z)-2,5-dimethyl-4-(4-methylpyrimido[1,2-a]benzimidazol-2(1H)-ylidene)-2,4-dihydro-3H-pyrazol-3-one (P1) as a corrosion inhibitor for mild steel in 1 M HCl solution. J. Mater. Environ. Sci.. 2016;7(6):1866-1881.
- [Google Scholar]
- 2,3-Quinoxalinedione as a novel corrosion inhibitor for mild steel in 1 M HCl. Mat. Chem. Phys.. 2007;105:1-5.
- [Google Scholar]
- 4(N, N-dimethylamino) benzaldehyde nicotinic hydrazone as corrosion inhibitor for mild steel in 1M HCl solution: An experimental and theoretical study. J. Mol. Liq.. 2016;216:738-746.
- [Google Scholar]
- F. El kalai, T. Chelfi, N. Benchat, M. Bouklah, S. Daoui, K. Karrouchi, M. Allali, M. Taleb, E. Ech-chihbi, F.A. Almalki, T. B. Hadda, New heterocyclic compounds based on pyridazinones scaffold as efficient inhibitor of corrosion of mild steel in acidic solution 1M HCl, J. Bio- and Tribo-Corr. 6 (2020) 89.
- The study of the effect of ethyl (6-methyl-3-oxopyridazin-2-yl) acetate on mild steel corrosion in 1M HCl. J. Alloys Comp.. 2016;693:510-517.
- [Google Scholar]
- 5-chloro-1-octylindoline-2,3-dione as a new corrosion inhibitor for mild steel in hydrochloric acid solution. J. Mater. Environm. Sci.. 2017;8:1116-1127.
- [Google Scholar]
- Synthesis and characterization of a novel organic corrosion inhibitor formild steel in 1 M hydrochloric acid. Results in Phys.. 2018;8:728-733.
- [Google Scholar]
- L-proline mixed with sodium benzoate as sustainable inhibitor for mild steel corrosion in 1M HCl: An experimental and theoretical approach. Sci. Rep.. 2018;8:7489.
- [Google Scholar]
- Experimental and theoretical study on corrosion inhibition performance of environmentally benignnon-ionic surfactants for mild steel in 3.5% NaCl solution. Process Safe. Environ.. 2018;114:279-295.
- [Google Scholar]
- Adsorption and inhibition effect of 2-thiohydantoin on mild steel corrosion in 0.1 M HCl, Corr. Sci.. 2012;58:86-94.
- [Google Scholar]
- Electrochemical, gravimetric and quantum chemical analysis of mild steel corrosion inhibition by colchicines in 1 M HCl medium. Res. Chem. Intermed.. 2016;42:2409-2428.
- [Google Scholar]
- Bio-/environment-friendly cationic gemini surfactant as novel corrosion inhibitor for mild steel in 1M HCl Solution. J. Surf. Deterg.. 2017;20:57-74.
- [Google Scholar]


