

Translate this page into:
Green-synthesis and characterization for new Schiff-base complexes; spectroscopy, conductometry, Hirshfeld properties and biological assay enhanced by in-silico study
⁎Corresponding author at: Department of Chemistry, Faculty of Applied Science, Umm-Al-Qura University, Makkah, Saudi Arabia. nmmohamed@uqu.edu.sa (Nashwa M. El-Metwaly)
-
Received: ,
Accepted: ,
This article was originally published by Elsevier and was migrated to Scientific Scholar after the change of Publisher.
Peer review under responsibility of King Saud University.
Abstract
A facile green synthesis ball milling technique was used to prepare series of oxo-N'-(1-(pyridin-2-yl) ethylidene)-3-(thiazol-2-ylamino)propanehydrazide (H2L) complexes with UO2(II), Co(II), Cu(II), Pd(II) and Zn(II) ions. The configuration of isolated compounds was established based on spectroscopic, analytical as well as conformational techniques. Material-studio package was applied to propose the most suitable atomic-distribution within the ligand and its complexes via DFT method. The octahedral geometry was proposed for all complexes through poly-dentate coordinating ligand. Series of conductometric-titrations for the ligand versus CuSO4 was carried out to estimate the formed molar-ratio and constants of association & formation. To strengthen in-vitro study, structural-property relationship (drug-likeness) was applied, the data suggested the high biological efficiency of tested compounds. On the other hand, a simulation approach through MOE software was also conducted for the ligand and its Zn(II) complex against four pathogen proteins. This to recognize the magnitude of similarity between data exported in-silico as well as in-vitro assay, which already done. The best inhibition was recorded with H2L-1p3j, H2L-1cca, Zn(II)complex-1cca complexes. Concerning the ligand and its complexes, the in-vitro study has been achieved for anti-oxidant, antimicrobial, as well as cytotoxic assay.
Keywords
Hydrazone
Ball-milling
DFT
Docking-simulation
Anti-oxidant
Cytotoxicity
Conductometry, drug-likeness

1 Introduction
The substituted hydrazones have been received a great enthusiasm in coordination chemistry due to their noticeable therapeutic activities, which mainly improved after chelation to form complexes (Özmen and Olgun, 2009; Avaji et al., 2009; Zang et al., 2010). Aroylhydrazones have potent pharmaceutical features and may forbid various mechanisms for enzymatic reactions in which the transition metals behaved as significant catalysts. Aroylhydrazones are broadly renowned due to their various applications like anti-neoplastic, antitumor, antiviral and anti-inflammatory agents (Lima et al., 2008; Seleem et al., 2009; Singh, 2008). Moreover, hydrazones were used to analyse several metal cations that used as a sensitive complexing agent (Khalifa, 1995; Shoukry and Shoukry, 2008; Madrakian et al., 2007). The variety of active coordination sites that exist in hydrazones' skeletons play essential chelating role in complexation. Consequently and based on studies above, we aim to synthesize series of UO2(II), Co(II), Cu(II), Pd(II) and Zn(II) complexes from new hydrazide-derivative(H2L). All new synthesizes, were analyzed by many credible techniques. Computational implementations was used by detailed way to estimate many significant properties. Finally, the new synthesizes were screened as anti-oxidant, antimicrobial and cytotoxic agents, to assess the extent of success in such roles. The in-vitro results were supported by the in-silico study through drug-likeness software as well as docking simulation program.
2 Experimental
2.1 Instrumentation
The utilized spectral and analytical techniques were schematically depicted for ease (Scheme 1S). Furthermore, the measurements conditions were either presented in the scheme or in discussion part. While, the metal content was analysed by known analytical methods (Vogel, 1989)
2.2 Materials and reagents
All materials used in this scientific work have PDH nature and extremely pure (Merck or Sigma& Aldrich). For instance, 2-amino thiazole, dietyl malonate, hydrazine hydrate, 2-acetyl pyridine, PdCl2, UO2(OAc)2·4H2O, Cu(OAc)2·H2O, Co(OAc)2·4H2O and Zn(OAc)2·H2O, were the chemicals used. Also, the solvents (diethyl ether, absolute ethyl alcohol, DMSO and DMF) were of spectroscopic nature and used as it is without pre-treatments.
2.3 Synthesis stage
The aimed Schiff base ligand was prepared as shown in Scheme 1. Then this ligand was utilized in facile-green strategy through ball milling technique to prepare UO2(II), Co(II), Cu(II), Pd(II) and Zn(II) complexes. Such environmentally preferable approach excreted high yielded products (∼89%) with high purity. This feature was judged initially from homogeneity of solid colours as well as elemental analysis (Table 1).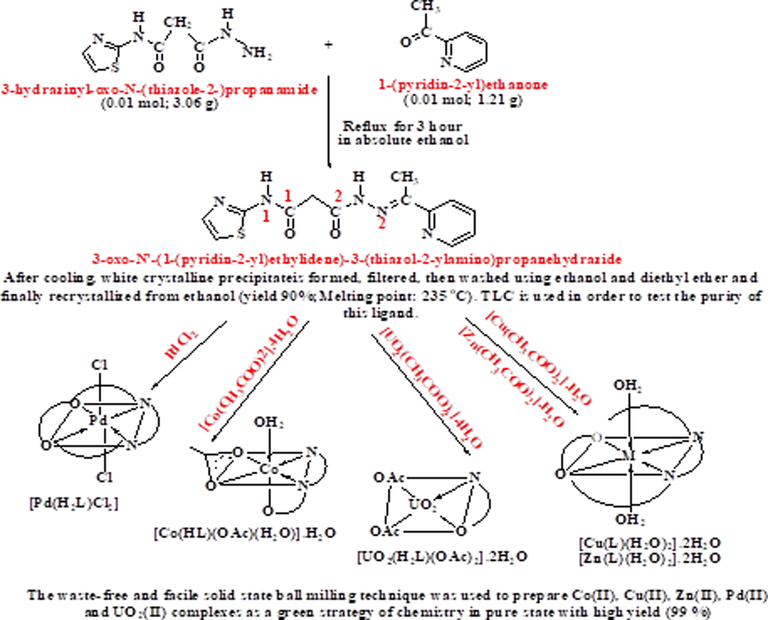
The outline of the synthesis of ligand (H2L) and its complexes.
Empirical Formula (F. Wt.)
CompoundColor
Yield (%)
%Found (Calcd.)
Λm*
C
H
M
Cl
1)H2L, C13H13O2N5S (303.23)
White
80
50.70
(51.19)4.19
(4.29)–
–
–
2)[Pd(H2L)Cl2] (480.64)
Brown
85
32.49
(32.48)2.46
(2.72)23.31
(22.14)15.16
(14.75)4
3)[UO2(H2L)(OAc)2]·2H2O (727.02)
Yellow
80
28.03
(28.18)2.84
(3.16)33.64
(32.73)–
5
4)[Co(HL)(OAc)(H2O)]·H2O (455.16)
Red
80
37.89
(37.24)3.85
(3.33)12. 67
(12.74)–
6
5)[Cu(L)(H2O)2]·2H2O (436.57)
Green
85
34.93
(35.73)4.29
(4.35)14.42
(14.54)–
7
6)[Zn(L)(H2O)2].2H2O (458.99)
Yellow
80
35.07
(35.57)4.64
(4.33)14.31
(14.82)–
5
2.4 Molecular optimization
DMOL3 program in Materials Studio software was used to obtain cluster calculations onto isolated solid compounds [11]. DFT (density functional theory) was the suitable one applied to configure the prepared compounds via DNP basis sets (Frisch et al., 2009; Hehre et al., 1986; Kuca et al., 2018). The excellent exchange-correlation functional was determined based on GGA as well as PBEPBE functional (Willian et al., 2016; Gonçalves et al., 2014; de Lima et al., 2017). Also, MEP map was projected by applying B3LYP/6-31G (d) level in DFT theory. While, UO2(II) complex was excluded from this study, due to failure to find the suitable basis set for this purpose.
2.5 Conductometric measurements
The conductometric titrations protocol among the ligand and Cu(II) ion, were conducted as exhibited in Scheme 2S over 1 mmol/L Cu(II) solution.
2.6 Biological studies
2.6.1 Antimicrobial assay in terms of MIC
MIC- test was carried out by agar streak dilution technique (Hawkey and Lewis, 1994) as displayed in Scheme 3S. Each tested compound was prepared by100µg/ml in DMSO solvent, as a stock solution for this test.
2.6.2 Anti-oxidant screening assay
2.6.2.1 ABTS method
This free radical method (ABTS) was used to evaluate such feature and considered the most preferable one (Mosmann, 1983; Denizot and Lang, 1986; Mauceri et al., 1998). Accordingly and for instance, the stoichiometric-reaction produced stable color for an hour, which is sufficient for accurate measurement. The process steps were schematically displayed (Scheme 4S).
2.6.2.2 Anti-oxidant screening assay for erythrocyte hemolysis
In heparinized tubes, the blood sample was collected by cardiac puncture for rats. Erythrocytes were isolated from the buffy coat as well as plasma then followed by three times washing for the prepared sample by ten volumes of NaCl (0.15 M). The erythrocytes were centrifuged for 10 min at 2500 rpm to get continually crowded cell. In this method, erythrocyte hemolysis was mediated via peroxyl radicals as shown in Scheme 5S.
2.6.3 Cancer cell-proliferation assay
This assay interested in colorectal carcinoma cell line (HCT-116), which gained from ATCC by Holding company for biological products and vaccines (VACSERA). The reagents used were RPMI-1640 medium, 5-fluorouracil (reference drug), MTT and DMSO (Sigma). This screening was carried out by MTT test to estimate the inhibitory special effects of investigated compounds on cell growth (Aeschlach et al., 1994; Denizot and Lang, 1986). This colorimetric technique rooted in the change of yellow tetrazolium bromide (MTT) color to formazan derivative by mitochondrial succinate dehydrogenase with purple color in viable cells. HCT-116 is cultured in RPMI-1640 medium with 10% fetal bovine serum as shown in Scheme 6S.
2.7 Molecular docking
This computerized usage aims to predict the biological efficiency for selected compounds in diseases-treatment and assess the compatibility with practical results. The ligand and its Zn(II) complex were chosen for this computation against four PDB crystal-structures (1cca, 2hq6, 6iv7 and 1p3j) (Goodin and McRee, 1993). 1cca was the triad of cytochrome peroxidase controls the reduction potential and coupling of the tryptophan free radical to the heme. 2hq6 was the structure of cyclophilin-like domain of the serologically defined colon cancer. 6iv7 was the crystal structure of dependent enzyme from aspergillus flavus, while 1p3j was the adenylate kinase from bacillus subtilis. An advanced software (MOE, Vs. 2015) was applied for this simulation to raise the accuracy of results (Abdellattif et al., 2018). Such accomplished through intensive orientation stages till reach the optimum conditions for docking. Firstly, each tested compound must face energy minimization process, then the atomic charges and potential energy must be adjusted. Secondly, the compound ready for final regulation for other parameters through MMFF94x force field, then the compound saved as MDB format (El-Metwaly et al., 2019). After that each protein crystal also faced orientation as, adding H-atoms, connecting receptors then fixing the potential energy over receptors. Therefore, search for receptor-sites, build the dummies over the helix and start the docking process (Althagafi et al., 2019). Each process was the mean of 30 poses that accomplished along various times. Some of these poses may be rejected immediately that clashed with protein-sites. The true poses have been adjusted by London dG-scoring function, which already improved twice times through triangle-matcher. The effective docking path was judged based on bond length, which must be ≤3.5 Å. Finally, all docking data as well as interaction patterns were exported to rank inhibition property of compounds.
3 Results & discussion
3.1 Common properties
The ligand as well as its solid complexes were analysed to propose their molecular formulae (Table 1). The minimum ratio was suggested (1 M:1L) within the complexes, based on elemental analyses. In DMSO solvent, all complexes exhibited non-conducting property during molar conductivity measurements (1 mmol, Λm). This is strongly expected especially with using anions that having a strong tendency for covalence (OAc- & Cl-).
3.2 IR & 1H NMR spectra
The new Schiff base prepared (H2L) was spectrally investigated to assert on its chemical formula, which truly achieved. By the way, its IR spectrum exhibited bands at 1688, 1668, 1635, 1581, 649, 3270 and 3187 cm−1. Such bands have been assigned sequentially to υ(C⚌O)1, υ(C⚌O)2, υ(C⚌N)1, υ(C⚌N)2, υ(C⚌N)py, υ(NH)1 and υ(NH)2 (Narang and Singh, 1996) (Table 2, Fig. 1S). In furtherance of this, the 1H NMR spectrum (Fig. 1) exhibited two characteristic signals at δ(ppm) = 12.33 and 10.96, which refer to NH1 and NH2, sequentially. The multiple-signals appeared at 7.19–8.55 (ppm) region, refer to aromatic-hydrogen atoms. The two singlet-signals exhibited at 3.68 and 2.29 ppm, refer to CH2 and CH3, respectively. Moreover, the molecular formula of the ligand was confirmed by mass-spectral analysis (Fig. 2S), which displayed molecular ion peak (m/z = 303) agrees comfortably with that proposed (303.23).
Compound
υ(NH)1
υ(NH)2
υ(C⚌O)1
υ(C⚌O)2
υ(C⚌N)1
υ(C⚌N)2
υ(C⚌N*)
υ(C⚌N)P
υ(C—O)1
υ(C—O)2
(1)
3270
3187
1688
1668
1635
1581
–
1500
–
–
(2)
3321
3235
1679
1663
1653
1573
–
1482
–
–
(3)
3405
3296
1685
1656
1594
1586
–
1530
–
–
(4)
3420
–
1685
–
1592
1558
1620
1483
–
1041
(5)
3421
–
–
–
1601
1563
1622
1486
1101
1049
(6)
3422
–
–
–
1596
1578
1622
1480
1106
1078
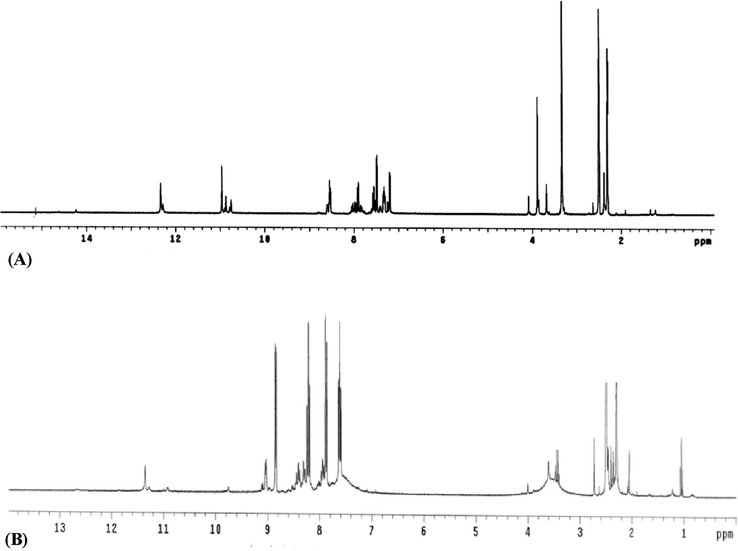
1H NMR spectra of H2L(A) and its Pd(II) complex (B).
Consequently, this ligand which possess an extensive presence for donor-sites, has a good opportunity for multiple the mode of bonding with various metal-ions as follow;
i) The IR spectrum of Pd(II) complex reflects lower shift for υ(C⚌N)py, υ(C⚌N)1, υ(C⚌O)1 and υ(C⚌O)2 vibrations. This signifies their coordination through neutral poly-dentate binding type (Fekri and Zaky, 2014). Furthermore, its 1 HNMR spectrum (Fig. 1) displayed signals for NH1 and NH2 that almost un-shifted (11.35 & 9.05 ppm), which confirm the lack of their participation in coordination. ii) The IR spectrum of UO2(II) complex reflects lower shift for υ(C⚌O)2 and υ(C⚌N)1 vibrations only, which signifies neutral bi-dentate binding type (Zaky and Fekri 2015). As well as, bands attribute to υas(O—C—O) & υs(O—C—O) vibrations in mono-dentate covalence-acetate, were appeared at 1559 & 1351 cm−1. iii) The IR spectrum of Co(II) complex reflects lower shift for υ(C⚌N)1 and υ(C⚌N)py vibrations beside the complete obscure for υ(C⚌O)2. This denotes their coordination through mono-negative tri-dentate binding type. The disappeared vibration of υ(C⚌O)2 was immediately attached by presence of υ(C⚌N*) & υ(C—O)2 bands. Otherwise, the presence of υas(O—C—O) & υs(O—C—O) vibrations at 1525 & 1420 cm−1 (Δυ = 105 cm−1), signifies the contribution of bi-dentate acetate group. iv) The IR spectra for Cu(II) and Zn(II) complexes appeared fairly analogous in lower-shifted presence of υ(C⚌N)1 and υ(C⚌N)2 vibrations. As well as, the similarity extended to the obscure of υ(C⚌O)a and υ(C⚌O)2 vibrations with simultaneous appearance of υ(C⚌N*) & υ(C—O) bands. This denotes bi-negative poly-dentate binding type within the two complexes. Finally, the water molecules were proposed based on ρr(H2O) and ρw(H2O) bands (Rakha et al., 1996), which supported thermally (part 3.5). In addition to, the new bands assign for υ(M—N) and υ(M—O) vibrations were appeared at 400–600 cm-1region.
3.3 Magnetic moments & electronic spectra
UV–Vis spectral analysis was executed for most complexes (Fig. 3S), to establish the structural forms based on electronic transitions displayed (Table 3). The octahedral geometry was the only form proposed for all complexes. Also, the ligand field parameters within Co(II) complex were calculated as follow; 10Dq (8790 cm−1), B (925 cm−1) and β(0.95) using known equations (Zaky, 2011). The values fall in the normal range for octahedral configuration which possess highly ionic nature of Co-L bonds.
Compound
μeff. (B.M.)
d-d transitions (cm−1)
assignments
[Co(HL)(OAc)(H2O)].H2O
5.2
16668; 20,408
4T1g→ 4A2g(F); 4T1g → 4T1g(P)
[Cu(L)(H2O)2].2H2O
1.8
14085; 16,667
2Eg→ 2T2g
[Pd(H2L)Cl2]
Diam.
22222; 28,571
1A1g →2B1g;
1A1g →2E1g
3.4 SEM, EDX and XRD analysis
SEM analysis was carried out to evaluate the surface morphology for Zn(II), Pd(II) and UO2(II) complexes (Lever, 1968), as representative examples. Such investigated complexes had asymmetric broken ice rock shape morphology. Where the particles of about micrometer size are too randomly distributed over these ice rock shape structures. Also, the chemical composition of the complexes was defined by energy-dispersive X-ray spectrometer (EDX) analysis as shown in Fig. 2. Also, Cu(II) and Co(II) complexes were examined at RT through X-ray diffraction by applying (Cu, Kα) radiation. The obtained diffraction patterns as shown in Fig. 3 were recorded in the range of 10° < 2θ < 80° (Khan et al., 2013). The patterns had sharp peaks that refer to the formation of well-defined distorted crystalline structure. Some crystal parameters were estimated by FWHM method on characteristic peak and applying known equations. Such parameters were the particulate sizes (0.591 &1.261 nm), the diffraction angles (21.96° & 23.32°), the d-spacing (2.059 &1.945 Å) and FWHM (0.2641 &0.1247) for Cu (II) and Co (II) complexes, respectively.![SEM and EDX views of (A) [Zn(L)(H2O)2]·2H2O, (B) [Pd(H2L)Cl2] and (C) [UO2(H2L)(OAc)2]·2H2O complexes.](/content/184/2020/13/8/img/10.1016_j.arabjc.2020.05.033-fig3.png)
SEM and EDX views of (A) [Zn(L)(H2O)2]·2H2O, (B) [Pd(H2L)Cl2] and (C) [UO2(H2L)(OAc)2]·2H2O complexes.
![X ray diffract grams patterns of (A) [Co(HL)(OAc)(H2O)]·H2O and (B) [Cu(L)(H2O)2]·2H2O.](/content/184/2020/13/8/img/10.1016_j.arabjc.2020.05.033-fig4.png)
X ray diffract grams patterns of (A) [Co(HL)(OAc)(H2O)]·H2O and (B) [Cu(L)(H2O)2]·2H2O.
3.5 Thermal analysis and kinetics
TGA curves for two chosen complexes, Co(II) and Cu(II) (Fig. 4S), were obtained over 20–800 °C range at constant heating rate (10 °C min−1). The thermal instability character was dominated for the two complexes due to presence of crystal water molecules, which expelled at the first stage (≈40–120 °C). The successive three degradation stages were recorded till ≈550 °C, which sufficient to distort the complexes completely leaving the residual part of MO form (Table 1S). The kinetics parameters were calculated by two standard methods for confirmation as Coats-Redfern (Coats and Redfern, 1964) and Horowitz-Metzger (Horowitz and Metzger, 1963).
-
Coats-Redfern method
Coats-Redfern relation is as follow;
-
B.
Horowitz-Metzger Method
Horowitz-Metzger relation is as follow; where θ = T-Ts, Ts is the DrTG peak temperature, T is the temperature consistent to the weight loss (Wt). In this method a straight line detected at the left hand sides of the last two equations versus θ with a slope of Ea/RTs2 (Yusuff and Sreekala, 1990) as shown in Fig. 6S & Table 3S.
-
C.
Thermodynamic parameters
ΔS, ΔH, A, Ea and ΔG were the parameters calculated based on activation energy values as well as pre-exponential factor (A) by using known equations (Frost and Pearson, 1961) as follow; ΔH = E-RT, ΔS = R ln h A /Kb T and ΔG = ΔH − TΔS. These parameters were obtained over all decomposition stages via Coats-Redfern and Horowitz- Metzger methods and revealed following information; i) successive increase in ΔH and Ea values from step to another, indicates the rigidity of the remaining moiety after decomposing water molecules in endothermic process. ii) The suitable order applied was n = 1. iii) Non-spontaneous characteristic was prevailed on most decomposition steps (−ve ΔS). iii) ΔG values increased from step to another in agreement with increasing the rigidity for the remaining part in sequenced steps.
3.6 Hirshfeld surface properties
Molecular packing within crystals can be imagined and studied by using crystal explorer 3.1 software (Turner et al., 2011) over exported files after orientation by VESTA package (Momma and Izumi, 2011). The 3D-crystal structure of all compounds were established over program-screen after energy minimization, through d norm (A) and curvedness (B) styles (Fig. 4 &7S). Moreover, the cell-unit was built for the ligand through VESTA package, which appeared as a face-cantered cubic-cell unit. The degree of contact between molecules can be estimated from crystal model of normalized contact distance (d norm). This is indicated by three colours, red, blue and white, which refer to strong, weak and moderate contact, respectively. This assumption is based on van der Waals radii for short (strong < 0) or long (weak) contact distance (Seth et al., 2011). Thus, the best molecular packing may be expected in Co(II) and Pd(II) crystals by contact lengths of −0.557 and −0.539 Å, respectively(Table 4S). Furthermore, the 3D-curvedness style for such complexes, which considered the function of square root curvature that appeared high, signify the ease of splitting surface into contact patches (Madhankumar et al., 2019). This assumption may be asserted from asphericity and surface area of crystals (Table 4). Moreover, 2D-fingerprint plots (Fig. 5 & 8S) were extracted according to elemental contribution in contact surface, which show the active role of O, S, N and Cl atoms (Skovsen et al., 2010). For instance, the crystal-fingerprint of the ligand (Fig. 5) displayed the following satisfactory contributions; N—H(4.1%), O—H(7.1%) and S—H(4.8%).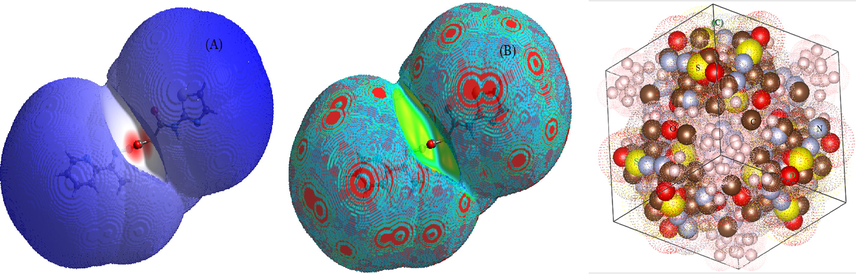
Hirshfeld surface maps as d norm (A) , curvedness (B) and cubic-crystal (C) of the Schiff base ligand.
Properties
H2L
Co(II)complex
Cu(II)complex
Pd(II)complex
Zn(II)complex
Volume (Å3)
3125.67
4046.01
2126.09
2759.31
2970.62
Area (Å2)
1412.51
1496.52
1079.29
1418.01
1318.79
Globularity
0.732
0.821
0.741
0.722
0.758
Asphericity
0.163
0.065
0.139
0.077
0.142
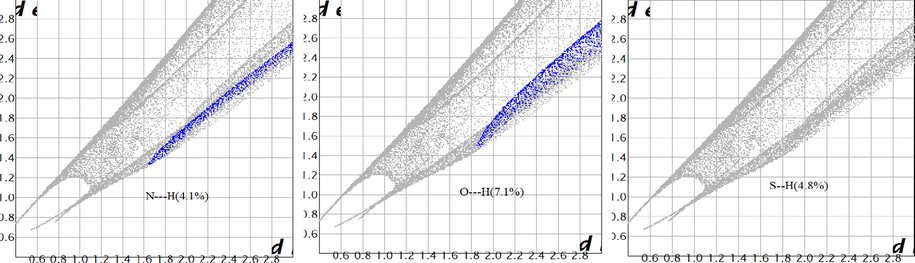
2D fingerprint plots for contributing atoms in molecular packing of the ligand.
3.7 Optimization process by applying DFT theory
The host-gust interaction between Schiff base and metal ions can be studied by applying DFT. The optimized structures for the ligand (H2L) and its complexes were shown in (Fig. 9S). The HOMO and LUMO patterns were estimated (Fig. 10S) from chk files and appeared concentrated in two opposite zones in the ligand itself. Such appearance was fairly remaining in the metal ion complexes. Moreover, other important characteristics as; total energy, binding energy, dipole moment, ELUMO & EHOMO, were obtained (Table 5S). From them, the following information can be extracted;
1) The energy gap (Δ = ELUMO − EHOMO) values appeared significantly reduced in complexes. This indicates the ease of electronic transition within the complexes under metal ion impact. 2) The lower binding energy of all complexes indicates their stability in comparing to the free ligand. 3) Increasing dipole moment values over all complexes due to to the presence of metal atoms that coordinately bind with ligand sites. 4) Increasing in lengths of some bonds within the complexes is legally due to coordination with metal atoms (Fig. 11S).
3.7.1 Molecular electrostatic potential features
MEP realized as the electronic density and can be considered as an exceptionally helpful detector for determining the position of electrophilic and nucleophilic reactions (Tanak et al., 2011). The 3D plots of MEP were strained for H2L as well as its complexes (Fig. 12S). Accordingly, the blue region indicates the most electron-poor area that prefer the nucleophilic attack while, the red region indicates the most electron-rich region that prefer the electrophilic attack (Grzybkowski and Pastewski, 1980). Whenever, the moderate region (green) indicates a neutral electrostatic area.
3.8 Conductometric titrations
From specific conductance quantities (Ks), the molar conductance (/\m) values were estimated (El-Shishtawi et al., 2010) by using the following equation; /\m = [(Ks − Ksolv) × Kcell × 1000]/C. Where Ks is the specific conductance of solution, Ksolv is the specific conductance of solvent, Kcell is the cell-constant (=1), C is the molar concentration of Cu(II) solution and /\m is the various Cu(II) concentrations in the lack of ligand. Therefore, (/\m) was plotted vs. (
) (Fig. 6) and displayed a reverse relation in between. By the way, the plots were established at various Cu(II) concentrations in absence of the ligand (A) or in its existence (B). Moreover, /\o (limiting molar conductance) was determined for Cu(II) solution in the absence of the ligand at infinite dilution from the relation of (/\m) and (
) (Fig. 6A). Sequentially, the relation between /\m and M/L (Fig. 7) was established, then the molar ratio between Cu(II) and the ligand (L) was obtained. As well as, the association constants of Cu(II) in the presence of ligand could be calculated by this equation (Hamada et al. 2009; Christensen et al., 1971) KA = Λ02 (Λ0 − Λm)/4Cm2 2γ± Λm3S(Z). Where, Cm is the metal concentration, S(Z) is the Fuoss-Shedlovsky factor of strong electrolytes (=1) (Covington and Dickinson, 1973) and γ± is the activity co-efficient. The Gibbs free energy values of association (ΔGA at 294.15 K) (El-Dossoki, 2008; Tekeda, 1983) have been calculated through association constant values by this equation; Δ GA- =RT ln KA (R the gas constant & T the absolute temperature) (Table 5). The association free energies obtained are small and spontaneously improved the presence of electrostatic attraction force in the solution. Moreover, the formation constants (Kf) for Cu(II)-H2L complex can be calculated from this equation (Rahmi-Nasrabadi et al., 2009; Filippovic et al., 2009); Kf = Λm − Λobs/(Λobs − ΛML)[L]. Where, /\m is the molar conductance of metal sulphate without ligand, /\obs is the molar conductance of solution during titration and /\ML is the molar conductance of the complex ion. Also, the Gibbs free energy values of formation for Cu(II) complex were calculated by this equation; ΔGf = −RT ln Kf (Table 6). Fig. 7 displayed the two straight lines intersected at a point for 2 M:1L molar ratio of the complex formed. While, the Gibbs free energy values for complex formation were also estimated and displayed (Table 6). /\o = 26 cm2.ohm−1. /\M = 13 cm2 ohm−1, /\ML = 17 cm2 ohm−1.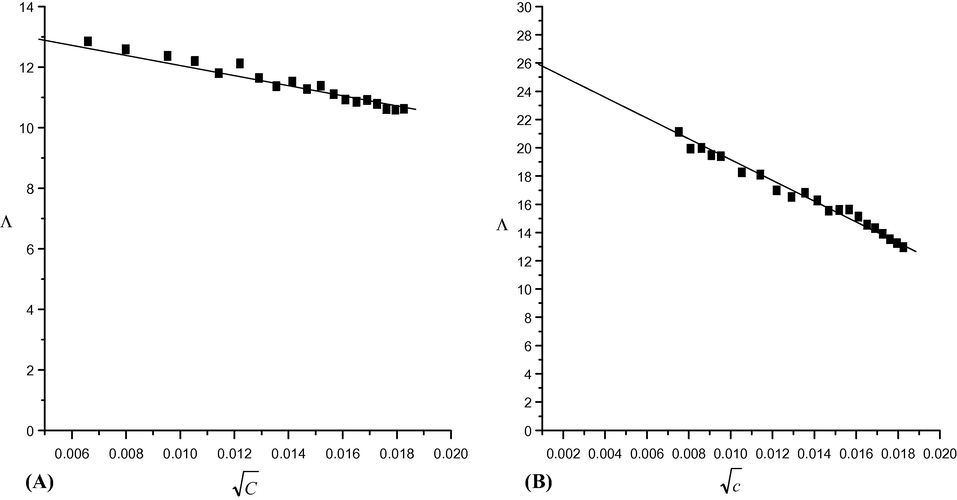
The relation between molar conductance and (
) of (A) CuSO4 alone (B) in the presence of H2L in ethanol at 294.15 K.
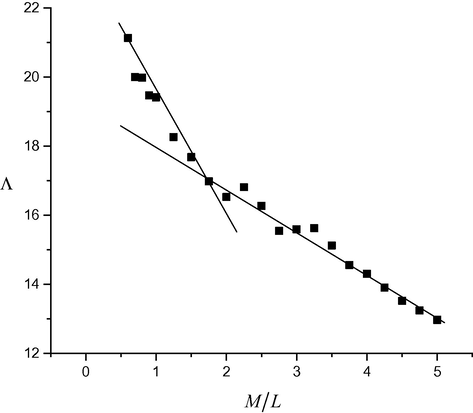
The relation between molar conductance and the molar ratio (M/L) of (A) CuSO4 in the presence of H2L in ethanol at 294.15 K.
/\m (cm2 Ohm−1)
Cm (mol.L-1)
KA
ΔGA (kJ/mol)
16.80
18.367E-05
1.3083
−957.26
16.26
20.000E-05
1.5273
−1035.78
15.62
21.568E-05
1.8393
−1490.31
15.58
23.076E-05
1.8588
−1516.19
15.54
24.528E-05
1.8837
−1548.68
15.12
25.925E-05
2.1267
−1845.46
14.55
27.272E-05
2.5095
−2250.15
/\obs (cm2 Ohm−1)
[L]
Kf
ΔGf (kJ/mol)
16.26
8.000E−05
9.790E−05
21707.54
15.62
7.843E−05
11.534E−05
22008.80
15.58
7.692E−05
11.921E−05
22100.20
15.54
7.547E−05
12.303E−05
22181.22
15.12
7.407E−05
14.011E−05
22577.13
3.9 Biological activity
The Schiff bases biological activity stimulated us to assume systematic studies on their complexation affinity and test their abilities compared to economically vital antifungal as well as antibacterial drugs (Thimmaiah et al., 1984; Nagar, 1990).
3.9.1 Antifungal and antimicrobial activity
The outcomes show that the ligand and some of it's complexes have a considerable activity against C. albicans and A. flavus (Table 7). Among all the investigated compounds, the ligand and its Zn(II) complex exhibited the comparable activity with the Fluconazole (standard drug) against the two kinds of fungi. The antimicrobial screening was done towards Gram-positive bacteria (S. aureus; B. subtilis) and two Gram-negative bacteria (E. coli and P. aeuroginosa) in comparing to Ciprofloxacin (drug) (Johari and Sharma, 1988; Abd El-Wahab and El-Sarrag, 2004; Panchal et al., 2005). The activity of the ligand (H2L) and its Zn(II) complex close to that of standard antibiotic (Ciprofloxacin). The activity could be correlated to the lipophilicity that attached with the reduced polarity over the whole molecule (as Ddebye). Also, the presence of metal atom may raise the toxic ability by a little magnitude, which is desirable effect in biological efficiency (Johari and Sharma, 1988).
Compound
E. coli
P. aeuroginosa
S. aureus
B. subtilis
C. Albicans
A. flavus
Ciprofloxacin
1.56
0.78
1.56
0.39
–
–
Fluconazole
–
–
–
–
1.56
0.78
(1)
4.68
1.56
3.125
1.17
3.125
1.56
(2)
75.0
50.0
12.5
6.25
18.75
4.68
(3)
>100
75.0
>100
>100
75.0
37.5
(4)
>100
>100
37.5
25.0
37.5
9.37
(5)
>100
>100
75.0
50.0
>100
>100
(6)
12.5
6.25
6.25
3.125
9.37
3.125
3.9.2 Antioxidant assay
Regarding all compounds, ABTS method was applied in order to predict the antioxidant order of them (Kostova and Saso, 2013). The ligand (H2L = 76.4%) and its Zn(II) complex (69.5%) displayed effective antioxidant feature in comparing to ascorbic-acid (Table 8). On the other hand, the anti-oxidant behavior was also tested on erythrocyte hemolysis. Most compounds exhibited potent anti-oxidative feature in hemolysis assay (Table 7S). The effectiveness reached to the superiority of reference drug itself (Table 9). Such antioxidant feature may refer to the existence of intensive donor atoms (ON).
ABTS
Abs. (control)-Abs. (test)/Abs. (control) × 100Method
% inhibition
Absorbance of samples
Compounds
0%
0.495
Control of ABTS
88.7%
0.056
Ascorbic-acid
76.4%
0.117
(1)
64.0%
0.178
(2)
54.3%
0.226
(3)
60.6%
0.195
(4)
35.3%
0.320
(5)
69.5%
0.151
(6)
Compounds
Erythrocyte hemolysis A/B × 100
Absorbance of samples (A)%hemolysis
Absorbance of H2O (B)
0.965
–
Ascorbic-acid
0.039
4.04%
(1)
0.052
5.38%
(2)
0.153
15.85%
(3)
0.068
7.04%
(4)
0.046
4.76%
(5)
0.021
2.17%
(6)
0.058
6.01%
3.9.3 Cytotoxic study towards HCT-116 cell line
All compounds were tested against colorectal carcinoma cells line, the outcomes reveal the favorable influence of H2L and its Zn(II) complex (Table 10, Fig. 8). This fact depends on the IC50 values, which significantly reduced for the ligand and its complex (Yousef et al., 2011).
Compounds
In vitro Cytotoxicity IC50 (µg/ml)
HCT-116
5-FU
5.2 ± 0.31
(1)
9.5 ± 0.78
(2)
40.5 ± 3.11
(3)
50.1 ± 4.65
(4)
58.7 ± 4.12
(5)
94.2 ± 5.76
(6)
15.8 ± 1.23
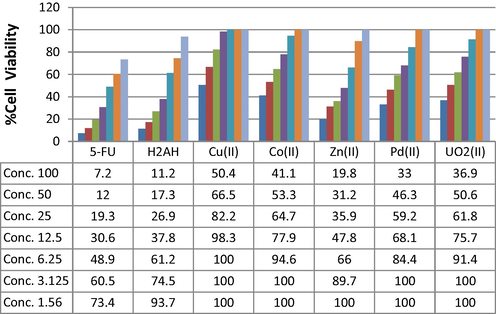
Dose-dependent effects of H2L and it's Cu(II), Co(II), Zn(II), Pd(II), UO2(II) complexes on cell viability of HCT-116 cell line.
3.10 Drug-likeness study
Depending on molecular structure, we explored in-silico study through drug-likeness ability of some compounds to predict structural-activity relationship by Swiss ADME as a website. Such tool is easy to use for evaluating many of physical and pharmacological parameters (Shaaban et al., 2018). These parameters were displayed in Table 11 and computationally graphed (Fig. 13S). These parameters as, TPSA (topological polar surface area), which indicates the summation for the contribution of polar fragments in the compound surface. Also, Log Po/w is the partition coefficient that significant in drug discovery and has a revers relation with the lipophilicity. In addition to, gastrointestinal absorption (GI), blood-brain barrier (BBB) and skin permeation (Log Kp) were estimated. Moreover, the synthetic accessibility score (SA), which appears in the range of 1–10 from ease to difficult synthesis, was also obtained. Regarding almost all compounds the data revealed the reduced polarity, significant lipophilic feature as well as the ease of their synthesis.
Properties
H2L
Co(II) complex
Cu(II) complex
Pd(II) complex
Zn(II) complex
TPSA (Å2)
124.58
136.80
119.73
116.62
119.73
Log Po/w
1.25
0.04
−0.32
1.25
−0.32
GI absorption
High
High
High
High
High
BBB permeant
No
No
No
No
No
Synthetic accessibility(SA)
2.86
4.73
4.82
4.17
4.73
Log Kp (skin permeation)
−7.03 cm/s
−7.76 cm/s
−7.50 cm/s
−6.38 cm/s
−7.51 cm/s
3.11 Docking simulation
Such in-silico study was implemented to confirm all above data that has been resulted from in to vitro in study. MOE-docking software is considered the most advanced tool provides strict confirmation for biological results. As well as this in-silico way adds a considerable view on the expected biological feature, which may be appeared also in-vitro study. Two compounds (H2L and Zn(II) complex) were chosen to study their behaviour within pathogen-cells, to assess the extent of inhibition for cell-growth. The targeted cell-proteins have been chosen that belong free radicals (1cca), colorectal cancer (2hq6), aspergillus flavus (6iv7) and bacillus subtilis kinase (1p3j). This selection is based on inhibition effectiveness that recorded in-vitro screening (Goodin and McRee, 1993). All backup interaction information (Table 12) and supporting patterns (Fig. 9 & 14S-16S) were extracted from real paths for examination and comparison (Abdellattif et al., 2018). These significant notices were collected;
-
The binding sites were N10, 18, 24 and O1, 4, 13, 16
-
The responsible-coordinating receptors were Glutamate, Aspartate, Arginine, Lysine and Histidine
-
The interaction types were H-donor, H-acceptor and ionic in un-tricky paths (bond length ≤ 3.5 Å)
-
The values of scoring energy as well as the internal energies offer the following inhibitory order H2L-1p3j ˃ H2L-1cca ˃ Zn(II) complex-1cca ˃ Zn(II) complex-6iv7 ˃ H2L-6iv7 ˃ Zn(II) complex-1p3j. This behaviour is distinctively agrees with the presented practical results.
| Compounds | Proteins | Ligand | Receptor | Interaction | Distance(Å) | E (Kcal/mol) | S(energy score) |
|---|---|---|---|---|---|---|---|
| H2L | 1cca | N10 | NE2 HIS 175 (A) | H-donor | 3.37 | −1.1 | −7.5507 |
| 2hq6 | O16 O16 N18 |
NH1ARG 119 (A) NH2ARG 119 (A) NH2ARG 119 (A) | H-acceptor H-acceptor H-acceptor |
3.19 2.99 3.02 |
−2.6 –5.1 –1.5 |
−5.2541 | |
| 6iv7 | O13 | N ARG 197 (B) | H-acceptor | 3.27 | −2.0 | −6.0348 | |
| 1p3j | N8 O13 |
NH1ARG 160 (A) NZ LYS 13 (A) | H-acceptor H-acceptor |
3.16 3.01 |
−4.0 –7.7 |
−8.2722 | |
| Zn(II) complex | 1cca | O1 O1 O4 |
OE1 GLU 98 (A) OE2 GLU 98 (A) OE2 GLU 98 (A) | Ionic ionic ionic |
3.08 2.80 2.57 |
−3.9 –6.0 –8.1 |
−6.9428 |
| 2hq6 | O4 N24 O4 |
OD2 ASP 136 (A) OD2 ASP 25 (A) OD2 ASP 136 (A) | H-donor H-donor ionic |
2.58 2.95 2.58 |
−19.0 –4.2 –8.0 |
−5.0114 | |
| 6iv7 | O4 O4 N24 |
O LEU 292 (A) OD2 ASP 296 (A) O LEU 292 (A) | H-donor H-donor H-donor |
2.83 2.74 3.21 |
−19.1 −18.7 –0.7 |
−6.1168 | |
| 1p3j | O1 O4 |
OE2 GLU 98 (A) OE2 GLU 98 (A) | H-donor H-donor |
2.63 2.56 |
−1.5 −5.7 |
−5.6404 |
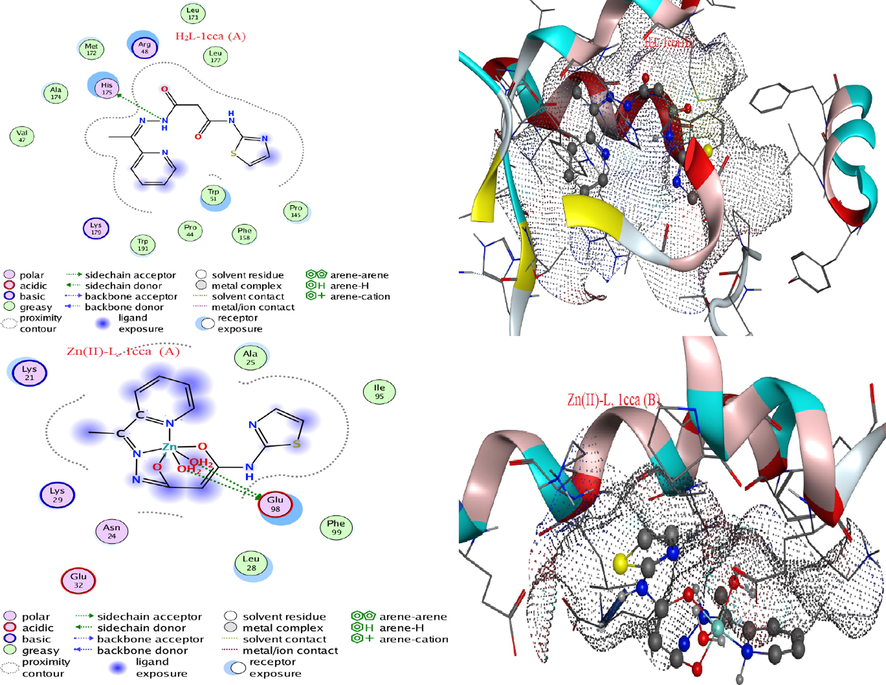
- Interaction validity (A) and surface maps (B)of H2L and Zn(II) complex against 1cca protein.
For sureness, the docking patterns (Fig. 9 & 14S-16S) were obtained for investigation, then the following notices were aggregated regarding 1cca (for example);
-
Side-chain acceptor type towards polar amino acids was appeared with H2L, while side-chain donor type towards acidic receptors was appeared with Zn(II) complex.
-
Reduced ligand exposed surface was observed in comparing to that broadly appeared with receptors.
-
A deliberate proximity contour was observed around the two docking-complexes (El-Metwaly et al., 2019).
4 Conclusions
In this article, many complexes for 3-oxo-N'-(1-(pyridin-2-yl)ethylidene)-3-(thiazol-2-ylamino)propanehydrazide were isolated from Co(II), Cu(II), Zn(II), Pd(II) and UO2(II) ions. The characterization step was established based on using many analytical, spectral and conformational tools. This ligand really enriched by multi-donors, exhibited various binding modes within the complexes, as planned. Conductometric titrations were studied between Cu(II) ion and the ligand to extract the molar ratio, the association and formation constants. The biological screening was conducted over all compounds to investigate antioxidant, antibacterial, antifungal and antitumor efficiency. Some of these compounds played well in most cases. Furthermore, the drug-likeness in-silico study displayed data, which reflect the lipophilic feature of all compounds. As well as, the docking simulation agreed comfortably with biological results by the following inhibitory order H2L-1p3j ˃ H2L-1cca ˃ Zn(II) complex-1cca ˃ Zn(II) complex-6iv7 ˃ H2L-6iv7 ˃ Zn(II) complex-1p3j.
Declaration of Competing Interest
The authors declare that they have no known competing financial interests or personal relationships that could have appeared to influence the work reported in this paper.
References
- Spectrochim. Acta A. 2004;60:271.
- Int. J. Pharm. Sci. Res.. 2018;9:1000.
- Food Chem. Toxicol.. 1994;32:31.
- Molecules. 2019;24:1741.
- Eur. J. Med. Chem.. 2009;44:3552.
- Science. 1971;174:459.
- Nature. 1964;201:68.
- Physical Chemistry of Organic Solvent System. London: Plenum Press; 1973.
- J. Biomol. Struct. Dyn.. 2014;32(2):301.
- J. Biomol. Struct. Dyn.. 2017;35(6):1272.
- J. Immunol. Methods. 1986;22:271.
- J. Mol. Liquids. 2008;142:53.
- J. Inorg. Organometal. Polym. Mater.. 2019;30(3):907-922.
- Appl. Organometal Chem. 2019:e5095.
- J. Chem. Eng. Data. 2010;55:5422.
- Spectrochimi. Acta Part A. 2014;132:846.
- Inorg. Chim. Acta. 2009;362:1996.
- Frisch, M.J., Trucks, G.W., Pople, J.A., 2009. Gaussian 09, Revision B.2, Gaussian, Inc., Pittsburgh, PA.
- Kinetics and Mechanisms. New-York: Wiley; 1961.
- Biochemistry. 1993;32(13):3313.
- Electrochimica. Acta. 1980;25:279.
- South Braz. J. Chem.. 2009;17:33.
- Medical Batteriology – A Practical Approach. United Kingdom: Oxford University Press; 1994. p. :181-194.
- Ab Initio Molecular Orbital Theory. New York: Wiley; 1986.
- Anal. Chem.. 1963;25:1464.
- J. Indian Chem. Soc.. 1988;65:793.
- Anal. Fr.. 1995;23:453.
- Inorg. Chem. Commun.. 2013;35:104.
- Curr. Med. Chem.. 2013;20:4609.
- BMC Pharmacol. Toxicol.. 2018;19:8.
- Inorganic Electronic Spectroscopy. Amsterdam: Elsevier; 1968.
- Eur. J. Med. Chem.. 2008;43:348.
- J. Mol. Struc.. 2019;1181:118.
- Talanta. 2007;71:610.
- Nature. 1998;394:287.
- J. Appl. Crystallogr.. 2011;44:1272.
- J. Immunol. Methods. 1983;65:55.
- J. Inorg. Biochem.. 1990;40:349.
- Trans. Met. Chem.. 1996;21:507.
- Spectrochim. Acta Part A. 2009;70:641.
- Toxicol. Environ. Chem.. 2005;87:313.
- J. Mol. Liquids. 2009;144:97.
- Synth. React. Inorg. Met.-Org. Chem.. 1996;26:1705.
- Spectrochim. Acta Part A. 2009;74:869.
- Cryst. Eng. Comm.. 2011;13(14):4528.
- Bioorg. Chem.. 2018;80:43.
- Spectrochim. Acta Part A. 2008;70:686.
- Spectrochim. Acta Part A. 2008;71:17.
- Inorg. Chem.. 2010;49:9343.
- Bull. Korean Chem. Soc.. 2011;32:673.
- Bull. Chem. Soc. Jpn. 1983;56:3600.
- Polyhedron. 1984;3:1237.
- Cryst. Eng. Comm.. 2011;13(6):1804.
- Quantitative Inorganic Analysis. London: Longmans; 1989.
- de Willian, E.A., Ander, F.P., Alexandre, A. de C., Elaine, F.F. da C., Teodorico, C.R., 2016. Lett. Drug Des. Discov. 13(5), 360.
- J. Med. Med. Sci.. 2011;3:37.
- Thermochim. Acta. 1990;159:357.
- J. Mol. Struct.. 2015;1079:203.
- Zaky, R.R., 2011. Phosphorus Sulfer Silicon and Related Elements, 186, 365.
- Inorg. Chim. Acta. 2010;363:289.
Appendix A
Supplementary material
Supplementary data to this article can be found online at https://doi.org/10.1016/j.arabjc.2020.05.033.
Appendix A
Supplementary material
The following are the Supplementary data to this article:Supplementary data 1
Supplementary data 1


