

Translate this page into:
Green synthesis of copper oxide nanoparticles CuO NPs from Eucalyptus Globoulus leaf extract: Adsorption and design of experiments
-
Received: ,
Accepted: ,
This article was originally published by Elsevier and was migrated to Scientific Scholar after the change of Publisher.
Peer review under responsibility of King Saud University.
Abstract
The study is concerned with synthesizing copper oxide nanoparticles with leaf extract Eucalyptus Globoulus. The results of scanning electron microscopy (SEM) and dynamic light scattering (DLS) revealed that the green synthesized copper oxide nanoparticles are spherical and have a mean particle size of 88 nm, with a negative zeta potential of −16.9 mV. The XRD graph showed the crystalline and monoclinic phases of CuO nanoparticles. The average crystalline size around 85.80 nm was observed by the Debye–Scherrer formula. The adsorption characteristics of the nano-adsorbents were investigated using methyl orange, and the adsorption efficiency at room temperature attained 95 mg/g. Copper oxide nanoparticles (CuO NPs) adsorb methyl orange dye most effectively at pH 4.5 when the dye is applied in quantities of 0.04 g/50 mL. Box–Behnken design (BBD) in response surface methodology (RSM) was used to optimize various process parameters, such as pH solution (X1: 2 – 11), adsorbing dose (X2: 0.01 – 0.08 g/L), [MO] dye concentration (X3: 10 – 80 mg/L). Overall, the adjusted coefficient of determination (R2) value of 0.99 demonstrated that the used model was quite appropriate, and the chosen RSM was effective in optimization the decolorization conditions of MO.
Keywords
Green synthesis
Copper Oxide
Nanoparticles
Removal dye
Methyl Orange
Response surface methodology

- BBD
-
Box Behnken Design
- CuO NPs
-
Copper oxide nanoparticles
- E. Globulus
-
Eucalyptus Globulus
- MO
-
Methyl orange
- RSM
-
The response surface method
Abbreviations
1 Introduction
Methyl orange (MO) is an azo dye used in textiles, food stuffs, paper, and leather industries. However, the release of MO and its products in the environment cause serious pollution problems (Iravani, 2011). Numerous countries are now allocating large sums of funds for the development of water treatment technologies. There are many techniques for dye removal that have been established by researchers around the world, such as photodegradation (Chung et al., 1978; Narasaiah et al., 2017; Chemingui et al., 2019, 2021a), adsorption (Ghaedi et al., 2014; Balcha et al., 2016; Guey et al., 2020; Chemingui et al., 2021b), reverse osmosis (Sebeia et al., 2019) nanofiltration membrane (Nataraj et al., 2009; Sebeia et al., 2019) and oxidation (Alhalili et al., 2021). Adsorption is with no confusion a simple, inexpensive, cost- effective, dependable, and widely used separation method in the treatment of contaminated water. For several years, this method has demonstrated its efficacy in eliminating aqueous pollutants. Nanomaterials as adsorbents have developed water treatment by completely removing numerous dyes from water streams. It is possible to improve the sorption of acidic and basic dyes by using highly nano adsorbents (Roopan et al., 2019).
Metal oxide nanoparticles are particularly useful in chemistry and environmental science owing to their unique physical and chemical characteristics (Beheshtkhoo et al., 2018; Singh et al., 2018). Because of their specific surface area and high density, these nanomaterials produced excellent outcomes and innovative applications as adsorbents (Tang et al., 2013; Sadegh et al., 2017; Chavali and Nikolova, 2019). The response surface method (RSM) is an easy, efficient, and low-cost method for optimizing various parameters with a small number of experiments. Other benefits include the ability to perform analysis of variance to obtain the final formula of removal and the specification of the optimum theoretical conditions. This method can be used as a central composite or as the Box-Behnken method (Zolgharnein et al., 2013; Mohammadi et al., 2017; Chemingui et al., 2021b). To optimize the process parameters, numerous experimental designs have been identified as effective methods. Response surface methodology (RSM) is used when major factors interfere with optimization. To optimize a four-factor process, Box–Behnken design requires the least amount of experience of all RSM designs; it is used to avoid experiments conducted under extreme conditions.
There are several types of metal oxide nanoparticles, but copper oxide nanoparticles aim attention because of their promising scientific and industrial applications (Tran and Nguyen, 2014; Gawande et al., 2016; Singh and Rawat, 2016; Akintelu et al., 2020). Copper oxide nanoparticles (CuO NPs) are one of the most researched noble metals due to their exceptional photocatalytic activity (Zeid et al., 2020) and similarities to other metallic nanoparticles (Ashok Kumar et al., 2014). Copper oxide is a semi-conductive material with various magnetic, optical, and electrical properties (Dinesh et al., 2017), and its fabrication has aroused interest among researchers due to its wide range of applications (Zoolfakar et al., 2014). Copper oxide nanoparticles as adsorbents for dye removal have also been the subject of very few studies. Indeed, CuO nanoparticles (CuO NPs) get a smaller diffusion pathway than conventional adsorbents such as activated carbon, resulting in higher adsorption capacity and faster adsorption kinetics. Therefore, it has been noted that nano-CuO can effectively remove environmental contaminants because of its ease of preparation, low cost of activity, and non-toxicity (Bashiri et al., 2018). Then again, successful adsorbents and environmentally friendly applications are still required to exceed the expectations. Metal oxide-dependent nanoparticles have been extensively studied in nanoscale adsorbents over the last decade. Precipitation/co-precipitation (Phiwdang et al., 2013; Rangel et al., 2019), thermal decomposition (Abdel-Monem et al., 2017), sol–gel (Etefagh et al., 2013), among others, have been used to prepare CuO nanoparticles. The above chemical synthesis techniques are very effective, but they have many restrictions, such as being high priced, using expensive, combustible organic solvents, and hazardous materials, and producing toxic byproducts. The green synthesis of CuO NPs, on the other hand, has significant advantages. Green chemistry is a type of sustainable chemistry that is used to reduce the production of hazardous substances (Ramesh et al., 2017). Nowadays, green synthesis plays an essential part in the preparation of copper oxide nanoparticles. It removes the organic solvent from synthetic protocols and eliminates the toxic chemicals produced by chemical reactions. The advantage of plant extracts is that they provide a biological synthesis route for several nanoparticles that is more environmentally friendly, cost-effective, non-toxic, comfortable, and provides a regulated synthesis with defined size and morphology of nanoparticles (Varadavenkatesan et al., 2021).
Plant-mediated green synthesis of nanoparticles has recently become popular as a low-cost, eco - friendly alternative to chemical and physical methods. In this regard, numerous plants have been investigated for the synthesis of copper oxide nanoparticles. As examples, Ruellia tuberosa leaf extract (Singh et al., 2019), Drypetes sepiaria Leaf extract (Narasaiah et al., 2017), Banana peel extract (Aminuzzaman et al., 2017), Nerium oleander leaves extract (Sebeia et al., 2019), Aloe Vera leaf extract (Kumar et al., 2015), and Ixiro coccinea leaves extract (Vishveshvar et al., 2018).
Furthermore, plant-based CuO nanoparticles have been successfully used in a variety of biological and non-biological activities, including cytotoxicity (Saif et al., 2016) antibacterial activity (Naz et al., 2020), and photocatalytic activity (Narasaiah et al., 2017). Nevertheless, because the toxicity of CuO NPs is a major worry, we investigated the toxic effects of CuO NPs produced with Pterospermum acerifolium leaf extract. When tested on Daphnia, it was discovered that copper oxide nanoparticles produced by P. acerifolium were more stable than engineered CuO NPs and demonstrates less NPs toxicity for unicellular alga Chlamydomonas reinhardtii (Nguyen et al., 2018). Due to this finding, researchers believe the green-synthesised CuO NPs are safer to handle compared to those made chemically.
The synthesis of CuO NPs using aqueous leaf extract of Eucalyptus Globulus is not documented in the literature. The plant Eucalyptus Globulus is a member of the rutaceae family and is widely used in traditional medicinal practices of the Khasi tribe in North-Eastern India and neighboring regions such as South-East Asia. Eucalyptus globulus is a traditional medicinal plant used for anti-helminthic, controlling hyperglycemia, and treatment of cholera, tonic for fever, remedy for skin diseases, diseases of the mouth and teeth, and possesses antioxidant, antidiabetic, antifungal, and antimicrobial activities (Tyagi and Malik, 2011; Jerbi et al., 2017; Saka et al., 2017). In this paper, we synthesized CuO NPs using Eucalyptus globulus leaf extract as a stabilizer and identified their authority to eliminate Methyl orange dye from water. A simple and environmentally friendly method is described here for the first time, using aqueous leaf extract to prepare CuO nanoparticles. CuO nanoparticles biosynthesized were also tested for their ability to remove the organic dye, MO, from contaminated water. The main idea is to develop methods for understanding the MO adsorption potential of CuO, as CuO is a common adsorbent for removing MO from aqueous solutions. The Box-Behnken design is then used to investigate the effects of three variables on the adsorption system: pH, adsorbent dose, and dye concentration. Furthermore, the analysis sought to ascertain the interactions between the variables under consideration, as well as the best- operating conditions for the process to be carried out. This reduces the number of tests required significantly. The key benefit of this process is its ability that would save time and expense in the process industries. The goal of this research is to investigate and comprehend the potential of using CuO NPs synthesized as an adsorbent to reduce pollutants in existing wastewater from dairy plants.
2 Materials and methods
2.1 Chemicals and materials
Anhydrous copper sulfate (analytical grade of purity 95%) was purchased from Sigma Aldrich. Methyl orange (chemical formula C16H18N3SCl, molecular weight = 319.85 g/mol, λmax = 464 nm) dye was purchased from Sigma Aldrich. Distilled water was used for the preparation of extract and the solutions of metal salt.
2.2 Preparation of leaf extract
The leaves of the Eucalyptus globulus plant were collected from the Shaqra region, Saudi Arabia. Dix grams of dry leaves were added to 100 mL of distilled water in 250 mL beaker and heated at 60 °C for 30 min. The leaf debris was separated from pale yellow extract formed by centrifugation at 10,000 rpm for 10 min, and the fresh supernatant obtained was used for nanoparticle synthesis.
2.3 Description of biosynthesis protocol
Copper oxide nanoparticles (CuO NPs) were obtained by combining the prepared leaf extract in a 1:9 ratio with a 1 mM concentrated anhydrous copper sulfate solution (Fig. 1). The mixture was stirred at room temperature for two hours. CuO NPs were synthesized, as evidenced by the solution's brown color. After 24 h of incubation, the colloidal was centrifuged at 10,000 rpm for 10 min to obtain a pellet, which was then purified by washing three to five times with double distilled water. The final residue obtained was calcinated in a muffle furnace at 400 °C to remove the attached organic matter of plant, powdered and stored for further use.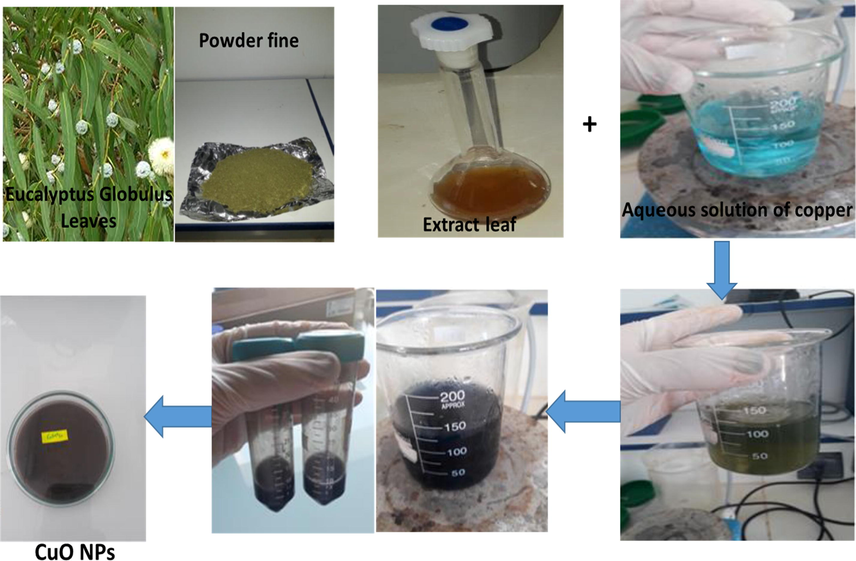
Major steps of the biosynthesis of copper oxide nanoparticles using Eucalyptus Globulus leaves extract for methyl orange sorption.
2.4 Characterization of synthesized nanoparticles
The bioreduction of copper ions to CuO NPs was initially confirmed by visual color change. For determining the structure of as-synthesized nanoparticles, the dried powder was scanned under XRD (PANalytical X’pert Pro) of scattering angle (2θ) between 20 and 80. For FT-IR analysis (Thermo Nicolet, Model 6700), the centrifuged nanoparticle pellet was dried and mixed with KBr and examined in a range of 400 to 4000 cm−1. The biomolecules responsible for reducing, capping, and stabilizing the as-synthesized nanoparticles were determined from this spectrum. For morphology analysis, a fresh nano-colloid solution obtained was viewed under HRTEM (FEI, USA, Model Tecnai G2 F30-STWIN).
2.5 Adsorption studies
Batch sorption experiments were carried out to evaluate the dye adsorption ability. The effects of adsorbent dosage (1 to 8 g/L), initial dye concentration (10 to 80 mg/L), and contact time (20 min to 6 h) were studied. Each parameter was tested independently while the other variables remained constant. First, known concentrations of as-synthesized CuO NPs were added to 50 mL of dye solution and mixed vigorously with a magnetic stirrer at 300 rpm at room temperature. The samples were taken at different fixed time intervals, centrifuged at 10,000 rpm for 15 min, and the concentration of MO dye present in the sample was evaluated. Afterwards, the dye concentration in the purified supernatant was examined by a 464 nm UV–Vis spectrophotometer. The quantity of adsorbent was evaluated by using variation in the dye concentration in the aqueous solution sorption process, as shown in Eq. (1):
2.6 Box–Behnken design
Response surface methodology (RSM) is a combination of statistical and mathematical methods used to identify the favorable conditions for carrying out experiments with the fewest number of expected experiments (Zhang et al., 2017; Kumar et al., 2021). Furthermore, it was used as an empirical study to investigate the relationship between the measured responses and the number of independent variables to optimize the response. To clarify the relationship between the independent variables and the response function, the Box-Behnken design (BBD) was used. A three-factor, three-level (-1, 0 and + 1) Box Behnken design with a total of 15 experimental runs was used to optimize the MO removal process on CuO NPs using Minitab-17 software. Three independent variables (X1: pH, X2: dose, and X3: initial MO concentration) were chosen to investigate the significant effect of factors on the adsorption procedure. The polynomial equation to experimental data, analysis of variance (ANOVA), and predicted response obtained by the model were used to examine the results. Throughout this study, the challenge in the design was to optimize the experimental conditions for the best removal of MO by CuO. According to the preliminary testing, the method variables and their levels are collected in Table.1. The surface response model evaluated the experimental data, and the second-order polynomial model was estimated using Eq. (3).
pH
X1
Mass (g)
X2
[MO] (mg/L)
X3
Low (-1)
2
0.01
10
Center (0)
6.5
0.045
45
High (+1)
11
0.08
80
2.7 Langmuir, Freundlich and Temkin model parameters
In this study, three models were used to describe the correlation between the quantity of MO adsorbed and its equilibrium concentration. The coefficient of correlation R2 value of each plot was used to judge the practicability of the isotherm models to the adsorption study under the experimental conditions (concentration range 10–80 mg/l, adsorbent dose 4 g/l, temperature 25 °C, and contact time 2 h). The higher R2 value improved the fit. The adsorption data in this study were fitted to Freundlich, Temkin, and Langmuir isotherm models, and the correlation coefficient (R2) was calculated for these models.
The Langmuir isotherm model is based on an idealized assumption of identical sorption heat and monolayer sorption (Langmuir, 1916). The non-linear form of the Langmuir isotherm model is given as:
The plot of qe against Ce produced a fitted curve, and the Langmuir constants were calculated from the adsorption data plot (Table 3). For all concentrations of dye, the important RL factor measured indicated that the whole process was great because its values were in the range of 0 < RL < 1. The RL equation as noted by:
The Freundlich model describes the formation of multilayers by adsorbate molecules on the adsorbent surface, due to the different affinities for various active sites on the adsorbent surface (Freundlich, 1907). The non-linear form of Freundlich model is given as:
Poor curves were obtained when qe was plotted against Ce, suggesting that the adsorption process did not follow this model. The adsorption data plot was used to calculate the values of the Freundlich equilibrium coefficients KF and n (Table 3). The adsorption intensity or surface heterogeneity is measured by the parameter 1/n, which ranges between 0 and 1.
According to the Temkin model, adsorbent-adsorbate interactions cannot be ignored during the adsorption process, and heat of adsorption decreases linearly with adsorbate coverage due to the interaction (Temkin and Pyzhev, 1939). The Temkin model is written as follows:
A plot of qe versus Ce reveals that adsorption energy decreases linearly as the adsorption sites is loaded (Table 3). Because of the adsorbent-adsorbate interactions, the heat of adsorption of all molecules in the layer decreases linearly with surface coverage. It also suggests that adsorption has a uniform distribution of binding energies up to a maximum value.
2.8 Contact time and kinetic study
The kinetic parameters were determined using the pseudo-first and second-order models.
Lagergren suggested the pseudo-first-order kinetic model for the adsorption of solid/liquid systems and its formula is given as:
The linear form of the pseudo-second-order kinetic model can be expressed as:
3 Results and discussion
3.1 Characterization of CuO nanoparticles
X-ray diffraction (XRD) spectra of biosynthesis CuO Nps showed a series of diffraction peaks at 32.63, 35.67, 38.78, 48.88, 58.34, 61.69, 68.16, and 75.32°, that was related to the (1 1 0), (1 1 1), (2 0 2), (0 2 0), (1 1 3), (3 1 1), and (0 0 4) planes of monoclinic CuO (JCPDS 80–1916), respectively (Fig. 2), (Amin et al., 2021). The existence of diffraction peaks (between 2 = 35–39°) indicated the formation of CuO (Naz et al., 2019). This affirms the growth of monoclinic crystalline morphology. Copper Oxide nanoparticles are clearly defined and strongly reflected in XRD patterns that provide evidence of CuO nanoparticles' crystalline nature (Bashiri Rezaie et al., 2018). As a result, the current findings are similar to previous reports on CuO synthesis (Rangel et al., 2019). The sharpness of the peaks in XRD spectrum reveals their crystalline structure (Yallappa et al., 2013). For synthesized CuO NPs, the lattice parameters were a = 4.684, b = 3.425, and c = 5.129. The average size of CuO NPs was calculated using Debye–Scherrer formulae (Ghaedi et al., 2014) from the width of the peaks in the XRD spectrum. The calculated size and peak indexing are presented in Table 2.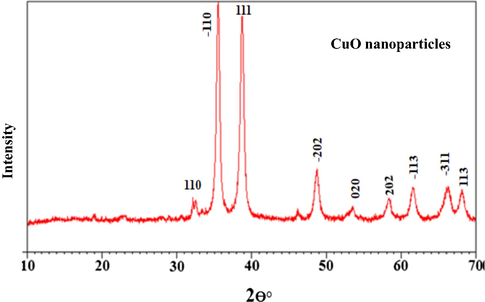
XRD pattern of the CuO NPs.
(hkl)
2ϴ(°)
β (°)
Cos(ϴ)
k
D (nm)
(1 1 0)
32.654
0.001744
2.809
0.89
81.864
(−1 1 0)
35.721
0.003733
2.599
0.89
38.571
(1 1 1)
38.795
0.002145
2.472
0.89
67.717
(−2 0 2)
48.668
0.001036
1.909
0.89
145.15
(0 2 0)
53.314
0.001901
1.623
0.89
80.645
(2 0 2)
58.773
0.003680
1.476
0.89
42.729
(−1 1 3)
62.172
0.001161
1.406
0.89
143.325
(−3 1 1)
66.123
0.001406
1.377
0.89
111.584
(1 1 3)
68.916
0.001814
1.357
0.89
91.600
Isotherm model
Parameters
Langmuir
qm (mg/g)
92.5
b (mg/L)
0.4
R2
0.984
Freundlich
n
2.12
KL (L/g)
28,21
R2
0.778
Temkin
A
4.18
B
16.99
R2
0.824
To identify stretching and vibrating modes in biosynthesized samples, and to know E. Golobulus extract biomolecules which could have been used to reduce or synthesize CuO NPs, FTIR analysis was carried out. The stretching frequency of the —OH group of absorbed water presents on the surface of copper oxide NPs is represented by the broadband in Fig. 3 at 3480 cm−1. Furthermore, peaks observed at 530 cm−1 and 580 cm−1 can be attributed to Cu—O vibrations, confirming the synthesis of CuO nanoparticles (Saif et al., 2016; Aminuzzaman et al., 2017; Vishveshvar et al., 2018).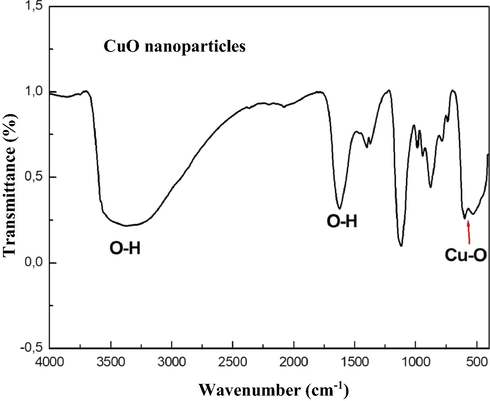
FT-IR spectra of CuO NPs.
Hydrodynamic sized for E. Golobulus-synthesized CuO nanoparticles were found to be 85.3 nm, and the maximum distribution was at 81.92 nm (Fig. 4). Zeta potential, which gives critical information on the dispersion of NPs, in terms of the magnitude of the charge, which indicates the mutual repulsion between the particles (Clayton et al., 2016); moreover, the zeta potential values within −30 range were reported to be more stable in solution (Sousa and Teixeira, 2013). Previously, it was reported that the average zeta potential of CuO nanoparticles ranges from −20 to + 45 mV depending on the pH between 2 and 12 (Cuevas et al., 2015; Mousavi et al., 2018). The higher negative zeta potential (−16.6 mV) in DLS analysis indicated a strong repulsion force between the particles, which resulted in amplification or enhancement of stability.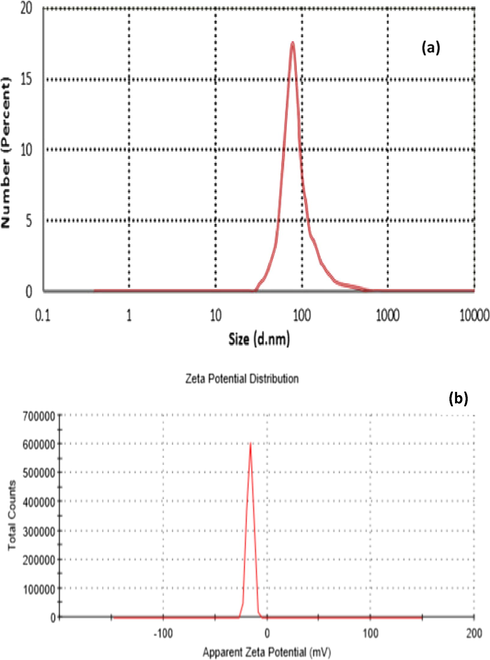
The DLS spectrum depicting the average hydrodynamic size (a) and Zeta potential (b) of CuO nanocolloid after 3 h of reaction time.
The morphological properties of the synthesized CuO NPs were evaluated using FE-SEM. The prepared CuO NPs have a defined rod morphology, as shown in the FE-SEM image in Fig. 5. It has been found that the biological synthesis of CuO NPs produces relatively small quasi-spherical particles of homogeneous dimension. The use of biological components in the synthesis process could describe the slight agglomeration in the as-synthesized nanoparticles. The CuO NPs synthesized from leaf extract had a spherical shape, which was consistent with previous findings (Ijaz et al., 2017; Tavakoli et al., 2019).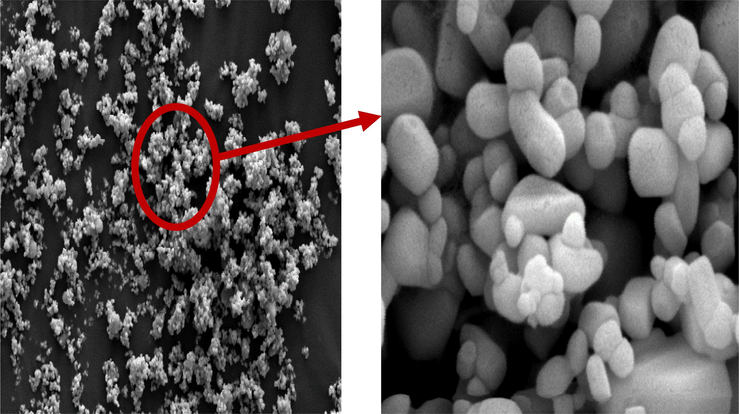
SEM images of CuO NPs.
3.2 Mechanism of CuO NPs synthesis
Plant extracts have a variety of biomolecules, with few being responsible for nanoparticle synthesis, which is why a complex process is to synthesize nanoparticles with such extracting. It is also challenging to even forecast the exact mechanism of the summary process. Earlier, amine, carbonyl, hydroxyl and methoxide are the main functional groups responsible for nanoparticle reduction and stabilization and these functional groups are present in plant metabolites such as alkaloids, carbohydrates, flavonoids, phenol and proteins (Devi et al., 2016). The CuO NPs synthesis mechanism can be summarized as: the polyphenols present in the leaf extract of E. Globolus bind with Cu2+ ions (which are formed after dissolving CuSO4 in water) and form metal complexes which are then reduced to CuO seed particles. The seed particles undergo aggregation, followed by nucleation. The graphical representation of the mechanism of CuO NPs synthesis is presented in Fig. 6. Similar mechanisms for nanoparticle formation were proposed earlier (Buazar et al., 2019; Hekmati, 2019).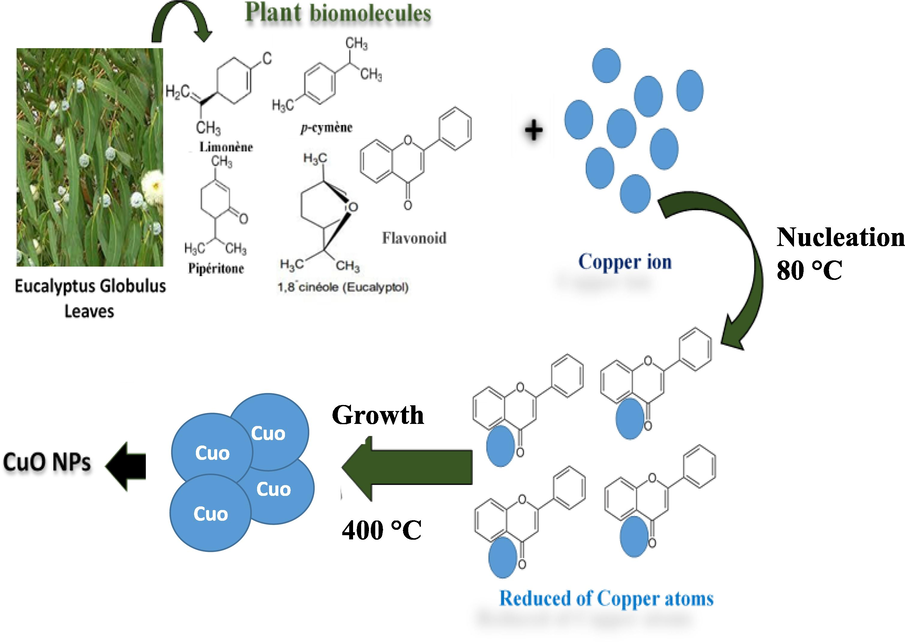
Possible mechanism of formation CuO NPs using leaf extract of E. Globulus.
4 Adsorption results
4.1 Effect of pH
During the adsorption process, pH has a significant impact on the active sites of adsorbents as well as adsorbate molecules. The effect of pH on dye adsorption onto CuO nanoparticles is shown in Fig. 7. The dye removal increased with the increase in pH range from 2 to 6 and then quickly decreased at higher pH up to 11. At low acidic pHs, MO molecules create a positive charge on nitrogen as a monovalent ion (H+), causing electrostatic repulsion with positively charged CuO NPs active sites and resulting in a decrease in % MO adsorption. The highest adsorption was observed at pH 6, which could be attributed to the protonation of functional groups on CuO NPs. When the pH increases above 6, the positive charge detaches and precipitates form as a result of OH– ions competing with MO anions for adsorption sites on the CuO NPs surface. It is possible that the mechanism of MO adsorption engaged a strong Coulomb interconnection between both the positive adsorption active sites of CuO NPs and deprotonated (negatively charged) MO. A few research findings have also shown that increasing the pH value increases cationic dye adsorption (Darwish et al., 2018; Baig et al., 2020). The pH value of 6.5 was chosen as the optimum pH value based on the experimental results.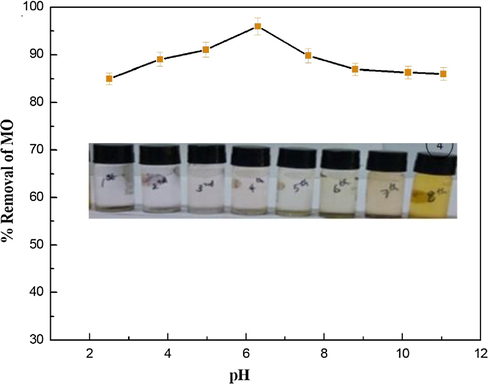
Removal effect of MO solution by CuO nanoparticles at different initial pH.
4.2 Effect of dose adsorbent
Adsorption efficiency is affected by available surface area and binding sites, so proper initial adsorbent dosage is critical (Wang et al., 2011). Fig. 8 depicts the effect of adsorbent dosage on MO adsorption. The increase in % MO removal was rapid at the starting dose of 0.01–0.08 g and then gradually increased until the equilibrium condition of 0.1 g was reached. As the dose is increased, the outermost layer of the adsorbent and its adsorption sites expand, increasing per cent removal efficiency. The accessibility of more surface area is related to this increase in dye removal (Darwish et al., 2018). It has been suggested that an increase in dye removal is due to the abundance of more adsorbents for targeting the dye's chromophoric system. The decrease in adsorption amount (qe) at a higher dose could be associated with the availability of fewer MO molecules due to the presence of a greater number of active sites on the CuO NPs surface. As a result of this experiment, 0.04 g of CuO NPs was selected for future experiments.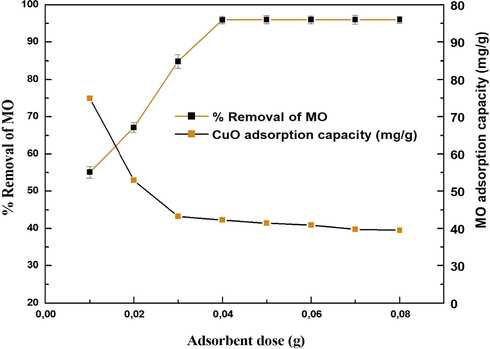
Effect of adsorbent dosage on MO adsorption by CuO nanoparticles.
4.3 Effect of initial concentration and isotherms study
The sorption of methyl orange was evaluated using Langmuir (Fig. 9a,), Freundlich (Fig. 9b) and Temkin (Fig. 9c). The three model parameters were determined and listed in Table 3. By comparing the correlation coefficient, The Langmuir model appeared more suitable to fit the experimental data (R2 > 0.96) suggesting that the adsorption of methyl orange was monolayer. The favorability of the phenomenon could be, also, judged using the parameter “n” computed from the Freundlich model. From data, 1 < n < 2 suggested that the sorption of these dye molecules was favorable and moderate.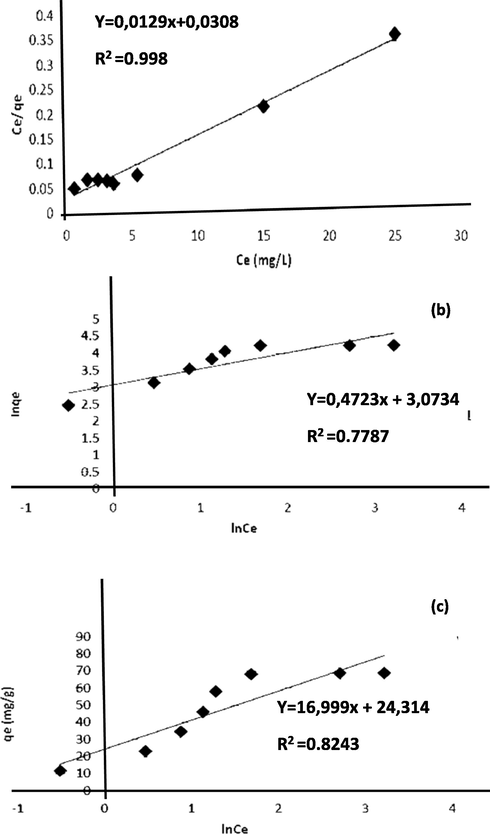
Langmiur (a) Freundlich isotherm (b) and Temkin isotherm (c) plots for MO dye adsorption on CuO NPs.
Fig. 10 shows the isotherm profiles of CuO NPs for MO. Langmuir isotherm is well representative of the experimental results. The values of qm achieved are higher than those obtained for other nanomaterials used in recent studies of methyl orange adsorption (Table 4), affirming the benefit and efficiency of this work (Yao et al., 2011; Ghasemian and Palizban, 2016; Zhang et al., 2016; Ahmad et al., 2017; Darwish et al., 2018, Riaz et al., 2020).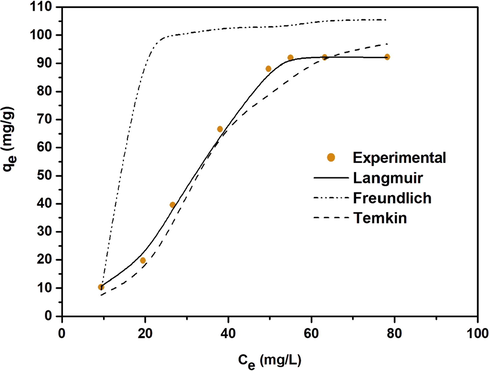
Isotherms adsorption of MO on CuO nanoparticles.
Adsorbent
Adsorption capacity (mg/g)
Reference
CuO NPs
92.5 mg/g at 25 °C
Present work
activated carbon
241.3 mg/g at 45 °C
(Tyagi and Malik 2019)
NiO NPs
240.43 mg/g at 45 °C
(Varadavenkatesan 2021)
TiO2 nanocomposite
42.5 mg/g at 30 °C
(Vinayagam et al., 2017)
ZnO NPs
305.4 mg/g at 30 °C
(Vishveshvar et al., 2018)
Carbone nanotube
35.5 mg/g at 35 °C
(Wang et al., 2011)
4.4 Effect of contact time and kinetic study
The effect of time on MO adsorption is shown in Fig. 11 at different initial concentrations (10–80 mg/L). The increase in initial concentration leads to an increase in the rate of adsorption. Asl et al. (2016) and Kale and Kane (2018) also discovered that decolors increased with the contact time when the concentration of nanoparticles remained the same. More contact time means more time for the reaction. The rate of the brilliant blue coloring of Coomassie was also increased by the time of incubation of CuO NPs (Sankar et al., 2014). The results showed a two-stage process of adsorption. At first 20 min of the beginning, adsorption was quick owing to the existence of vacant sites on the surface of CuO NPs which were then slowed by repulsion from the solid surface and bulk aqueous phase of MO molecules. After, the sorption occurred, slowly, within the range of 20–180 min. This means that the active sorption sites were saturated rapidly during this period. Sebeia et al. (2019) have also found that the dye sorbent rate is rapid in the early stages and is slowed down and given that more adsorption sites are available at the beginning. Kim et al. found that the number of sites available decreased earlier (Kim et al., 2018).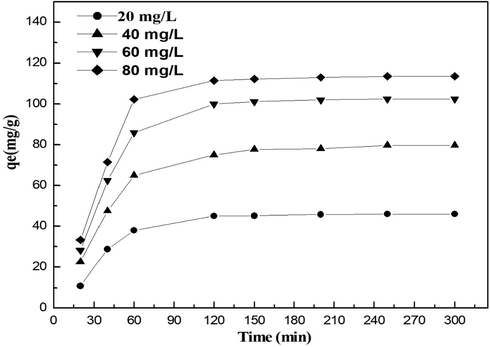
Effect of contact time on the adsorption of MO on CuO nanoparticles.
For the first- order data (Table 5), the computed R2 values range (R2 < 0.9) and the deviation of the calculated sorption capacities (qth) from those determined experimentally (qexp) registered within methylene strongly suggested the non-convenience of this equation. However, the result in Table 5 showed excellent correlation coefficients (0.99 ≤ R2) and a good coincidence of qexp with qth. This proved that the second- order equation fitted well our kinetic data indicating a chemisorption process (Upamali et al., 2016). As it was shown, the removal of the studied dye molecules increased with the increase in dye concentration. At equilibrium, 81.20 mg/g was registered for methyl orange. Compared to other common adsorbents gathered from the literature (Table 5), these values of dye uptake were interesting. Therefore, the prepared copper nanoparticles from Nerium oleander extract could be considered as good sorbents. In the state of methylene blue, this value was about five times higher than that of multi-wall carbon nanotubes (15.9 mg/g) (Naz et al., 2019) and hydroxyapatite nanoparticles (14.7 mg/g) (Singh et al., 2019). It was, also, four times higher than zeolites prepared from kaolins collected from different sources (21.4 mg/g) (Nguyen et al., 2018).
Pseudo-first-order kinetics
Pseudo-second-order kinetics
C (mg/L)
qe,exp (mg/g)
qe,cal (mg/g)
k1 (min−1)
R2
qe,cal (mg/g)
k2 (g mg min−1)
R2
20
5.23
5.92
0.0052
0.910
5.71
0.00122
0.997
40
9.62
8.70
0.0041
0.989
10.30
0.00128
0.999
60
12.50
10.28
0.0048
0.981
12.98
0.00146
0.999
80
13.55
11.32
0.0050
0.986
14.08
0.00148
0.999
4.5 Modelling and optimizations of results
To enhance the operational conditions statistically and analyze the effect of one of these factors on MO removal capacity of CuO NPs by using the Behnken design. According to BBD, fifteen experiments were carried out for optimization, and the experimental and predicted results are shown in Table 6. The results were statistically examined using ANOVA to determine the model's adequacy. The ANOVA analysis (Table 7) reveals that, except for X32, X1*X2, X1*X3, and X2*X3, the majority of the factors are statistically significant (p-value = 0.05).
Run
pH
Dose
[MO]
Coded values
Response (% MO)
X1 X2 X3
Experimental
Predicted
1
2
0.010
45
−1–1 0
38.00
40.8196
2
11
0.010
45
1–1 0
68.30
71.1729
3
2
0.080
45
−1 1 0
46.12
46.0146
4
11
0.080
45
1 1 0
73.88
73.8279
5
2
0.045
10
−1 0–1
54.99
58.8579
6
11
0.045
20
1 0–1
74.80
74.1212
7
2
0.045
80
−1 0 1
96.00
99.4462
8
11
0.045
45
1 0 1
85.00
83.8996
9
6
0.045
10
0 0–1
94.10
90.3708
10
6
0.010
10
0–1 −1
56.93
56.3225
11
6
0.080
10
0 1–1
55.15
52.4225
12
6
0.080
80
0 1 1
72.90
71.2158
13
6
0.045
45
0 0 0
84.90
84.90
14
6
0.045
45
0 0 0
84.90
84.90
15
6
0.045
45
0 0 0
84.90
84.90
Terms
Coefficient
Standard error
T-value
P-value
Constant
85.00
1.12
75.56
0.000
X1
−4.452
0.689
−6.46
0.001
X2
10.760
0.689
15.62
0.000
X3
−6.710
0.689
−9.74
0.000
X1*X1
−17.19
1.01
16.96
0.000
X2*X2
−7.34
1.01
−7.24
0.001
X3*X3
1.09
1.01
1.08
0.331
X1*X2
−0.099
0.974
−0.10
0.923
X1*X3
0.113
0.974
0.12
0.912
X2*X3
2.253
0.974
2.31
0.069
According to the RSM results, the second-order polynomial equation for MO dye was achieved, as seen below:
The negative and positive coefficients in the above-mentioned equations explained negatively and positively the impact on the removal of the dye. A positive effect of a factor appears to mean an improvement in the response once the factor level increases, although a negative effect tends to mean that the response is not improved with increasing the factor levels. According to Equation (11), factors X1 and X2 have a positive effect on the adsorption process of both dyes, while factor X3 has a negative effect. As a result, increasing the pH as well as the adsorbent dosage lead to an increase in adsorption efficiency. The results also showed that the highest coefficient is related to X2 (adsorbent dosage), confirming that this parameter has the greatest influence on the dye adsorption process when compared to the other independent factors.
The high adjusted and predicted R2 values confirm the statistically significant results of response surface methodology (RSM) for MO adsorption onto CuO NPs. The quadratic model was taken as the final model amongst these mathematical models according to data collected in Table 8. The statistical analysis (Table 8) shows that the model is incredibly important using the F value = 79.66 and an appropriate accuracy = 85.04. Each experiment was conducted three times and their respective standard deviation value was recorded for the average performance of the MO Removal analysis on CuO nanoparticles. Model Summary S = 1.94838 R-sq = 99.31 % R-sq (adj) = 98. 06 %.
Source
Degree of freedom
(DF)Sum of square
(SS)Mean of square
(MS)F- value
P-value
model
9
2721.54
302.39
79.66
0.000
Linear
3
1444.99
481.66
126.88
0.000
X1
1
158.55
158.55
41.77
0.001
X2
1
926.20
926.2
243.98
0.000
X3
1
360.24
360.24
94.89
0.000
Square
3
5772.8
1443.20
110.30
0.000
(X1)2
1
1091.48
1091.48
287.52
0.000
(X2)2
1
198.88
198.88
52.39
0.001
(X3)2
1
4.41
4.41
1.16
0.331
2-way interaction
3
20.40
6.80
1.79
0.265
X1*X2
1
0.04
0.04
0.01
0.331
X1*X3
1
0.05
0.05
0.01
0.926
X2*X3
1
20.31
20.31
0.01
0.910
Error
5
18.98
3.8
Lack of fit
3
18.98
6.30
Pure error
2
0.00
0.00
Total
14
2740.52
The analysis of variance (ANOVA) is also used to assess the accuracy of the curve in the responses at a confidence level of 95%. In Table 7, the ANOVA data for the coded quadratic model for the answer is listed after discarding the insignificant words. The influence of a factor is caused by changes in the response to differences in the level of a factor. This is often referred to as the primary impact since it relates to the main variables of interest in the observational study. ANOVA 's results revealed the real relationship around each reaction and the important variables in the equations correctly. The F-value indicates that the models are important and the “Prob > F” values are less than 0.05 suggesting that the terms of the models are meaningful. Significantly, a higher F-value with accompanying P-value (smaller than 0.05, confidence intervals) indicates that experimental systems may be modelled adequately with even less error. The ANOVA was used to test the statistical significance and suitability of the adsorption process data. The BBD experimental data were analyzed in two ways in this study: sequential model sum of squares and model summary statistics. These two tests were carried out to obtain regression models and determine the sufficiency of different designs (e.g., linear, interactive, quadratic, and cubic) throughout successfully representing the adsorption process. The results showed that the quadratic model closely matched the experimental data. The coefficient term's significance is determined by the p and F values. Significant model terms have p values (prob > F) 0.05, whereas insignificant terms have p values (prob > F) > 0.05. The model terms X1, X2, X3, (X1)2, and (X2)2 were significant for response Y (% MO removal). Model terms are significant, according to the model F value of 79.76. The coefficient of determination, i.e., adjusted R2 (0.98), agrees well with the predicted value (0.97). The results also revealed the appropriateness of the chosen quadratic model.
Another important diagnostic method for determining the efficacy of the fitted model in predicting the response is residual analysis, which is a large disparity between the predicted and experimental responses. Surface plots of the response functions can help you understand the main and interaction effects of the factors. These plots can be generated through mathematical calculations with developed response models and appropriate software. By examining the nature of the residual distribution and the relation for both actual and predicted MO dye removal values, the graphical method could be used to affirm the BBD model. Fig. 12a depicts the normal probability of the residuals in the BBD model for the responses. The perfect residual distribution, with points appearing noticeably close to a straight line, can be seen in Fig. 12a. This indicates that residuals have been correctly assumed and separated (Tripathi et al., 2009; Fakhri, 2014). Fig. 12b shows that the real and predicted values are approximately equivalent, revealing that the BBD model is scientifically accurate (Singh and Bhateria, 2020).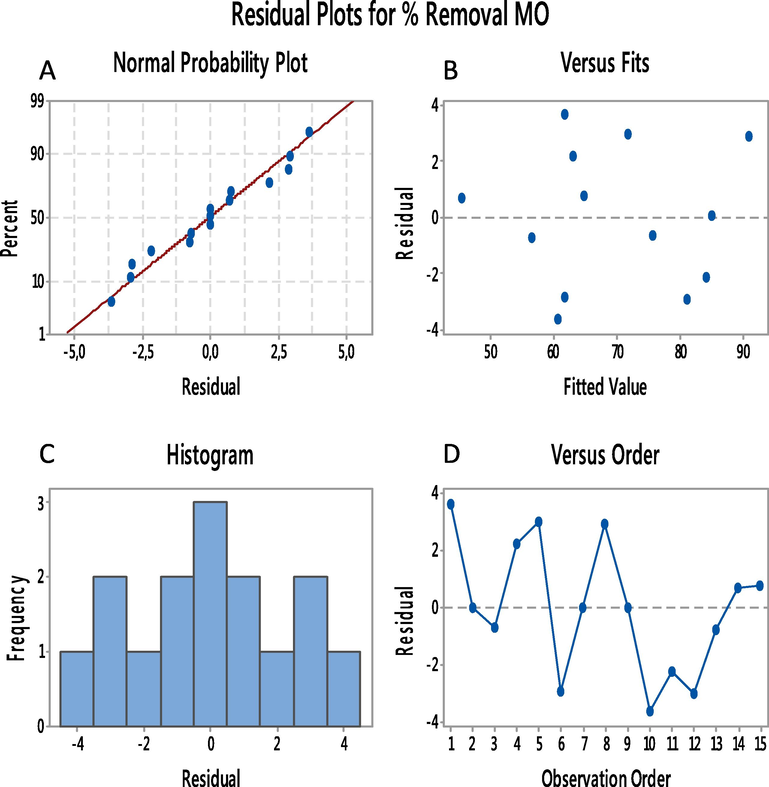
(A) normal probability plot, (B) residual plot, (C) residual histogram plot, (D) residual versus plot.
Fig. 13 depicts the mean consequence curves data presented in Table 9. During these tests, it is mentioned that the process is being positively affected when the response is as high as possible. The main objective of improvement is to obtain the required factor characteristics to gain the maximum amount of dye removal. The conclusive experimental research yielded removal percentages that were within 96 % of predicted values. It should be noted that these optimum values are precise within the given variety of operational variables. Supplemental experimental studies should be performed to verify any extrapolation or interpolation. Within the ranges of the variables investigated, the proposed model with RSM for dye removal can then be used to predict MO dye removal rate.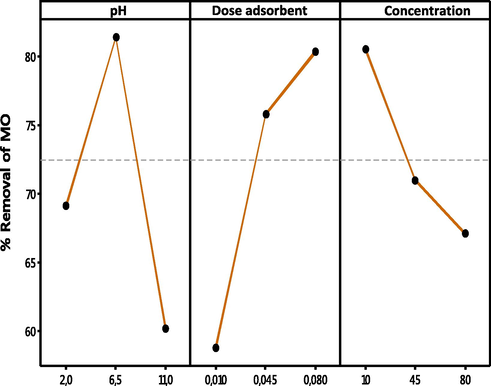
Optimization plots for the predicted percentage removal of methyl orange dye.
factor
Optimum condition value
pH
6.5
Mass
0.045 g
[MO]
45 mg/L
To better understand the relationship between these variables and to evaluate the ideal condition from each variable for the maximum amount of adsorption, a graphic representation of the response surface of the adsorbed quantity of MO comparable to the four factors investigated (pH, adsorbent dose, and initial concentration of MO) was used. As an outcome, the graphical operation mathematical model, which plots the response surface curves (3D) to show the development of the response, has affirmed that the current weather response data from the empirical approach are coherent with experimental data (Fig. 14).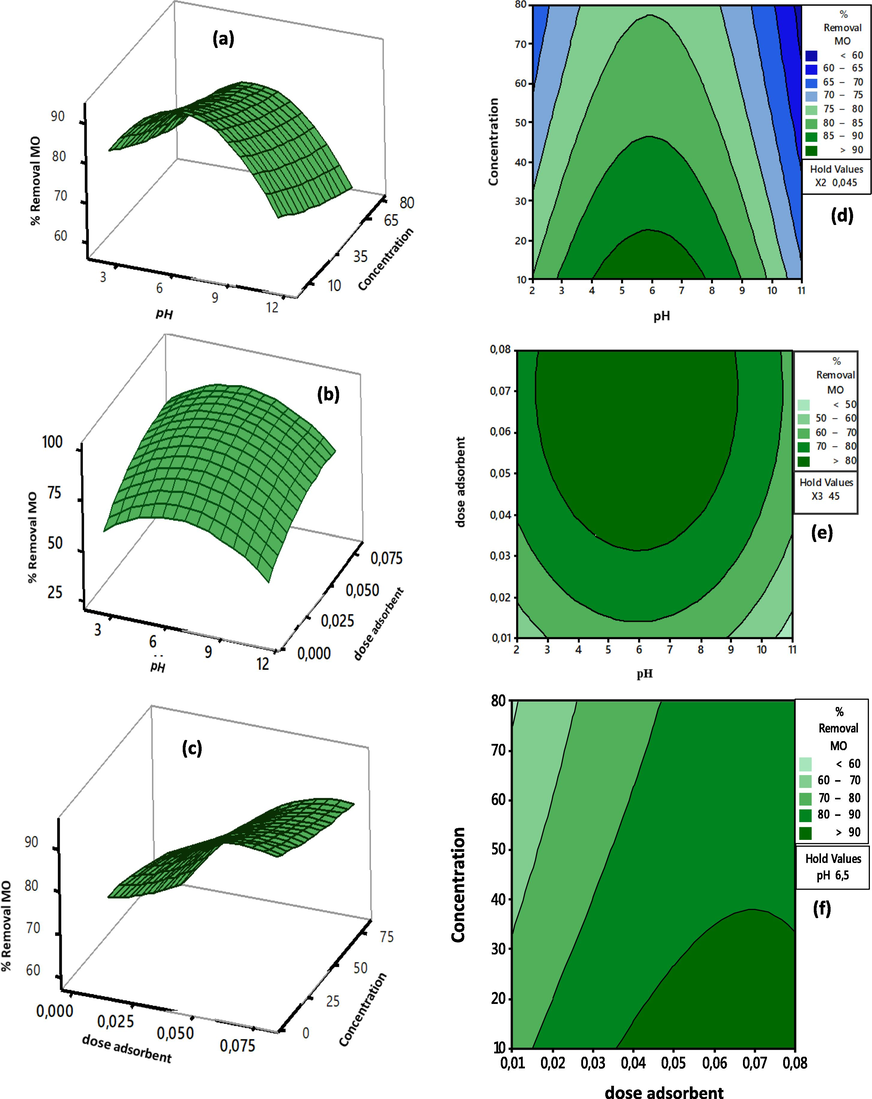
3D and contour plots showing the effects of (a, d) pH and concentration (b, e)dose and pH and (c, f) dose and concentration on MO adsorption by CuO NPs respectively.
The three-dimensional (3D) response surface plots were considered simultaneously for two factors, and the curving of these 3D surface plots illuminates interconnection effects between the factors and the response. The mixed effects of pH and dye concentration on % MO adsorption are seen in Fig. 14a. According to this figure, we conclude that adsorption increased as pH increased from 2 to 6, with a slight decrease to pH 8, and then a constant decrease in % MO removal. With increasing concentration, % MO removed decreased. The available active sites of the CuO NPs surface to MO dye molecules were greater at smaller doses, and thus the adsorbent adsorbed the majority of the MO molecules in solution, resulting in increased per cent adsorption. On the other hand, at high MO concentrations, the per cent adsorption decreased. The greatest adsorption was demonstrated at pH 6 and the lowest concentration of 10 mg/L. The coupled effect of adsorbent dose and concentration is shown in Fig. 14b, and it is clear that the % MO removal increased as the dose was increased. This result was related to the increased vacant sites on the surface of CuO NPs. The combined influence of pH and adsorbent dose is shown in Fig. 14c, indicating that at high adsorbent dose mixed with a neutral pH seems to be appropriate for MO adsorption on CuO NPs. The associated contour plots were created to aid in the understanding of the interactive effects of factors on response. The darker region of the plot represents the highest percentage of removal (response).
According to Fig. 14d-f, the small concentration, high dose, and intermediate pH value provided the most meaningful data for per cent MO removal.
5 Conclusion
To summarize, copper sulfate ions were successfully reduced into copper oxide nanoparticles using an innovative aqueous biological extract acquired from Eucalyptus globulus leaves. The prepared particles attained a face-centered cubic structure. The above research reveals that CuO nanoparticles were used to remove methyl orange from aqueous solutions. Their adsorption capacity toward methyl orange was 92,2 mg/g (pH = 6, T = 25 °C, adsorbent dose = 0.045 g). Different factors, such as adsorbent weight, temperature and pH, have been explained. The optimum experimental conditions for color removal were observed at solution pH 6.5, CuO NPs dose (0.045 g/L), and dye concentration (45 mg/L). Experimental data showed good agreement with the Langmuir adsorption isotherm model. Nevertheless, the adsorption of MO to CuO nanoparticles was accompanied by a pseudo-second-order kinetic model, which indicates that the adsorption behavior may be controlled by hydrogen bonding between adsorbent and adsorbate. To optimize dye removal efficiency, a Box–Behnken experimental design based on response surface methodology was used to identify the optimal operating variables. The model designed for the optimal design has been well fitted the experimental data. The p-value of this model was<0.05, which indicates that the model is very significant. Experimental design and response surface methodology were applied to determine the optimal conditions of MO removal ((X1 = 6.5) for the solution pH, (X2 = 45 mg/L) for the concentration of methyl orange, and (X3 = 4 g/L) for the adsorbent dosage). The data used the answer for high variables at any time and advised that the CuO NPs were possible materials for the removal of dye from aqueous solutions. As carriers, these nanoparticles might be immobilized onto biopolymers. Experimental studies will be expanded in the future to include the green synthesis of other metal oxide nanoparticles using new extracts, as well as the evaluation of other applications such as the investigation of their biological activities against a variety of pathogens and the growth of nanocomposites.
Acknowledgement
“The authors extend their appreciation to the Deputyship for Research & Innovation, Ministry of Education in Saudi Arabia for funding this research work through the project number (IFP2021-006).
Declaration of Competing Interest
The authors declare that they have no known competing financial interests or personal relationships that could have appeared to influence the work reported in this paper.
References
- Lithium-ion batteries: Comprehensive technical analysis of second-life batteries for smart grid applications. In: 19th European Conference on Power Electronics and Applications (EPE’17 ECCE Europe). 2017.
- [CrossRef] [Google Scholar]
- Study the influence of silver and cobalt on the photocatalytic activity of copper oxide nanoparticles for the degradation of methyl orange and real wastewater dyes. Mater. Res. Exp.. 2020;7:026201
- [CrossRef] [Google Scholar]
- Adsorption of methyl orange by synthesized and functionalized-CNTs with 3-aminopropyltriethoxysilane loaded TiO2 nanocomposites. Chemosphere. 2017;168:474-482.
- [CrossRef] [Google Scholar]
- Green synthesis of copper oxide nanoparticles for biomedical application and environmental remediation. Heliyon. 2020;6(7):e04508
- [CrossRef] [Google Scholar]
- Removal of dithioterethiol (DTT) from water by membranes of cellulose acetate (AC) and AC doped ZnO and TiO2 nanoparticles. J. Saudi Chem. Soc.. 2021;25(8):101282
- [CrossRef] [Google Scholar]
- Green Synthesis of Copper Oxide Nanoparticles Using Aerva javanica Leaf Extract and Their Characterization and Investigation of In Vitro Antimicrobial Potential and Cytotoxic Activities. Evi. Based Comp. Alt. Med.. 2021;2021
- [CrossRef] [Google Scholar]
- Green synthesis of copper oxide (CuO) nanoparticles using banana peel extract and their photocatalytic activities. AIP Conf. Proc.. 2017;1828:020016
- [CrossRef] [Google Scholar]
- Photocatalytic action of AgCl nanoparticles and its antibacterial activity. J. Photochem. Photobiol. B: Biol.. 2014;138:302-306.
- [CrossRef] [Google Scholar]
- Removal of hazardous azo dye from water using synthetic nano adsorbent: Facile synthesis, characterization, adsorption, regeneration and design of experiments. Colloids Surf. A: Physicochem. Eng. Aspects. 2020;584
- [Google Scholar]
- Photocatalytic degradation of methylene blue dye by zinc oxide nanoparticles obtained from precipitation and sol-gel methods. Env. Sci. Poll. Res.. 2016;23(24):25485-25493.
- [CrossRef] [Google Scholar]
- Mathematical modeling for a p -mobile hub location problem in a dynamic environment by a genetic algorithm. Appl. Math. Mod.. 2018;54:151-169.
- [CrossRef] [Google Scholar]
- Green synthesis of iron oxide nanoparticles by aqueous leaf extract of Daphne mezereum as a novel dye removing material. Appl. Phy. A.. 2018;124(5)
- [CrossRef] [Google Scholar]
- Biofabrication of highly pure copper oxide nanoparticles using wheat seed extract and their catalytic activity: A mechanistic approach. Green Proc. Syn.. 2019;8(1):691-702.
- [CrossRef] [Google Scholar]
- Metal oxide nanoparticles and their applications in nanotechnology. SN. Appl. Sci.. 2019;1(6)
- [CrossRef] [Google Scholar]
- Characteristics of er-doped zinc oxide layer: Application in synthetic dye solution color removal. Desalin. Water Treat.. 2021;209:402-413.
- [CrossRef] [Google Scholar]
- Facile green synthesis of zinc oxide nanoparticles (ZnO NPs): antibacterial and photocatalytic activities. Mater. Res. Exp.. 2019;6(10):1050b4.
- [CrossRef] [Google Scholar]
- Investigation of methylene blue adsorption from aqueous solution onto ZnO nanoparticles: equilibrium and Box-Behnken optimisation design. Inter. J. Env. Anal. Chem.. 2021;1–26
- [CrossRef] [Google Scholar]
- The mutagenicity of methyl orange and metabolites produced by intestinal anaerobes. Mut. Res. Gen. Tox.. 1978;58(2–3):375-379.
- [CrossRef] [Google Scholar]
- Physical characterization of nanoparticle size and surface modification using particle scattering diffusometry. Biomicrofluidics. 2016;10(5):054107
- [CrossRef] [Google Scholar]
- Extracellular Biosynthesis of Copper and Copper Oxide Nanoparticles byStereum hirsutum, a Native White-Rot Fungus from Chilean Forests. J. Nano.. 2015;2015:1-7.
- [CrossRef] [Google Scholar]
- Methyl orange adsorption comparison on nanoparticles: Isotherm, kinetics, and thermodynamic studies. Dyes Pig 2018
- [CrossRef] [Google Scholar]
- An insight study on HPTLC fingerprinting of Mukia maderaspatna: Mechanism of bioactive constituents in metal nanoparticle synthesis and its activity against human pathogens. Microb. Path.. 2016;102:120-132.
- [CrossRef] [Google Scholar]
- Phyllanthus emblica seed extract mediated synthesis of Pd NPs against antibacterial, heamolytic and cytotoxic studies. J. Photochem. Photobiol. B: Biol.. 2017;167:64-71.
- [CrossRef] [Google Scholar]
- Synthesis of CuO nanoparticles and fabrication of nanostructural layer biosensors for detecting Aspergillus niger fungi. Sci. Iran.. 2013;20:1055-1058.
- [CrossRef] [Google Scholar]
- Application of response surface methodology to optimize the process variables for fluoride ion removal using maghemite nanoparticles. J. Saudi Chem. Soc.. 2014;18(4):340-347.
- [CrossRef] [Google Scholar]
- Über die Adsorption in Lösungen. Zeitschrift Für Physikalische Chemie. 1907;57U(1)
- [CrossRef] [Google Scholar]
- Cu and Cu-Based Nanoparticles: Synthesis and Applications in Catalysis. Chem. Rev.. 2016;116(6):3722-3811.
- [CrossRef] [Google Scholar]
- Application of activated carbon as adsorbents for efficient removal of methylene blue: Kinetics and equilibrium study. J. Ind. Eng. Chem.. 2014;20(4):2317-2324.
- [CrossRef] [Google Scholar]
- Comparisons of azo dye adsorptions onto activated carbon and silicon carbide nanoparticles loaded on activated carbon. Intern. J. Env. Sci. Tech.. 2016;13(2):501-512.
- [CrossRef] [Google Scholar]
- Remove of Humic Acid From Water Using Magnetite Nanoparticles”. Eur. J. Adv. Chem. Res.. 2020;1:1-6.
- [CrossRef] [Google Scholar]
- Application of Biosynthesized CuO Nanoparticles Using Rosa canina Fruit Extract as a Recyclable and Heterogeneous Nanocatalyst for Alkyne/Aldehyde/Amine A3 Coupling Reactions. Catal. Let.. 2019;149:2325-2331.
- [CrossRef] [Google Scholar]
- Green synthesis of copper oxide nanoparticles using Abutilon indicum leaf extract: Antimicrobial, antioxidant and photocatalytic dye degradation activitie. Tropical J. Pharm. Res.. 2017;16(4):743.
- [CrossRef] [Google Scholar]
- Green synthesis of metal nanoparticles using plants. Green Chem.. 2011;13(10):2638.
- [CrossRef] [Google Scholar]
- Essential Oil Composition and Biological Activities of Eucalyptus globulus Leaves Extracts from Tunisia. J. Ess. Oil Bear. Plants. 2017;20(2):438-448.
- [CrossRef] [Google Scholar]
- Colour removal of phthalocyanine based reactive dye by nanoparticles. Groundwater Sust. Dev. 2018
- [CrossRef] [Google Scholar]
- Fast adsorption kinetics of highly dispersed ultrafine nickel/carbon nanoparticles for organic dye removal. Appl. Surf. Sci.. 2018;439:364-370.
- [CrossRef] [Google Scholar]
- Green Synthesis of Copper Oxide Nanoparticles Using Aloe vera Leaf Extract and Its Antibacterial Activity Against Fish Bacterial Pathogens. BioNanoScience. 2015;5(3):135-139.
- [CrossRef] [Google Scholar]
- Modeling and Optimization of Turning Parameters during Machining of AA6061 composite using RSM Box-Behnken Design. IOP Conference Series: Mater. Sci. Eng.. 2021;1057(1):012058
- [CrossRef] [Google Scholar]
- The constitution and fundamental properties of solids and liquids. part i. solids. J. American Chem. Soc.. 1916;38(11):2221-2295.
- [CrossRef] [Google Scholar]
- Optimization of the catalytic ozonation process using copper oxide nanoparticles for the removal of benzene from aqueous solutions. Glob. J. Environ. Sci. Manag.. 2017;3:403-416.
- [CrossRef] [Google Scholar]
- Green synthesis of silver nanoparticles toward bio and medical applications. Art. Cells, Nan. Biotech.. 2018;1–18
- [CrossRef] [Google Scholar]
- Biosynthesis of Copper Oxide nanoparticles from Drypetes sepiaria Leaf extract and their catalytic activity to dye degradation. IOP Conference Series: Mater. Sci. Eng.. 2017;263:022012
- [CrossRef] [Google Scholar]
- Nanofiltration and reverse osmosis thin film composite membrane module for the removal of dye and salts from the simulated mixtures. Desalination. 2009;249(1):12-17.
- [CrossRef] [Google Scholar]
- On the Toxicity Copper Oxide Nanoparticles: A Review Study. IET Nanobiotech 2019
- [CrossRef] [Google Scholar]
- Single-step wet synthesis of copper oxide nanoparticles, characterization and their biological activities. J. Mat. Appl. Sci.. 2020;4:103.
- [Google Scholar]
- Green Synthesis of Metal and Metal Oxide Nanoparticles and Their Effect on the Unicellular Alga Chlamydomonas reinhardtii. Nano. Res. Let.. 2018;13(1)
- [CrossRef] [Google Scholar]
- Synthesis of CuO Nanoparticles by Precipitation Method Using Different Precursors. Energy Procedia. 2013;34:740-745.
- [CrossRef] [Google Scholar]
- A facile green synthesis of ZnO nanorods using leaf extract of Ficus hispida L. Inter. J. Eng. Appl. Sci. Tech.. 2017;2(4), 2455–2143:256-260.
- [Google Scholar]
- A facile method for synthesis of nanostructured copper (II) oxide by coprecipitation. J. Mater. Res. Tech.. 2019;9:994-1004.
- [CrossRef] [Google Scholar]
- Environmentally friendly low cost approach for nano copper oxide functionalization of cotton designed for antibacterial and photocatalytic applications. J. Clea. Prod.. 2018;204:425-436.
- [CrossRef] [Google Scholar]
- NiO nanoparticles for enhanced removal of methyl orange: equilibrium, kinetics, thermodynamic and desorption studies. Intern. J. Env. Anal. Chem.. 2020;1–20
- [CrossRef] [Google Scholar]
- Sunlight mediated photocatalytic degradation of organic pollutants by statistical optimization of green synthesized NiO NPs as catalyst. J. Mol. Liq.. 2019;111509
- [CrossRef] [Google Scholar]
- The role of nanomaterials as effective adsorbents and their applications in wastewater treatment. J. Nanostr. Chem.. 2017;7(1):1-14.
- [CrossRef] [Google Scholar]
- Plant Mediated Green Synthesis of CuO Nanoparticles: Comparison of Toxicity of Engineered and Plant Mediated CuO Nanoparticles towards Daphnia magna. Nanomaterials. 2016;6(11):205.
- [CrossRef] [Google Scholar]
- Anti-diabetic and antioxidant potentials of aqueous extract of Eucalyptus globulus in experimentally-induced diabetic rats. African J. Trad., Comp. Alt. Med.. 2017;14(6):20-26.
- [CrossRef] [Google Scholar]
- Green synthesis of colloidal copper oxide nanoparticles using Carica papaya and its application in photocatalytic dye degradation. Spectr. Acta Part A: Mol. Biomol. Spect.. 2014;121:746-750.
- [CrossRef] [Google Scholar]
- Biological synthesis of copper nanoparticles, using Nerium oleander leaves extract: Characterization and study of their interaction with organic dyes. Inorg. Chem. Comm. 2019
- [CrossRef] [Google Scholar]
- “Green” synthesis of metals and their oxide nanoparticles: applications for environmental remediation. J. Nanobiotech.. 2018;16(1)
- [CrossRef] [Google Scholar]
- Biogenic synthesis of copper oxide nanoparticles using plant extract and its prodigious potential for photocatalytic degradation of dyes. Env. Res.. 2019;177:108569
- [CrossRef] [Google Scholar]
- A Brief Review on Synthesis and Characterization of Copper Oxide Nanoparticles and its Applications. J. Bioelectron. Nanotechnol.. 2016;1
- [CrossRef] [Google Scholar]
- Optimization and Experimental Design of the Pb2+ Adsorption Process on a Nano-Fe3O4-Based Adsorbent Using the Response Surface Methodology. ACS Omega. 2020;5(43):28305-28318.
- [CrossRef] [Google Scholar]
- Aggregation kinetics and surface charge of CuO nanoparticles: the influence of pH, ionic strength and humic acids. Env. Chem.. 2013;10(4):313.
- [CrossRef] [Google Scholar]
- Synthesis of reduced graphene oxide/magnetite composites and investigation of their adsorption performance of fluoroquinolone antibiotics. Coll. Sur. A.. 2013;424:74-80.
- [Google Scholar]
- Green synthesis and morphology dependent antibacterial activity of copper oxide nanoparticles. J. Nanostr.. 2019;9:163-171.
- [CrossRef] [Google Scholar]
- Kinetics of Ammonia Synthesis on Promoted Iron Catalysts. J. Phys. Chem.. 1939;13:851-857.
- [Google Scholar]
- Copper Oxide Nanomaterials Prepared by Solution Methods, Some Properties, and Potential Applications. Inter. Schol. Res. Not.. 2014;2014:1-14.
- [CrossRef] [Google Scholar]
- Optimization of an azo dye batch adsorption parameters using Box-Behnken design. Desalination. 2009;249(3):1273-1279.
- [CrossRef] [Google Scholar]
- Antimicrobial potential and chemical composition of Eucalyptus globulus oil in liquid and vapour phase against food spoilage microorganisms. Food Chem.. 2011;126(1):228-235.
- [CrossRef] [Google Scholar]
- New Surfactants and Co-Solvents Increase Oil Recovery and Reduce Cost. SPE Improved Oil Recovery Conference 2016
- [CrossRef] [Google Scholar]
- Characterization of silver nano-spheres synthesized using the extract of Arachis hypogaea nuts and their catalytic potential to degrade dyes. Mater. Chem. Phys.. 2021;272:125017
- [CrossRef] [Google Scholar]
- Evaluation of the Anticoagulant and Catalytic Activities of the Bridelia retusa Fruit Extract-Functionalized Silver Nanoparticles. J. Clus. Sci.. 2017;28(5):2919-2932.
- [CrossRef] [Google Scholar]
- Green Synthesis of Copper Oxide Nanoparticles Using Ixiro coccinea Plant Leaves and its Characterization. BioNanoScience. 2018;8(2):554-558.
- [CrossRef] [Google Scholar]
- Adsorption of congo red using ethylenediamine modified wheat straw. Desal. Wat. Treat.. 2011;30(1–3):195-206.
- [CrossRef] [Google Scholar]
- Microwave assisted rapid synthesis and biological evaluation of stable copper nanoparticles using T. arjuna bark extract. Spectr. Acta Part A: Mol. Biomol. Spect.. 2013;110:108-115.
- [CrossRef] [Google Scholar]
- Equilibrium and kinetic studies of methyl orange adsorption on multiwalled carbon nanotubes. Chem. Eng. J.. 2011;170(1):82-89.
- [CrossRef] [Google Scholar]
- High adsorption capability and selectivity of ZnO nanoparticles for dye removal. Coll. Sur. A. Phy. Eng. Asp.. 2016;509:474-483.
- [CrossRef] [Google Scholar]
- Application of Box-Behnken design to optimize multi-sorbent solid phase extraction for trace neonicotinoids in water containing high level of matrix substances. Talanta. 2017;170:392-398.
- [CrossRef] [Google Scholar]
- Comparative study of Box-Behnken, central composite, and Doehlert matrix for multivariate optimization of Pb (II) adsorption onto Robiniatree leaves. J. Chemometrics.. 2013;27(1–2):12-20.
- [CrossRef] [Google Scholar]
- Nanostructured copper oxide semiconductors: a perspective on materials, synthesis methods and applications. J. Mater. Chem. C. 2014;2(27):5247-5270.
- [CrossRef] [Google Scholar]


