

Translate this page into:
Gut microbial analysis combined with metabolomics reveal the mechanism of stachyose on blood deficiency syndrome in rats
⁎Corresponding authors. qhwang668@sina.com (Qiuhong Wang), hxkuang@hljucm.net (Haixue Kuang)
-
Received: ,
Accepted: ,
This article was originally published by Elsevier and was migrated to Scientific Scholar after the change of Publisher.
Abstract
Stachyose (ST), a naturally occurring compound extracted from cucumbers and legumes, holds great promise as a natural therapeutic agent. In this study, the impact of ST on blood deficiency syndrome (BDS) induced by cyclophosphamide (CP) and acetylphenylhydrazine (APH) was investigated in a rat model. Subsequently, the levels of erythropoietin (EPO), granulocyte colony-stimulating factor (G-CSF), tumour necrosis factor-alpha (TNF-α), and interleukin-6 (IL-6) were quantified in rat blood and peripheral blood cells. Furthermore, haematoxylin and eosin (HE) staining was employed to elucidate morphological alterations in the spleen tissue. To gain comprehensive insights into the therapeutic potential and underlying mechanisms of ST against BDS, we used 16S rRNA gene sequencing and serum and spleen metabolomic analyses. Our findings revealed a significant ameliorative effect of ST on BDS. Notably, at the phylum level, Firmicutes and Bacteroidota exhibited marked variations in abundance, while at the genus level, discernible changes were observed in the abundances of Lactobacillus and Bifidobacterium, among others. The therapeutic effects of ST on BDS were proposed to be due to its modulation of phenylalanine metabolism and glycine, serine and threonine metabolism and its impact on the restructuring of the gut microbiota.
Keywords
Metabolomics
Stachyose
Cyclophosphamide
Blood deficiency syndrome
Gut microbiota

- SD
-
Standard deviation
- BDS
-
Blood deficiency syndrome
- ST
-
Stachyose
- KEGG
-
Kyoto Encyclopedia of Genes and Genomes
- VIP
-
Variable importance in the projection
- RBC
-
Red blood cells
- WBC
-
White blood cells
- HGB
-
Hemoglobin
- HCT
-
Hematocrit
- Rt
-
Retention time
- m/z
-
Exact mass
- TIC
-
Total ion chromatogram
Abbreviations
1 Introduction
Cyclophosphamide (CP), a frequently employed pharmaceutical agent in cancer treatment, is known for its ability to effectively inhibit cancer cell proliferation (Burdach and Jürgens, 2002). Despite its ability to specifically target rapidly dividing cancer cells (Mitchell, 2003), CP elicits substantial physiological effects. One prominent side effect is the occurrence of blood deficiency syndrome (BDS), a traditional Chinese medicine terminology signifying an insufficiency in both the quality and quantity of blood (Wang et al., 2022a; Wang et al., 2022b). Consequently, key indicators such as red blood cells (RBCs), white blood cells (WBCs), haematocrit (HCT), and haemoglobin (HGB) are routinely used to assess the status of the circulatory system. Individuals subjected to CP treatment may experience a compromised immune system due to the suppression of bone marrow activity, which is responsible for haematopoiesis. As a result, chemotherapy recipients often manifest a weakened immune response, impeding their body's capacity to combat diseases (Kutlu et al., 2020). Impaired haematopoietic function, decreased visceral function, malnutrition, and bone marrow suppression are common clinical manifestations of BDS patients in modern medicine (Zhang et al., 2014). BDS may cause spleen enlargement in rats due to haematopoietic dysfunction, which causes the release of bone marrow cells into the blood. These abnormal bone marrow cells eventually accumulate in the spleen, causing splenomegaly (Zhang et al., 2020). Therefore, the spleen is an essential target organ in BDS treatment.
In mice, CP administration has been shown to augment potentially pathogenic bacterial populations while diminishing the integrity of intestinal tight and adherens junctions (Yang et al., 2013). A recent investigation proposed that the therapeutic effectiveness of CP is intricately associated with the composition of the gut microbiota (Viaud et al., 2013). Notably, the antitumour immune responses of germ-free mice and those subjected to antibiotic treatment were significantly compromised. These findings underscore the complex interplay between the efficacy of CP therapy, the composition of the gut microbiota, and the immune system (Xu and Zhang, 2014). Consequently, managing CP-induced BDS has become an integral component of comprehensive patient care plans, with the overall objective of alleviating symptoms, revitalizing the patient's physiological well-being, and enhancing immune functionality.
Stachyose (ST) has gained prominence for the role it plays in promoting overall well-being. ST benefits include gut health promotion, lipid management, diabetes support, and immune enhancement. As a prebiotic, ST plays a pivotal role in nourishing beneficial gut microbiota, fostering a balanced gut microbial environment, and enhancing digestive health while optimizing nutrient absorption. The unique capacity of ST to selectively stimulate probiotic growth contributes to maintaining a harmonious intestinal ecosystem (Liu et al., 2019; Liang et al., 2020). Moreover, ST has been show to have the potential to ameliorate hyperlipidaemia and diabetes (Wu et al., 2021). Moreover, emerging research has suggested that ST consumption could enhance lipid metabolism and assist in controlling elevated blood lipid levels. Generally, alanine aminotransferase (ALT) and aspartate aminotransferase (AST) activities in serum are applied as reliable markers of liver injury. When liver cells are damaged, these enzymes leak into the blood, leading to a significant increase in their activities in the serum (Dong et al., 2019). Elevated serum creatinine (Cr) levels usually indicate decreased kidney function because the kidneys have a reduced ability to excrete creatinine, causing creatinine to accumulate in the body.
In addition, in combination with conventional methods, ST can enhance insulin sensitivity and regulate blood glucose levels, providing a complementary approach to diabetes management. Significantly, the impact of ST goes beyond metabolic health, with studies suggesting that it strengthens the immune system, potentially enhancing the body's defence against infections and illnesses (Wang et al., 2023). ST has been found to stimulate intestinal cells to secrete granulocyte colony-stimulating factors (G-CSFs; Ota et al., 2019). G-CSFs have been shown to be crucial diagnostic markers for BDS (Wang et al., 2022b). Hence, ST is emerging as a potential treatment option for BDS.
Metabolomics is a comprehensive science that studies the metabolites of organisms under specific conditions (Wishart, 2019). The gut microbiota refers to the community of microorganisms in the intestine, including bacteria, fungi, and viruses (Zheng et al., 2019). The purpose of studying the gut microbiota is to gain insights into the relationships between these microorganisms and human health and disease, as well as their functions and roles in the human body. Through the joint analysis of metabolomics and the gut microbiota, we can better understand the relationship between the gut microbiota and the host, reveal the impact of the gut microbiota on host metabolism, and determine the impact of host metabolism on the gut microbiota to successfully modulate the gut microbiota as needed. Combined with ST treatment of BDS, we can further explore the mechanism by which ST regulates host metabolism and gut microbiota composition, as well as its impact on possible biomarkers. These biomarkers can be used as indicators for disease prediction, diagnosis and prognosis assessment and can contribute to the early detection and treatment of diseases.
2 Materials and methods
2.1 Chemicals and reagents
Acetylphenylhydrazine (APH) was purchased from Aladdin (batch number L1909182), CP was purchased from MACKLIN (batch number C11147187), an IL-6 ELISA kit was purchased from CUSABIO (Lot: S08036695), a TNF-α ELISA kit was purchased from CUSABIO (Lot: S07036694), an EPO ELISA kit was purchased from CUSABIO (Lot: S05036692), a G-CSF ELISA kit was purchased from CUSABIO (Lot: S06036693), and ST was purchased from Yuan Ye Bio (Lot: Y13O9H72158). We used AST, ALT, and Cr kits from Nanjing Jiancheng Institute of Biological Engineering (batch numbers: 20240314, 20240312, and 20240313).
2.2 Animals and Ethics statement
We utilized 40 healthy male SD rats (weighing 180–220 g) from the Guangdong Provincial Medical Laboratory Animal Center with batch number SCXK (Guangdong) 2017–0125. All animal experiments were approved by the Ethics Committee of Heilongjiang University of Chinese Medicine (Approval No. 2019121101). After maintaining the animal housing environment at a temperature of 25 °C with 40–60 % humidity, we randomly divided the rats into five groups: the control group, model group, ST high-dose group (ST-H, 2500 mg/kg), ST medium-dose group (ST-M, 1250 mg/kg), and ST low-dose group (ST-L, 625 mg/kg). Moreover, the control and model groups received an equal volume of normal saline as a placebo.
2.3 Establishment of a BDS model
On days 1 and day 4, rats were subcutaneously injected with 20 mg/kg or 10 mg/kg APH. On day 4, 2 h after subcutaneous APH injection (10 mg/kg), the rats received an intraperitoneal injection of CP (20 mg/kg). From days 4 to 7, rats were administered CP (20 mg/kg) daily (Zhang et al., 2022; Zhang et al., 2023a,b). On day 7, we measured the serum RBC, WBC, HGB, and HCT levels. The control group, which served as the reference group, received an equal volume of normal saline instead of the experimental injections for the treatment group, starting from day 1 and continuing until day 15 (Fig. 1).
Modelling method in BDS rats.
2.4 Routine blood tests
After the rats were anaesthetized, blood samples were collected using vacuum tubes containing ethylenediaminetetraacetic acid (EDTA) as an anticoagulant. RBC, WBC, HGB, and HCT levels were quantified using a HEMAVET 950 automated haematology analyser (Drew Scientific Group, Dallas, TX, USA).
2.5 Serum biochemical levels
After the rats were anaesthetized, the collected blood was stored at 4 °C for 30 min. Following the manufacturer's guidelines, we processed the serum samples and measured the optical density of each well at a wavelength of 450 nm using a microplate reader. We then measured the serum levels of EPO, G-CSF, TNF-a, IL-6, Cr, AST and ALT activities.
2.6 HE staining
Our study utilized HE staining to evaluate the degree of spleen damage. After anaesthetizing the rats, we fixed the spleen tissue in 4 % paraformaldehyde and embedded it in paraffin. Subsequently, we used a microtome to cut 10-μm-thick sections, which were HE stained. The remaining spleen samples were frozen in liquid nitrogen and stored at −80 °C in a refrigerator.
2.7 Metabolomics analysis
2.7.1 Sample preparation
Serum metabolomics: Blood samples were collected and refrigerated at 4 °C for 30 min. Then, the samples were centrifuged at 3500 rpm/min for 15 min. After centrifugation, the serum (100 µL) was mixed with acetonitrile (300 µL), followed by vortexing for 30 s. The resulting samples were subsequently transferred to a high-speed centrifuge and centrifuged at 13500 rpm/min for 20 min at 4 °C. The supernatant (300 μL) was extracted and evaporated to dryness. The desiccated residue was reconstituted in a solution comprising 50 % acetonitrile and water (150 µL). Finally, a portions of each sample (10 μL) were combined to form a quality control (QC) sample. Continuously, the stability of the investigation was monitored by systematically analysing QC samples every 10 samples (Cui et al., 2023).
Spleen metabolomics: Spleen tissue (100 mg) was weighed and placed in a mixed solution of 50 % acetonitrile and water (300 μL). The resulting mixture was placed within a tissue grinder and subjected to grinding at 3500 rpm/min for 3 min; this process was repeated three times. The ground spleen tissue was then transferred to a centrifuge tube and centrifuged at 13500 rpm/min and 4 °C for 15 min. Subsequently, the upper layer solution (300 μL) was collected and subjected to evaporation and desiccation. The dried residue was then reconstituted in a solution comprising 50 % acetonitrile and water (150 μL). Finally, a portion of each sample (10 μL) was pooled for quality control (QC) analysis.
2.7.2 MS conditions
The serum and spleen samples were subjected to chromatographic separation on a Waters ACQUITY UPLC HSS T3 column (1.8 μm, 2.1 × 100 mm) using a gradient elution method with a 0.4 mL/min flow rate. The column temperature was 40 °C, and the injection volume was 2 μL. The mobile phases comprised phase A, which consisted of water with 0.1 % formic acid, and phase B, which was composed of acetonitrile. The gradient elution programme was as follows: 0–2 % B over the first min, 2–35 % B from 1 to 4 min, 35–100 % B from 4 to 13 min, maintaining 100 % B from 13 to 15.5 min, and finally decreasing to 2 % B from 15.5 to 19 min.
Our analytical procedures utilized an ultrahigh-performance liquid chromatography system (Dionex Ultimate 3000, USA). Subsequently, the samples were analysed with a tandem high-resolution mass spectrometer equipped with an electrostatic field orbitrap (Thermo Orbitrap Fusion, USA). The spray voltages were adjusted to + 3.5 kV and −2.5 kV. The capillary voltage was held at 325 °C, with an intrathecal gas volume flow rate of 50 arb and an auxiliary gas volume flow rate of 10 arb. The selected resolution was set at a high precision of 120000, and the acquisition range was extended from m/z 100 to 800. For HRMS2 scans, we established a rigorous intensity threshold of 2.0 × 10⁴. The high-energy collisional dissociation in HRMS2 was configured with resolutions of 30,000 at 20 %, 35 %, and 50 %. Collision-induced dissociation was set to 15 %, 30 %, and 45 % with a resolution of 30000.
2.7.3 Biomarker identification and pathway analysis
We utilized Compound Discoverer 3.2 software to conduct chromatographic peak identification, comparison, and normalization, resulting in the generation of data files that included critical information such as the mass-to-charge ratio (m/z), retention time (Rt), and peak area. These original files were subsequently imported into SIMCA 14.1 data processing software. In this stage, we utilized principal component analysis (PCA) and partial least squares discriminant analysis (PLS-DA) to comprehensively examine the characteristics of the rat groups. The scope of our analysis encompassed the study of metabolites present in both serum and spleen samples. To identify potential biomarkers associated with BDS, we rigorously compared the serum and spleen metabolites of the rats in each group. The selection criteria were variables with a variable importance in the projection (VIP) > 1 and p value < 0.05. Furthermore, we screened the relative molecular mass and tandem mass spectrometry results against the mass spectrometric information in the mzCloud, Masslist Search, mzVault, and ChemSpider databases, enabling the identification of potential markers with precision.
2.8 16S rDNA gene sequencing and analysis
2.8.1 DNA extraction and PCR amplification
We collected the rat colon contents and quickly stored them in liquid nitrogen. Following the manufacturer's instructions, we utilized the PF Mag-Bind Stool DNA Kit (Omega Biotek, GA, USA) to extract total microbial genomic DNA from the colonic content samples. The quality and concentration of the DNA were assessed through 1.0 % agarose gel electrophoresis and a NanoDrop® ND-2000 spectrophotometer (Thermo Scientific Inc., USA). The extracted DNA was then stored at −80 °C until subsequent use. For the amplification of the hypervariable region of the bacterial 16S rRNA gene V3-V4, we used an ABI thermocycler. The PCR mixture consisted of 4 μL of 5× Fast Pfu buffer, 2 μL of 2.5 mM dNTPs, 0.8 μL of forwards and reverse primers (5 μM), 0.4 μL of Fast Pfu polymerase, 10 ng of template DNA, and ddH2O in a final volume of 20 μL. The PCR amplification cycle conditions included initial denaturation at 95 °C for 3 min, denaturation at 95 °C for 30 s, annealing at 55 °C for 30 s, and extension at 72 °C for 45 s for a total of 27 cycles. A final extension was performed at 72 °C for 10 min, followed by cooling to 4 °C. All samples were subjected to triplicate amplification. Subsequently, PCR products were extracted and purified from 2 % agarose gels, and quantification was performed using a Quantus™ fluorometer (Promega, USA).
2.8.2 Data processing
Handling of the raw FASTQ files began with demultiplexing, a task facilitated by an in-house Perl script. Subsequently, fastp version 0.19.6 was employed for quality filtering, followed by merging using FLASH version 1.2.11. Filtering adhered to the following criteria: (i) Reads exceeding 300 bp were truncated when an average quality score of less than 20 was observed in a 50 bp sliding window. Reads shorter than 50 bp and those containing ambiguous characters were systematically discarded. (ii) Assembly relied exclusively on overlapping sequences with overlaps exceeding 10 bp. A maximum mismatch ratio of 0.2 was enforced in the overlapping region. Reads unable to undergo successful assembly were promptly removed. (iii) Samples were categorized based on barcodes and primers, and sequence orientation adjustments were made to ensure accurate barcode and primer matching, accommodating up to 2 nucleotide mismatches.
2.8.3 Spearman correlation analysis
We performed Spearman correlation analysis between the abundance of the gut microbiota at the phylum level and the changes in the levels of serum and spleen metabolites. The stats package used was R version 3.6.3. Correlation heatmaps with symbols were clustered using the OmicStudio tool at https://www.omicstudio.cn.
2.9 Statistical analysis
Based on operational taxonomic unit (OTU) data, we used Mothur v1.30.2 to calculate rarefaction curves and alpha diversity indices, which included observed OTUs, the Chao index, the Shannon index, and the Simpson index. Microbial community similarities across different samples were assessed through principal coordinate analysis (PCoA) based on Bray–Curtis dissimilarity using the Vegan v2.4.3 package. The PERMANOVA test, available in the Vegan v2.4.3 software package, was employed to determine the extent of variation explained by ST treatment and its statistical significance.
To identify taxa (at the phylum to genus levels) significantly enriched in bacteria in different groups, we employed linear discriminant analysis effect size (LEfSe) (LDA score > 2, p < 0.05). Considering multicollinearity among clinical parameters, we estimated the variance inflation factor (VIF) of each variable using the vif function within the Vegan v2.4.3 package. We conducted distance-based redundancy analysis (db-RDA) with the same software package to investigate the impact of clinical parameters on the intestinal bacterial community structure. Our approach used forwards selection and a Monte Carlo test (permutation = 9999). The values on the x- and y-axes and the lengths of the corresponding arrows represent the significance of each clinical parameter in explaining the distribution of taxa within communities. We also applied linear regression analysis to explore the relationships between the primary clinical parameters identified through db-RDA and the microbial alpha diversity indices.
All the data are presented as the means ± standard deviations. For comparisons between groups, we used one-way analysis of variance (ANOVA) with Tukey's post hoc test with GraphPad Prism 7 software (GraphPad Software Inc., San Diego, CA, USA). Significance levels were established with a value of p < 0.05 indicating a significant difference and a value of p < 0.01 indicating a highly significant difference. Histograms were generated using GraphPad Prism 7 software.
3 Results
3.1 Organ coefficient results
The spleen coefficient of the model group was significantly greater (p < 0.01) than that of the control group. However, compared with those in the model group, both the ST-H group (p < 0.01) and the ST-M group (p < 0.05) showed significant decreases. Notably, there was no significant difference in the spleen coefficient between the ST-L groups. The thymus coefficient of the model group was significantly lower than that of the control group (p < 0.01). However, compared with the model group, both ST-H groups (p < 0.01) showed significant increases. Notably, there was no significant difference in the thymus coefficient between the ST-M group and the ST-L group. There was no significant difference in the liver coefficient between the groups (p > 0.05; Fig. 2L). These findings suggest that the effect of ST on splenomegaly is dose dependent.
The effect of ST on physiological and biochemical indicators in BDS rats. (A) WBC level; (B) HCT level; (C) RBC level; (D) HGB level; (E) EPO level; (F) TNF-α level; (G) G-CSF level; (H) IL-6 level; (I) AST activity; (J) ALT activity; (K) Cr level; (L) organ coefficient; (M) HE staining (200× and 20×). Each value represents the mean ± SD (n = 6). * p < 0.05, ** p < 0.01, *** p < 0.001.
3.2 Routine blood test results
After 15 days of ST administration to the rats, we assessed the RBC, WBC, HGB, and HCT levels (Fig. 2A–D). The significantly lower levels of these parameters in the model group than in the control group (p < 0.01) confirmed the successful induction of BDS. Interestingly, the RBC, WBC, HGB, and HCT levels of the ST-H and ST-M groups were notably greater than those of the model group (p < 0.05 or p < 0.01). These findings provide evidence of the therapeutic effect of ST on BDS in rats.
3.3 Biochemical levels in serum
We employed ELISA to measure the serum levels of EPO, G-CSF, TNF-α, and IL-6. Compared with those in the control group, the G-CSF, TNF-α, and IL-6 levels were significantly decreased in the model group (p < 0.05, p < 0.01, or p < 0.001), while that of EPO was increased (p < 0.05). However, there was a significant increase in the levels of EPO, G-CSF, TNF-α, and IL-6 in the ST-H group (p < 0.05 or p < 0.01) (Fig. 2E–H). There were no significant changes in the Cr level or AST or ALT activities, proving that ST is nontoxic to the liver and kidneys of rats and is safe and reliable as a therapeutic drug (Fig. 2I–K).
3.4 HE staining results
Compared with those in the control group, the morphology of the spleen cells in the other groups of rats significantly changed (Fig. 2M). In the model group, there was notable atrophy of the white pulp, characterized by smaller sections, constriction, and disappearance of the peripheral marginal zone. Additionally, congestion in the peripheral capillaries, increased red blood cells (black arrow), severe expansion of extramedullary haematopoietic cells in the red pulp (red arrow), and more pronounced accumulation of haemosiderin deposition (yellow arrow) were observed. In contrast, the ST-H group exhibited the most noticeable differences, including a decrease in the number of white pulp, narrowed marginal bands, blurred structure, decreased cells (black arrow), reduced extramedullary haematopoietic cells in the red pulp (red arrow), and decreased haemosiderin deposition (yellow arrow).
3.5 Metabolomics analysis results
3.5.1 Analysis of the serum and spleen metabolic profile in the ST-treated BDS model
In serum metabolomics, PCA of the metabolic profiles of rat serum samples in all experimental groups showed that the PCA scores for the control and model groups were completely distinguishable, while those for the ST-H, ST-M, and ST-L groups partially overlapped (Fig. 3A and C). Subsequently, we analysed the metabolites of rats in the control, model, ST-H, ST-M, and ST-L groups in both positive and negative modes using PLS-DA pattern recognition methods (Fig. 3B and D). Permutation test analysis was also applied (Fig. 3E and F). The following screening conditions were used: VIP > 1 and an independent sample t test p < 0.05. A total of 13 shared differentially abundant metabolites were screened and included 4 in positive mode and 9 in negative mode (Table 1). The results showed significant differences in the metabolites of the BDS rats with and without ST intervention, indicating high reliability of the data. Specifically, under ST intervention, 1 differentially abundant metabolite, 3-hydroxybutyric acid, was upregulated. In contrast, phenylacetylglycine, allantoin, and L-proline were downregulated (Fig. 3G). The fold change (FC) values are shown in Fig. 3H.
Serum metabolomics. (A and C) PCA was conducted on data obtained in positive and negative ion modes of electrospray ionization (ESI); (B and D) PLS-DA was conducted on data obtained in positive and negative ion modes of ESI (n = 6); (E and F) permutation test analysis of positive and negative ion mode data; (G) heatmap and cluster analysis for potential biomarkers; (H) FC chart (ST-H vs. model group); (I) bubble chart (ST-H vs. model group).
Metabolite
HMDB ID
Adducts
Formula
m/z
RT (min)
a
b
b
b
Model
ST-H
ST-M
ST-L
Oxoglutaric acid
208
M-H
C5H6O5
146.021
0.82
↓
↓
↓
↓
Phenylacetylglycine
821
M-H
C10H11NO3
193.0737
4.72
↑
↓
↓
↓
Allantoin
462
M-H
C4H6N4O3
158.0435
0.67
↑
↓
↓
↓
L-Proline
162
M+H
C5H9NO2
115.0639
0.69
↑
↓
↓
↓
Sphinganine 1-phosphate
1383
M-H
C18H40NO5P
381.2649
9.21
↑
↑
↓
↑
3-Hydroxybutyric acid
11
M-H
C4H8O3
104.0468
1.59
↓
↑
↑
↑
Propionylcarnitine
824
M+H
C10H19NO4
217.1325
2.05
↑
↓
↓
↓
Glycocholic acid
138
M-H
C26H43NO6
465.3102
6.44
↓
↓
↓
↓
Glycochenodeoxycholic acid
637
M-H
C26H43NO5
449.315
8.14
↓
↑
↑
↓
L-Methionine
696
M+H
C5H11NO2S
149.0521
0.82
↑
↓
↓
↓
Hippuric acid
714
M-H
C9H9NO3
179.0577
4.43
↑
↓
↓
↓
Arachidonic acid
1043
M-H
C20H32O2
304.2409
12.99
↓
↓
↓
↓
Palmitoylcarnitine
222
M+H
C23H45NO4
399.3373
10.31
↑
↓
↓
↓
Based on spleen metabolomics, PCA score plots showed apparent differences between the control, BDS, and ST-H, ST-M, and ST-L samples in both positive and negative modes. Notably, the greatest restorative effect occurred in the ST-treated group (Fig. 4A and C), suggesting that ST has a potent palliation effect on the BDS. Overall metabolic changes were investigated by PLS-DA (Fig. 4B and D). Permutation test analysis was conducted (Fig. 4E and F). The following screening conditions were used: VIP > 1 and an independent sample t test p < 0.05. A total of 15 shared differentially abundant metabolites were screened and included 9 detected in positive mode and 6 detected in negative mode (Table 2). The results showed significant differences in the metabolites of the BDS rats with and without ST intervention, indicating high reliability of the data. Specifically, under ST intervention, 2 differentially abundant metabolites, citrulline and 4-hydroxybenzaldehyde, were downregulated. In contrast, threonic acid and erucic acid were downregulate (Fig. 4G). The FC values are shown in Fig. 4H.
Spleen metabolomics. (A and C) PCA was conducted on the data obtained in positive and negative ion modes of ESI; (B and D) PLS-DA was conducted on data obtained in positive and negative ion modes of the ESI (n = 6); (E and F) permutation test analysis of positive and negative ion mode data; (G) heatmap and cluster analysis for potential biomarkers; (H) FC chart (ST-H group vs. model group); (I) bubble chart (ST-H group vs. model group).
Metabolite
HMDB ID
Adducts
Formula
m/z
RT (min)
a
b
b
b
Model
ST-H
ST-M
ST-L
Adenine
34
M+H
C5H5N5
135.0545
2.38
↓
↓
↓
↓
Choline
97
M+H
C5H13NO
104.1075
0.59
↓
↓
↓
↓
L-Phenylalanine
159
M+H
C9H11NO2
165.0793
2.79
↑
↑
↓
↓
Uric acid
289
M+H
C5H4N4O3
168.0285
1.07
↓
↓
↓
↓
Histamine
870
M+H
C5H9N3
111.0807
0.50
↑
↑
↑
↑
Citrulline
904
M+H
C6H13N3O3
175.0962
0.62
↑
↓
↓
↓
L-Tryptophan
929
M+Na
C11H12N2O2
204.0915
3.78
↑
↑
↑
↑
4-Guanidinobutyric acid
3464
M+H
C5H11N3O2
145.0854
0.82
↓
↓
↓
↓
4-Hydroxybenzaldehyde
11,718
M+H
C7H6O2
122.0370
1.38
↑
↓
↓
↓
Creatine
64
M-H
C4H9N3O2
131.0691
0.68
↓
↑
↓
↓
Threonine
167
M-H
C4H9NO3
119.0578
0.63
↑
↑
↑
↑
L-Serine
187
M-H
C3H7NO3
105.0421
0.59
↑
↑
↑
↑
Threonic acid
943
M-H
C4H8O5
136.0375
0.67
↓
↑
↑
↑
Arachidonic acid
1043
M-H
C20H32O2
304.2409
13.06
↑
↑
↑
↑
Erucic acid
2068
M-Na
C22H42O2
338.3191
15.87
↓
↑
↑
↑
3.5.2 Pathway enrichment and metabolic network analysis
To enhance our understanding of ST-H treatment on BDS, we used the KEGG database for metabolite annotation and subsequent identification of potential biomarkers. In serum metabolomics, a thorough pathway analysis of 13 metabolites using MetaboAnalyst identified interferences in 6 metabolic pathways (Fig. 3I; p < 0.05). These pathways included phenylalanine metabolism, butanoate metabolism, synthesis and degradation of ketone bodies, primary bile acid biosynthesis, D-glutamine and D-glutamate metabolism, and aminoacyl-tRNA biosynthesis. In spleen metabolomics, as shown in Fig. 4I, we performed KEGG enrichment analysis on 15 metabolites (p < 0.05). These pathways are closely related to glycine, serine and threonine metabolism; aminoacyl-tRNA biosynthesis; phenylalanine, tyrosine and tryptophan biosynthesis; and arginine and proline metabolism.
3.6 Gut microbiota analysis results
3.6.1 Effects of ST on the structure of the gut microbiota
As depicted in Fig. 5, 862,333 sequencing reads were obtained from 15 samples. The rarefaction curves, specifically the sobs index at the OTU level, indicated stability (Fig. 5A). In contrast, the rank abundance curves demonstrated a smooth trend (Fig. 5B), signifying that the sequencing data were adequate to reflect the richness and uniformity of the gut microbiota communities in each sample. After eliminating complete sequences, we utilized a Venn diagram to represent the distinctive characteristics and common classification groups of the different treatment groups. We identified 440 OTUs in the intestinal microbiota of all groups based on the >97 % similarity between sequences (Fig. 5C).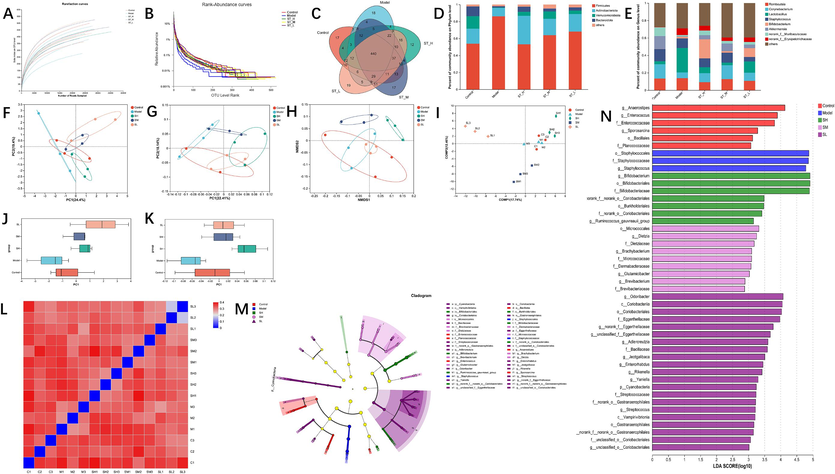
Effect of ST on the analysis of species differences and diversity of the gut microbiota in rats. (A) Rarefaction curves; (B) rank abundance curves; (C) OTU Venn diagram. The colonic bacterial community at the phylum (D) and genus (E) levels, less than 0.5 % in abundance, was merged into the group Others; (F) PCA; (G) PCoA; (H) NMDS analysis; (I) PLS-DA; (J) PCA box diagram; (K) PCoA box diagram; (L) β-diversity heatmap; (M) the indicator bacteria with an LDA score of 2 or higher in the bacterial community were associated with the five groups of rats; (N) Areas with different colours represent different components (red, control group; blue, model group; green, ST-H group; pink, ST-M group; purple, ST-L group). Each value represents the mean ± SD (n = 3). # p < 0.05 or ## p < 0.01, compared with the control group; * p < 0.05 or ** p < 0.01, compared with the model group.
The results provided insight into the impact of BDS on the gut microbiota. This impact includes the downregulation of Bacteroidota, Verrucomicrobiota, Lactobacillus, and Bifidobacterium (p < 0.05 or p < 0.01) and the simultaneous upregulation of Firmicutes, Staphylococcus, Corynebacterium (p < 0.05), and Desulfobacterota (p > 0.05). Notably, the ST-H group, in contrast to the model group, exhibited a substantial increase in the relative abundances of Bacteroidota and Verrucomicrobiota while concurrently displaying a significant decrease in Firmicutes and Desulfobacterota abundances at the phylum level. At the genus level, ST-H prominently increased the relative abundances of Lactobacillus and Bifidobacterium while significantly decreasing the relative abundances of Corynebacterium and Staphylococcus. Remarkably, the efficacy of ST-H was superior to that of ST-M and ST-L, as indicated in Fig. 5D and E.
We evaluated the gut microbiota diversity in BDS rats using PCoA of the unweighted UniFrac distance. The results showed significant differences among the five groups (Fig. 5G and K), indicating gut microbial dysbiosis in the BDS rats. NMDS analysis revealed similar results (Fig. 5H). We performed a MetaStats analysis of the sequencing data in the PCA plot (Fig. 5F and J), which was consistent with the PCoA and NMDS results. PLS-DA (Fig. 5I) revealed notable group dispersion, further supporting the results. We generated a heatmap (Fig. 5L) based on the unweighted UniFrac distances calculated between the samples, which revealed that the treatment effect of BDS in the ST-H group was more substantial than that in the ST-M group, which was greater than that in the ST-L group.
We utilized the LEfSe method to identify specific bacterial taxa in distinct populations because of its ability to analyse data from any branch of a gut microbiota community. However, due to the extensive data, only complex statistical analyses were carried out from the phylum to the genus level, considering the number of OTUs detected in this study. The presented grouping in the cladograms, with an LDA score of 2 or higher, confirmed a significant difference (Fig. 5M). Fig. 5N shows that the bacteria with the most notable differences in abundance were g_Anaerostipes in the control group, o_Staphylococcales in the model group, g_Bifidobacterium in the ST-H group, o_Micrococcales in the ST-M group, and g_Odoribacter in the ST-L group.
3.6.2 Annotation of the gut microbiota function and correlation analysis
To elucidate the functions of the gut microbiota, we used PICRUSt2 functional prediction. These predictions are instrumental in providing a deeper understanding of the interactions between species and their functional roles, as defined in the KEGG database. Fig. 5 was generated through a t test, facilitating a comparative analysis of predicted changes in gut microbiota functions among the control, model, and ST-H groups. The control group displayed significantly greater gut microbial function changes than did the model group, particularly in domains concerning development and regeneration, cancer-specific types, cardiovascular disease, and various other functions (Fig. 6A). In contrast, the ST-H group exhibited substantially elevated levels compared to the model group, underscoring noteworthy variations in functions such as immune disease, amino acid metabolism, and transcription (Fig. 6B).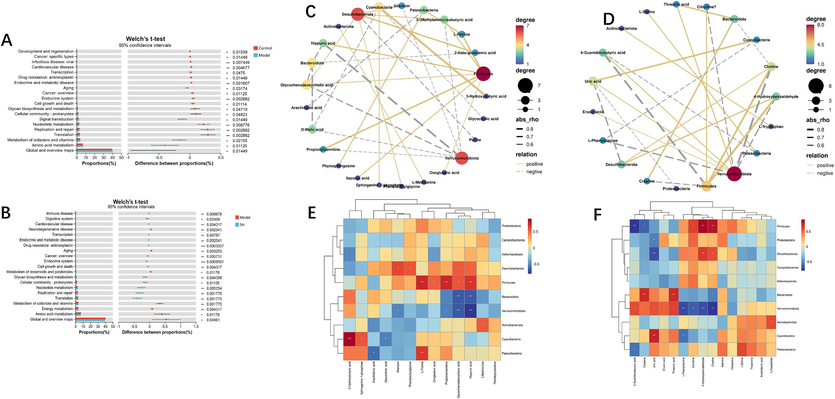
Functional prediction of altered gut microbiota by PICRUSt2 analysis based on KEGG pathways at level II in rats. (A) Control group vs. model group; (B) model group vs. ST-H group. Spearman correlation heatmap between the concentration of serum metabolites and the relative abundance of microbial phyla in the ST-H group (C and E); spleen metabolites and the relative abundances of microbial phyla in the ST-H group (D and F). R values are represented by gradient colours, where red and blue cells indicate positive and negative correlations, respectively; * p < 0.05, ** p < 0.01.
Our research team performed Spearman correlation analysis to better understand the complex interactions between the gut microbiota and serum and spleen metabolites. Specifically, we performed Spearman correlation analysis between 13 serum metabolites and the gut microbiota at the phylum level. Our study revealed that Verrucomicrobiota was negatively associated with metabolites such as allantoin, propionylcarnitine, glycochenodeoxycholic acid and hippuric acid. Moreover, Firmicutes was positively correlated with oxoglutaric acid, glycochenodeoxycholic acid, hippuric acid, L-proline, and propionylcarnitine. Bacteroidota was negatively associated with hippuric acid and glycochenodeoxycholic acid (Fig. 6C and E). Spearman correlation analysis was also conducted between 15 spleen metabolites and the gut microbiota at the phylum level. Our study revealed that Verrucomicrobiota was positively correlated with erucic acid, uric acid, 4-guanidinobutyric acid, and threonic acid and negatively correlated with citrulline, 4-hydroxybenzaldehyde, L-phenylalanine, and choline. Firmicutes was positively correlated with citrulline, choline, and 4-hydroxybenzaldehyde and negatively correlated with creatine and 4-guanidinobutyric acid. Bacteroidota was positively correlated with creatine and threonic acid and negatively associated with choline (Fig. 6D and F). Through correlation analysis, an association between certain intestinal microbial communities and serum and spleen metabolites was observed, and these metabolites may be related to BDS. Moreover, ST can be used as a prebiotic to promote the growth of beneficial microorganisms and inhibit the reproduction of harmful microorganisms, thereby regulating the levels of related metabolites, and is expected to alleviate the symptoms of BDS. In addition, ST may also improve overall intestinal health by regulating the structure and function of the intestinal microbial community, thereby affecting the levels of metabolites and providing a novel and feasible method for BDS treatment.
4 Discussion
Research has confirmed that CP has adverse effects on the bone marrow and haematopoietic system (Cao et al., 2023). Experiments have shown that after CP injection, normal rats exhibit a series of symptoms such as slow movement, lethargy, weight loss and hair loss, which are accompanied by splenomegaly. The toxicity of CP is not limited to haematopoietic cells in the bone marrow but also affects other rapidly dividing normal cells, such as gastrointestinal tract and hair follicle cells, which may lead to impaired haematopoietic function and prompt a decrease in RBC, WBC, HGB, and HCT levels (Wang et al., 2022b). In contrast, ST administration had significant positive effects on BDS in rats. Based on behavioural observations and peripheral blood cell indicators, ST treatment significantly increased RBC, WBC, HGB, and HCT levels, which are typically reduced in BDS (Safeukui et al., 2015). Splenomegaly often accompanies BDS and is one of the main pathological manifestations of various anaemias (Altamura et al., 2020). This splenomegaly may be caused by haematopoietic dysfunction and the accumulation of RBCs in the spleen (Koldkjaer et al., 2013). Splenic enlargement can exacerbate anaemia because an enlarged spleen collects more RBCs than does a healthy spleen. Further studies showed that compared with those in the model group, the spleens of ST-treated rats were significantly smaller than those of untreated BDS rats, indicating that ST can reduce the negative effects of chemotherapy on the spleen, thereby hopefully reducing the severity of anaemia.
In recent years, natural plant-derived sugars have garnered significant attention in medical and nutraceutical applications due to their low toxicity and diverse biological activities, including antitumour, immunomodulatory, hypoglycaemic, and antioxidant properties (Yang et al., 2015). ST is recognized as an essential functional food. Clinically, ST is primarily used to enhance immunity. Therefore, after rats were administered ST, the spleen coefficient of the ST-H group was significantly lower than that of the model group. Examination of routine blood parameters revealed significant improvements in HCT, RBC, WBC, and HGB levels in the ST-H group. Analysis of serum biochemical indices indicated significant increases in TNF-α, IL-6, EPO, and G-CSF levels in the ST-H group. Histopathological analysis demonstrated that the ST-H group substantially improved the spleen morphology of the rats. In contrast, the ST-L group did not exhibit significant changes compared to the model group.
EPO and G-CSF are haematopoietic growth factors (HGFs) commonly employed in treating BDS. EPO, a human endogenous glycoprotein hormone that stimulates erythropoiesis (Reichel and Gmeiner, 2010), was elevated in rats injected with CP and APH. This suggests that chemotherapy-induced BDS triggers a feedback increase in EPO content as a compensatory mechanism. Due to the damage inflicted by chemotherapeutic drugs on bone marrow cells, the ability of response cells to respond to HGFs is reduced, requiring higher concentrations of HGFs to promote the recovery of haematopoietic function. Following treatment, the levels of EPO in the ST-H, ST-M, and ST-L groups surpassed those in the model group. The ST-H group significantly differed (p < 0.05) from the model group. ST can promote the recovery of erythropoiesis by boosting the synthesis and secretion of EPO in the bone marrow of rats. Another HGF is G-CSF, which acts mainly on bone marrow stromal cells or fibroblasts and is vital for regulating haematopoiesis and leukocyte formation (Jia et al., 2017). APH and CP significantly inhibited G-CSF expression, which increased dramatically after ST administration. These results suggested that ST can somewhat inhibit the cytotoxicity of CP and APH. ST administration increased G-CSF levels and promoted the recovery of granulocyte haematopoietic function. Immunocytokines such as TNF-a, IL-3, and IL-6 play vital roles in immune system coordination. They facilitate lymphoid, inflammatory, and haematopoietic cell communication (Mei et al., 2013). In this study, the serum levels of TNF-a and IL-6 were notably lower in the BDS group than in the control group. Interestingly, ST administration reversed this inhibitory effect, indicating its potential to enhance immune function and alleviate the effects of BDS.
The intestine hosts a large microbiota, and disruption of its spatial organization is often an essential feature of disease pathogenesis (Camilleri, 2019). The gut microbiota typically consists of billions of bacteria that maintain a symbiotic relationship with the host and play a crucial role in regulating metabolism (Zhang et al., 2023a,b). Many studies have shown that changes in the gut microbiota are mainly characterized by an increase in the abundance of Firmicutes and a decrease in the abundance of Bacteroidetes. Therefore, the Firmicutes to Bacteroidetes (F/B) ratio has become an important reference indicator for studying intestinal dysbiosis. This study used 16S rRNA sequencing to observe that ST intervention enhanced the gut microbiota composition in BDS model rats. This enhancement was achieved by reducing the relative abundance of Firmicutes and increasing the relative abundance of Bacteroidetes. At the genus level, Lactobacillus increased, and Staphylococcus decreased. According to the metabolic pathway analysis of KEGG, metabolic pathways showing different abundances between groups were predicted. The KEGG-predicted pathways of PICRUSt2 showed differences between the groups regarding amino acid metabolism, global and overview maps, and energy metabolism. These findings suggest that ST may play a role in restoring the balance of the gut microbiota and may have a potential therapeutic role in treating BDS.
In this study, we utilized untargeted serum and spleen metabolomics techniques to investigate the impact of CP intervention on metabolite changes in rats. Metabolites in human blood offer valuable insights into an individual's physiological condition. Through PCA and PLS-DA analyses, we observed a distinct separation between the model and ST-H groups in both ESI + and ESI- modes, indicating a significant influence of ST on rat metabolism. The key differentially abundant metabolites involved in serum and spleen metabolism included L-proline, L-methionine, L-phenylalanine, citrulline, L-tryptophan, threonine, and L-serine. These metabolites play essential roles as amino acids in rats. Experiments have demonstrated that amino acids effectively counteract CP-induced myelosuppression in rats. Phenylalanine, an essential aromatic amino acid, plays a significant role in this process. Amino acids generally contribute to protein synthesis within various cell types. Phenylalanine metabolism produces tyrosine in organs such as the liver, giving rise to essential hormones and neurotransmitters. For example, dopamine in the nervous system and adrenaline and norepinephrine in the adrenal medulla are developed in this pathway (Fernstrom and Fernstrom, 2007; Castillo et al., 1994). Consequently, maintaining a stable phenylalanine metabolism state is essential for normal bodily growth, development, and physiological functions. Factors such as immunity, liver and kidney conditions, neurohumoural imbalances, and genetics can disrupt phenylalanine metabolism. Such disruptions might arise from impaired phenylalanine-to-tyrosine conversion, leading to elevated phenylalanine concentrations or imbalanced phenylalanine-to-tyrosine ratios (IKEDA et al., 1965; Ribeiro et al., 1991). Our study revealed increased phenylalanine content within the model group's samples. This elevation could be attributed to Qi and blood deficiency impacting phenylalanine metabolism, which is consistent with literature reports (Zhao et al., 2008). Therefore, based on the comprehensive 16S functional prediction analysis results, we believe that phenylalanine metabolism may be a key pathway through which ST regulates BDS. ST has been shown to improve the effects of CP on spleen enlargement and haematocytopenia in rats by enhancing the body's immunity.
5 Conclusion
In summary, our study revealed that ST has a multifaceted improvement effect on BDS, including enhancing immune levels, improving spleen function, and alleviating pathological changes, among others. The mechanism by which ST treats BDS may involve regulating phenylalanine metabolism and correcting gut microbial imbalances. However, although these effects were initially discovered in this study, there are still some shortcomings. Future studies are required to conduct relatively large-scale clinical trials to verify these findings and further explore the long-term effects of ST treatment, as well as the specific therapeutic mechanisms of ST, providing a more comprehensive understanding of the development of more effective treatment strategies.
Ethics statement
The animal study was reviewed and approved by Ethics Committee of Heilongjiang University of Chinese Medicine.
Funding
Chief Scientist of Qi-Huang Project of National Traditional Chinese Medicine Inheritance and Innovation “One Hundred Million” Talent Project (2021); Qi-Huang Scholar of National Traditional Chinese Medicine Leading Talents Support Program (2018); Heilongjiang Touyan Innovation Team Program (2019); National Famous Old Traditional Chinese Medicine Experts Inheritance Studio Construction Program of National Administration of TCM (Grant Number: [2022] No. 75); The Seventh Batch of National Famous Old Traditional Chinese Medicine Experts Experience Heritage Construction Program of National Administration of TCM (Grant Number: [2022] No. 76); This work was financially supported by Administration of Traditional Chinese Medicine of Guangdong Province, China (20221214).
CRediT authorship contribution statement
Wensen Zhang: Writing – original draft, Writing – review & editing. Na Cui: Writing – original draft. Fazhi Su: Data curation. Yanping Sun: Data curation, Resources. Biao Li: Formal analysis. Meng Liu: Formal analysis. Yuanning Zeng: Methodology. Bingyou Yang: Resources. Qiuhong Wang: Funding acquisition, Resources, Software. Haixue Kuang: Funding acquisition, Project administration, Resources, Validation, Visualization.
Declaration of competing interest
The authors declare that they have no known competing financial interests or personal relationships that could have appeared to influence the work reported in this paper.
References
- Glutathione peroxidase 4 and vitamin E control reticulocyte maturation, stress erythropoiesis and iron homeostasis. Haematologica. 2020;105(4):937-950.
- [CrossRef] [Google Scholar]
- High-dose chemoradiotherapy (HDC) in the Ewing family of tumors (EFT) Crit. Rev. Oncol. Hematol.. 2002;41(2):169-189.
- [CrossRef] [Google Scholar]
- Leaky gut: mechanisms, measurement and clinical implications in humans. Gut. 2019;68(8):1516-1526.
- [CrossRef] [Google Scholar]
- Protopanaxadiol manipulates gut microbiota to promote bone marrow hematopoiesis and enhance immunity in cyclophosphamide-induced immunosuppression mice. MedComm. 2023;4(2):e222.
- [Google Scholar]
- Phenylalanine and tyrosine kinetics in critically ill children with sepsis. Pediatr. Res.. 1994;35(5):580-588.
- [Google Scholar]
- Metabolomics and lipidomics study unveils the impact of tauroursodeoxycholic acid on hyperlipidemic mice. Molecules (Basel, Switzerland). 2023;28(17):6352.
- [CrossRef] [Google Scholar]
- Characterization and anti-hyperlipidemia effects of enzymatic residue polysaccharides from Pleurotus ostreatus. Int. J. Biol. Macromol.. 2019;129:316-325.
- [CrossRef] [Google Scholar]
- Tyrosine, phenylalanine, and catecholamine synthesis and function in the brain. J. Nutr.. 2007;137(6 Suppl 1):1539S-S1548.
- [CrossRef] [Google Scholar]
- Hydroxylation of phenylalanine by purified preparations of adrenal and brain tyrosine hydroxylase. Biochem. Biophys. Res. Commun.. 1965;18:482-488.
- [CrossRef] [Google Scholar]
- Synergistic effects of G-CSF and bone marrow stromal cells on nerve regeneration with acellular nerve xenografts. Synapse (New York, N.Y.). 2017;71(7)
- [CrossRef] [Google Scholar]
- Pronounced in vivo hemoglobin polymerization in red blood cells of Gulf toadfish: a general role for hemoglobin aggregation in vertebrate hemoparasite defense? Am. J. Physiol. Regul. Integr. Comp. Physiol.. 2013;305(10):R1190-R1199.
- [CrossRef] [Google Scholar]
- White blood cells detection and classification based on regional convolutional neural networks. Med. Hypotheses. 2020;135:109472
- [CrossRef] [Google Scholar]
- Urinary metabolomics analysis reveals the anti-diabetic effect of stachyose in high-fat diet/streptozotocin-induced type 2 diabetic rats. Carbohydr. Polym.. 2020;229:115534
- [CrossRef] [Google Scholar]
- Regulatory effects of stachyose on colonic and hepatic inflammation, gut microbiota dysbiosis, and peripheral CD4+ T cell distribution abnormality in high-fat diet-fed mice. J. Agric. Food Chem.. 2019;67(42):11665-11674.
- [CrossRef] [Google Scholar]
- Protective effect of chitooligosaccharides against cyclophosphamide-induced immunosuppression in mice. Int. J. Biol. Macromol.. 2013;62:330-335.
- [CrossRef] [Google Scholar]
- Combinations of anticancer drugs and immunotherapy. Cancer Immunol. Immunother.: CII. 2003;52(11):686-692.
- [CrossRef] [Google Scholar]
- Historical and pharmacological studies on rehmannia root processing- trends in usage and comparison of the immunostimulatory effects of its products with or without steam processing and pretreatment with liquor. J. Ethnopharmacol.. 2019;242:112059
- [CrossRef] [Google Scholar]
- The hydroxylation of phenylalanine and tyrosine by tyrosine hydroxylase from cultured pheochromocytoma cells. J. Biol. Chem.. 1991;266(24):16207-16211.
- [Google Scholar]
- Malaria induces anemia through CD8+ T cell-dependent parasite clearance and erythrocyte removal in the spleen. MBio. 2015;6(1):e02493-e02514.
- [CrossRef] [Google Scholar]
- The intestinal microbiota modulates the anticancer immune effects of cyclophosphamide. Science (New York, N.Y.). 2013;342(6161):971-976.
- [CrossRef] [Google Scholar]
- Effects of sheep whey protein combined with Fu brick tea polysaccharides and stachyose on immune function and intestinal metabolites of cyclophosphamide-treated mice. J. Sci. Food Agric.. 2023;103(7):3402-3413.
- [CrossRef] [Google Scholar]
- Blood-enriching effects and immune-regulation mechanism of steam-processed Polygonatum sibiricum Polysaccharide in blood deficiency syndrome mice. Front. Immunol.. 2022;13:813676
- [CrossRef] [Google Scholar]
- Metabolomic strategies and biochemical analysis of the effect of processed rehmanniae radix extract on a blood-deficient rat model. BMC Complementary Med. Ther.. 2022;22(1):89.
- [CrossRef] [Google Scholar]
- Metabolomics for investigating physiological and pathophysiological processes. Physiol. Rev.. 2019;99(4):1819-1875.
- [CrossRef] [Google Scholar]
- Non-digestive stachyose enhances bioavailability of isoflavones for improving hyperlipidemia and hyperglycemia in mice fed with high fat diet. J. Food Drug Anal.. 2021;29(1):87-97.
- [CrossRef] [Google Scholar]
- Effects of cyclophosphamide on immune system and gut microbiota in mice. Microbiol. Res.. 2014;171:97-106.
- [CrossRef] [Google Scholar]
- The changes induced by cyclophosphamide in intestinal barrier and microflora in mice. Eur. J. Pharmacol.. 2013;714(1–3):120-124.
- [CrossRef] [Google Scholar]
- Purification and structural characterization of Chinese yam polysaccharide and its activities. Carbohydr. Polym.. 2015;117:1021-1027.
- [CrossRef] [Google Scholar]
- Comprehensive metabolomics and network pharmacology to explore the mechanism of 5-hydroxymethyl furfural in the treatment of blood deficiency syndrome. Front. Pharmacol.. 2022;12:811331
- [CrossRef] [Google Scholar]
- Serum, spleen metabolomics and gut microbiota reveals effect of catalpol on blood deficiency syndrome caused by cyclophosphamide and acetylphenylhydrazine. Front. Immunol.. 2023;14:1280049.
- [CrossRef] [Google Scholar]
- Therapeutic impact of stachyose on hyperlipidaemia caused by a high-fat diet in mice as revealed by gut microbiota and metabolomics. Curr. Res. Food Sci.. 2023;7:100638
- [CrossRef] [Google Scholar]
- The haematopoietic effect of Panax japonicus on blood deficiency model mice. J. Ethnopharmacol.. 2014;154(3):818-824.
- [CrossRef] [Google Scholar]
- Steamed Panax notoginseng attenuates Anemia in mice with blood deficiency syndrome via regulating hematopoietic factors and JAK-STAT pathway. Front. Pharmacol.. 2020;10:1578.
- [CrossRef] [Google Scholar]
- Zhao, X., Zhang, Y., Meng, X., Yin, P., Deng, C., Chen, J., Wang, Z., Xu, G., 2008. Effect of a traditional Chinese medicine preparation Xindi soft capsule on rat model of acute blood stasis: a urinary metabonomics study based on liquid chromatography-mass spectrometry. J. Chromatogr. B 873(2), 151–158. doi:10.1016/j.jchromb.2008.08.010.
- Mining, analyzing, and integrating viral signals from metagenomic data. Microbiome. 2019;7(1):42.
- [CrossRef] [Google Scholar]


