

Translate this page into:
High hydrostatic pressure increases the biosynthesis of γ-aminobutyric acid using bee pollen as a novel and eco-friendly catalyst
⁎Corresponding author at: College of Food Science and Technology, Nanjing Agricultural University, No.1, Weigang Road, Nanjing, Jiangsu, People’s Republic of China. dongms@njau.edu.cn (Ming sheng Dong)
-
Received: ,
Accepted: ,
This article was originally published by Elsevier and was migrated to Scientific Scholar after the change of Publisher.
Peer review under responsibility of King Saud University.
Abstract
Gamma-amino butyric acid (GABA) has antihypertensive and anti-stress effects on human health. High hydrostatic pressure (HHP), a nonthermal treatment, has been documented as a novel approach to enhance the nutritional quality and functional components of plant-based food. In this study, a novel method to convert monosodium glutamate (MSG) to GABA using bee pollen as a natural catalyst was observed, and the GABA yield was improved by HHP treatment. Firstly, GABA production was confirmed by high performance liquid chromatography (HPLC) and tandem mass spectrometry (MS-MS), the highest GABA production was found in lotus bee pollen (LBP) when different varieties of bee pollen were used for the reaction. Secondly, the reaction conditions were utilized, and the optimal reaction condition of the GABA production was determined as described below: 250 mg/mL of bee pollen mixed with 590 mmol/L of MSG that prepared by 80 mmol/L of phosphate buffer (pH 5.8), and incubated at 40 °C for 6 h. For HHP treatment conditions, a treatment of 200 MPa for 10 min at 40 °C was found as the optimal. Under optimal conditions, GABA production reached 508.79 mmol/L (containing GABA from LBP) from 590 mmol/L of MSG. In conclusion, we found and optimized a novel method to convert monosodium glutamate (MSG) to GABA, and proposed the promotion of HHP on GABA bio-conversion.
Keywords
γ-Aminobutyric acid
Bee pollen
Monosodium glutamate
Mass spectrometry
High hydrostatic pressure

1 Introduction
Gamma (γ)-aminobutyric acid (GABA) is a natural and non-protein amino acid that has many functions in the mammalian brain and spinal cord, and acts as an inhibitory neurotransmitter in the central nervous system (Yu et al., 2011). Thus, GABA is considered as a valuable material for use in medical and health care products (Diana et al., 2014). It also has the effect of heat stress and growth on livestock and poultry. At present, preparation of GABA is mainly classified into two categories: chemical methods and biological methods. Biological methods include plant enrichment and microbial fermentation (Zhang et al., 2014). The biosynthesis of GABA has been made by simple α-decarboxylation of glutamate decarboxylase (Kang et al., 2013). Glutamate decarboxylase (GAD, EC 4.1.1.15) is an enzyme that catalyzes the α-decarboxylation of glutamate to GABA and carbon dioxide (Schomburg and Salzmann, 2015). This enzymatic production has been found in bacteria such as LAB (Bertoldi et al., 1999), Escherichia (Ma et al., 2013), Streptococcus, Aspergillus (Kato et al., 2002) and Neurospora (Hao and Schmit, 1991); in plants such as tea (Mei et al., 2016), tomato (Gallego et al., 1995), soybean (Matsuyama et al., 2009), mulberry leaf (Yang et al., 2012), tobacco (Mclean et al., 2003), germinated brown rice (Khwanchai et al., 2014) and cowpea (Johnson et al., 1997). GABA is also found in insects such as cockroaches (Bernard and Thomas, 1988), grasshoppers, moths, honeybees and flies (Anthony et al., 1993). However, most studies have focused on GABA-producing microorganisms rather than GABA-producing plants.
Bee pollen has been proposed as food supplements, it is the main way that humans consume pollen products. It has rich nutritional value and includes protein, fatty acids, phenol, vitamins and trace elements and is described as the “only perfect complete food” and “a miracle food in worldwide ” (Krell, 1996). Furthermore, bee pollen been recorded to include more than 100 enzymes, mainly can be divided into 6 categories: oxidoreductase, transferase, hydrolase, lyase, isomerase, and ligase. Mainly including invertase, amylase, glucose, oxidase, phosphatase, catalytic enzyme, pectinase, cellulase, protease, catalase, lipase and superoxide dismutase (Kai, 2011). But to the best of our knowledge, GAD enzyme activity or GABA production using bee pollen has rarely reported.
High hydrostatic pressure (HHP) processing is new technology, which has appeared in food production in the past decade, and recently in pharmaceutical and medical applications. In the recent years, several studies have found that HHP treatment lead to an increase in metabolite concentrations in plant food matrices (Ramosparra et al., 2019). Patras et al. (2009) have studied that high effect of 600 MPa for 15 min on increasing the content of phenolic compounds in strawberry and blackberry purées. Ueno et al. (2010) have reported that high pressure processing at 200 MPa causes higher accumulation of γ-aminobutyric acid when using soybean. We have also found that HHP increases the enzymatic production of GABA using bee pollen.
In the present study, bee pollen was employed as an enzyme source to produce GABA, a value-added product, via a simple and eco-friendly reaction. The objectives of this study were to determine the method for GABA production from MSG using different types of bee pollen, to optimize the reaction conditions and apply the HHP method for GABA production and to determine the highest production level of GABA and reutilization time of bee pollen using an immobilized continuous reaction system.
2 Materials and methods
2.1 Materials
Different varieties of bee pollen were kindly provided by Nanjing Jiu Feng Tang Bee Products Co., Ltd; GABA, pyridoxal5′-phosphate (PLP), and O-phthaldialdehyde (OPA) were purchased from Sigma Chemicals Co.; monosodium glutamate (MSG) was bought from the supermarket in Nanjing, China; and acetonitrile was of high-performance liquid chromatography (HPLC) grade. Other chemicals and reagents of analytical grade were purchased from Sigma Chemicals Co.
2.2 The γ-aminobutyric acid (GABA) production reaction
Bee pollen at a range of 50–450 mg/mL and MSG at a range of 59–590 mmol/L was added into sample tubes and adjusted to 10 mL with distilled water or different buffer, then mixed completely. The reaction time, pH, and temperature were arbitrarily changed. Different buffers with a variety of concentrations replaced the distilled water where applicable. After the reactions, the suspensions were centrifuged for 10 min at 8000 rpm. The GABA production and residual MSG in the reaction solution were determined by HPLC. Each reaction was performed in triplicate and averages were calculated.
2.3 Determination of GABA content
For the determination of GABA content and residual MSG in the reaction supernatant, HPLC method was applied with minor modifications (Li et al., 2016). 100 µL of the samples underwent pre-column derivatization with 100 µL of OPA solution consisting of 4 mg/mL OPA, 40 µL of β-mercaptoethanol in 10 mL of acetonitrile, and 500 µL of boric acid buffer (0.4 mol/L, pH 10.4) was added to maintain alkaline environment for derivatization. The mixture was vortexed for 15 s and allowed to react for 2 to 5 min at room temperature, 20 µL of derivatized sample was injected and monitored at a wavelength of 334 nm by using a DAD detector (G1315 B, 1200series, Agilent Technologies). The analytes were separated with a mobile phase consisting of 20 mM ammonium acetate buffer (eluent A, pH 7.3) and acetonitrile (eluent B, HPLC grade) at a flow rate of 0.7 mL/min, and the column temperature was set at 25 °C. The program was: 20% of B from 0 to 12 min, 100% of B from 12 to 15 min, then 20% of B from 15 to 20 min. The standard curves were generated based on four levels (0.1, 1, 2, and 3 mmol/L) of the GABA standard.
The conversion rate of MSG to GABA was calculated with the following formula:
Both of final GABA and additional MSG demonstrated in above formula were including endogenous GABA and MSG in LBP.
2.4 Mass spectrometry (multiple reaction monitoring, MRM)
The GABA product was determined by mass spectrometry (Agilent 1200 and 6410 triple quadrupole mass spectrometry series; Agilent, Palo Alto, CA, USA). The analytes were separated with a mobile phase consisting of 80% 20 mmol/L ammonium acetate buffer (eluent A, pH 7.3) and 20% acetonitrile (eluent B) at a flow rate of 0.6 mL/min, and the column temperature was set at 25 °C. The triple quad mass spectrometer was equipped with an ESI detector in positive-ion mode. The system was operated in multiple reaction monitoring (MRM) mode. The MS collision gas was highly pure N2 (>99.9995). The MRM conditions were as follows: MRM transition 87, fragmenter 70, collision energy 6, capillary 4 nA, polarity +, HV voltage 3.5 kV, nebulizer 30 psi, gas flow 10 L/min, gas temperature was 300 °C, and scan range, m/z 50–400 units. The mixture from the above reaction was filtered through a 0.22 μm membranes after diluting 30-fold with Milli-Q water. 10 µL of sample were injected into the chromatographic system.
2.5 High hydrostatic pressure treatment
Weighted 12.5 g pollen was added into 50 mL substrate solution (590 mmol/L MSG and 100 µM PLP dissolved in 80 mmol/L pH 5.8 phosphate buffer) at 25% (w/v). After vacuum sealing, the mixed solution was placed in a sealed bag and treated for 10 min under different pressure using high pressure mini food lAB (Stansted Fluid Power Ltd, Britain). The sealed bag was then incubated in a shaking bed at 40 °C for 6 h. After incubation, GABA and MSG were determined by HPLC method, and the conversion of substrates was calculated.
2.6 Response Surface methodology (RSM)
A three levels, three-factor factorial Box-Behnken design of RSM were performed with high hydrostatic treatment time (A), pressure (B), temperature (C) as independent variables, and GABA content was chosen as a dependent variable. The independent variables were studied at three different levels, and 17 experiments were carried. The design scheme and the test results are shown in the Table 2. Design-Expert 8.0.6 software was used to design and analyze these experimental data.
2.7 Statistical analysis
All experiments were repeated in triplicate, standard deviation (Std.) and average values were calculated. The significant differences between the indicators were analyzed by Variance analysis (Anova) and Duncan's multiple comparison tests using Stata statistical method (P < 0.05).
3 Results and discussion
3.1 Determination of the GABA production using different types of bee pollen
Eight types of bee pollen were selected to determine the production of GABA, and the quantitative results are shown in the Table 1. The results presented that all types of bee pollen containing a certain amount of endogenous MSG and GABA, after added exogenous MSG, highly produced GABA using MSG as substrate. However, the highest production of 49.36 mmol/L (25.45-fold higher than initial GABA content) was observed using lotus bee pollen. The results declare that any type of bee pollen could efficiently transform MSG into GABA by using the endogenous GAD enzyme without adding any exogenous enzyme or coenzyme, but the conversion rate of MSG still needs to improve. Therefore, the LBP was selected for further study to optimize reaction conditions and further studies due to its higher production.
Bee pollen
GABA (mmol/L)
Endogenous
Enrichment
Rape
5.25 ± 0.041 c
26.52 ± 1.513 bc
Camellia
5.03 ± 0.470 ab
22.38 ± 0.139 a
Lotus
1.94 ± 0.267 bc
49.36 ± 0.970 f
Rose
5.00 ± 0.146 ab
36.46 ± 0.877 e
Corn
4.90 ± 0.083 a
31.05 ± 1.087 d
Buckwheat
4.95 ± 0.083 ab
28.02 ± 0.364 cd
Schisandra
5.93 ± 0.045 e
25.27 ± 3.010 ab
Leonurus
5.54 ± 0.287 d
24.53 ± 0.152 ab
The product was identified by mass spectrometry. As is shown in the Fig. 1, a high concentration of GABA was detected by MRM at the transition of 87. This is explained by the fact that, for some neurotransmitters, the most abundant transition corresponds with the loss of NH3, and thus this transition was selected to determine these compounds (González et al., 2011). As shown in the Fig. 1, the peak area of GABA in the diluted sample was 2 times higher than 1 mg/mL of GABA sample. These results clearly indicate that GABA was highly produced in the reaction using LBP by intracellular glutamic acid decarboxylase.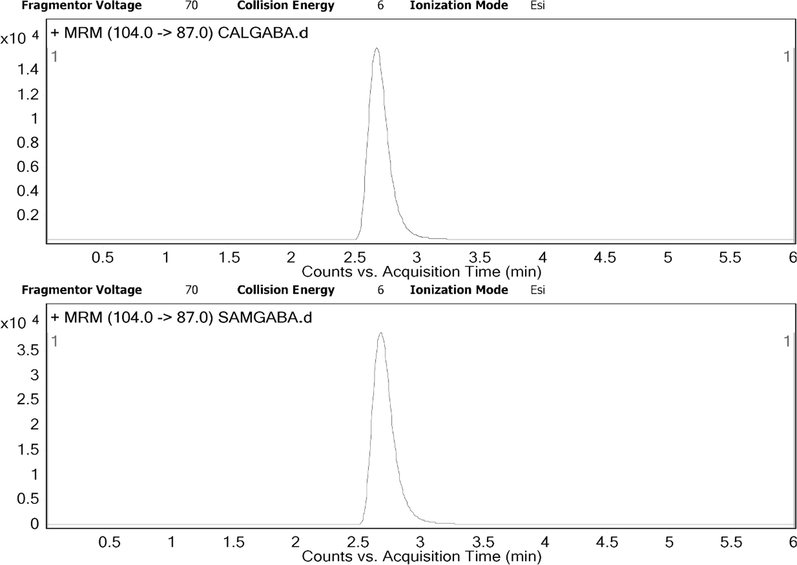
MRM qualitative analysis report of GABA produced by LBP. CALGABA: chromatograms of standard 1 mg/ml of GABA; SAMGABA: chromatograms of GABA from enrichment samples after dilution by 30 times.
3.2 Utilization of reaction conditions for GABA production using LBP
The effect of reaction temperature on GABA production using LBP is shown in Fig. 2A, GABA yield reached a high level at a reaction temperature of 40 ˚C and decreased sharply with increasing temperature. However, at the optimal reaction temperature, 51.31 mmol/L of GABA was produced with the 86.81% conversion rate, while 0.85 mmol/L of MSG remained in the mixture.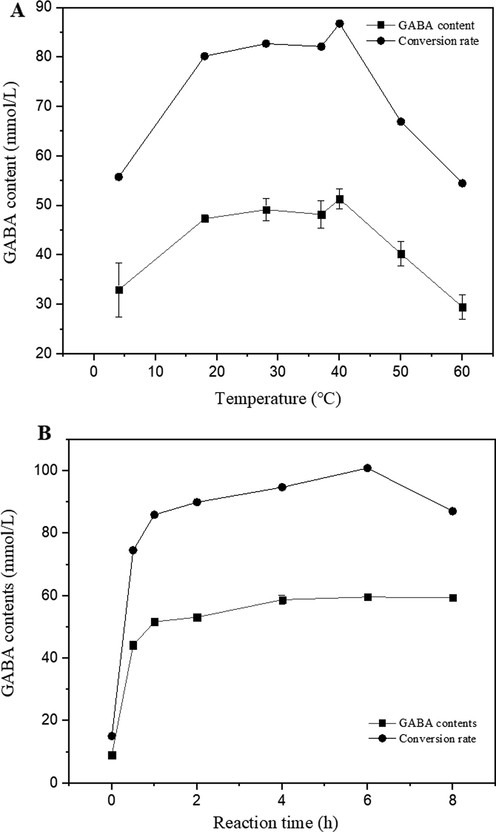
The effect of reaction temperature and reaction time on GABA production using 50 mg/ml of LBP and 59 mM (10 mg/mL) of MSG. Data are means from two independent experiments. All experiments were repeated three times and average values were calculated.
A time course analysis of GABA and MSG concentrations during GABA production using LBP was conducted (Fig. 2B). GABA content increased quickly when time was up to 1 h, then showed a smooth increase from 1 h to 6 h and was optimally produced at 6 h. In the optimal reaction time, 59.65 mmol/L of GABA was produced with a 100% conversion rate. There was decreased obviously after 8 h. The GABA production patterns at the various times suggested that 6 h should be selected as the optimal reaction time using LBP.
The effect of buffer types, concentrations and pH on GABA production using LBP was investigated using the method described by (Eamarjharn et al., 2016). The GABA content increased with incubation pH and reached a maximum (55.08 mmol/L) at pH 5.8 (The substrate was prepared with a phosphate buffer containing 59 mmol/L MSG). Similar results have been reported by Hwang et al. (2007), who stated that the optimum pH of carrot GAD is 5–5.9. This result may be caused by H+ process during the catalytic reaction of GAD.
The different types of buffers at pH 5.8 consisted of citric acid buffer, phosphate buffer, acetic acid buffer, and control. After incubation, the highest and most stable GABA content was found in a reaction mixture using phosphate buffer. Maximal GABA content (59.88 mmol/L) was obtained with 80 mmol/L phosphate buffer. This was possibly due to an increase in the ionic strength of the reaction system. Higher ionic strength might reduce the activity of the enzyme (Stoll and Blanchard, 1990). The result indicated that the optimal buffer concentration for the reaction was 80 mmol/L of phosphate buffer and pH was 5.8 (Fig. 3).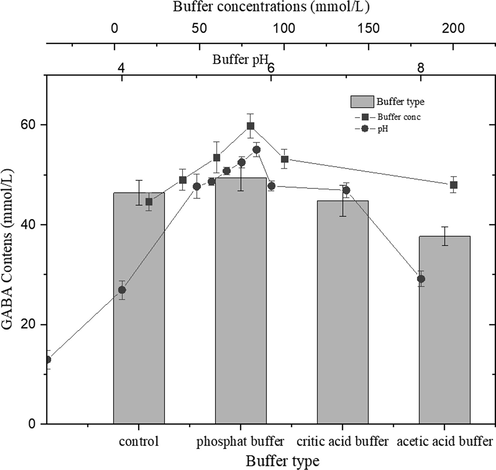
Effect of buffer type, concentration, and pH on GABA production using 50 mg/mL of LBP and 59 mM (10 mg/mL) of MSG at the reaction temperature was 40 °C for 6 h. All experiments were repeated three times and average values were calculated.
The effect of the initial bee pollen addition was investigated by designing various concentrations of bee pollen between 50 and 450 mg/mL in 10 mL reaction mixture (80 mmol/L of pH 5.8 phosphate buffer containing 59 mmol/L MSG), as shown in Fig. 4. After incubation for 6 h at 40 °C, GABA content showed an obvious increase as pollen addition increased from 50 to 250 mg/mL. GABA production decreased when the pollen addition increased to 450 mg/mL. The highest GABA content was also detected using a larger reaction scale. Therefore, 250 mg/mL of LBP was selected as an optimal condition for GABA production.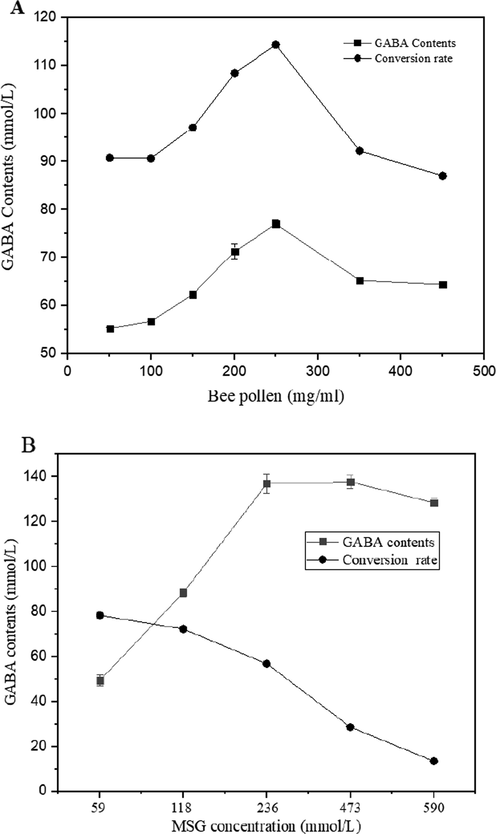
Effect of LBP and MSG concentration on GABA production, (A) effect of LBP concentration, (B) effect of MSG concentration on GABA production using 250 mg/mL of LBP at the optimal temperature, time, buffer condition.
All factors mentioned above suggested that 100% of conversion of MSG into GABA was achievable, but the GABA content was still can be improved through to change pollen and MSG concentration. We observed another peak of GABA content (388.94 mmol/L) as described in Fig. 4, it shown a high level in terms of GABA concentration and conversion rate. Therefore, optimal MSG concentration was selected as 590 mmol/L for GABA production of the optimal condition. Even if the GABA content reached unprecedented level, but the lees conversion rate of 65.9% was forced us to continue our research on the optimization, and the new technology like HHP has given us a sense of hope.
As is shown in the Fig. 5, HHP induced the bioconversion of MSG to GABA, when the pressure was increased to 200 MPa, 457.2 mmol/L of GABA was produced in the HHP treated mixture and determined 403.67 mmol/L in the untreated group. Consequently, higher conversions (77.5%) in the reaction was achieved. This conversion was expected to improve in our next study on optimizing the HHP conditions.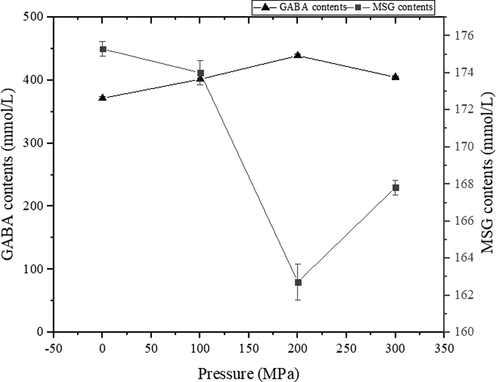
Effect of high hydrostatic pressure (HHP) on GABA production and residual MSG of LBP after incubation at 40 °C for 6 h. Values are mean ± standard deviation (n = 3).
3.3 RSM analysis of high hydrostatic pressure treatment on GABA production
Some single factor experiment was carried out according to three key factors of high hydrostatic pressure treatment as pressure, treated time, temperature (results was not shown). The factors and levels of the Box- Behnken design were performed based on these single factor optimizations. The design scheme and the test results are shown in the Table 2. Analysis of variance (ANOVA) for response surface quadratic model was shown in the Table 3.The regression equation with GABA production as a response value was GABA (mmol/L) = 457.63 + 5.58A − 1.67B − 4.31C − 8.33AB − 0.49AC − 6.31BC − 26.11A2 − 27.33B2 − 27.14C2. The P value of the model was less than 0.01 and the P value of the lack of fit was 0.598 (>0.05), which indicates that the lack of fit was not significant, but the regression was very significant. According to the R2 value, the model can explain the effect of 97.26% of the key factors on the ability of bee pollen to produce GABA, and can be used to determine the optimum conditions. The effect of the first term A of the regression equation on GABA yield reached a significant level (P < 0.01). The order of influence of three factors on GABA yield was: treated time (A) > pressure (B) > temperature (C). Notes:
Run Order
A
B
C
GABA (mmol/L)
MSG (mmol/L)
time
Pressure
Temperature
min
MPa
°C
Predicted
Observed
Predicted
Observed
1
1 (15)
0 (200)
−1 (30)
414.76
417.188 ± 2.43
64.87747
99.74185
2
0 (10)
1(300)
−1
412.11
407.001 ± 5.11
120.7328
101.7921
3
0
0
0 (40)
457.63
451.71 ± 5.93
81.23813
116.1435
4
−1
−1 (100)
0
391.96
389.281 ± 2.67
118.4699
111.3255
5
1
−1
0
419.78
417.994 ± 1.78
32.96087
52.17704
6
0
0
0
457.63
467.41 ± 9.77
81.23813
52.66909
7
0
1
1 (50)
390.87
391.52 ± 0.64
113.921
114.0728
8
−1
0
1
394.97
392.54 ± 2.43
81.23813
97.67115
9
0
−1
−1
402.84
402.19 ± 0.64
108.6443
117.1481
10
1
0
1
405.17
401.85 ± 3.32
115.2793
122.2736
11
0
−1
1
406.84
411.95 ± 5.11
111.8349
122.2736
12
0
0
0
457.63
452.52 ± 5.12
81.23813
107.5326
13
−1
0
−1
402.62
405.94 ± 3.32
37.50977
34.21722
14
1
1
0
399.78
402.45 ± 2.67
81.23813
32.16702
15
−1
1
0
405.26
407.05 ± 1.78
46.40767
30.48585
16
0
0
0
457.63
463.09 ± 5.45
52.78894
37.29254
17
0
0
0
457.63
453.46 ± 4.17
51.43068
32.06451
Source
Sum of Squares
df
Mean Square
F Value
p-value
Significance
Model
11047.4
9
1227.489
27.58083
0.0001
**
A- time
249.4596
1
249.4596
5.605186
0.0498
*
B-Pressure
22.4309
1
22.4309
0.504007
0.5007
C-Temperature
148.4296
1
148.4296
3.335112
0.1106
AB
277.389
1
277.389
6.232741
0.0412
*
AC
0.943812
1
0.943812
0.021207
0.8883
BC
159.2618
1
159.2618
3.578503
0.1004
A2
2871.044
1
2871.044
64.51038
< 0.0001
**
B2
3144.618
1
3144.618
70.65741
< 0.0001
**
C2
3101.787
1
3101.787
69.69503
< 0.0001
**
Residual
311.536
7
44.50514
Lack of Fit
107.5296
3
35.84321
0.702786
0.598
Pure Error
204.0064
4
51.00159
Cor Total
11358.94
16
R2 = 0.9726
R2 adj = 0.9373
The RSM results suggested that the optimum conditions for improving GABA production by bio-conversion of bee pollen with high hydrostatic pressure treatment were: pressure of 200 MPa, time of 10 min and temperature of 40 °C. Under these optimum conditions, the predicted value of GABA was 457.634 mmol/L. Under these optimal conditions, a mean value 508.79 mmol/L (with 86.25% of conversion rate) was obtained from actual experiments, which is obviously higher than predicted value of 457.634 (p < 0.05). The results showed that the response model was adequate for the optimization of GABA production (see Fig. 6).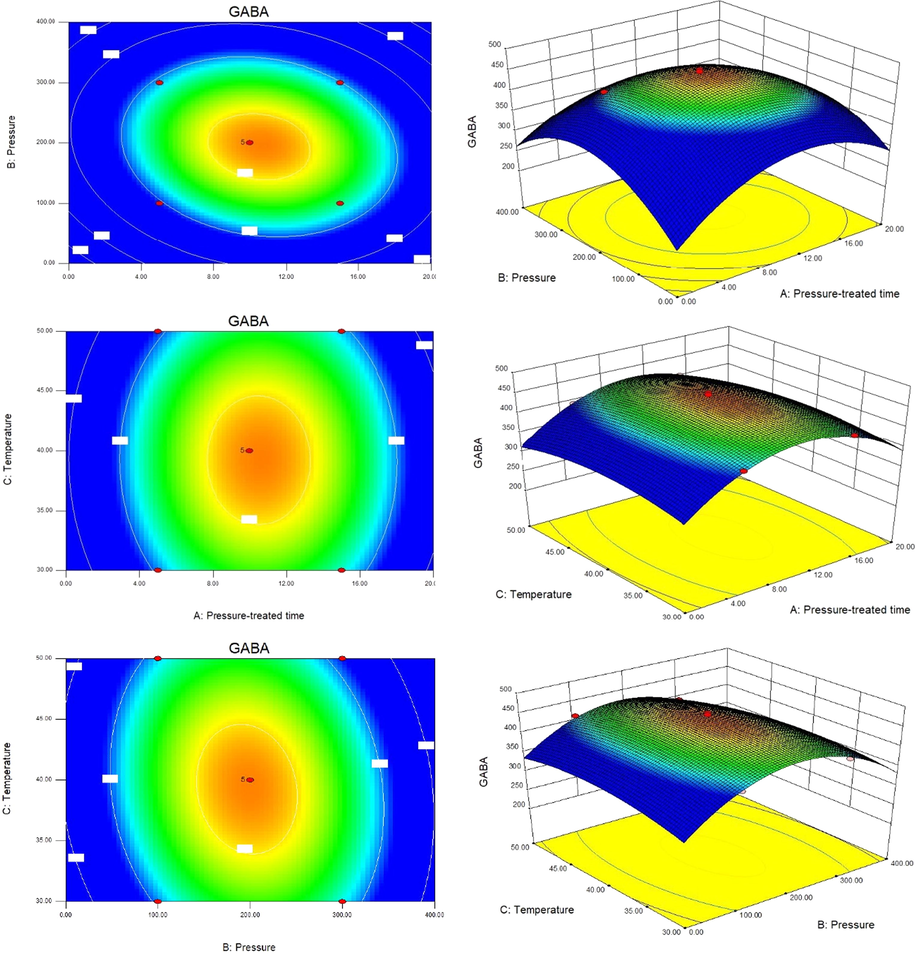
Contour plots and response surface plots showing the effect of pressure, treated time, temperature on GABA yield.
Bee pollen has strong glutamate deactivation activity, which can efficiently and eco-friendly convert sodium glutamate into GABA. Through optimization, the yield of GABA reached an unprecedented high level in both content and conversion compared with the yield of other plant or microbial sources. GABA as a great bioactive component in foods, the development of high level of GABA in lotus bee pollen has been investigated, and the accumulation of GABA by applying HHP has hardly been reported.
4 Conclusion
This study developed a novel and simple method for GABA production using bee pollen as the enzyme source, monosodium glutamate as a substrate. GABA content in different reaction conditions such as temperature, reaction time, initial LBP addition, initial MSG addition, PLP concentration, buffer type, buffer concentration, buffer pH, HHP treatment was determined because of its significant effect on GABA production. However, optimization and RSM indicated the LBP produced high amount of GABA (508.79 mmol/L) when fortified with 590 mmol/L MSG in 80 mmol/L of pH 5.8 phosphate buffer and immediately treated with 200 MPa high pressure for 10 min, in the and incubated at 40 °C for 6 h. Therefore, it may be claimed that high hydrostatic pressure treatment could improve the enzymatic production of GABA although in-depth studies are needed to determine the structural and functional consequences of the treatment for the LBP.
Acknowledgements
This work was financially supported by the earmarked fund for Jiangsu Agricultural Industry Technology System (No JATS-2018-296).
Declaration of Competing Interest
Our method has been registered by the People's Republic of China Intellectual Property Office entitled “A method and its application to produce γ-aminobutyric acid (GABA) by using bee pollen as a natural catalyst” for patent certification (CN 106699584 A).
References
- Anthony, N.M., Harrison, J.B., Sattelle, D.B., 1993. GABA Receptor molecules of insects. Experientia. Supplementum 63(63), 172–209. https://doi.org/ 10.1007/978-3-0348-7265-2_8.
- Distribution of glutamate decarboxylase-like immunoreactivity in the sixth abdominal ganglion of the cockroach Periplaneta americana. Cell Tissue Res.. 1988;253:129-135.
- [CrossRef] [Google Scholar]
- Ornithine and glutamate decarboxylases catalyse an oxidative deamination of their alpha-methyl substrates. Biochem. J. 1999;342(3):509-512.
- [CrossRef] [Google Scholar]
- Gamma-aminobutyric acid as a bioactive compound in foods: a review. J. Funct. Foods. 2014;10:407-420.
- [CrossRef] [Google Scholar]
- Effect of incubation time, buffer type and concentration on gamma-aminobutyric acid (GABA) production using Khao Dawk Mali 105 rice bran. Agric. Nat. Resour.. 2016;50:80-84.
- [CrossRef] [Google Scholar]
- A role for glutamate decarboxylase during tomato ripening: the characterisation of a cDNA encoding a putative glutamate decarboxylase with a calmodulin-binding site. Plant Mol. Biol.. 1995;27:1143-1151.
- [CrossRef] [Google Scholar]
- Development and validation of an ultra-high performance liquid chromatography-tandem mass-spectrometry (UHPLC-MS/MS) method for the simultaneous determination of neurotransmitters in rat brain samples. J. Neurosci. Methods. 2011;198(2):187-194.
- [CrossRef] [Google Scholar]
- Purification and characterization of glutamate decarboxylase from Neurospora crassa conidia. J. Biol. Chem.. 1991;266(8):5135-5139.
- [Google Scholar]
- Time course of changes in pyridoxal 5'-phosphate (vitamin B6 active form) and its neuroprotection in experimental ischemic damage. Exp. Neurol.. 2007;206(1):114-125.
- [CrossRef] [Google Scholar]
- Purification and characterization of glutamate decarboxylase from cowpea. Photochemistry. 1997;46:39-44.
- [Google Scholar]
- Component Analysis, Extraction of Functional Substances and In Vitro Activity of Bee Pollen. Zhejiang University; 2011. (in chinese)
- Buffer-free production of gamma-aminobutyric acid using an engineered glutamate decarboxylase from Escherichia coli. Enzyme Microb. Technol.. 2013;53(3):200-205.
- [CrossRef] [Google Scholar]
- Cloning and nucleotide sequence of the glutamate decarboxylase-encoding gene gadA from Aspergillus oryzae. J. Agric. Chem. Soc. Jpn.. 2002;66(12):2600-2605.
- [CrossRef] [Google Scholar]
- Khwanchai, P., Chinprahast, N., Pichyangkura, R., Chaiwanichsiri, S., 2014. Gamma-aminobutyric acid and glutamic acid contents, and the GAD activity in germinated brown rice (Oryza sativa L.): Effect of rice cultivars. Food Sci. Biotechnol. 23(2), 373-379. https://doi.org/10.1007/s10068-014-0052-1.
- Novel fermented chickpea milk with enhanced level of γ-aminobutyric acid and neuroprotective effect on PC12 cells. PeerJ. 2016;4(4):e2292
- [CrossRef] [Google Scholar]
- Substrate selectivity of the acid-activated glutamate/γ-aminobutyric acid (GABA) antiporter GadC from Escherichia coli. J. Biol. Chem.. 2013;288(21):15148-15153.
- [CrossRef] [Google Scholar]
- Characterization of glutamate decarboxylase mediating gamma-amino butyric acid increase in the early germination stage of soybean (Glycine max [L.] Merr) J. Biosci. Bioeng.. 2009;107(5):538-543.
- [CrossRef] [Google Scholar]
- Overexpression of glutamate decarboxylase in transgenic tobacco plants confers resistance to the northern root-knot nematode. Mol. Breed.. 2003;11(4):277-285.
- [CrossRef] [Google Scholar]
- Dual mechanisms regulating glutamate decarboxylases and accumulation of gamma-aminobutyric acid in tea (Camellia sinensis) leaves exposed to multiple stresses. Sci. Rep.. 2016;6(1):23685.
- [CrossRef] [Google Scholar]
- Impact of high pressure processing on total antioxidant activity, phenolic, ascorbic acid, anthocyanin content and colour of strawberry and blackberry purées. Innovative Food Sci. Emerg. Technol.. 2009;10(3):308-313.
- [CrossRef] [Google Scholar]
- High hydrostatic pressure treatments trigger de novo carotenoid biosynthesis in papaya fruit (Carica papaya cv. Maradol) Food Chem.. 2019;277:362-372.
- [CrossRef] [Google Scholar]
- Generation of free amino acids and γ-aminobutyric acid in water-soaked soybean by high-hydrostatic pressure processing. J. Agric. Food. Chem.. 2010;58(2):1208-1213.
- [CrossRef] [Google Scholar]
- Antihypertensive effect of mulberry leaf aqueous extract containing γ-aminobutyric acid in spontaneously hypertensive rats. Food Chem.. 2012;132(4):1796-1801.
- [CrossRef] [Google Scholar]
- A high-throughput colorimetric assay to measure the activity of glutamate decarboxylase. Enzyme Microb. Technol.. 2011;49(3):272-276.
- [CrossRef] [Google Scholar]
- Biosynthesis of γ-aminobutyric acid by a recombinant Bacillus subtilis strain expressing the glutamate decarboxylase gene derived from Streptococcus salivarius ssp. thermophilus Y2. Process Biochem.. 2014;49(11):1851-1857.
- [CrossRef] [Google Scholar]


