

Translate this page into:
High sensitive assay of formaldehyde using resonance light scattering technique based on carbon dots aggregation
⁎Corresponding authors. guangzhi.hu@umu.se (Guangzhi Hu), yueqiaoli@lcu.edu.cn (Qiaoli Yue)
-
Received: ,
Accepted: ,
This article was originally published by Elsevier and was migrated to Scientific Scholar after the change of Publisher.
Abstract
Formaldehyde (FA) is widely used in industry and also common in daily life. Finding an efficient method to determine FA is quite an industrial challenge. Herein, a novel method based on a resonance light scattering (RLS) technique was developed for the detection of FA with high sensitivity. Carbon dots (CDs) were used as RLS probes. CDs were obtained via one-pot solvothermal treatment from o-phenylenediamine. CDs showed yellow fluorescence with a quantum yield of 0.41. Due to the multiple amino groups on the surface of CDs, FA can be captured easily by formation of a covalent C = N bond based on the Schiff-base reaction. Owing to the covalent crosslinking, CD nanoparticles aggregated, and even formed precipitate. The aggregation of CDs induced RLS enhancement, where the RLS increment was linearly related to the concentration of FA ranging from 4 nM to 1.6 mM, with a limit of detection (LOD) of 1.6 nM. In comparison with many previous reports, the present RLS method showed a wider linear range and lower LOD. Furthermore, the RLS system was successfully used to detect FA in real food samples. The proposed system has prospective applicability in the detection of FA in food fields.
Keywords
Formaldehyde detection
Carbon dots
Schiff-base reaction
Resonance light scattering
Food samples

1 Introduction
Formaldehyde (FA) is a colorless, flammable gas at room temperature and has a strong odor. FA is widely used in the manufacture of composite wood products, building materials, household products, medicines, cosmetics and pesticides. Exposure to FA may cause adverse health effects such as irritation of the skin, eyes, nose and throat. It is reported that the inhalation of air containing FA can lead to severe diseases, even at the ppm level (Luo et al., 2018; Park et al., 2012). There are also some serious health issues for human when they consume food contaminated by FA such as vomiting, pain or coma (Nordin et al., 2011). According to the report of European Union, the minimum daily exposure to FA is 100 mg kg−1 from animal and lant origin food (Zhang et al., 2022a, 2020b), and it is strictly forbidden to use formalin adulteration in China (Aquilina et al., 2014). Therefore, developing a sensitive, selective, and convenient method of detecting FA is urgent.
Various methods of determining FA in gas samples have been reported, including spectrophotometry (Gorrotxategi-Carbajo et al., 2013), electrochemistry (Zhang et al., 2020a, 2020b), chemiluminescence (Song et al., 2009), fluorescence (Liu et al., 2019; Wang et al., 2021), and imaging (Liu et al., 2019) techniques. Various materials have been employed for FA detection, such as ZIF-90-LW (Wen et al., 2020), naphthalimide (Bi et al., 2018), CuO/Cu/TiO2 nanotubes (Zhang et al., 2020a, 2020b), egg white/ZnO (Padmalaya et al., 2022), carbon dots (CDs) (Qu et al., 2020; Lin et al., 2022; Kim et al., 2021; Liu et al., 2021; Li et al., 2023; Zhao et al., 2022; Hu and Gao, 2020), SnSO4/ZnO (Chang et al., 2018), C60-encapsulated TiO2 (Gakhar and Hazra, 2021), ZnSnO3 porous nanostructures (Du et al., 2021), and RGO/HA-HCl (Zhou et al., 2020). However, there are still some limits for these methods such as high cost, high toxic reagent use, as well as the only use in aqueous media or vapor. Therefore, how to achieve high sensitivity to determine FA both in liquids and gases is still challenging.
Schiff-base reactions have played a major role, and still have a significant function in the development of inorganic chemistry (Zaltariov and Cazacu, 2020). The ligands that are most commonly used for Schiff-base reactions are aldehydes or ketones and primary amines, Schiff-base reactions are widely used to form complexes with different architectures, and it has an extensive application (Visuvamithiran et al., 2013). There are a few reports in which Schiff-base reactions are exploited for sensing analytes, such as Schiff-base reaction induced detection of dopamine based on the Pt41Rh59 alloy/ZIF-90 nanocomposite and the FA based on the CD-ND (Chen et al., 2019a, 2019b).
A novel resonance light scattering (RLS) method based on CDs is constructed for the sensitive detection of FA. Due to its high sensitivity, rapidity, and convenience, the RLS technique has attracted much interest in analytical and environmental chemistry (Chen et al., 2017, 2018; Liu et al., 2018; Lu et al., 2006; Luo et al., 2019, 2020, Wang et al., 2017, 2019b; Yang et al., 2017). RLS can be carried out on a common fluorescence spectrometer with inexpensive and safe materials and reagents (Hou et al., 2017; Yang et al., 2017). RLS spectra can be easily obtained by synchronous scanning with the same excitation and emission wavelength. The RLS signal can be enhanced by enlargement of the molecule or particle via assembly of small molecules or particles. Various RLS approaches were constructed for analytes based on increase or decrease of RLS signal.
CDs were obtained by a simple hydrothermal method using 1,2-diaminobenzene (o-phenylenediamine, OPD) as precursor material. CDs can be freely dispersed in aqueous medium without aggregation. Due to abundant amino groups on the surface of CDs, FA can be easily captured by CDs owing to the covalent crosslink via Schiff-base reaction. The covalent crosslink among nanoparticles leaded to the aggregation of CDs and even precipitate immediately. The aggregation of CDs induced the RLS enhancement. The RLS increase was linearly responsive to the concentration of FA, enabling the sensitive and selective sensing of FA (Scheme 1).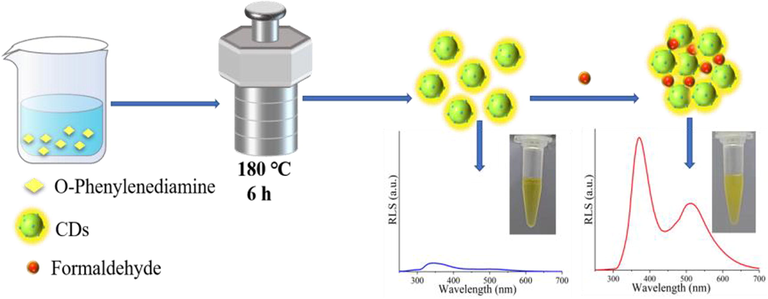
Synthesis of CDs and detection of FA.
2 Materials and methods
2.1 Chemicals and materials
Glyoxal solution (GA) (40 wt% in H2O and H2O2 (HP) (≥30%)) was ordered from Shanghai Perfemiker Material Technology Co., Ltd. FA (36%-38%), ethanol (EtOH) (≥99.8%), methanol (MeOH) (≥99.5%) and acetone (Ace) (≥99.5%) were purchased from Yantai Far Eastern Fine Chemical Co., Ltd. OPD (≥99.5%). Acetaldehyde (AA) (≥40%) was obtained from Tianjin Kermel Reagent Co., Ltd (Tianjin, China). Propionaldehyde (PA) (≥99%) and butyraldehyde (BA) (≥97%) were ordered from Shanghai Macklin Biochemical Co., Ltd. The small shrimps were bought from a supermarket on campus. All chemicals were used without further purification. Deionized (DI) water was used throughout the experiments from Milli-Q water purified system.
2.2 Synthesis of CDs
The yellow-emitting CDs were obtained via a simple hydrothermal treatment and the experimental conditions including mass of precursors, hydrothermal reaction time and temperature were investigated by reference to literatures (Zhao et al., 2019; Vedernikova et al., 2022; Papaioannou et al., 2019, Gao et al., 2021). The reaction time affects the morphology of CDs, no nanometer-sized particles were observed under the reaction time of 6 h. So the reaction time for the synthesis of CDs was 6 h (Papaioannou et al., 2019). Briefly, 0.036 g OPD was introduced into 10 mL deionized water, and then heated in a Teflon-sealed autoclave reactor at 180 °C for 6 h. And then the product solution was filtered with a 0.22 μm filter membrane and dialyzed with dialysis bag (molecular weight cutoff ≈ 500 Da, for 12 h). CDs solution was heated in a vacuum drying oven at 60 °C for 24 h to obtain solid product. Finally, the CDs was stored in a refrigerator at 4 °C for subsequent use.
2.3 Characterization of CDs
The transmission electron microscope (TEM) images were recorded on a JEM 2100 electron microscope. TEM worked with an acceleration voltage of 200 kV, and a copper grid was used for CDs suspension. (JEOL Ltd, Japan). Dynamic light scattering (DLS) data for CDs were acquired using a Zetasizer Nana-ZS System (MPI Ltd, UK). Fourier-transform infrared (FT-IR) spectra were acquired using pressed KBr pelletsa on a Nicolet 6700 spectrometer (Thermo Scientic Ltd, USA). The powder X-ray diffrac- tion (XRD) measurement was performed on a D/Max-2500 Diffractometer with Cu Kα radiation (λ = 0.15406 nm) at 2θ ranging between 5° and 80°. X-ray photoelectron spectroscopy (XPS) measurements were performed with a K-Alpha spectrometer (Thermo Scientic Ltd, USA).
2.4 Detection of FA in aqueous media
CDs (250 μL, 1 mg mL−1) and FA solutions (1 μL) with different concentrations were placed in 1.5 mL centrifuge tubes and allowed to react at room temperature for 18 min. Subsequently, the RLS spectra of the mixture, as well as that of the blank were recorded. To investigate the specificity of the CDs for FA detection, a series of materials with similar structure as FA (AA, PA, BA, GA, HP, MeOH, EtOH, Ace, and Glu) were added to CDs solution and RLS measurements were performed using the same process as that of FA. RLS spectra were acquired using an F-7100 spectrofluorometer (HITACHI, Japan).
2.5 Detection of FA vapor
The process for analyzing FA gas is illustrated in Fig. S1 (in Supporting Information). A bottle containing 250 μL CDs solution in a vial at the bottom was sealed. FA solutions with different concentrations were dropped to the bottle bottom. The bottle was placed into a 50 °C water-bath to accelerate gasification of the FA solution (about 8 min) and the CDs solution was allowed to react completely with FA gas at room temperature for 18 min. Subsequently, the RLS spectra of the mixture solution were recorded.
2.6 Detection of FA in food samples
The standard addition method was used to determine FA, and the recovery was calculated. A small shrimp sample as food samples was triturated and weighed. The shrimp sample (1.5 g) and deionized water (100 mL) were combined in a 250 mL iodine volumetric flask. The mixture sample was treated with ultrasound and centrifugation (10000 rpm) for 20 min and 10 min, respectively. The supernatant of the sample was collected. CDs (1.25 mL), supernatant (0.15 mL), and the standard solutions of FA with different volumes were added to 7.34 mL of deionized water, and diluted to 250 μL. After incubation for 20 min, the RLS spectra were recorded for the mixture solution of CDs and shrimp sample with and without the FA standard solution, respectively.
3 Results and discussion
3.1 Characterization
Fig. 1a, b and Fig. S2 a, b (in Supporting Information) show the TEM images of the CDs before and after the reaction with FA, respectively. CDs were freely dispersed in the aqueous medium without aggregation (Fig. 1a, Fig. S2 a, b). The morphology of the CDs is almost spherical, with a average particle size of 3.5 ± 0.4 nm ranging from 2.9 to 4.1 nm. The HR-TEM image exhibited CDs with a lattice parameter of 0.26 nm. When FA (0.4 μM) was added to the CDs solution, the particle size of the CDs clearly increased, with medial diameter of 25 nm (Fig. 1b). DLS data for the CDs in the presence and absence of FA also confirm aggregation of the CDs with FA (Fig. 1c). Fig. 2c, the hydration diameter of the CDs was determined as ∼30 nm, while the hydrodynamic size of the CDs was about 230, 478, and 1002 nm in the presence of 4, 40, and 400 μM FA, respectively. It is deduced that FA can induce aggregation of the CDs, where aggregation becomes more extensive with increasing FA concentration. The FT-IR spectra of the CDs and CDs + FA have two absorption bands at 3423 cm−1 and 1598 cm−1 (Fig. 1d), associated with N–H and C = O stretching vibrations, respectively (Zhao et al., 2019). The spectrum of CDs only showes a tiny band at 1505 cm−1, whereas that of the CDs + FA has a distinct sharp peak owing to C = N stretching vibrations (Wu et al., 2018). It is obvious that FA can be easily captured by CDs owing to the covalent crosslink. XRD patterns of CDs (Fig. S3, in Supporting Information) shows a broad diffraction peak (0 0 2) at 2θ = 24.5°, which is consistent with the graphitic structure (Hu et al., 2020). XPS was used to study the chemical bonds and chemical compounds on the surface of the CDs and CDs + FA. The XPS profile of the CDs (upper part, Fig. 2a) shows three typical peaks at 284.75, 399.18, and 532.11 eV, corresponding to C 1 s, N 1 s, and O 1 s, respectively (An et al., 2021; Hu et al., 2020; Dai and Hu, 2022). The XPS profile of the CDs + FA (lower part) shows three main peaks at 284.91, 399.25, and 532.16 eV, which are assigned to C 1 s, N 1 s, and O 1 s, respectively (An et al., 2021; Hu et al., 2020). The XPS data indicate that the CDs and CDs + FA comprise the same elements. The C 1 s spectrum of the CDs (Fig. 2b) shows two peaks at 284 and 285 eV, corresponding to C–C/C = C and C-N/C-O, respectively (Yuan et al., 2021; Hu et al., 2020; Wang et al., 2019a). The O 1 s spectrum of the CDs (Fig. 2c, upper part) shows two peaks at 531.8 and 532.3 eV, derived from C = O and C-O-C (Dong et al., 2022; Zhao et al., 2019), respectively. The N 1 s spectrum of the CDs (Fig. 2d upper part) shows three peaks at 398.7, 399.2, and 400.4 eV, which results from pyrrolic N, pyridinic N, and N–H, respectively (Dong et al., 2022; Li et al., 2022). The C 1 s spectrum of the CDs + FA (Fig. 2b, lower part) shows three peaks at 284.1, 285, and 286.5 eV, owing to C–C/C = C, C-N/C-O, and C = N, respectively (Hu et al., 2020; Wu et al., 2018; Wang et al., 2019a, 2019b). The O 1 s XPS spectrum of the CDs + FA (Fig. 2c, lower part) shows two peaks at 531.8 and 532.3 eV, attributed to C = O and C-O-C (Dong et al., 2022; Zhao et al., 2019), respectively. The N 1 s spectrum of the CDs + FA (Fig. 2d, lower part) shows three peaks at 398.8, 399.2, and 399.7 eV, which are attributed to pyrrolic N, pyridinic N, and N–H, respectively (Dong et al., 2022; Li et al., 2022; Hu et al., 2021). Comparison of the XPS profiles of the CDs and CDs + FA shows a significant difference in the C 1 s spectra (Fig. 2b). In the C 1 s XPS spectrum of the CDs + FA, a new peak appeared at 286.5 eV. This new peak is ascribed to the formation of the C = N group via the Schiff-base reaction between CDs and FA. Therefore, FA can be easily captured by the CDs via covalent crosslinking of the aldehyde and amino groups of FA and the CDs to form covalent bonds.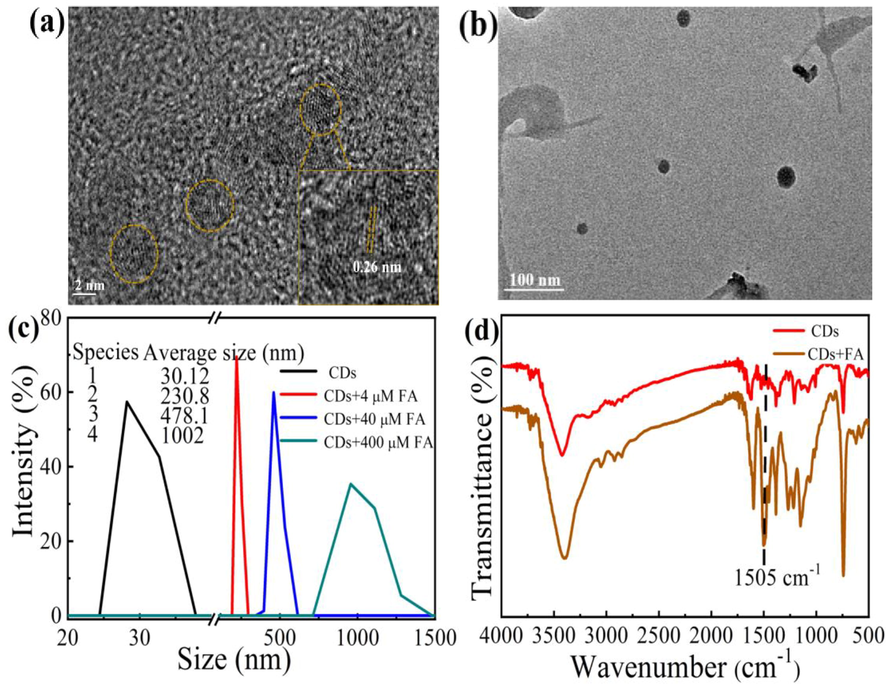
TEM images of CDs (a), CDs + FA (b), dynamic light scattering (DLS) (c) and FT-IR spectrum (d) of CDs and CDs + FA.
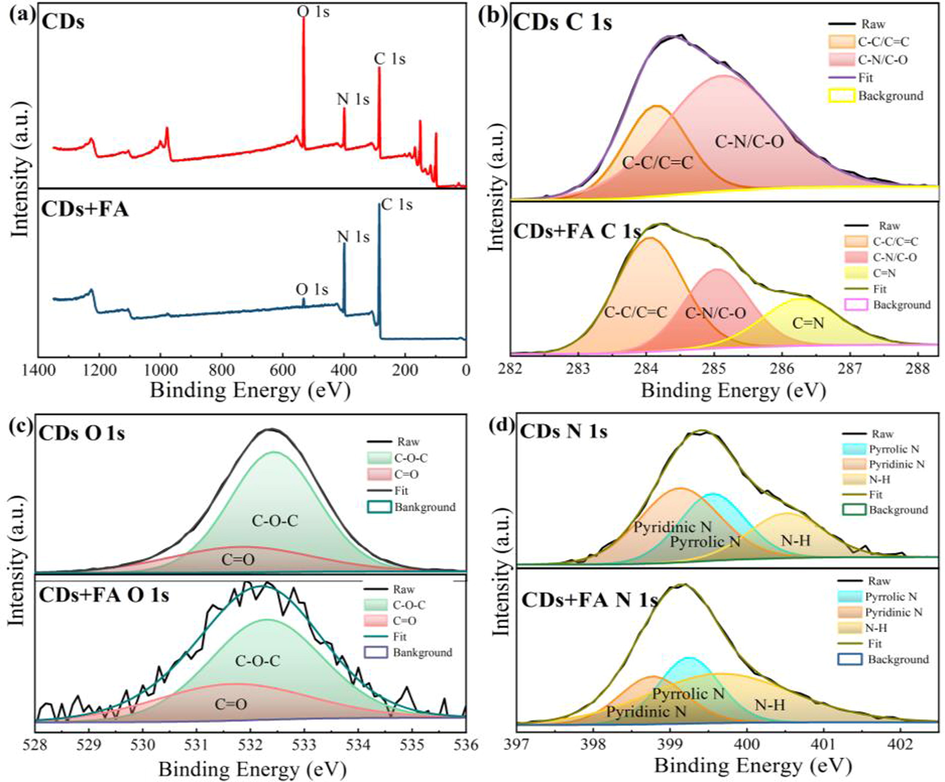
XPS survey profile (a), C 1 s spectrum (b), O 1 s spectrum (c), and N 1 s spectrum (d) of the CDs (upper panels) and CDs + FA (lower panels).
3.2 Optical properties of CDs
Fig. 3 shows the optical properties of the CDs. The absorption bands at 232 nm and 285 nm in the spectra of the CDs and CDs + FA (Fig. 3a) are attributed to the π–π* transition of the C = C bond, and the absorption peak at 420 nm is attributed to the n–π* transition of C = N. The absorption band at 420 nm was absent in the spectrum of FA. When FA was added to the CDs solution, the absorption peak of the CDs clearly decreased (inset of Fig. 3a) due to the formation of precipitates of CDs in the reaction of CDs and FA. Fig. 3b shows the excitation/emission peaks of the CDs at 419/567 nm. When the excitation wavelength was changed from 390 nm to 450 nm (Fig. 3c), the emission peak at 567 nm showed excitation-independent fluorescence characteristics. With Rhodamine B (RhB) as the reference, the quantum yield (QY) of the CDs was measured (Fig. 3d). The QY of the CDs was ∼0.41.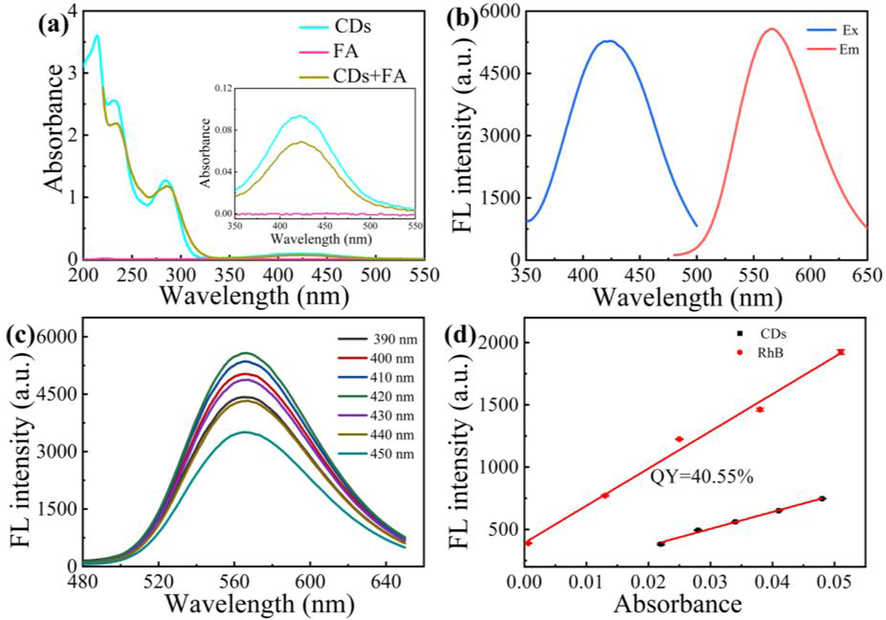
Absorption spectra of CDs, FA, and CDs + FA (a); excitation and emission spectra of CDs (b); effect of excitation wavelength on the emission spectra of CDs (c); QY for CDs with Rh B as reference (d).
3.3 Detection of FA
3.3.1 Detection of FA in aqueous media
First, the stability of CDs was studied. As shown in Fig. S4a (in Supporting Information), the CDs of RLS intensity changes in the pH range of 2–12, but it can be seen that the CDs of RLS intensity remains basically stable in the range of 5–9. Different concentrations of NaCl solutions were used to study the effect of ionic strength (Fig. S4b, in Supporting Information). CDs have no distinct RLS changes in NaCl solutions (0–100 mM). In addition, the RLS of CDs is basically stable for seven days (Fig. S4c, in Supporting Information).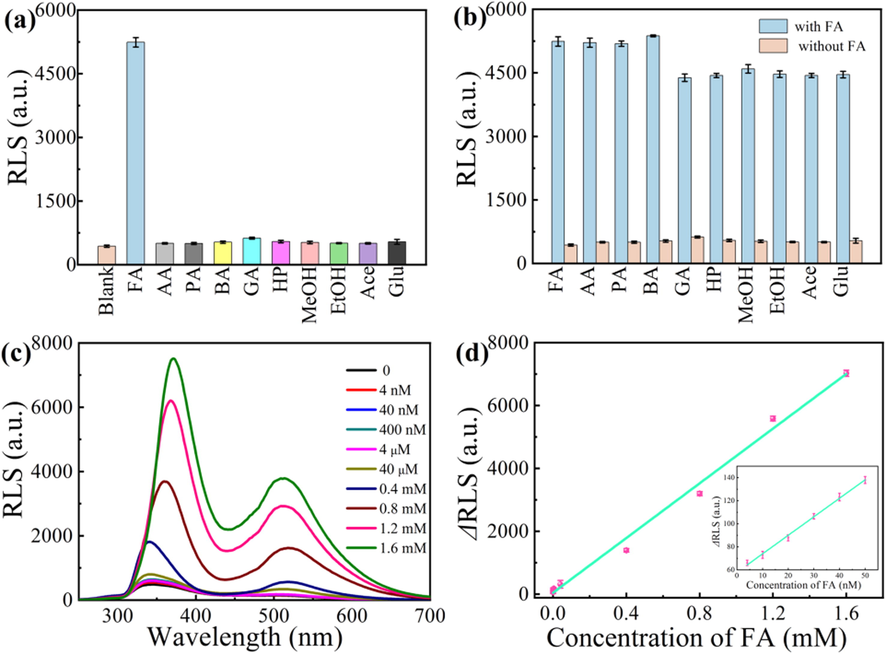
RLS intensity at ∼346 nm with and without different molecules (a), and effect of various other molecules on the response of CDs to FA (b), RLS spectra of CDs in the presence of FA with different concentrations (c), and corresponding linear relationship between ΔRLS and concentration of FA (the inset shows the relationship at low FA concentration) (d) (the concentration of FA, AA, PA, BA, GA, HP, MeOH, EtOH, Ace, MeOH, EtOH, Ace, and Glu is 1.2 mM).
Second, the precursor of CDs and other CDs were tested for the detection of FA. When FA solutions with different concentrations (4 nM–1.6 mM) were added to OPA solution, the RLS signal has a neglectable increase (Fig. S5a, in Supporting Information). Nitrogen-doped CDs (N-CDs)are usually amino-rich CDs, are these CDs all suitable to detect FA by RLS through Schiff-base reaction?The N–CDs were obtained using the previous method (Arkin et al., 2021). When FA solutions (4 nM–400 μM) were added to the N-CDs solution, the RLS signal of the N-CDs has not distinct change (Fig. S5b and c, in Supporting Information). Thus, our CDs rather than the precursor and the N-CDs can be used for detecting FA.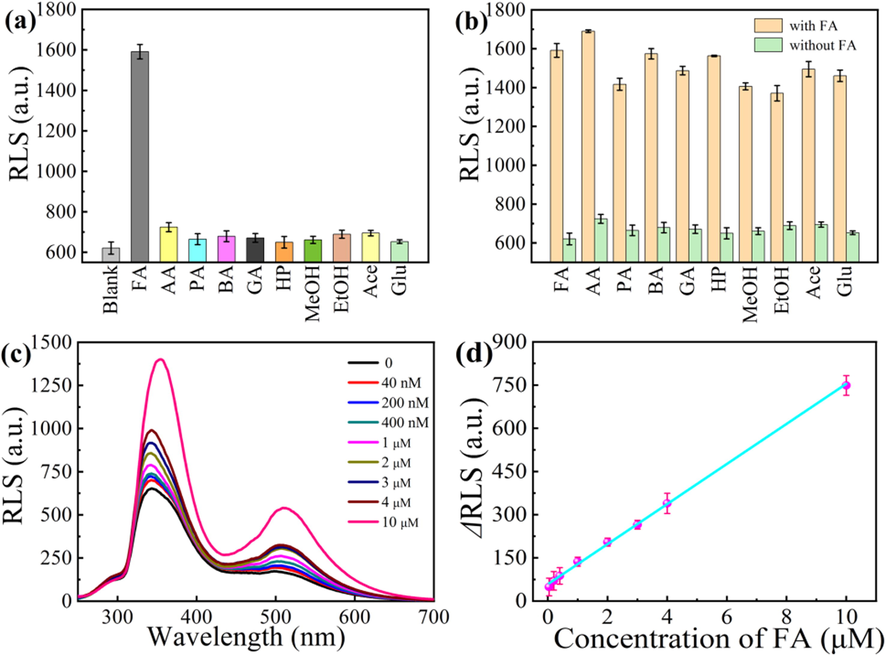
RLS intensity at ∼346 nm with and without various gas molecules (a), and effect of various other molecules on the response of CDs to FA gas at room temperature (b). RLS spectra of CDs in the presence of FA gas with different concentrations (c), and corresponding linear relationship between ΔRLS and the concentration of FA gas (d) (the concentration of FA, AA, PA, BA, GA, HP, MeOH, EtOH, Ace and Glu is 10 μM).
Third, the selectivity of the present CDs system for FA detection was investigated. Common organic molecules with similar structure as FA were studied. They included AA, PA, BA, GA, HP, MeOH, EtOH, Ace and Glu. The RLS intensity for the CDs with all these species is shown in Fig. 4a and b. Clearly, these molecules have no obvious influence on the RLS intensity of CDs.
Forth, the reaction time between CDs and FA was optimized (Fig. S5d in Supporting Information). The RLS intensity was recorded after mixing CDs and FA for different time. The RLS intensity of CDs + FA increases with reaction time, and gets to a platform after 18 min. Thus, the interaction of CDs and FA can finish within 18 min.
Finally, the sensitivity of the CDs system for FA detection was studied. When FA solution (4 nM–1.6 mM) was added to CDs solution, the RLS signal of the CDs was distinctly enhanced (Fig. 4c). As shown in Fig. 4d, the RLS intensity of the CDs at ∼346 nm increased with the FA concentration in the range of 4 nM-1.6 mM. The increment of RLS intensity (ΔRLS) exhibits a linear relationship to the FA concentration with the linear regression equation: ΔRLS = 4351.24[FA] + 46.28 (R2 = 0.992). ΔRLS and [FA] represent the RLS increment of CDs with FA, and the FA concentration, respectively. In the range of 4–50 nM, the RLS signal of CDs also was enhanced (Fig. S6, in Supporting Information) and the linearity is better (R2 = 0.996) (inset of Fig. 4D). The limit of detection (LOD) is 1.6 nM, which is estimated using equation of 3SB/m (Hou et al., 2020).
The results from the proposed and the previous methods for FA detection are listed in Table S1 (in Supporting Information). The present method has a wider linear range and a lower LOD than most of the other methods.
3.3.2 Detection of FA vapor
FA vapor was detected using a lab-made device (Fig. S1, in Supporting Information). The small molecules were volatilized into gases at a concentration of 10 μM (within 8 min) (Gu et al., 2020). The concentration of FA vapor can be determined by applying the Eq. (1).
In Eq. (1), C is the concentration of FA (ppm), ρ is the density of liquid FA (g mL−1), T is the temperature where the test is performed (K), Vs is the volume of liquid FA (μL), M is the molecular weight (g mol−1), and V is the volume of the device (L).
The specificity for FA is tested using the molecules with similar structure of AA, PA, BA, GA, HP, MeOH, EtOH, Ace and Glu as interferences (Fig. 5a and b). It is obvious that the CDs have high selectivity for the detection of FA vapor.
FA in vapor samples with different concentrations (0.04–10 μM) was detected (Fig. 5c). The RLS intensity at ∼346 nm of CDs increases with the concentration of FA vapor and the corresponding relationship is linear in the range of 0.04–10 μM (ΔRLS = 69.58 [FA] (μM) + 58.48, R2 = 0.996) (Fig. 5d). The LOD was 32.33 nM using the equation 3SB/m. The present method is compared with previous reports for the detection of FA vapor (Table S2), indicating that the present RLS method owns a wider linear range and lower LOD.
3.4 Applications
FA is widely used as a preservative in food. If people eats food contaminated FA for a long time, even though can cause numerous diseases (Zhang et al., 2022a, 2022b). Therefore, it is necessary to determine FA in food samples.
The developed method is expected to be useful for practical analysis in real samples. Herein, shrimp samples were used as real samples. After appropriate preprocessing, FA in small shrimp samples was determined (Table 1). The recovery is ranging from 99.5 to 105.8%, with a relative standard deviation (RSD) of less than 6.7%. The concentration of FA in real sample of shrimp is 1.2 μM. By calculation, the content of FA is 2.72 μg·g−1 in shrimp.
Sample
Spiked (μg·g−1)
Found (μg·g−1)
Spectrophotometry (μg·g−1)
Recovery (%) (n = 3)
RSD (%)
Shrimp
0
2.45
2.72
---
5.5
5.3
8
8.27
104.1%
6.7
21.3
23.67
24.27
99.5%
2.5
26.7
30.67
29.6
105.8%
4.3
3.5 Possible mechanism
As shown in Fig. 2d and 3b, there are numerous amino groups on the surface of CDs. Owing to covalent crosslinking via the Schiff-base reaction (Ge et al., 2020), FA reacts with the amino groups on the surface of the CDs to form C = N bonds (Fig. 2e and 3b). Formation of the C = N bond reduces the solubility of CDs products in aqueous medium. Therefore, the nanoparticles of CDs can aggregate in the presence of FA, and even instantly form precipitates (Chen et al., 2019c). These precipitates bring about the enhancement of the RLS signal. The enhancement of RLS signal is linearly responsive to the concentration of FA. Thus, a sensitive and selective RLS method was developed for sensing FA.
4 Conclusions
In summary, a RLS method was developed for the simultaneous detection of FA in aqueous and vapor medium. The RLS technique not only has high sensitivity, but also offers high selectivity, aiding the study of molecules and nanomaterials assembly. CDs were used as RLS probes for FA capture. CDs exhibit yellow fluorescence, with a medium QY of ∼0.41. The optical features, morphology, and surface groups of the CDs were examined. The surface of CDs is rich in amino groups, derived mainly from OPD. In the presence of FA, CDs undergo obvious aggregation due to the covalent crosslinking of FA via the Schiff-base reaction, thereby inducing RLS signal enhancement. The increase in the RLS intensity exhibits a sensitive, selective, and linear response to FA. The proposed CDs system was used to assay FA in shrimp samples. This study highlights the possibility of extending CDs to the capture of FA in food field.
Acknowledgments
This work was supported financially by Natural Science Foundation of Shandong Province (ZR2022MB052), Graduate Education Quality Improvement Plan of Shandong Province (SDYJG21198), and the College Students' Innovation and Entrepreneurship Training Program (CXCY2022206) and research foundation of Liaocheng University (318050022 and 318012116).
Declaration of Competing Interest
The authors declare that they have no known competing financial interests or personal relationships that could have appeared to influence the work reported in this paper.
References
- Red, green, and blue light-emitting carbon dots prepared from o-phenylenediamine. RSC Adv.. 2021;43:26915-26919.
- [Google Scholar]
- Scientific Opinion on the safety and efficacy of formaldehyde for all animal species based on a dossier submitted by Regal BV. EFSA J.. 2014;12:3561-3587.
- [Google Scholar]
- Polychromatic Carbon Dots Prepared from m-Phenylenediamine and Urea as Multifunctional Fluorescent Probes. ACS Appl. Nano Mater.. 2021;4:8500-8510.
- [Google Scholar]
- A novel naphthalimide-based probe for ultrafast, highly selective and sensitive detection of formaldehyde. Sens. Actuators B Chem. 2018;255:3292-3297.
- [Google Scholar]
- SnSO4 modified ZnO nanostructure for highly sensitive and selective formaldehyde detection. Sens. Actuators B Chem. 2018;255:1153-1159.
- [Google Scholar]
- Organic core-shell-shaped micro/nanoparticles from twisted macrocycles in Schiff base reaction. Chem. Sci.. 2019;10:490-496.
- [Google Scholar]
- Schiff-base reaction induced selective sensing of trace dopamine based on a Pt41Rh59 alloy/ZIF-90 nanocomposite. Nanotechnology. 2019;30:335708-335715.
- [Google Scholar]
- A ratiometric fluorescent nanoprobe based on naphthalimide derivative-functionalized carbon dots for imaging lysosomal formaldehyde in HeLa cells. Nanoscale. 2019;11:6377-6383.
- [Google Scholar]
- Reduced graphene oxide as a resonance light-scattering probe for thrombin detection using dual-aptamer-based dsDNA. Anal. Chim. Acta. 2017;985:141-147.
- [Google Scholar]
- Simply and sensitively simultaneous detection hepatocellular carcinoma markers AFP and miRNA-122 by a label-free resonance light scattering sensor. Talanta. 2018;15:473-480.
- [Google Scholar]
- Green/red dual emissive carbon dots for ratiometric fluorescence detection of acid red 18 in food. Sens. Actuators B Chem. 2022;370:132420-132426.
- [Google Scholar]
- Preparation of yellow emissive nitrogen-doped carbon dots from o-phenylenediamine and their application in curcumin sensing. New J. Chem.. 2022;20:9543-9549.
- [Google Scholar]
- Biotemplates based preparation of hierarchical ZnSnO3 porous nanostructures for fast detection of formaldehyde. Ceram. Int.. 2021;47:13139-13146.
- [Google Scholar]
- C60-encapsulated TiO2 nanoparticles for selective and ultrahigh sensitive detection of formaldehyde. Nanotechnology. 2021;32:505505
- [Google Scholar]
- From coconut petiole residues to fluorescent carbon dots via a green hydrothermal method for Fe3+ detection. Cellul.. 2021;28:1647-1661.
- [Google Scholar]
- An aldimine condensation reaction based fluorescence enhancement probe for detection of gaseous formaldehyde. Microchem. J.. 2020;156:104793-104799.
- [Google Scholar]
- Optical-feedback cavity-enhanced absorption spectroscopy with a quantum-cascade laser yields the lowest formaldehyde detection limit. Appl. Phy. B. 2013;110:309-314.
- [Google Scholar]
- Water-stable lanthanide-based metal–organic gel for the detection of organic amines and white-light emission. J. Mater. Chem. C. 2020;8:13648-13654.
- [Google Scholar]
- A reusable aptasensor of thrombin based on DNA machine employing resonance light scattering technique. Biosens. Bioelectron.. 2017;92:259-265.
- [Google Scholar]
- One-step synthesis of mitochondrion-targeted fluorescent carbon dots and fluorescence detection of silver ions. Anal. Methods. 2020;12:2835-2840.
- [Google Scholar]
- Sewage sludge in microwave oven: A sustainable synthetic approach toward carbon dots for fluorescent sensing of para-Nitrophenol. J. Haz. Mat.. 2020;382:121048-121055.
- [Google Scholar]
- Fluorescence and photocatalytic activity of metal-free nitrogen-doped carbon quantum dots with varying nitrogen contents. Appl. Surf. Sci.. 2020;531:147344.
- [Google Scholar]
- Fluorescence detection of malachite green in fish tissue using red emissive Se, N, Cl-doped carbon dots. Food Chem.. 2021;335:127677-127683.
- [Google Scholar]
- Modulating charge carriers in carbon dots toward efficient solar-to-energy conversion, Carbon. Energy. 2021;3:590-614.
- [Google Scholar]
- Lignin derived multicolor carbon dots for visual detection of formaldehyde. Ind. Crop. Prod.. 2023;192:116006-116017.
- [Google Scholar]
- Formation and fluorescent mechanism of red emissive carbon dots from o-phenylenediamine and catechol system. Light: Sci. Appl.. 2022;11:298.
- [Google Scholar]
- Quantum Dot Assisted Precise and Sensitive Fluorescence-Based Formaldehyde Detection in Food Samples. Spectrochim. Acta A: Mol. Biomol. Spectrosc.. 2022;283:121729-121737.
- [Google Scholar]
- Lysosome-targeted carbon dots for ratiometric imaging of formaldehyde in living cells. Nanoscale. 2019;11:8458-8463.
- [Google Scholar]
- Ultrasensitive detection of thrombin based on MoS2-aptamer biosensors by resonance light scattering technique. Sens. Actuators B Chem.. 2018;258:402-407.
- [Google Scholar]
- A review of carbon dots and their composite materials for electrochemical energy technologies. Carbon Energy. 2021;3:795-826.
- [Google Scholar]
- Resonance light scattering and derived techniques in analytical chemistry: past, present, and future. Microchim. Acta. 2006;158:29-58.
- [Google Scholar]
- Three-dimensional nitrogen-doped porous carbon anchored CeO2 quantum dots as an efficient catalyst for formaldehyde oxidation. J. Mater. Chem. A. 2018;6:7897-7902.
- [Google Scholar]
- Fast and sensitive detection of Japanese encephalitis virus based on a magnetic molecular imprinted polymer–resonance light scattering sensor. Talanta. 2019;202:21-27.
- [Google Scholar]
- Molecular imprinting resonance light scattering nanoprobes based on pH-responsive metal-organic framework for determination of hepatitis A virus. Microchim. Acta. 2020;140:140-148.
- [Google Scholar]
- Formaldehyde content and quality characteristics of selected fish and seafood from wet markets. Food Res. J.. 2011;18:125-136.
- [Google Scholar]
- A disposable modified screen-printed electrode using egg white/ZnO rice structured composite as practical tool electrochemical sensor for formaldehyde detection and its comparative electrochemical study with Chitosan/ZnO nanocomposite. Chemosphere. 2022;288:132560-132569.
- [Google Scholar]
- Investigating the Effect of Reaction Time on Carbon Dot Formation, Structure, and Optical Properties. ACS Omega. 2019;26:21658-21665.
- [Google Scholar]
- N, P-co-doped carbon dots as a dual-mode colorimetric/ratiometric fluorescent sensor for formaldehyde and cell imaging via an aminal reaction-induced aggregation process. Microchim. Acta. 2020;187:355-365.
- [Google Scholar]
- A Sequential Injection Method Coupled with Chemiluminescence Detection for the Determination of Formaldehyde in Air. Chinese phys. C. 2009;30:467-472.
- [Google Scholar]
- Dual-Purpose Sensing Nanoprobe Based on Carbon Dots from o-Phenylenediamine: pH and Solvent Polarity Measurement. Nanomaterials. 2022;12:3314-3328.
- [Google Scholar]
- Selective epoxidation of olefins over Co(II)-Schiff base immobilised on KIT-6. Appl. Catal. A. 2013;462:31-38.
- [Google Scholar]
- Highly Fluorescent Green Carbon Dots as a Fluorescent Probe for Detecting Mineral Water pH. Sensors. 2019;19:3801-3811.
- [Google Scholar]
- Hydrothermal synthesis of nitrogen-doped carbon quantum dots from lignin for formaldehyde determination. RSC Adv.. 2021;11:29178-29185.
- [Google Scholar]
- Determination of thorium (IV) using isophthalaldehyde-tetrapyrrole as probe by resonance light scattering, second-order scattering and frequency-doubling scattering spectra. Spectrochim. Acta A. 2017;187:104-109.
- [Google Scholar]
- Ultrasensitive graphene quantum dots-based catalytic hairpin assembly amplification resonance light scattering assay for p53 mutant DNA detection. Sens. Actuators B Chem. 2019;15:42-47.
- [Google Scholar]
- The selective and sensitive detection of formaldehyde by ZIF-90-LWvia aza-Cope rearrangement. Anal. Methods. 2020;12:3748-3755.
- [Google Scholar]
- A double fluorescent nanoprobe based on phosphorus/nitrogen co-doped carbon dots for detecting dichromate ions and dopamine. RSC Adv.. 2018;8:31793-31802.
- [Google Scholar]
- A virus resonance light scattering sensor based on mussel-inspired molecularly imprinted polymers for high sensitive and high selective detection of Hepatitis A Virus. Biosen. Bioelectron.. 2017;87:679-685.
- [Google Scholar]
- Dual-signal uric acid sensing based on carbon quantum dots and o-phenylenediamine. Spectrochim. Acta A Mol. Biomol. Spectrosc.. 2021;254:119678.
- [Google Scholar]
- Coordination compounds with siloxane/silane-containing ligands capable of self-assembly at nano/micro scale in solid state and in solution. Nan. Coord. Chem. 2020;8:155-196.
- [Google Scholar]
- Fabrication of CuO/Cu/TiO2 nanotube arrays modified electrode for detection of formaldehyde. J. Alloy. Compd.. 2020;829:154568-154577.
- [Google Scholar]
- Practical and Efficient: A Pocket-Sized Device Enabling Detection of Formaldehyde Adulteration in Vegetables. ACS Omega. 2022;7:160-167.
- [Google Scholar]
- UV-activated formaldehyde sensing properties of hollow TiO2@SnO2 heterojunctions at room temperature. Sens. Actuators B Chem. 2020;319:128264
- [Google Scholar]
- Seasonal and diurnal patterns of outdoor formaldehyde and impacts on indoor environments and health. Environ. Res.. 2022;205:112550-112558.
- [Google Scholar]
- Preparation of N-doped yellow carbon dots and N,P co-doped red carbon dots for bioimaging and photodynamic therapy of tumors. New J. Chem.. 2019;43:6332-6342.
- [Google Scholar]
- Narrow-bandwidth emissive carbon dots: A rising star in the fluorescent material family. Carbon Energy. 2022;4:88-114.
- [Google Scholar]
- Oximation reaction induced reduced graphene oxide gas sensor for formaldehyde detection. J. Saudi Chem. Soc.. 2020;24:364-373.
- [Google Scholar]
Appendix A
Supplementary data
Supplementary data to this article can be found online at https://doi.org/10.1016/j.arabjc.2023.104786.
Appendix A
Supplementary data
The following are the Supplementary data to this article:Supplementary data 1
Supplementary data 1


