

Translate this page into:
Highly sensitive perylene tetra-(alkoxycarbonyl) based colorimetric and ratiometric probes for fluorine detection
⁎Corresponding authors. mlosh@sdjzu.edu.cn (Yongshan Ma), zhangfengxia19@sdjzu.edu.cn (Fengxia Zhang), xusisi20@sdjzu.edu.cn (Sisi Xu)
-
Received: ,
Accepted: ,
This article was originally published by Elsevier and was migrated to Scientific Scholar after the change of Publisher.
Peer review under responsibility of King Saud University.
Abstract
Fluoride anion (F−) affects environmental, biological, and chemical processes significantly. Therefore, its detection has received increasing attention, and sensitive, effective, and convenient probes for F− detection need to be developed urgently. In this work, two perylene tetra-(alkoxycarbonyl) (PTAC) based colorimetric and ratiometric probes, P1 and P2, were developed for the detection of F−. The interactions between F− and these two probes were investigated by absorption, electrochemistry, 1H NMR, and density functional methods. Both the two probes were complexed with F− with a ratio of 1:1. The detection limits of P1 and P2 were 0.22 μM and 0.87 μM, respectively. It was worth noting that the absorption peak of P1 showed a 190 nm red shift when sensing F−, and P1 is the largest red shift value reported in F− probes based on PTAC derivatives. This phenomenon was resulted from the unique configuration and deprotonation of P1 that can promote the intramolecular charge transfer (ICT). This strategy provides an example for the development of other ion probes based on D-A type ICT mechanism.
Keywords
Perylene tetra-(alkoxycarbonyl) derivative
Colorimetric and ratiometric probe
Absorption spectrum
Fluoride ion

1 Introduction
The sensing and recognition of biologically important anion species have become a hot topic due to the critical roles of such anions in chemical and biological processes (Tao et al., 2014; Wang et al., 2020; Gale and Caltagirone, 2018). Among them, fluorine ion (F−) has attracted particular attention because of its importance to human body (Anand et al., 2015; Chen et al., 2012). Excessive amounts of F− would lead to fluorosis; urolithiasis, nephrotoxic changes, osteoporosis, and even cancer (Arundhati et al., 2015; Zhang et al., 2013; Satheshkumar et al., 2014; Yang et al., 2015). The Environmental Protection Agency (EPA, USA) recommends a maximum level of 2 ppm F− in drinking water (Baruah et al., 2015). Therefore, the detection of F− has attracted extensive attention, and great efforts have been devoted to develop F− probes with good sensitivity, high selectivity, and fast response (Yin et al., 2019; Roy et al., 2014; Khanmohammadi and Rezaeian, 2014; Satheshkumar et al., 2014). The molecular engineering strategies of F− probes are limited by their specific chemical properties; including high charge density, small ionic radius, and hard Lewis basic nature (Manivannan et al., 2013). To date, probes for the detection of F− based on various sensing mechanisms, including the F–H bonding interaction, B–F complexion and F− induced chemical reaction have been reported (Tao et al., 2019; Liu et al., 2016). In addition, different working models were established based on UV–vis absorption, color change, fluorescence emission or electrochemical properties (Zhang et al., 2016; Baek et al., 2019; Ravichandiran et al., 2019; Ravichandiran et al., 2021; Ravichandiran et al., 2021; Chen et al., 2012).
In recent years, F− probes based on the perylene diimide derivatives (PDIs) have been successfully developed due to their excellent chemical, thermal, weather, and photo stability (Dibakar et al., 2013; Wang et al., 2014; Li et al., 2015; Wang et al., 2018; Kim et al., 2015). However, the poor solubilities of many PDIs limit their application (Lakshmi and Ojha, 2014; Gupta et al., 2015). Perylene tetra-(alkoxy carbonyl) derivatives (PTACs) have similar structure to PDIs, and showed good solubility due to the presence of electron deficient carboxylic acid ester groups (Zhan et al., 2014; Zhang et al., 2018). The F− probes based on PTACs have aroused growing interest (Gupta et al., 2015; Wang et al., 2018; Ma et al., 2017; Paniz et al., 2016). The reported PTACs-based F− probes were normally constructed by introducing N—H or O—H moiety to the perylene nucleus (Gupta et al., 2015; Paniz et al., 2016). The intermolecular proton transfer (IPT) between H+ and F− is the key step of its sensing process. The IPT process facilitated the intramolecular charge transfer (ICT) from the N− part to the perylene ring as a moderate red shift in the absorption spectrum. The design of probes with obvious color changes is of great significance for naked-eye detection of F−, and it endows PTAC-based F− probes with large red shift. PTAC with donor–acceptor (D–A) configuration can be constructed by adding an electron donating group and an electron withdrawing group on either side of the perylene nucleus (Mani et al., 2019; Manna et al., 2019; Shi et al., 2021). Predictably, F− induced deprotonation of such molecules via H-bonding can promote the ICT process, leading to larger color changes and red shifts in absorption spectra (Becke, 1993).
Herein, we designed a novel F− probe P1 by adding a nitro-based electron acceptor and a chloroacetamide-based electron donor to the perylene nucleus, respectively (Scheme 1). Its analogue P2 was also prepared by introducing only chloroacetamide-based electron donor into the perylene core. The probe P1 with unique configuration had a distinct color change from red to green during F− sensing. The observed band red shift is due to the higher electron supply capacity of the N− moiety than the free N—H moiety. In addition, deprotonation result in a donor-π-acceptor (D-π-A) configuration and a new absorption band during the ICT process because of the additional electron-withdrawing nitro unit in P1. Therefore, it can be observed that the red shift of P1 toward F− sensing reached to 190 nm.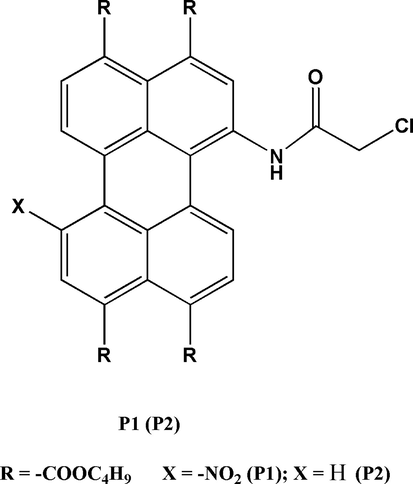
Structure of P1 and P2.
2 Experimental
2.1 Chemicals and instruments
All chemicals used in this study were of analytical reagent grade, used without further purification unless otherwise noted. 1H NMR and 13C NMR spectra were recorded on a Bruker Advance 300 (Germany) spectrometer in CDCl3 at room temperature. FT-IR spectra were taken on a Bruker Tensor-27 (Germany) spectrophotometer. Mass spectra were recorded on a Bruker Maxis UHR-TOF (Germany) MS spectrometer. UV–vis absorption spectra were measured using a Varian CARY-50 (America) spectrophotometer. CV curves was recorded on a CH 1604C (China) electrochemical analyzer.
2.2 Computational details
The geometrical optimization was carried out using Density Functional Theory with B3LYP method and the standard 6-31G* basis. Computations were performed using the Gaussian 03 program package (Becke, 1998; Ong et al., 1999; Parthiban and Elango, 2015).
3 Results and discussion
3.1 Synthesis of the probes
The synthetic route of probes P1 and P2 are shown in Scheme 2. Probe P2 was synthesized as described previously (Paniz et al., 2016). Probe P1 was obtained by nitro-substitution reaction of probe P2 with fuming nitric acid in dichloromethane (CH2Cl2). The molecular structures were characterized by 1H NMR, 13C NMR, FTIR and mass spectral techniques (see ESI† for details).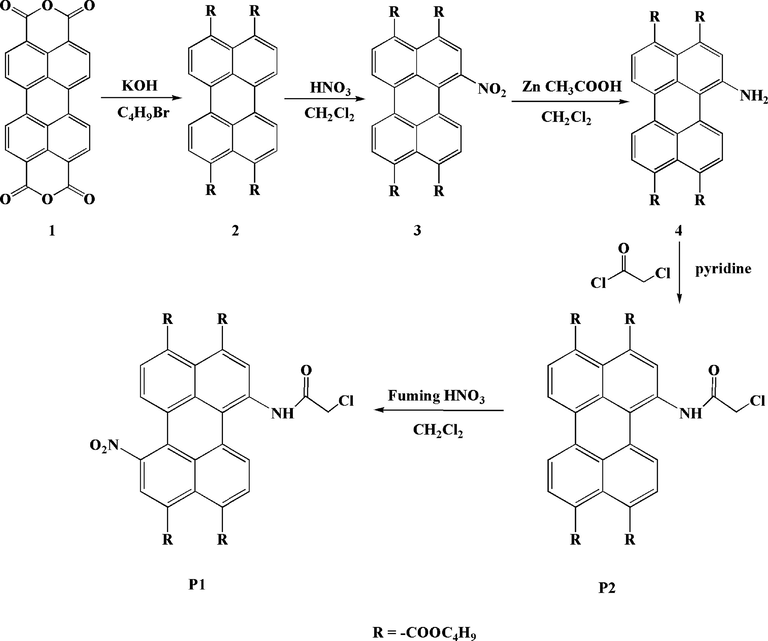
The synthesis route of P1 and P2.
3.2 Photophysical and electrochemical properties
As can be seen from Fig. 1a, P1 showed the maximum absorption band centered at 503 nm in CH2Cl2 solution, but did not show fluorescence. Compared with that of P2 (472 nm), the red shift of absorption peak was about 31 nm, which can be explained by the extension of π-conjugation system due to the introduction of nitro unit. The photophysical behaviors of P1 and P2 in solvents with different polarities were investigated (Fig. 1b and Fig. S-1a). With the increase of solvent polarity, the maximum absorption band of P1 was red shifted. P1 possessed a typical D–π–A structure, and so it exhibited good solvatochromism and different photophysical properties in different polar solvents, such as ethyl acetate, hexane, acetonitrile, CH2Cl2, and tetrahydrofuran. The original and normalized absorption spectra of P1 and P2 at different concentrations were shown in Fig. 1c, Fig. S-1b, and Fig. S-2, respectively. Both the maximum absorption wavelength and spectrum shape showed scarcely any change with the concentration varied from 10−6 mol/L to 10−4 mol/L. This suggested that the π-π interactions did not occur at high concentration (10−4 mol/L) of P1 and P2. This is because the carboxylic ester chains increased the solubility of the perylene derivatives.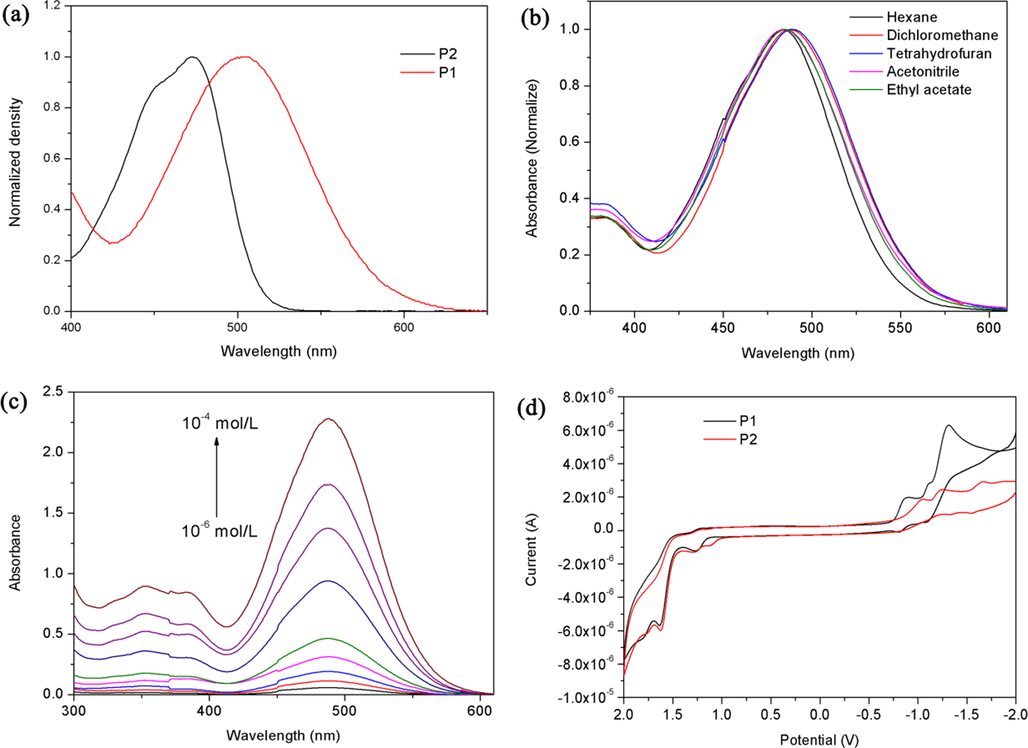
(a) Absorption spectra of P1 and P2 recorded in 10 μM CH2Cl2 solutions; (b) Normalized absorption spectra of P1 in different solvents; (c) Absorption spectra of P1 in CH2Cl2 at different concentrations; (d) CV spectra of P1 and P2 recorded in 10 μM CH2Cl2 solutions.
The electrochemical properties of P1 and P2 have been studied by cyclic voltammetry (CV) (Fig. 1d). Both probes had two reduction peaks of the perylene group in CH2Cl2. The peaks (−0.89 V for P1 and −1.05 V for P2) at front correspond to the formation of radical anions, and the peaks (−1.11 V for P1 and −1.23 V for P2) at back correspond to the formation of dianion at a relatively negative potential. Table S-1 summarizes the redox potentials, highest occupied molecular orbital (HOMO), and lowest unoccupied molecular orbital (LUMO) energy levels estimated by CV. The HOMO/LUMO levels of P1 and P2 are −6.43/−3.91 and −6.42/-3.75 eV, respectively. The first reduction and oxidation potentials of P1 were larger than those of P2 due to the good electron-withdrawing ability of nitro group, while the LUMO and HOMO levels decreased.
3.3 Selectivity investigation of fluoride ion
The naked eye sensitivity of P1 and P2 to different anions (AcO−, SO42−, H2PO4−, ClO4−, Br−, I−, Cl−, and F−) was investigated by adding 10 and 50 equiv. tetrabutylammonium salts into CH2Cl2 solutions. As can be seen from Fig. 2, after the addition of F−, the color of P1 changed from red to green, and the color of P2 changed from yellow-green to light brown. However, after the addition of the other anions, there was little change in the color of the two probes. The results showed that P1 and P2 had macroscopic sensitivity and good selectivity for the detection of F−.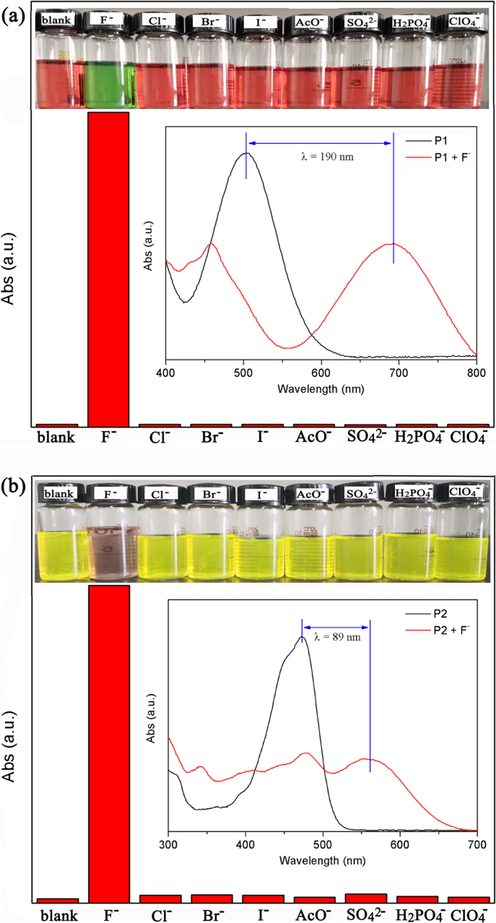
The intensities of P1 (a) at 693 nm and P2 (b) at 561 nm with 10 and 50 equiv. of different anions in CH2Cl2 solution, respectively (inset: color changes and the corresponding absorption spectra changes of P1 and P2 with anions).
Absorption spectra showed that the strongest absorption peak of P2 was red shifted by 89 nm after the addition of F−. Interestingly, during the F− sensing process, the strongest absorption peak of P1 exhibited a large red shift of 190 nm, resulting in a more obvious color change. It is worth noting that this red shift is the largest value reported so far for F− probes based on PTAC derivates.
3.4 Absorption spectral response toward fluoride ion
The influences of the amount of F− on the absorption spectra of P1 and P2 were studied by absorption titration test. As can be seen from Fig. 3a, with the increase of F− amount, the intensity band at 503 nm (ɛ = 17,771 L mol−1 cm−1) decreased, while a new absorption peak appeared at 693 nm and increased gradually. A large red shift during the F− sensing caused a noticeable color change from red to blue. When 7.0 equal amounts of F− was added, the peak intensity at 693 nm (ɛ = 9847 L mol−1 cm−1) reached the maximum value, indicating that the mixture formed by P1 and F− reached saturation. The isosbestic point at 588 nm suggests that there is a well-described binding equilibrium between P1 solution and F−. Moreover, a quantitative linear relationship between the absorbance of P1 (A693 nm/A503 nm) and the concentration of F− was obtained by ratio absorption method, indicating that P1 was a ratio probe (Fig. 3b). P2 also showed the above-mentioned phenomena like P1. With the addition of F− (from 0 to 10.0 equiv.), the absorption peak of P2 at 472 nm (ɛ = 33,618 L mol−1 cm−1) decreased, while a new absorption peak appeared at 561 nm (ɛ = 12,430 L mol−1 cm−1) and gradually increased. Due to the red shift (Fig. 3c), the color of P2 changed from yellow-green to light brown. Systematic titration analysis showed that P2 was also a ratio probe for detecting F−, with an isosbestic point at 502 nm (Fig. 3d). The linear equations were estimated to be y = 1.6786 × 10⁴ × −0.0275 (R = 0.9989) and y = 8.74 × 10³ × −0.14133 (R = 0.9903) for P1 and P2, respectively, where x was the concentration of F− (10−5 mol/L), and y was the absorbance intensity ratio (A693 nm/A503 nm for P1 and A561 nm/A472 nm for P2) measured at a given F− concentration.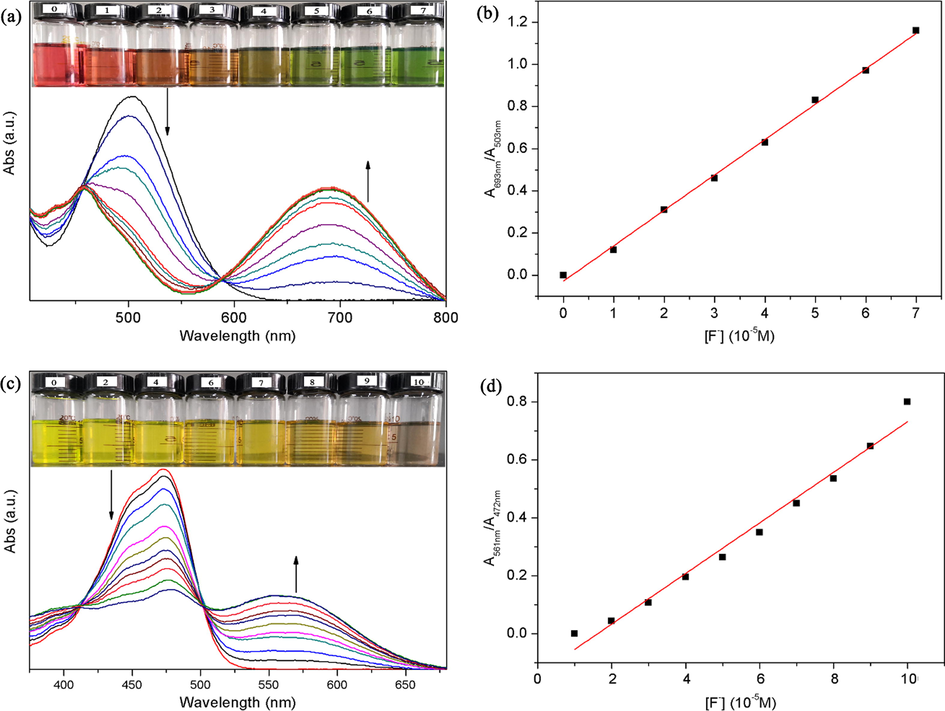
Absorption spectra of P1 (a) and P2 (c) in CH2Cl2 upon addition of 0–7 and 0–10 equiv. of F− anions, respectively (inset: color changes of P1 and P2 when different amounts of F− are added); Plot of the absorbance ratio (A693 nm/A503 nm) of P1 (b) and (A561 nm/A472 nm) of P2 (d) versus F− concentrations in CH2Cl2.
According to the Job’s plot (Fig. S-3), when the value of [F−]/([probe] + [F−]) was 0.5, the intensity of absorption bands reached the maximum, indicating that both probes formed chemical complex of 1:1 with F−. The Benesi–Hildebrand plot also confirmed this result (Fig. S-4). The association constants (Ka) between the two probes and F− were calculated by Benesi–Hildebrand method. The Ka of P1 and P2 were 6.75 × 10³ M−1 and 9.09 × 10² M−1, respectively. This indicated that P1 has a higher affinity for F− than P2. The detection limits (LOD) of the two probes were calculated to be 0.22 μM for P1 and 0.87 μM for P2, respectively, using the equation LOD = 3 s/K (where s and K were the standard deviation of the three blank measurements and the slope of absorbance vs F− concentration, respectively). The results further showed that P1 has better F− detection performance than P2.
3.5 1H NMR titration spectral response toward fluoride ion
The interaction between F− and probes were studied by monitoring the 1H NMR spectra of probes in CDCl3: DMSO‑d6 = 50:1 with the addition of tetrabutylammonium fluoride. Fig. 4a shows part of 1H NMR spectra of P1 after the addition of F−. It could be seen that free P1 showed a signal peak of N—H proton at 9.09 ppm. When 2.0 equiv. of F− was added into the sample, the intensity of N—H signal decreased significantly. The resonance signal of the proton disappeared when 7.0 equiv. of F− was added. Similar 1H NMR titration experiments were performed in P2 solution (Fig. 4b). After the addition of 10.0 equiv of F− to P2, the N—H signal at 9.15 ppm completely disappeared, indicating that deprotonation process may occur in the probes during F− sensing.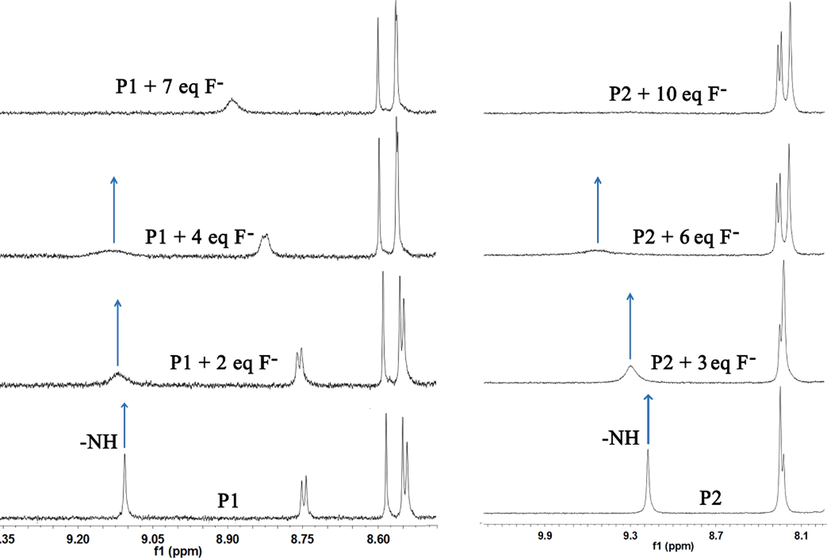
1H NMR titration spectra of P1 (a) and P2 (b) with different equivalents of F− in CDCl3: DMSO‑d6 = 50:1.
3.6 Electrochemical response toward fluoride ion
The N—H moiety in both probes were related directly to the REDOX of perylene nucleus, and hence, a small change in the electron density of the N—H moiety would lead to a significant change of the REDOX nature of the perylene nucleus. Therefore, differential pulse voltammetry (DPV) was used to investigate the changes of the electrochemical properties of P1 and P2 in CH2Cl2 after the addition of F− ions. It can be seen that the free receptor P1 exhibits two perylene-characteristic reduction peaks (Fig. 5). The first peak (−0.909 V) was related to the formation of the free anion (P1•−) and the second peak (−1.247 V) was related to the formation of the dianion (P12−). In P2, these peaks appeared at −0.849 V and −1.245 V, respectively. Notably, both reduction peaks occurred at relatively lower potentials in P1, suggesting that the electroreduction of the perylene moiety occurred more easily in P1 than in P2. This was because of the presence of the additional electron-withdrawing group (—NO2) in P1. When F− ions were added, the first reduction peak moved towards more negative potentials and eventually disappeared, and the current intensity of the other reduction peak also decreased. These changes suggested that the electroreduction capacity of perylene nucleus with the addition of F− ions was more difficult than that of the corresponding free receptors. This is due to the fact that the N− atom was relatively richer in electrons after the N—H part is complexed with the F− ion by hydrogen bond. The intensity of the ICT transition (from N− atom to perylene) increased, making the perylene difficult to reduce. The peak current intensity decreased with the increase of F− concentration, indicating that the diffusion coefficient of the formed complex decreased [44].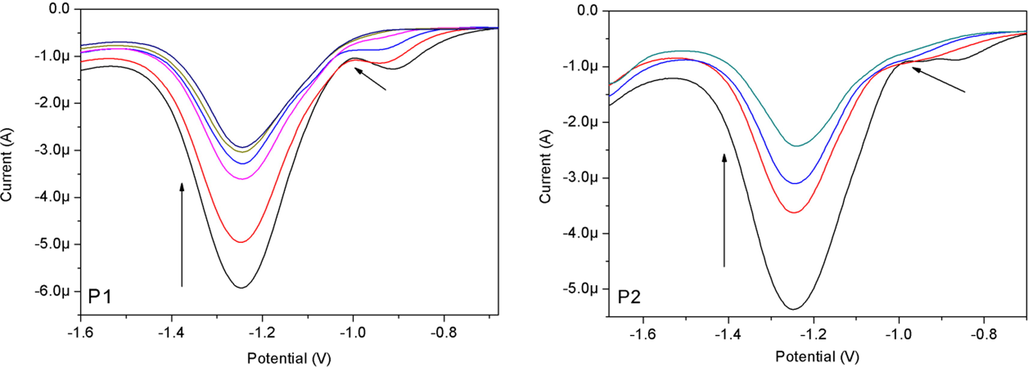
Changes of REDOX properties of P1 and P2 in CH2Cl2 with the addition of 0–7 and 0–10 equiv. of F− ions, respectively.
3.7 Density functional theory (DFT) simulations
The structural and electronic properties of P1, P2 and their deprotonated product (P1−, P2−) were investigated by molecular simulation to further understanding the sensing mechanism. According to the calculation (Fig. 6 and Fig. S-5), the ground-state geometries of the perylene core showed distorted angles caused by the bay substitutions. The dihedral angles between the two naphthalene subunits of perylene ring were 4.13° for P1, 1.3° for P2, 0.79° for P1− and 0.62° for P2−, respectively, indicating that the presence of nitro group reduced the rigidity and planarity of the perylene nucleus. The electronic properties of the two probes and their deprotonated products can be better illustrated by mapped electrostatic potential (MEP). As can be seen from Fig. 6, the electrostatic potential regions of P1 and P2 molecules were almost neutral (marked in green). By contrast, in P1− and P2−, the negative potential regions (marked in yellow) were present in the N− part and the entire perylene nucleus.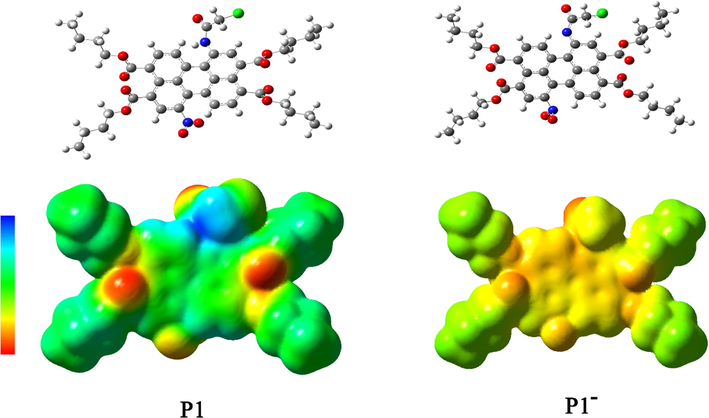
Geometry-optimized structures (upper graphs) and the MEP (lower graphs) of P1 and P1− at the B3LYP/6-31G* level over an electronic isodensity of 0.0004 e Å−3 (the transition from electron-poor to electron-rich region is blue to red).
As shown in Fig. 7, the HOMO/LUMO energies of P1 and P2 were −5.77/−3.07 eV and −5.61/−2.78 eV, respectively. The HOMO-LUMO gap of P1 (2.70 eV) was lower than that of P2 (2.83 eV), which was consistent with the observed red shift of P1 in absorption spectrum. In addition, for P1 the HOMO was delocalized throughout the whole perylene molecule and amide group, while the LUMO was more distributed across the perylene molecule and nitro unit. These characteristics were similar for P1−. In contrast, the HOMO orbital of P2 centered on the amide system and perylene ring, while the LUMO orbital was mainly distributed in the central perylene nucleus and ester position with little change (Fig. S-6). From these results it can be seen that the molecular orbital approximation favored the ICT process from amide to perylene molecule. Due to the introduction of an electron-withdrawing group (—NO2) in P1, the deprotonation can form D-π-A configuration, which further polarized the electron density from the electron-donating moiety (—N−— (C⚌O) —CH2Cl) to the electron-accepting groups (nitroperylene) (Fig. 8). This mechanism leaded to the dramatic red shift in the spectrum of P1 when detecting F−.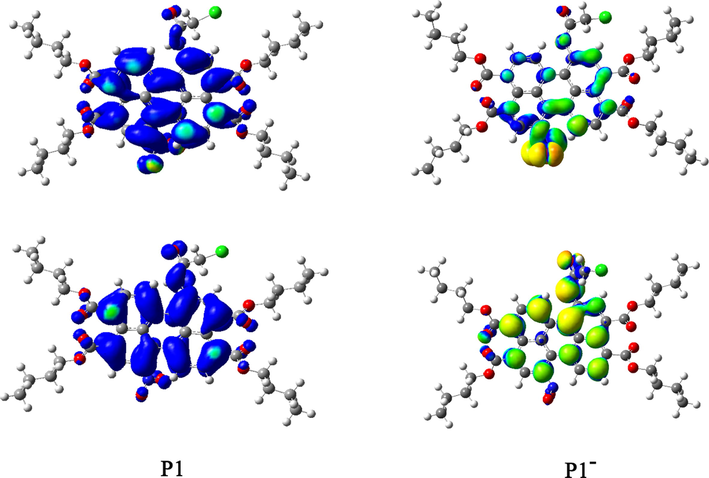
Computed HOMO (lower)-LUMO (upper) energy levels of P1 and P1−.
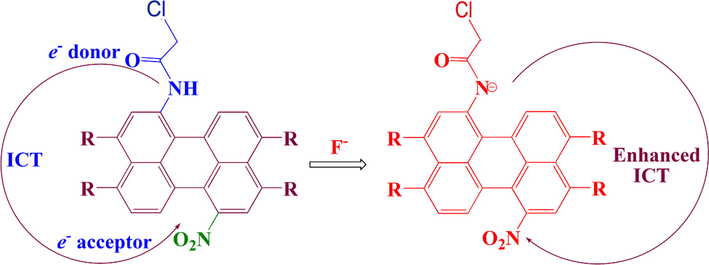
The proposed mechanism of interaction between P1 and F− anions.
4 Conclusions
In summary, we have successfully designed and synthesized two F− probes, which show obvious color changes during the detection process in CH2Cl2 solvent. The absorption properties have been well studied and the probes have good selectivity towards F− anion. 1H NMR titration and electrochemical experiments indicated that the deprotonation of amide –NH fragment occurred in the probes in the presence of F− anion. DFT calculations suggested that the deprotonation of P1 may facilitate the ICT process. The results showed that P1 exhibited a dramatic red shift of up to 190 nm in the presence of F−, with a low LOD of about 0.22 μM. Nevertheless, there is still much room for further optimization of the probes we developed, like modifying them to work in various kinds of solvents.
Acknowledgements
The authors are thankful to the Natural Science Foundation of Shandong Province (ZR2020MB086) and Doctoral Research Fund of Shandong Jianzhu University (XNBS1938, X21091Z) for financial assistance.
Declaration of Competing Interest
The authors declare that they have no known competing financial interests or personal relationships that could have appeared to influence the work reported in this paper.
References
- Aminobenzohydrazide based colorimetric and ‘turn-on’ fluorescence chemosensor for selective recognition of fluoride. Anal. Chim. Acta. 2015;876:1-8.
- [Google Scholar]
- Turn-on fluorescent probe designed for fluoride ion sensing in aqueous media. Tetrahedron Lett.. 2015;56:4975-4979.
- [Google Scholar]
- Pyrazinoindole-based Lewis-acid/base assembly: intriguing intramolecular charge-transfer switching through the dual-sensing of fluoride and acid. J. Org. Chem.. 2019;84:3843-3852.
- [Google Scholar]
- β-Cyclodextrin and calixarene-25,26,27,28-tetrol capped carbon dots for selective and sensitive detection of fluoride. Carbohydr. Polym.. 2015;117:377-383.
- [Google Scholar]
- Density-functional thermochemistry. III. The role of exact exchange. J. Phys. Chem.. 1993;98:5648-5652.
- [Google Scholar]
- Density-functional exchange-energy approximation with correct asymptotic behavior. Phys. Rev. B. 1998;38:3098-3100.
- [Google Scholar]
- Colorimetric and ratiometric fluorescent chemosensor for fluoride ion based on perylene diimide derivatives. Dyes Pigm.. 2012;94:410-415.
- [Google Scholar]
- Colorimetric and ratiometric fluorescent chemosensor for fluoride ion basedon perylene diimide derivatives. Dyes Pigm.. 2012;94:410-415.
- [Google Scholar]
- Aqueous fluoride ion sensing by a new perylenediimide derivative: Interaction between the hydrated fluoride and the aromatic molecule. Chem. Phys. Lett.. 2013;588:76-81.
- [Google Scholar]
- Fluorescent and colorimetric sensors for anionic species. Coord. Chem. Rev.. 2018;354:2-27.
- [Google Scholar]
- Perylo[1,12-b, c, d] thiophene tetraesters: a new class of luminescent columnar liquid crystals. Langmuir. 2015;31:8092-8100.
- [Google Scholar]
- Perylo [1,12-b, c, d] thiophene tetraesters: a new class of luminescent columnar liquid crystals. Langmuir. 2015;31:8092-8100.
- [Google Scholar]
- Naked-eye detection of inorganic fluoride in aqueous media using a new azo-azomethane colorimetric receptor enhanced by electron withdrawing groups. RSC Adv.. 2014;4:1032-1038.
- [Google Scholar]
- Synthesis and characterization of novel perylene dyes with new substituents at terminal position as colorants for LCD color filter. J. Incl. Phenom. Macrocycl. Chem.. 2015;82:203-212.
- [Google Scholar]
- Effect of molecular interactions and end chain length on ultraviolet absorption behavior and photo stability of alkoxycinnamic acids: theoretical models of liquid crystal. J. Mol. Liq.. 2014;197:106-113.
- [Google Scholar]
- Synthesis, characterization, physical properties, and OLED application of single BN-Fused perylene diimide. J. Org. Chem.. 2015;80:196-203. 。
- [Google Scholar]
- Hexametaphosphate-capped quantum dots as fluorescent probes for detection of calcium ion and fluoride. Sens. Actuators B. 2016;232:306-312.
- [Google Scholar]
- Two new chemosensors for fluoride ion based on perylene tetra-(alkoxycarbonyl) derivatives. Sens. Actuators B. 2017;241:735-743.
- [Google Scholar]
- Coumarin based hydrazone as an ICT-based fluorescence chemosensor for the detection of Cu2+ ions and the application in HeLa cells. Spectrochim. Acta B. 2019;214:170-176.
- [Google Scholar]
- Tuning of the H-bonding ability of imidazole N-H towards the colorimetric sensing of fluoride and cyanide ions as their sodium salts in water. New. J. Chem.. 2013;37:3152-3160.
- [Google Scholar]
- A highly selective ICT-based fluorescent probe for cysteine sensing and its application in living cell imaging. Anal Methods. 2019;11:1199-1207.
- [Google Scholar]
- Theoretical studies of the infrared and Raman spectra of perylene. J. Mol. Struc-Theochem. 1999;459:131-144.
- [Google Scholar]
- Controlled intramolecular charge transfer using a sulfur-containing acceptor group. J. Phys. Chem. C. 2016;120:70-77.
- [Google Scholar]
- Amino-naphthoquinone and its metal chelates for selective sensing of fluoride ions. Sensor. Actuat. B-Chem.. 2015;215:544-552.
- [Google Scholar]
- Naphthoquinone-based colorimetric and fluorometric dual-channel chemosensor for the detection of Fe2+ ion and its application in bio-imaging of live cells and zebrafish. ACS Sustainable Chem. Eng.. 2019;20:17210-17219.
- [Google Scholar]
- Construction of a simple dual-channel fluorescence chemosensor for Cu2+ ion and GSSG detection and its mitochondria targeting bioimaging applications. Analytica Chimica Acta. 2021;1181:338896
- [Google Scholar]
- Simple colorimetric and fluorescence chemosensing probe for selective detection of Sn2+ ions in an aqueous solution: evaluation of the novel sensing mechanism and its bioimaging applications. Anal. Chem.. 2021;93(2):801-811.
- [Google Scholar]
- A fluorescent off-on NBD-probe for F- sensing theoretical validation and experimental studies. Org. Biomol. Chem.. 2014;12:2143-2149.
- [Google Scholar]
- Spectroscopic electrochemical and theoretical studies on anion recognition by receptors with redox active ferrocene and quinine centers bridged by imidazole. J. Organomet. Chem.. 2014;750:98-106.
- [Google Scholar]
- Anion induced azo-hydrazone tautomerism for the selective colorimetric sensing of fluoride ion. Spectrochim. Acta A. 2014;128:798-805.
- [Google Scholar]
- A simple colorimetric and ratiometric fluoride ion probe with large color change. RSC Adv.. 2021;11:1-6.
- [Google Scholar]
- Development of spiropyran-based electrochemical sensor via simultaneous photochemical and target-activatable electron transfer. Biosens. Bioelectron.. 2014;62:151-157.
- [Google Scholar]
- Precisely controlling fluorescence enhancement and high-contrast colorimetric assay in OFF-ON fluoride sensing based on a diketopyrrolopyrrole boronate ester. Dyes Pigm.. 2019;170:107638-107644.
- [Google Scholar]
- Recent progress on reaction-based BODIPY probes for anion detection. Dyes Pigm.. 2020;172:107857-107870.
- [Google Scholar]
- Novel hydroxyl-substituted perylene-3,4,9,10-tetracarboxylic aciddiimides for selective recognition of fluoride. Sensor. Actuat. B-Chem.. 2018;260:719-726.
- [Google Scholar]
- Synthesis of 1-amino-12-hydroxyl-perylene tetra-(alkoxycarbonyl) for selective sensing of fluoride. Dyes Pigments. 2018;156:225-232.
- [Google Scholar]
- A new colorimetric and fluorescent bifunctional probe for Cu2+ and F− ions based on perylene bisimide derivatives. Tetrahedron Lett.. 2014;55:3218-3222.
- [Google Scholar]
- Colorimetric and on-off fluorescent chemosensor for fluoride ion based on diketopyrrolopyrrole. Sens. Actuators B. 2015;207:9-24.
- [Google Scholar]
- Air-stable N, N′-dihydroporphycene: a quinoxaline-fused tetrapyrrolic macrocycle that detects fluoride anion via deprotonation. Org. Lett.. 2019;21:1849-1852.
- [Google Scholar]
- Synthesis and optoelectronic properties of a novel molecular semiconductor of dithieno [5,6-b:11,12–b0] coronene-2,3,8,9-tetracarboxylic tetraester. Chinese Chem. Lett.. 2014;25:65-68.
- [Google Scholar]
- A new diketopyrrolopyrrole (DPP) derivative bearing boronate group as fluorescent probe for fluoride ion. Dyes Pigments. 2013;98:232-237.
- [Google Scholar]
- New progress in the design, synthesis and application of fluorescent probes for fluoride ion detection. Chin. J. Org. Chem.. 2016;36:2559-2582.
- [Google Scholar]
- Novel fluorescent probes for the fluoride anion based on hydroxy-substituted perylene tetra-(alkoxycarbonyl) derivatives. RSC Adv.. 2018;8:14084-14091.
- [Google Scholar]
Appendix A
Supplementary material
Supplementary data to this article can be found online at https://doi.org/10.1016/j.arabjc.2022.103940.
Appendix A
Supplementary material
The following are the Supplementary data to this article:Supplementary data 1
Supplementary data 1


