

Translate this page into:
Identification of structural and optical properties and adsorption performance of (Cd0.4Ni0.4Mn0.2)Fe2-xRuxO4 nanoparticles for the removal of Congo red dye
⁎Corresponding author at: Chemistry Department, Faculty of Science, Beirut Arab University, Beirut, Lebanon. a.aridi@bau.edu.lb (Amani Aridi)
-
Received: ,
Accepted: ,
This article was originally published by Elsevier and was migrated to Scientific Scholar after the change of Publisher.
Abstract
In the field of industrial wastewater treatment, the application of highly efficient methods such as adsorption is crucial for effectively eliminating dangerous pollutants before effluent discharge. Ferrite nanoparticles (NPs) have emerged as promising candidates for the efficient and sustainable removal of dyes from wastewater. Therefore, the synthesis, characterization, and application of (Cd0.4Ni0.4Mn0.2)Fe2-xRuxO4 (0 ≤ x ≤ 0.04) NPs as adsorbents for the removal of Congo Red (CR) dye, is reported in this study. The X-ray powder diffraction (XRD) analysis has confirmed the purity of the samples with a very small amount of hematite phase. The prepared NPs have pseudo-spherical morphology and average particle size in the range of 12–17 nm. Furthermore, the elemental compositions, estimated from the energy dispersive x-ray (EDX) measurements, indicate the homogenous distribution of elements and the substitution of the Fe3+ host ions by the Ru3+ dopant. As the Ru content increases from 0.00 to 0.04, SBET increases from 52.39 to 78.34 m2/g, respectively. Furthermore, the pore diameter, ranging between 12.71 and 18.38 nm, reveals the mesoporous nature of the prepared samples. The direct and indirect bandgap energy, calculated from UV–vis spectroscopy analysis, is in the range of 3.049–3.232 eV and 1.894–2.642 eV, respectively. The adsorption performance of the prepared NPs for the removal of CR dye solution was investigated by varying the contact time, adsorbent amount, pH, and reaction temperature. The adsorption process follows a second-order kinetic model and the NPs with x = 0.015 revealed the highest adsorption rate with a rate constant k2 = 2.7 × 10⁻³ g.mg−1.min−1. The optimum experimental conditions, achieved in the presence of 80 mg of (Cd0.4Ni0.4Mn0.2)Fe1.985Ru0.015O4 NPs at 308 K and in the acidic medium at pH = 3.45, result in the removal of 87.5 % of CR dye after 60 min. After applying several non-linear adsorption isotherm models, mainly Langmuir, Freundlich, and Temkin isotherms, the experimental data were well-fitted with the Temkin isotherm model. The strong interactive force between CR and (Cd0.4Ni0.4Mn0.2)Fe1.985Ru0.015O4 nanoparticles is revealed from the high value of bT knowing that bT = 182.91 J.mol−1.
Keywords
(Cd0.4Ni0.4Mn0.2)Fe2-xRuxO4 nanoferrite
Adsorption
Congo red removal
Adsorption kinetics
Adsorption isotherm

1 Introduction
Nanoparticles (NPs) are defined as materials with dimensions ranging from 1 to 100 nm, ensuring at least one dimension falls within this range (Phan & Haes, 2019). The size and shape of nanomaterials play a crucial role in determining their physical and chemical properties (Mathew & Juang, 2007; Phan & Haes, 2019). Thus, scientists are dedicating significant efforts towards the fabrication and the precise control of nanomaterials' morphology and size (Ahmad et al., 2022; Mathew & Juang, 2007). Moreover, the unique combination of magnetic properties, tunability, stability, and multi-functionality makes ferrite NPs stand out among other nanoparticles, offering significant potential for various technological and biomedical applications (Hammad, 2022). Researchers have utilized ferrite nanoparticles in the removal of dyes and organic pollutants which are recognized as significant sources of pollution (Aljohani et al., 2023). Among several wastewater treatment methods, adsorption is considered the most effective method (Alrefaee et al., 2023; Zafar et al., 2022). It is widely used in several studies due to its simplicity, cost-effectiveness, and low secondary waste production (Almahri et al., 2023; Bashir et al., 2023; Bazrafshan et al., 2021). It is worth mentioning that the use of nanomaterials in the field of adsorption has garnered significant attention. This interest stems from their small particle size and high surface area (Ghamkhari et al., 2020).
According to the crystal structure and the chemical compositions, ferrites are divided into three different types: spinel, garnets, and hexaferrites (Mathew & Juang, 2007; Sarveena, 2021). The current research will shed light on the spinel ferrites nanoparticles that fall under the category of ceramic substances, composed of iron oxide blended with other metals adopting the general A2+Fe3+Fe2O4 formula (Bajorek et al., 2019). It is of significance that A represents a divalent cation such as nickel, zinc, barium, cadmium, cobalt, or manganese. Spinel ferrites find extensive applications in the fields of electronics, industry, and biomedicine. They are utilized in various areas such as permanent magnets, telecommunications devices, wastewater treatment, targeted drug delivery, cancer treatment, and magnetic resonance imaging (MRI) (Bajorek et al., 2019; Kefeni et al., 2020; Kefeni & Mamba, 2020). Generally, spinel ferrites nanoparticles may exhibit normal spinel structure, such as ZnFe2O4 and CdFe2O4, where all A2+ and the Fe3+ cations occupy the tetrahedral (A) sites and the octahedral (B) sites, respectively (Sarveena, 2021). Whereas in inverse spinel structure, A2+ ions occupy the octahedral sites while Fe3+ ions are distributed over both octahedral and tetrahedral sites and this can be found in NiFe2O4, CoFe2O4, and MgFe2O4 (Sarveena, 2021). In mixed spinel structure, both A2+ and Fe3+ ions are distributed over the tetrahedral and the octahedral sites (Sarveena, 2021). MnFe2O4 is an example of a material exhibiting a mixed spinel structure. The arrangement of Mn2+ and Fe3+ creates a unique crystal structure with distinctive properties, making MnFe2O4 suitable for various applications, including magnetic, electrical, and catalytic applications (Akhlaghi & Najafpour-Darzi, 2021; A. Kumar et al., 2023).
Recently, there has been significant attention focused on tri-metal ferrite NPs among the various investigated spinel ferrites. For instance, Ni0.5Zn0.5Bi0.04NdxFe1.96-xO4 has been synthesized by the citrate precursor technique. The current–voltage variation showed a high order of resistivity that is useful in high-frequency applications (Taneja et al., 2022). Furthermore, Ni0.4Cu0.3Zn0.3Fe2O4 doped with additive Nb2O5 showed varied structural properties and yielded soft ferrite entities with tailored magnetic and optical parameters (Patil et al., 2022). Moreover, Ni0.7Mn0.2Cu0.1Fe2-xAlxO4 nanoferrites were synthesized by sol–gel auto-combustion technique at room temperature. The prepared ferrites exhibited excellent crystal structure, enhanced initial permeability, and good strain size (Suresh et al., 2022). It is worth noting that these ferrite NPs can be synthesized using several methods, and the co-precipitation technique is the best one due to its possibility of controlling the size of the NPs and cost-effectiveness (Bazrafshan et al., 2023).
Studying the properties of cadmium-nickel-manganese ferrite NPs is highly interesting due to the diverse properties exhibited by each of CdFe2O4, NiFe2O4 and MnFe2O4 NPs. For example, in a previous investigation, CdFe2O4 was used as an effective adsorbent for the removal of Methylene Blue from an aqueous solution, and the removal percentage obtained was over 99 % (Vodă et al., 2016). Moreover, Ni(1-x)MnxFe2O4 exhibited effective performance for the removal of Congo red dye (Luo et al., 2018). In addition, nickel ferrite nanocomposites were prepared using chemical co-precipitation and applied for efficient removal of phenol from the aqueous solutions by adsorption process, and more than 96 % of phenol was removed (Mohammadi et al., 2021). Furthermore, MnFe2O4 was used as an efficient adsorbent in the removal of Acid Red B dye from water (Wu & Qu, 2005).
Numerous investigations have been conducted to explore the characteristics of pure CdFe2O4, NiFe2O4, and MnFe2O4 nanoparticles. However, there is a noticeable gap in the existing literature concerning the properties of tri-metal ferrite nanoparticles. To address this gap, our study introduces a novel approach by synthesizing tri-metal ferrite nanoparticles known as Cd-Ni-Mn ferrite nanoparticles to enhance their properties. It is worth noting that this particular tri-metal ferrite nanoparticle has not been synthesized or studied previously. Additionally, by incorporating ruthenium (Ru) into the crystal structure, the properties of the resulting ferrite material can be further modified and tailored (Manikandan et al., 2019). Thus, this work reports the synthesis and characterization of (Cd0.4Ni0.4Mn0.2)Fe2-xRuxO4 (0.00 ≤ x ≤ 0.04) NPs. Furthermore, the effect of Ru dopant content on the structural and optical properties of (Cd0.4Ni0.4Mn0.2)Fe2-xRuxO4 NPs was investigated. Besides, the adsorption performance of the prepared NPs for the removal of CR dye was studied.
2 Experimental techniques
2.1 Synthesis of (Cd0.4Ni0.4Mn0.2)Fe2-xRuxO4 NPs
(Cd0.4Ni0.4Mn0.2)Fe2-xRuxO4 NPs, where x = 0.00, 0.005, 0.01, 0.015, 0.02 and 0.04, were prepared via the coprecipitation method. The preparation involved the use of high-purity salt chloride precursors, including cadmium (II) chloride hemipentahydrate, nickel (II) chloride hexahydrate, manganese (II) chloride tetrahydrate, ruthenium (III) chloride hydrate and iron (III) chloride hexahydrate. The appropriate stoichiometric proportions of the salt chlorides were dissolved in deionized water to form cationic solutions. Then, the prepared cationic solutions were mixed and stirred for 30 min to improve the homogeneity of the solutions. After that, 4 M NaOH solution was added dropwise to obtain a solution with a pH value of 12. Then, the obtained mixture was heated at 80 °C for 2 h accompanied by continuous stirring. Afterward, a mixture of ethanol and deionized water was used to wash the precipitates until the pH of the filtrate solution dropped to 7. The precipitates were dried in the oven at 100 °C for 18 h. Lastly, grinding and the calcination of the NPs were carried out at 600 °C for 5 h (Aridi et al., 2021; Chehade et al., 2022).
2.2 Characterization of (Cd0.4Ni0.4Mn0.2)Fe2-xRuxO4 NPs
The crystallinity, crystal structure, and phase purity of the synthesized NPs were examined by XRD using Bruker D8 Focus powder diffractometer with Cu-Kα radiation (λ = 1.5406 Å) where the diffraction angle 2θ ranges between 20° and 80°. The JEM-2100 was used for the TEM analysis to record the morphology and particle size distribution. To perform the EDX and SEM techniques, the JOEL scanning electron microscope (JSM-5300) was used. The textural properties were evaluated using the N2 adsorption–desorption method via a 650 Full ISO therme physisorption analyzer. Moreover, the optical properties of the prepared NPs were determined using a JASCO V-670 spectrophotometer at room temperature in the range of 200–700 nm (Aridi et al., 2021).
2.3 Adsorption performance of (Cd0.4Ni0.4Mn0.2)Fe2-xRuxO4 NPs
The adsorption performance of (Cd0.4Ni0.4Mn0.2)Fe2-xRuxO4 NPs, where 0.00 ≤ x ≤ 0.04, was evaluated for the removal of CR dye. All adsorption tests are performed in the dark. To identify the sample with the best adsorption activity, 60 mg of each sample was mixed with 150 mL of 30 ppm CR dye solution. At a specified time interval, 3 mL was extracted from the reaction mixture and analyzed using a UV–vis spectrophotometer (Jasco V-650) to measure the remaining concentration of CR dye in the solution. The adsorbed quantity (qe) of CR was calculated using the following equation (Samoila et al., 2015):
where C0 (mg.L−1) and Ce (mg.L−1) denote the initial CR dye concentration and the dye concentration at equilibrium, respectively, V (L) is the volume of the CR solution, and m (g) is the mass of the adsorbent.
The sample that displayed the most efficient adsorption performance and exhibited the highest rate constant was selected for a comprehensive study to assess the impact of various factors on the adsorption rate. These factors included contact time, adsorbent amount (20, 40, 60, 80, and 100 mg), pH level (2.99, 3.45, 4.19, 7.46, 9.85, and 11.01), and temperature (303, 308, 313, 318 and 323 K) to investigate their influence on the adsorption reaction rate. It is important to note that the pH of the CR solution was adjusted by adding a few drops of 0.1 M HCl and NaOH. After conducting the adsorption reaction at various temperatures, the thermodynamic parameters were calculated, such as the change in the enthalpy (ΔH0), the change in the entropy (ΔS0) and the change in the Gibbs free energy (ΔG0). Subsequently, different adsorption isotherms mainly Langmuir, Freundlich, and Temkin isotherms, to determine the model that best fits the experimental data. It is worth noting that the adsorption experiments were conducted three times to ensure accuracy and reliability.
3 Results and discussion
3.1 XRD analysis
XRD was performed to determine the structure, crystallite size, and lattice parameter of synthesized NPs. The fitting of the XRD patterns of (Cd0.4Ni0.4Mn0.2)Fe2-xRuxO4 NPs, represented in Fig. 1 (a), was performed by Rietveld refinement using the MAUD software. Major diffraction peaks are located at 2θ ≈ 29.8°, 35.1°, 42.7°, 52.9°, 56.4°, 61.9°, 69.9°, and 73.2°, corresponding to the (2 2 0), (3 1 1), (4 0 0), (4 2 2), (5 1 1), (4 4 0), (6 2 0) and (5 3 3) planes, respectively. This confirms the formation of the spinel cubic structure, with space group Fd3m (Basma et al., 2022). The refined structure of pure (Cd0.4Ni0.4Mn0.2)Fe2O4 NPs, obtained from the Visualization of Electronics and Structural Analysis (VESTA) software, is shown in Fig. 1 (b). Furthermore, the extracted parameters from Rietveld refinement are listed in Table 1. The weighted profile R-factor (Rwp) and the expected R-factor (Rp) are approximately equal and the goodness of fit (χ2 ̴ 1). Thus, the fitting is reliable and the patterns are well-refined. It is clear that a small fraction of the hematite phase (1.51 %) appears in the pure NPs. However, upon doping NPs with Ru3+ dopant, the percentage of hematite phases is reduced to 0.48 % for NPs with x = 0.04. This means that the dopants’ ions are successfully incorporated with the spinel ferrite without altering the crystal structure or producing a secondary phase. This result is comparable with a previous study that analyzed the XRD data of Ni0.7Zn0.3-ErxFe2-xO4 NPs, and the intensity of the hematite phase decreased with the increasing of Er content (Sandeep et al., 2022).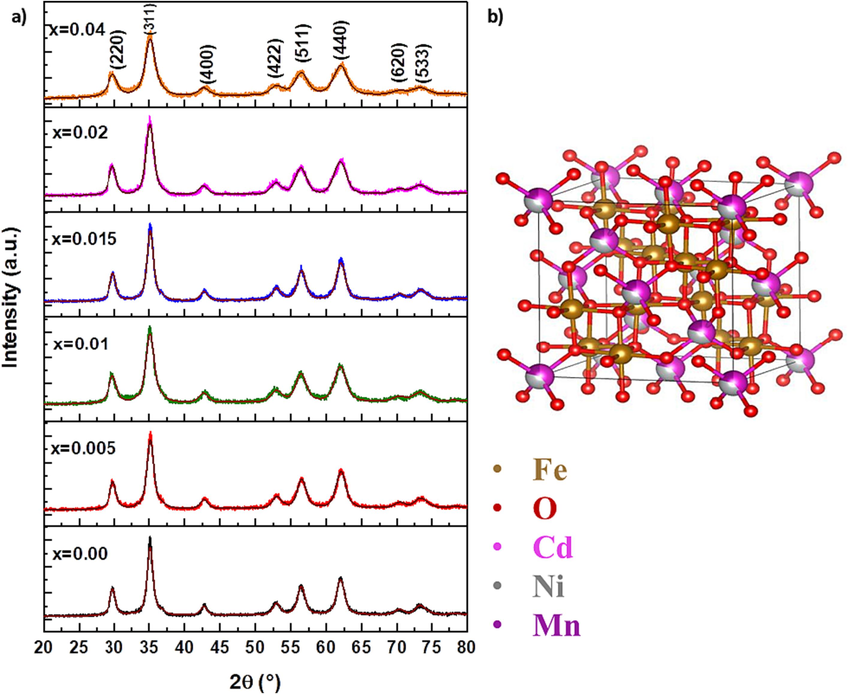
(a) XRD patterns of (Cd0.4Ni0.4Mn0.2)Fe2-xRuxO4 NPs where 0.00 ≤ x ≤ 0.04 and (b) refined structure of pure (Cd0.4Ni0.4Mn0.2)Fe2O4 NPs.
Ru content
x
0.00
0.005
0.01
0.015
0.02
0.04
Phase percentage %
(Cd0.4Ni0.4Mn0.2)Fe2-xRuxO4
98.48
98.73
99.05
99.21
99.44
99.51
Fe2O3
1.51
1.26
0.94
0.78
0.55
0.48
Rwp
0.099
0.1
0.1
0.1
0.1
0.1
Rexp
0.08
0.08
0.079
0.08
0.08
0.08
χ2
1.23
1.24
1.27
1.28
1.38
1.28
Lattice parameter Å
a MAUD
8.462
8.454
8.467
8.455
8.469
8.482
a Bragg's law
8.472
8.471
8.489
8.469
8.490
8.492
M g/mol
255.115
255.341
255.567
255.793
256.019
256.924
ρ g/cm3
5.592
5.613
5.593
5.620
5.599
5.591
The lattice parameter a, listed in Table 1, was extracted from MAUD software and determined from Bragg’s Law as well. Both methods reveal the same trend. It’s observed that the lattice parameter increases from 8.462 to 8.482 Å as the Ru content (x) increases from 0.00 to 0.04. This increase is mainly attributed to the doping of NPs with Ru3+ ions having greater ionic radii (0.68 Å) compared to the ionic radii Fe3+ (0.65 Å) (Vinod et al., 2022). The values lattice parameter a followed an unsystematic variation with the increase of Ru content. As Ru content increases, the Ru3+ ions do not easily occupy their positions at A or B sub-lattice sites therefore some of the ions will be located at grain boundaries (Vinod et al., 2022). The X-ray density ρ, listed in Table 1, was determined using the following equation (Singh Yadav et al., 2018):
To determine the crystallite size of the prepared NPs, the XRD profile analysis was carried out using three different methods, the Debye-Scherrer Model (D-S), the Uniform Deformation Model (UDM) from the Williamson-Hall approach, and the size-strain plot (SSP), the obtained results are listed in Table 2. In the first method the crystallite size DD-S was calculated from the broadening of XRD peaks using the Debye-Scherrer formula for the Lorentzian peak (Kumar et al., 2015):
x
0.00
0.005
0.01
0.015
0.02
0.04
DD-S nm
8.861
6.017
5.411
8.130
6.036
5.520
DUDM nm
21.331
18.243
14.148
14.005
19.528
20.094
Strain UDM
0.0065
0.0096
0.0089
0.0049
0.0092
0.0132
R2 UDM
0.9115
0.9054
0.6483
0.8404
0.6596
0.9586
DSSP nm
14.754
10.588
10.112
9.890
10.344
17.647
Strain SSP
0.0022
0.0031
0.0035
0.0015
0.0027
0.0045
R2 SSP
0.9351
0.9092
0.8646
0.9774
0.7861
0.9015
The crystallite size determined from UDM and SSP models follows the same trend with increasing the Ru content. However, the high values of the coefficient of determination R2 obtained from the SSP method ensure the well-fitting and reliability of this method. Thus, SSP is the best method for determining the crystallite size of the prepared NPs.
3.2 TEM, HRTEM and SAED analysis
Fig. 2 displays the TEM images and histograms, representing the particle size distribution, of (Cd0.4Ni0.4Mn0.2)Fe2-xRuxO4 NPs where 0.00 ≤ x ≤ 0.04. From the obtained TEM images, it is clear that the prepared samples exhibit pseudo-spherical morphology. Similar morphology was observed in a previous study, where the samples Bi2Fe4-xMnxO9 (0.0 ≤ x ≤ 1.0) were synthesized using the co-precipitation route (Pooladi et al., 2019). The average particle size has been calculated using ImageJ software. The mean particle size ranges between 12.8 and 17.8 nm. The particle size decreases from 15.62 nm to 12.87 nm as x increases from 0 to 0.015, and then it increases to reach 17.85 nm as x increases from 0.02 to 0.04. The variation of the particle size analyzed from TEM results is in good agreement with the variation of crystallite size DSSP obtained from XRD analysis. Nevertheless, the average particle size values obtained from TEM analysis are greater than those evaluated from XRD. This may be due to the fact that particle is formed from the agglomeration of crystallites (Seyring et al., 2009). It is known that agglomeration may occur due to the magnetic interactions among several energetic crystallites found in the ferrite NPs samples (Ansari et al., 2023).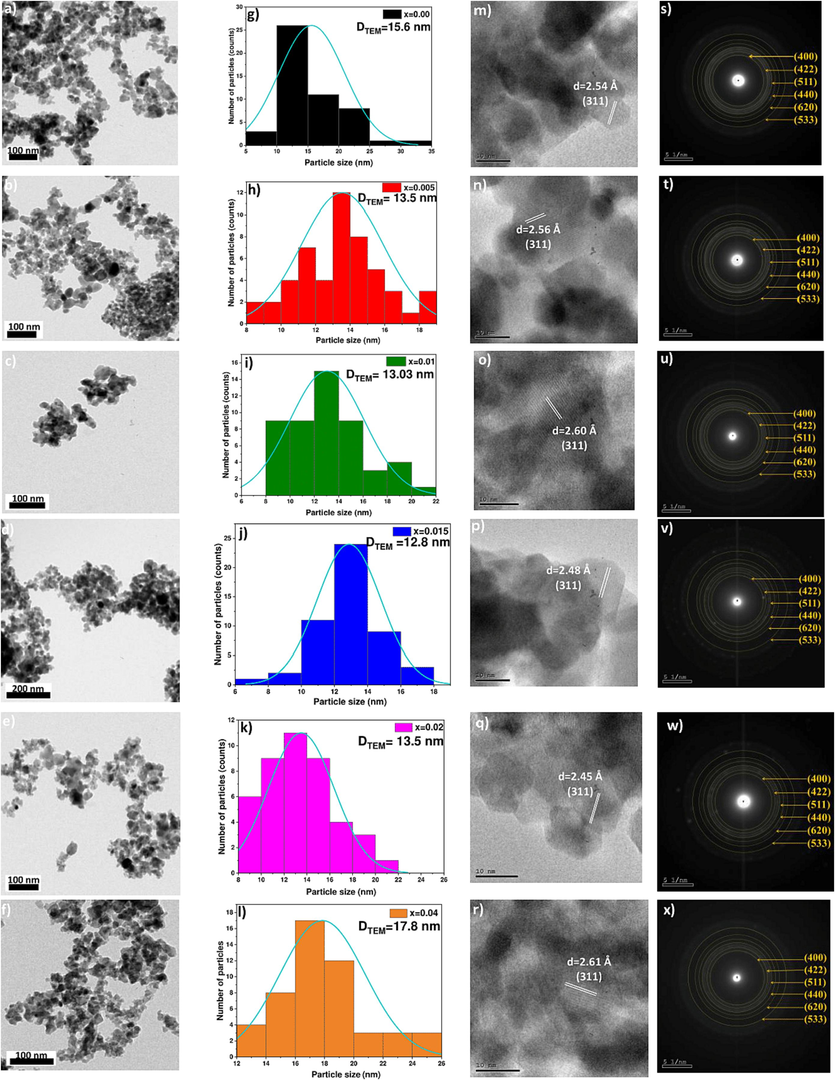
(a-f) TEM, (g-l) particle size distribution, (m-r) HRTEM, and (s-x) SAED images of (Cd0.4Ni0.4Mn0.2)Fe2-xRuxO4 nanoparticles where x = 0.00, 0.005, 0.01, 0.015, 0.02 and 0.04.
From the HRTEM images, shown in Fig. 2 (m-r), the interplaner distance was calculated using ImageJ software. The interplanar distance corresponding to the (3 1 1) plane of the most intense peak appears in HRTEM images of all the prepared samples. Thus, the HRTEM result is in good agreement with the XRD analysis. Furthermore, the selected area electron diffraction patterns (SAED) of (Cd0.4Ni0.4Mn0.2)Fe2-xRuxO4 NPs for the six samples are also shown in Fig. 2 (s-x). These SAED patterns consist of rings having bright spots over them that ensure the polycrystalline nature of the samples (Debnath & Das, 2020). The lattice fringes enabled the calculation of the d-spacing using ImageJ software. The calculation of d-spacing gave information about the plane types. In other words, the Miller indices were determined using the values of d-spacing, and thus the average lattice parameter was calculated for each sample. As shown in Fig. 3, the values lattice parameter calculated from SAED patterns is well matched with the results of XRD patterns. As Ru3+ content increased from 0 to 0.04, the lattice parameter obtained from MAUD software increased from 8.462 to 8.482 Å, and the values obtained from SAED images increased from 8.69 to 8.77 Å.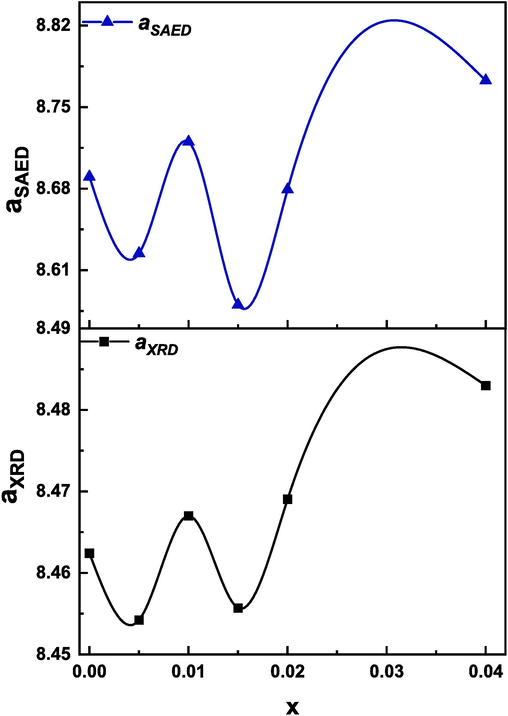
Variation of lattice parameter (aXRD and aSAED) for (Cd0.4Ni0.4Mn0.2)Fe2-xRuxO4 NPs where x = 0.00, 0.005, 0.01, 0.015, 0.02, and 0.04.
3.3 SEM and EDX analysis
Scanning electron microscopy (SEM) was used to study the morphology and size of pure and Ru-doped ferrite NPs. The SEM images, shown in Fig. 4, reveal the pseudo-spherical morphology of the prepared NPs. The agglomeration might be attributed to the magnet-dipole interactions among the NPs (Köseoğlu, 2015). As a result of the enhanced aggregate of the prepared NPs, the synthesized samples may exhibit excellent electrical properties (Vinod et al., 2022). The grain sizes of (Cd0.4Ni0.4Mn0.2)Fe2-xRuxO4 NPs, estimated from SEM analysis, are 32.7, 29.6, and 30.7 nm for x = 0.00, 0.02, and 0.04, respectively. The variations of the obtained grain size from SEM analysis are similar to those estimated from XRD and TEM results. However, the values of particle size are greater than the values obtained from XRD and TEM analysis. Thus, this validates the TEM discussion.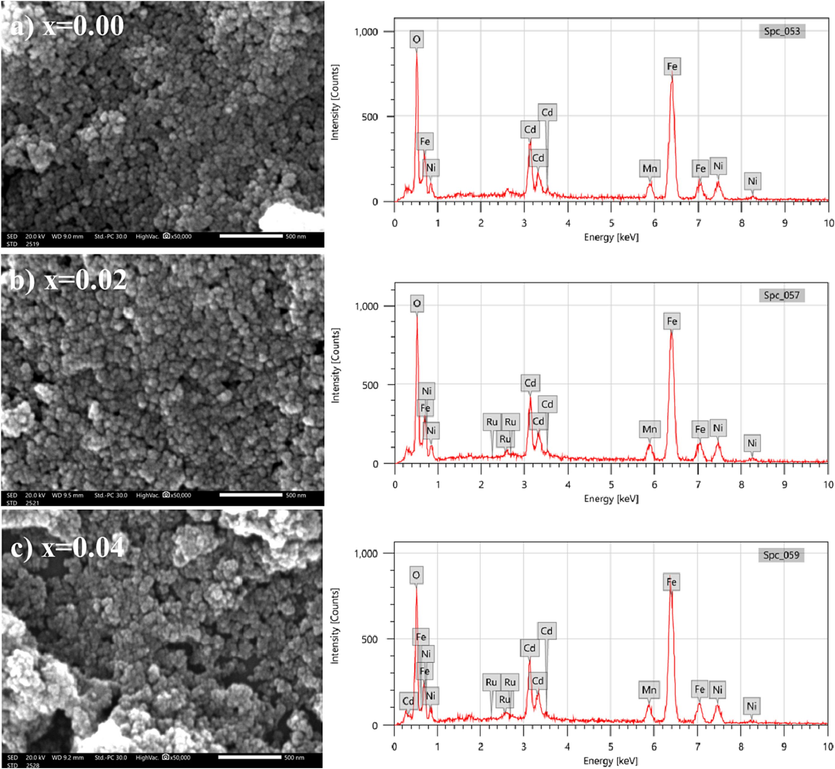
SEM images and EDX spectra of (Cd0.4Ni0.4Mn0.2)Fe2-xRuxO4 NPs where (a) x = 0.00, (b) x = 0.02 and (c) x = 0.04.
The energy dispersive X-ray spectroscopy (EDX) was carried out to study and validate the elemental compositions of (Cd0.4Ni0.4Mn0.2)Fe2-xRuxO4 NPs where x = 0.00, 0.02, and 0.04. The EDX spectra, represented in Fig. 4, revealed peaks related to the presence of Cd, Ni, Mn, Fe, O, and Ru. Thus, the purity of the prepared NPs (x = 0.00, 0.02, and 0.04) was confirmed by the absence of extra peaks in the EDX spectra. The quantitative EDX analysis was performed by which the atomic percentage of elements was calculated at different regions in the sample and compared with the theoretical values as listed in Table 3. The results indicate that the elements are homogeneously distributed. The experimental atomic percentage of the elements was comparable with the theoretically calculated values. Furthermore, the substitution of the host Fe3+ ions by the guest Ru3+ ions is identified from the decrease in the atomic percentage of Fe from 27.42 to 24.33 % accompanied by the increase in the atomic percentage of Ru from 0 to 0.47 % as the Ru content increases from 0 to 0.04 as shown in Fig. 5. It is important to note that the EDX analysis was done on 3 different regions for each sample. The regions analyzed for pure (Cd0.4Ni0.4Mn0.2)Fe2O4 NPs are displayed in Fig. 6. Furthermore, the obtained atomic % for each element in (Cd0.4Ni0.4Mn0.2)Fe2O4 NPs are listed in Table 4. It is clear that a similar atomic % is revealed for each element in the analyzed regions. Consequently, the composition and distribution of elements within the nanoparticles are uniform and not significantly varied in different areas of the sample.
x
0.00
0.02
0.04
Experimental atomic percentage %
Cd
5.18
0.07
5.55
0.11
5.07
0.10
Ni
5.02
0.17
5.42
0.19
4.94
0.17
Mn
2.85
0.09
2.67
0.12
2.54
0.11
Fe
26.61
0.33
26.35
0.23
24.33
0.30
Ru
0
0.20
0.04
0.47
0.03
O
60.36
0.04
60.36
0.78
63.09
0.73
Theoretical atomic percentage %
Cd
5.7
5.7
5.7
Ni
5.7
5.7
5.7
Mn
2.8
2.8
2.8
Fe
28.5
28.2
28
Ru
0
0.28
0.57
O
57.14
57.14
57.14
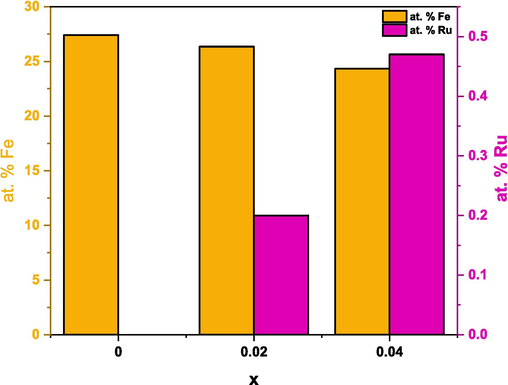
Variation of the atomic % of host (Fe) and guest (Ru) with Ru content.
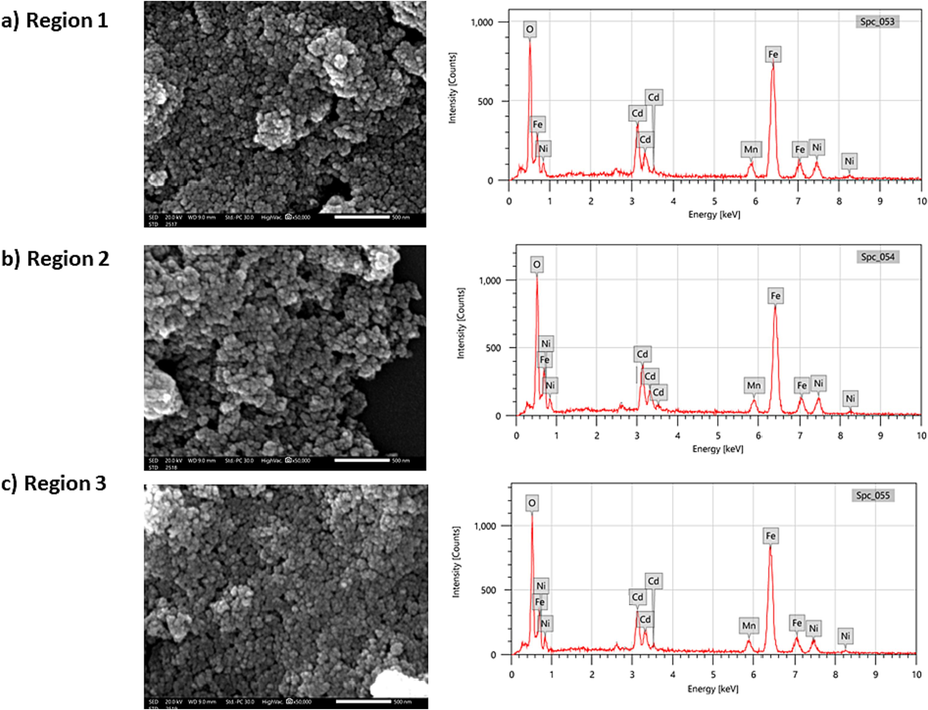
SEM images and EDX spectra of (Cd0.4Ni0.4Mn0.2)Fe2O4 NPs in 3 different regions.
Experimental atomic percentage %
Cd
Ni
Mn
Fe
O
Region 1
5.36
5.03
3.02
26.21
60.38
Region 2
5.12
5.37
2.90
26.19
60.42
Region 3
5.06
4.66
2.65
27.42
60.27
3.4 Surface area measurement
The N2 adsorption–desorption isotherms of (Cd0.4Ni0.4Mn0.2)Fe2-xRuxO4 NPs where x = 0.00, 0.015 and 0.04 along with pore size distribution curves are shown in Fig. 7. According to the IUPAC classification, the N2 adsorption–desorption isotherms display a type IV isotherm. Brunauer–Emmett–Teller (BET) analysis is applied to examine the surface area (SBET). Whereas the pore volume and diameter are determined via the Barrett–Joyner–Halenda (BJH) model. The values of SBET, pore volume, and pore diameter are listed in Table 5. As the Ru content increases from 0.00 to 0.04, SBET increases from 52.39 to 78.34 m2/g, respectively. Among the analyzed samples, (Cd0.4Ni0.4Mn0.2)Fe2-xRuxO4 NPs where x = 0.015 exhibit the highest pore volume and diameter. The pore diameter, ranging between 12.71 and 18.38 nm, reveals the mesoporous nature of the prepared samples (Aridi et al., 2023).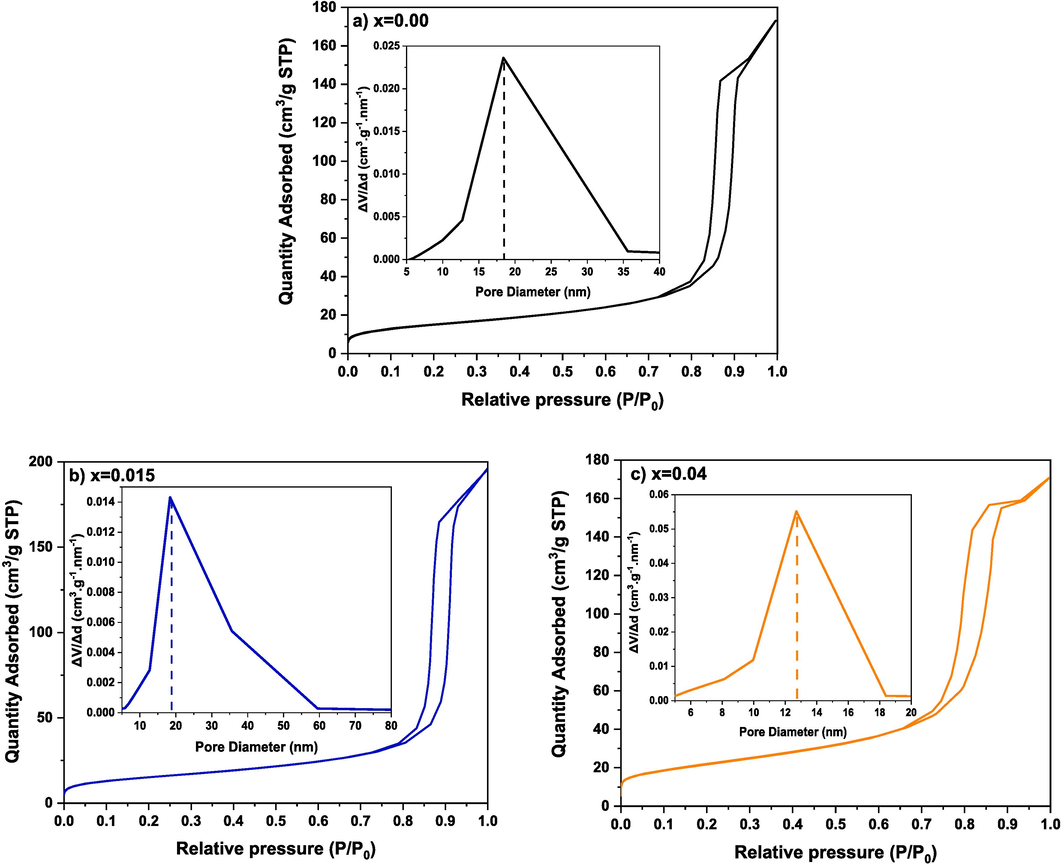
N2 adsorption–desorption isotherms along with pore size distribution curves of (Cd0.4Ni0.4Mn0.2)Fe2-xRuxO4 NPs where (a) x = 0.00, (b) x = 0.015, and (c) x = 0.04.
x
SBET (m2/g)
Pore volume (cm3/g)
Pore diameter (nm)
0.00
52.39
0.32
16.81
0.015
54.15
0.39
18.38
0.04
78.34
0.26
12.71
3.5 UV–vis analysis
The UV–vis absorbance spectra, represented in Fig. 8, were recorded at room temperature from 250 to 700 nm to estimate the optical bandgap energy of (Cd0.4Ni0.4Mn0.2)Fe2-xRuxO4 NPs. A major absorption peak appears in the range between 335 and 338 nm. The results of the maximum peak position are comparable with previous results at which the absorbance peak was around 300 nm (Sattar et al., 2022).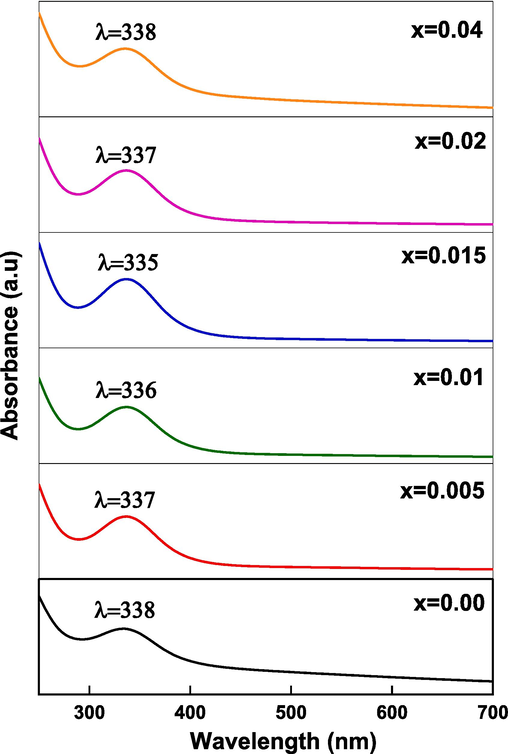
UV absorption spectra of (Cd0.4Ni0.4Mn0.2)Fe2-xRuxO4NPs.
Knowing that, the highest absorbance peak of nanosized magnetic materials takes a position in the range of 200–350 nm (Sattar et al., 2022). The bandgap energy of the prepared NPs was estimated by several methods and the results are listed in Table 6. Tauc’s equation was used to determine the bandgap energy and is represented as follows (Vinod et al., 2022):
x
Eg Tauc’s plot eV
Eg Absorbance eV
Egi eV
EU eV
0.00
3.049 ± 0.009
2.796 ± 0.004
1.894 ± 0.001
0.992 ± 0.009
0.005
3.215 ± 0.003
2.876 ± 0.002
2.572 ± 0.005
0.487 ± 0.005
0.01
3.223 ± 0.002
2.927 ± 0.003
2.606 ± 0.009
0.465 ± 0.004
0.015
3.232 ± 0.003
2.934 ± 0.002
2.642 ± 0.005
0.441 ± 0.004
0.02
3.221 ± 0.003
2.928 ± 0.002
2.598 ± 0.004
0.470 ± 0.009
0.04
3.128 ± 0.004
2.895 ± 0.003
2.214 ± 0.007
0.739 ± 0.002
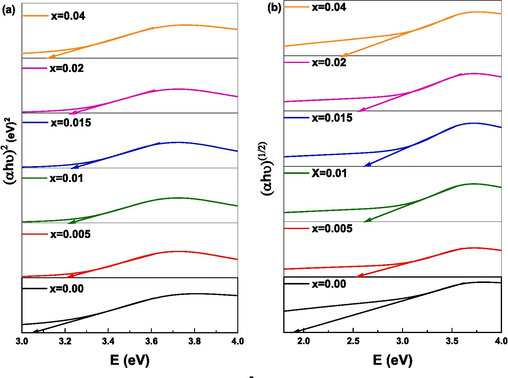
Tauc’s plot of (Cd0.4Ni0.4Mn0.2)Fe2-xRuxO4 NPs used to determine (a) direct bandgap energy and (b) indirect bandgap energy.
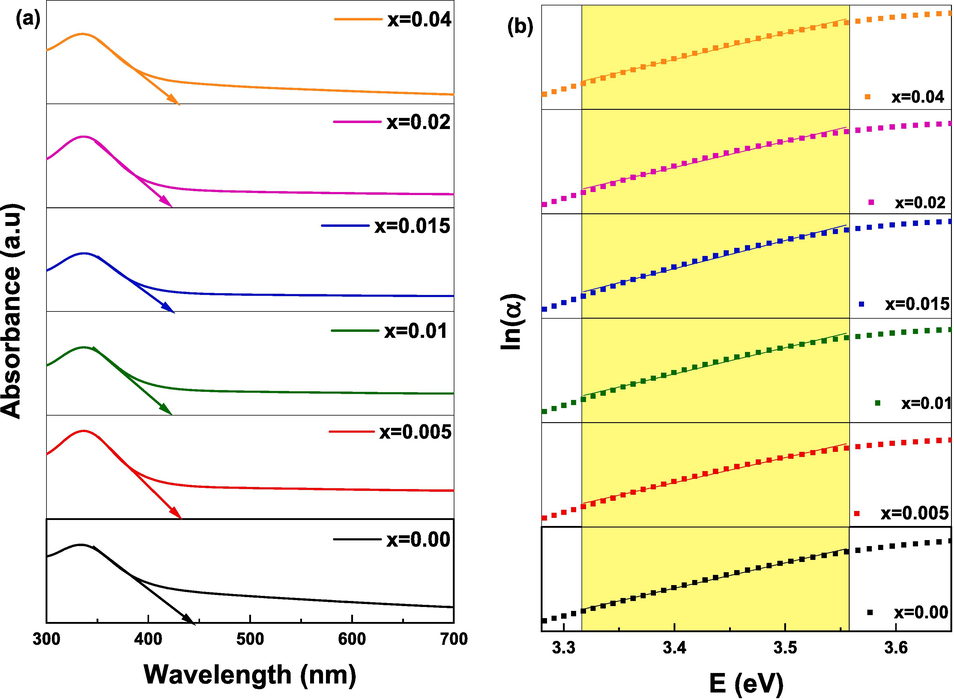
Plot of (a) direct bandgap energy determined from absorbance and (b) Urbach energy (EU) determination of (Cd0.4Ni0.4Mn0.2)Fe2-xRuxO4 NPs.
The values of direct bandgap energy Eg and indirect bandgap energy Egi increase as the Ru content increases from 0.00 to 0.015. Whereas, with further increase in Ru content (x = 0.04), the values of Eg and Egi reduced. This variation of Eg and Egi depends on the particle size, crystallinity, lattice constant, lattice strain, purity, nature and compositions of the dopant (Patade et al., 2020). It is worth mentioning that all doped NPs revealed lower EU values compared to pure NPs. Thus, the defects are diminished upon doping NPs with Ru. This is in good agreement with XRD results that showed a reduction in the secondary phase percentage upon doping NPs. An inverse relation between Eg and EU is observed as displayed in Fig. 11. Moreover, the Eg values are inversely proportional to the crystallite and particle size obtained from XRD and TEM analysis, respectively. This relationship is attributed to the variation of the lattice constant and quantum confinement effect (Singh et al., 2010). The reason behind the increase in the bandgap energy from 3.049 to 3.232 eV with the reduction in the particle size from 15.6 to 12.8 nm as x increases from 0 to 0.015 is owed to the quantum size effect (Zhou et al., 2019). Knowing that the quantum size effect leads to a blue shift of bandgap energy (Singh et al., 2010). Conversely, as x increases from 0.015 to 0.04, the particle size increases from 12.8 for to 17.8 nm whereas the energy gap decreases from 3.232 to 3.128 eV. This decrease is attributed to surface and interface effects, resulting in a red shift of the bandgap energy (Singh et al., 2010). Furthermore, similar results for the variation of particle size with the energy gap were observed in previous studies about Mn1-xZnxFe2O4 where the bandgap energy increased with the increase in zinc concentration and the crystallite size decreased (Patade et al., 2020).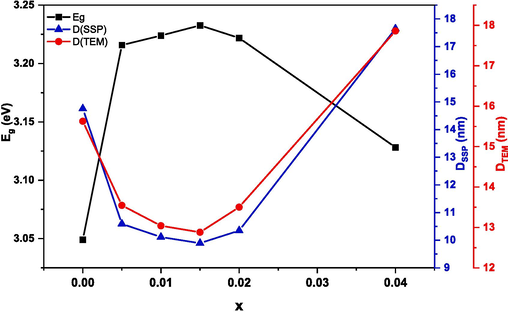
Variation of bandgap energy and particle size (DTEM and DSSP) of (Cd0.4Ni0.4Mn0.2)Fe2-xRuxO4 NPs where 0.00 ≤ x ≤ 0.04.
3.6 Adsorption performance of (Cd0.4Ni0.4Mn0.2)Fe2-xRuxO4 NPs
Doping ferrite NPs with rare earth metals improves their properties and enhances their effectiveness in wastewater treatment, particularly in dye removal (Ahmed et al., 2014; Keerthana et al., 2021). Therefore, the capability of (Cd0.4Ni0.4Mn0.2)Fe2-xRuxO4 NPs in the adsorption of CR dye was studied. For this study, 60 mg of each of (Cd0.4Ni0.4Mn0.2)Fe2-xRuxO4 NPs, where 0.00 ≤ x ≤ 0.04, was mixed with 150 mL of 30 ppm CR solution. The pseudo-first-order and pseudo-second-order models were used to study the adsorption kinetics of CR and the obtained equation and R2 values are listed in Table 7. The first-order kinetic model is given as follows (Konicki et al., 2013):
x
First-order kinetics
Second-order kinetics
Equation
R2
Equation
R2
0
y = −0.0179x + 3.5024
0.688
y = 0.0155x + 0.2219
0.972
0.005
y = −0.0176x + 3.5451
0.929
y = 0.0136x + 0.1184
0.997
0.01
y = −0.0196x + 3.7622
0.947
y = 0.0127x + 0.1416
0.995
0.015
y = −0.0079x + 3.1322
0.737
y = 0.0181x + 0.1212
0.986
0.02
y = −0.0133x + 3.0767
0.945
y = 0.0197x + 0.1532
0.997
0.04
y = −0.0025x + 3.5635
0.630
y = 0.0133x + 0.0895
0.997
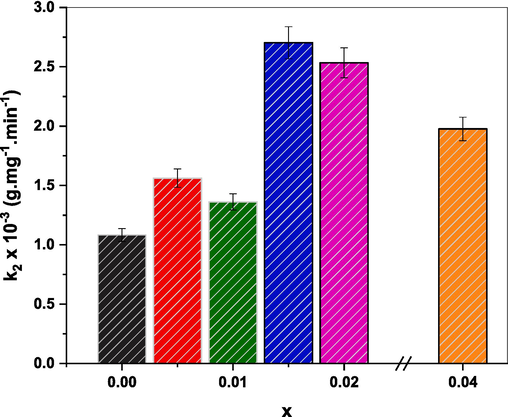
The adsorption rate constant (k2) of CR in the presence of (Cd0.4Ni0.4Mn0.2)Fe2-xRuxO4 NPs where x = 0.00, 0.005, 0.015, 0.02, and 0.04.
The first-order and second-order kinetics models do not provide an adequate explanation of the diffusion mechanism. Therefore, the intraparticle diffusion (IPD) model was employed in order to gain insights into the adsorption mechanism of CR dye onto (Cd0.4Ni0.4Mn0.2)Fe2-xRuxO4 NPs. The equation of the IPD model is expressed as follows (Zafar et al., 2022):
x
0.00
0.005
0.01
0.015
0.02
0.04
Region 1
ki
3.03
3.35
7.15
3.02
2.73
3.81
C
25.37
33.58
12.02
26.38
20.87
28.91
Region 2
ki
1.76
1.44
1.12
1.11
1.16
2.04
C
36.19
50.04
59.39
40.17
32.53
44.19
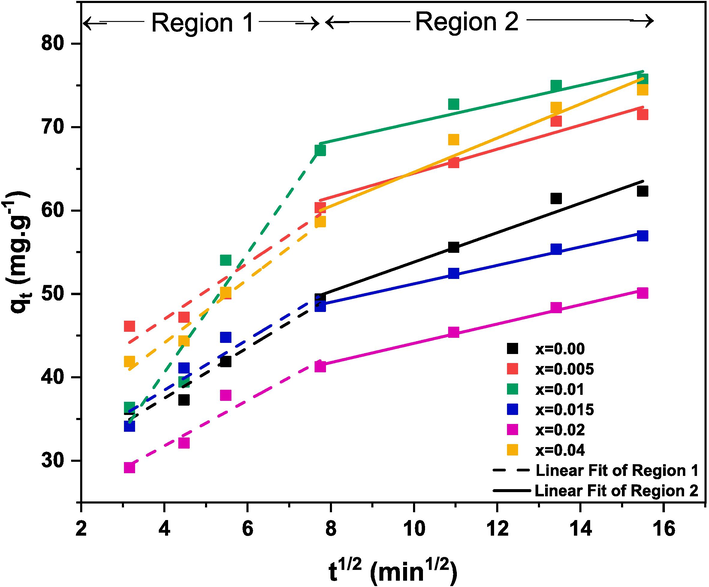
IPD model applied on CR adsorption data in the presence of (Cd0.4Ni0.4Mn0.2)Fe2-xRuxO4 (0.00 ≤ x ≤ 0.04) adsorbents.
3.6.1 Effect of contact time
By determining the optimal contact time, the efficiency of dye removal will be improved and the wastewater treatment time will be minimized. The influence of the contact time on the removal % of CR was studied by mixing 60 mg of (Cd0.4Ni0.4Mn0.2)Fe1.985Ru0.015O4 adsorbent with 150 mL of 30 ppm CR dye solution. The removal %, displayed in Fig. 14, was determined using the following formula:
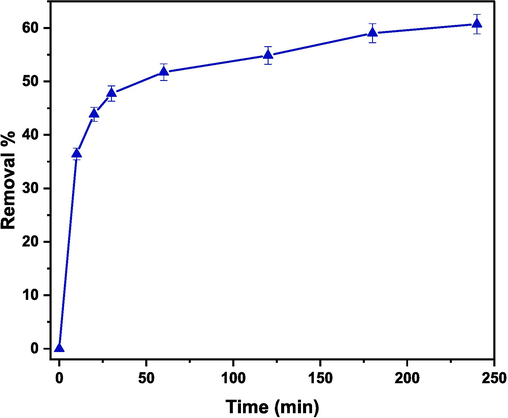
Effect of contact time on the removal of CR examined in the presence of (Cd0.4Ni0.4Mn0.2)Fe1.985Ru0.015O4 adsorbent.
Adsorbent
Adsorbent Dosage
CR dye concentration ppm
Removal %
Time min
qe
mg/g
Ref.
Cu0.5Co0.5Fe2O4
50 mg
100
–
–
38.69
(Liu et al., 2022)
MnFe2O4
100 mg
30
–
–
7.497
(Yang et al., 2014)
NiFe2O4
50 mg
30
–
–
38.47
(Tan et al., 2020)
MnFe2O4
0.05 g/L
62
–
–
11.1
(Pham, T. Nguyen, et al., 2019)
NiFe2O4
ZnFe2O4
CoFe2O4
1 g/L
50
23 %
12 %
19 %180
11.4
5.1
10(Samoila et al., 2015)
(Cd0.4Ni0.4Mn0.2)Fe1.985Ru0.015O4
60 mg
30
59.03
60.73180
24056.95
This study
3.6.2 Effect of adsorbent amount
To examine the influence of adsorbent amount on the rate of CR adsorption, various amounts (20, 40, 60, 80, and 100 mg) of (Cd0.4Ni0.4Mn0.2)Fe1.985Ru0.015O4 adsorbent were mixed with 150 mL of 30 ppm CR dye solution. Following the second-order kinetic model, the adsorption rate (k2) was calculated. The results, displayed in Fig. 15, reveal that the rate constant is boosted from 0.75 × 10⁻³ to reach 5.51 × 10⁻³ g.mg−1.min−1 as the adsorbent amount increases from 20 to 80 mg, respectively. This is due to the increase in the active sites upon increasing the adsorbent amount (Ali et al., 2018; Zeng et al., 2014). Whereas, the rate constant is diminished from 5.51 × 10⁻³ to reach 3.65 × 10⁻³ g.mg−1.min−1 as the adsorbent amount increased from 80 to 100 mg. This might be attributed to the aggregation of NPs in the presence of excess amounts leading to a reduction in the adsorption efficiency (Panda et al., 2021). Therefore, 80 mg is the optimum adsorbent amount of (Cd0.4Ni0.4Mn0.2)Fe1.985Ru0.015O4 used for the adsorption of CR dye.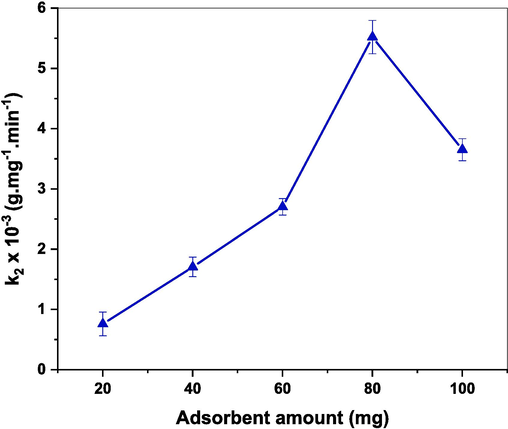
Effect of (Cd0.4Ni0.4Mn0.2)Fe1.985Ru0.015O4 adsorbent amount on adsorption rate of CR dye.
3.6.3 Effect of pH
Varying pH is an important factor that has a vital role in the adsorption mechanism since it regulates the charges of the adsorbent that affect the interaction with dye molecules (Wekoye et al., 2020). Consequently, the adsorption experiments have been carried out in the presence of 60 mg of (Cd0.4Ni0.4Mn0.2)Fe1.985Ru0.015O4 adsorbent in different mediums where the pH ranges between 2.99 and 11.01. The obtained results are displayed in Fig. 16. The rate constant of the adsorption reaction increased from 2.12 × 10⁻³ to 4.81 × 10⁻³ g.mg−1.min−1 as the pH increased from 2.99 to 3.45. Whereas, as the pH increased from 3.45 to 11.01, the rate constant decreased to reach 1.33 × 10⁻³ g.mg−1.min−1. As documented in previous studies, the point of zero charge (PZC) of CdFe2O4, NiFe2O4, and MnFe2O4 NPs were 6.9, 6.4, and 6.5 respectively (Douafer et al., 2023; Eyvazi et al., 2020; Fathy et al., 2022). It is known that NPs are positively charged in an acidic medium (pH < PZC) and negatively charged in a basic medium (pH > PZC) (An et al., 2015; Chauhan et al., 2020). Furthermore, CR, as an anionic dye, carries a negative charge. Thus, the electrostatic attraction between the positively charged NPs and the negatively charged CR dye molecules promotes adsorption which in turn boosts the rate of the adsorption process in an acidic medium (Sachin et al., 2023). In other words, opposite charges attract each other, leading to a higher affinity and stronger binding between the dye and the positively charged NPs. Conversely, at high pH, when both the dye and the NPs’ surface carry negative charges, the repulsion between them reduces the adsorption capacity and weakens the adsorption process (Chauhan et al., 2020). Thus, the highest adsorption rate of CR is achieved in an acidic medium where pH = 3.45. The results are comparable to previous studies that studied the adsorption capacity of cobalt ferrite NPs for the removal of CR dye at different pH values, and the highest adsorption rate was achieved in an acidic medium (Simonescu et al., 2021). By this, the adsorption capacity increased as the pH value increased to 4.5, and then it decreased as the pH increased up to 11.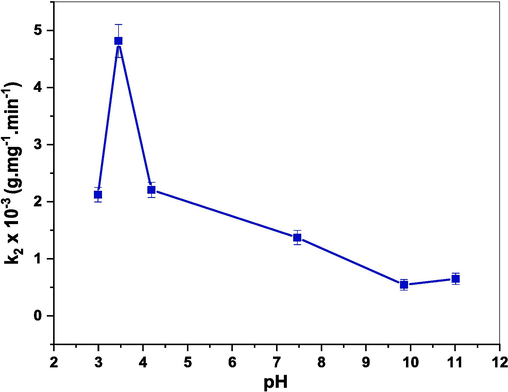
Effect of pH on rate constant (k2) of CR dye adsorption examined in the presence of (Cd0.4Ni0.4Mn0.2)Fe1.985Ru0.015O4 adsorbent.
3.6.4 Effect of temperature
To understand the temperature dependence, adsorption experiments were conducted at different temperatures (303, 308, 313, 318, and 323 K) in the presence of 60 mg of (Cd0.4Ni0.4Mn0.2)Fe1.985Ru0.015O4 adsorbent mixed with 150 mL of 30 ppm CR dye solution. The results, displayed in Fig. 17, show that as the reaction temperature increased from 303 to 308 K, the rate constant increased from 1.74 × 10⁻³ to 4.52 × 10⁻³ g.mg−1.min−1. It’s worth noting that increasing the reaction temperature provides energy, increases the mobility of the NPs and dye molecules, and improves the adsorption process (Panda et al., 2021). However, the rate constant is diminished to 1.43 × 10⁻³ g.mg−1.min−1 with a further increase in the reaction temperature to reach 323 K. Thus, increasing the reaction temperature above 308 K is unfavorable for CR adsorption. This result is comparable to previous studies where 35 °C represents the best temperature for the removal of CR dye from an aqueous system (Muedi et al., 2022).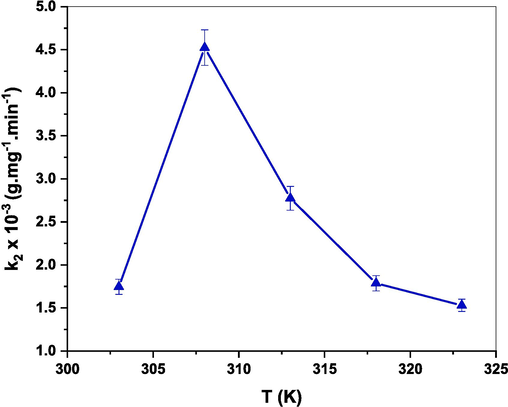
Effect of temperature on rate constant (k2) of the adsorption process of CR dye using (Cd0.4Ni0.4Mn0.2)Fe1.985Ru0.015O4 adsorbent.
3.6.5 Thermodynamic parameters
Thermodynamic parameters can be determined by conducting adsorption experiments at different temperatures. These parameters include the change in the enthalpy (ΔH0), the change in the entropy (ΔS0) and the change in the Gibbs free energy (ΔG0) and are listed in Table 10. The following equations are used to determine the thermodynamic parameters (Etemadinia et al., 2019; Subbaiah Munagapati et al., 2022):
T K
ΔH0 kJ.mol−1
ΔS0 J.mol−1.K−1
ΔG0 J.mol−1
308
−14.02
−26.94
−5683.84
313
−5648.78
318
−5430.89
323
−5305.12
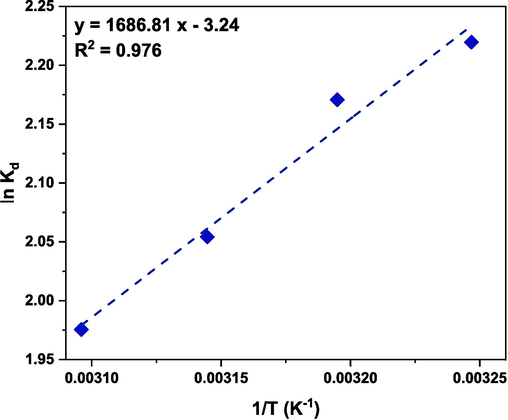
Plot of lnKd versus 1/T.
3.6.6 Optimum experimental conditions for CR adsorption
Optimized experimental conditions, mainly optimum adsorbent amount, pH, and temperature, were applied. To do so, 80 mg of (Cd0.4Ni0.4Mn0.2)Fe1.985Ru0.015O4 NPs were mixed with 150 mL of 30 ppm CR dye solution having a pH value of 3.45 at 308 K. The results of this experiment, carried out three times, are represented in Fig. 19. The adsorption rate constant was estimated to be 10.7 × 10⁻³ g.mg−1.min−1. Furthermore, 87.5 and 88.5 % of CR dye was adsorbed after 60 and 120 min, respectively, as displayed in Fig. 19 (b). Thus, the rate of adsorption reaction and removal % are boosted upon applying the optimum experimental conditions.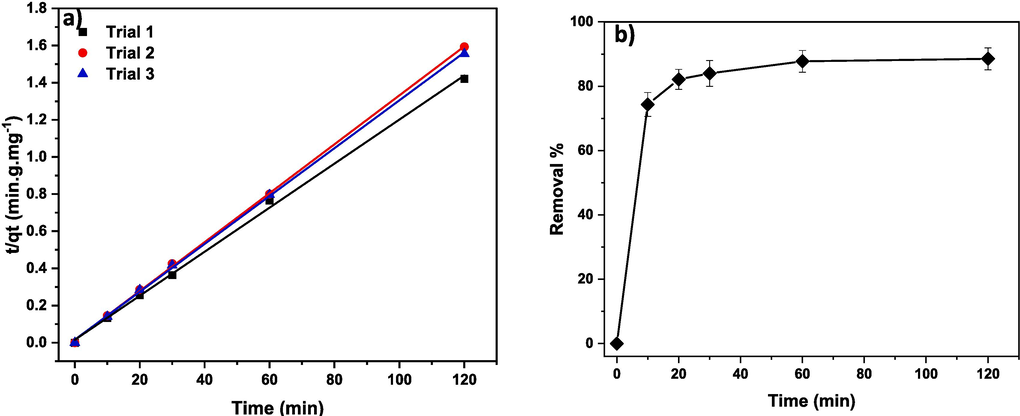
(a) The kinetic plot of t/qt and (b) removal % versus time in the presence of (Cd0.4Ni0.4Mn0.2)Fe1.985Ru0.015O4 adsorbent.
3.6.7 Reusability of (Cd0.4Ni0.4Mn0.2)Fe1.985Ru0.015O4 adsorbent
The regeneration ability and stability of adsorbents are key factors in determining the practicality and effectiveness of adsorption processes (Hassan et al., 2020; M. El-Metwaly et al., 2022). It promotes sustainability, cost-effectiveness, and resource conservation while enabling more efficient and reliable industrial processes and environmental remediation efforts (Almahri et al., 2023a). Therefore, the reusability of (Cd0.4Ni0.4Mn0.2)Fe1.985Ru0.015O4 adsorbent was studied by applying the optimum experimental conditions for 4 consecutive cycles. As displayed in Fig. 20, around 87.5 % of CR dye was adsorbed in the 4 cycles. The adsorbent regeneration was achieved by rinsing first with ethanol solution and then with water (Pham et al., 2019). Knowing that (Cd0.4Ni0.4Mn0.2)Fe1.985Ru0.015O4 adsorbents are magnetic nanoparticles, they were easily separated from the solution by using a magnet without the need for centrifugation or filtration. (Cd0.4Ni0.4Mn0.2)Fe1.985Ru0.015O4 adsorbent can be used for up to 4 cycles without a significant loss in the adsorption activity as demonstrated in Fig. 20. Thus, the prepared adsorbent preserves an improved adsorption activity after reusing.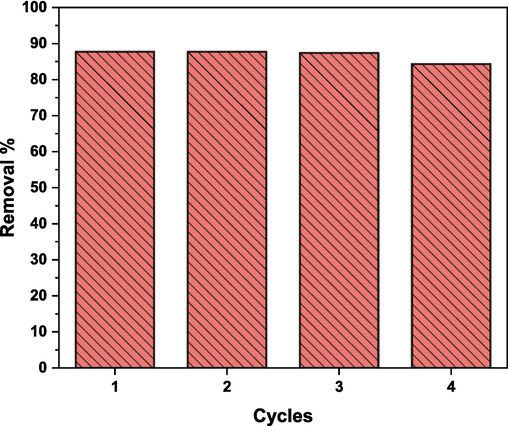
Reusability of (Cd0.4Ni0.4Mn0.2)Fe1.985Ru0.015O4 adsorbent for CR adsorption.
3.6.8 Adsorption isotherms
Adsorption isotherms are essential to determine the adsorption phenomena between the CR dye and (Cd0.4Ni0.4Mn0.2)Fe1.985Ru0.015O4 adsorbent, and to gain more insight about the mechanism of adsorption. Therefore, the adsorption reaction was carried out in the presence of 60 mg of (Cd0.4Ni0.4Mn0.2)Fe1.985Ru0.015O4 adsorbent with varying the initial concentration of CR dye (0–50 ppm). For the present adsorbate-adsorbent system, three non-linear adsorption isotherms models were used mainly Langmuir, Freundlich, and Temkin and the results are displayed in Fig. 21. The Langmuir adsorption isotherm model proposed that there is no intermolecular interaction between the adsorbate molecules and the adsorption of CR dye molecule is only limited to monolayer (Li et al., 2021; Mishra et al., 2020). In other words, adsorption occurs only when the dye molecules collide with the surface of (Cd0.4Ni0.4Mn0.2)Fe1.985Ru0.015O4 adsorbent (Li et al., 2021). The equation of Langmuir isotherm (Simonescu et al., 2021):
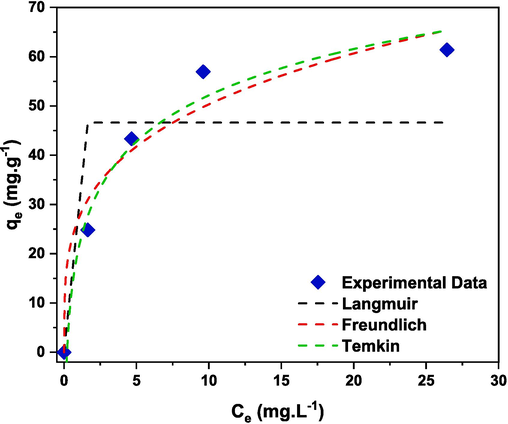
The fitting plots of non-linear Langmuir, Freundlich, and Temkin isotherm for adsorption of CR on (Cd0.4Ni0.4Mn0.2)Fe1.985Ru0.015O4 adsorbent.
Isotherm model
Parameter
Parameter value
Langmuir
QL (mg.g−1)
46.64
bL (L.mg−1)
−1.55
R2
0.682
Freundlich
KF ((mg.g−1)(mg.L−1)1/n)
27.09
N
3.72
R2
0.957
Temkin
KT (L.mg−1)
4.71
bT (J.mol−1)
182.91
R2
0.979
4 Conclusion
(Cd0.4Ni0.4Mn0.2)Fe2-xRuxO4 NPs (0.00 ≤ x ≤ 0.04) were successively prepared by the co-precipitation method. Upon increasing the Ru3+ content, the percentage of the hematite phase decreased. This confirmed the successful incorporation of the dopants’ ions with the nanoferrites without forming secondary phases. The mean particle size of the prepared NPs ranged between 12 and 17 nm as revealed from the TEM analysis. Besides, the SEM analysis revealed the pseudo-spherical morphology of the NPs. The elemental composition of the ferrite nanoparticles was validated and the experimental atomic percentage of the elements was comparable with the theoretically calculated values. The direct and indirect bandgap energy and the Urbach energy of the synthesized ferrite NPs were in the range of 3.05–3.23 eV, 1.89–2.64 eV, and 0.99–0.73 eV, respectively. Among the prepared samples, the sample with x = 0.015 showed the highest adsorption rate and 60.73 % of CR dye was removed after 240 min. The adsorption rate of this sample was examined at different conditions, and it revealed that the best adsorption conditions were 80 mg of adsorbent amount, 308 K and a pH of 3.45. (Cd0.4Ni0.4Mn0.2)Fe2-xRuxO4 NPs with x = 0.015 preserved an improved adsorption activity after being reused for 4 cycles. Furthermore, different models were examined to discuss the adsorption isotherm and the experimental data were correlated with the Temkin isotherm model.
Acknowledgments
This work was performed in the Advanced Nanomaterials Research Lab and Specialized Materials Science Lab at Beirut Arab University in collaboration with Alexandria University.
Funding
This research did not receive any specific grant from funding agencies in the public, commercial, or not-for-profit sectors.
Declaration of competing interest
The authors declare that they have no known competing financial interests or personal relationships that could have appeared to influence the work reported in this paper.
References
- La3+ doped LiCo0.25Zn0.25Fe2O4 spinel ferrite nanocrystals: Insights on structural, optical and magnetic properties. J. Rare Earths. 2021;39(1):75-82.
- [CrossRef] [Google Scholar]
- ZnO and Ni-doped ZnO photocatalysts: Synthesis, characterization and improved visible light driven photocatalytic degradation of methylene blue. Inorg. Chim. Acta. 2022;543:121167
- [CrossRef] [Google Scholar]
- Promising wastewater treatment using rare earth-doped nanoferrites. J. Magn. Magn. Mater.. 2014;350:73-80.
- [CrossRef] [Google Scholar]
- Manganese ferrite (MnFe2O4) Nanoparticles: From synthesis to application -A review. J. Ind. Eng. Chem.. 2021;103:292-304.
- [CrossRef] [Google Scholar]
- Sorption of cationic malachite green dye on phytogenic magnetic nanoparticles functionalized by 3-marcaptopropanic acid. RSC Adv.. 2018;8(16):8878-8897.
- [CrossRef] [Google Scholar]
- Highly efficient adsorption and removal bio-staining dye from industrial wastewater onto mesoporous Ag-MOFs. Process Saf. Environ. Prot.. 2023;172:395-407.
- [CrossRef] [Google Scholar]
- Adsorption and removal of the harmful pesticide 2,4-dichlorophenylacetic acid from an aqueous environment via coffee waste biochar: Synthesis, characterization, adsorption study and optimization via Box-Behnken design. J. Mol. Struct.. 2023;1293:136238
- [CrossRef] [Google Scholar]
- Atrazine reclamation from an aqueous environment using a ruthenium-based metal-organic framework. Process Saf. Environ. Prot.. 2023;177:52-68.
- [CrossRef] [Google Scholar]
- Adsorption and effective removal of organophosphorus pesticides from aqueous solution via novel metal-organic framework: Adsorption isotherms, kinetics, and optimization via Box-Behnken design. J. Mol. Liq.. 2023;384:122206
- [CrossRef] [Google Scholar]
- Enhancement removal of crystal violet dye using magnetic calcium ferrite nanoparticle: Study in single- and binary-solute systems. Chem. Eng. Res. Des.. 2015;94:726-735.
- [CrossRef] [Google Scholar]
- Structural, optical, magnetic and anti-bacterial properties of green synthesized spinel zinc ferrite by microwave-assisted method. Mater. Chem. Phys.. 2023;301:127641
- [CrossRef] [Google Scholar]
- Synthesis and characterization of ZnFe2O4/ Mn2O3 nanocomposites. Appl. Phys. A. 2021;127(3):206.
- [CrossRef] [Google Scholar]
- Enhanced adsorption performance of magnetic Ni0.5Zn0.5Fe2O4/Zn0.95Co0.05O nanocomposites for the removal of malachite green dye. In: Environmental Science and Pollution Research. 2023.
- [CrossRef] [Google Scholar]
- Preparation and Characterization of ZnFe2O4/Mn2O3 Nanocatalysts for the Degradation of Nitrobenzene. Chem. Afr. 2023:1-14.
- [Google Scholar]
- Impact of Dy2O3 Substitution on the Physical, Structural and Optical Properties of Lithium–Aluminium–Borate Glass System. Appl. Sci.. 2020;10(22) Article 22
- [CrossRef] [Google Scholar]
- Microstructural and magnetic characterization of Ni0.5Zn0.5Fe2O4 ferrite nanoparticles. J. Phys. Chem. Solid. 2019;129:1-21.
- [CrossRef] [Google Scholar]
- Strontium-based nanomaterials for the removal of organic/inorganic contaminants from water: A review. Coord. Chem. Rev.. 2023;492:215286
- [CrossRef] [Google Scholar]
- Basma, H., Al Boukhari, J., Abd Al Nabi, M., Aridi, A., Sayed Hassan, R., Naoufal, D., Roumie, M., & Awad, R. (2022). Enhancement of the magnetic and optical properties of Ni0.5Zn0.5Fe2O4 nanoparticles by ruthenium doping. Applied Physics A, 128(5), 409. https://doi.org/10.1007/s00339-022-05552-7.
- Efficient tetracycline removal from aqueous solutions using ionic liquid modified magnetic activated carbon (IL@mAC) J. Environ. Chem. Eng.. 2021;9(6):106570
- [CrossRef] [Google Scholar]
- Bazrafshan, E., dahmardeh, Z., Mohammadi, L., NadeemZafar, M., Dargahi, A., & Pirdadeh, F. (2023). Synthesis of magnesium oxide nanoparticles and its application for photocatalytic removal of furfural from aqueous media: Optimization using response surface methodology. Arabian Journal of Chemistry, 16(8), 104998. https://doi.org/10.1016/j.arabjc.2023.104998.
- Doping Independent Work Function and Stable Band Gap of Spinel Ferrites with Tunable Plasmonic and Magnetic Properties. Nano Lett.. 2021;21(22):9780-9788.
- [CrossRef] [Google Scholar]
- Green fabrication of ZnO nanoparticles using Eucalyptus spp. Leaves extract and their application in wastewater remediation. Chemosphere. 2020;247:125803
- [CrossRef] [Google Scholar]
- Chehade, W., Basma, H., Abdallah, A. M., Hassan, R. S., & Awad, R. (2022). Synthesis and magneto-optical studies of novel Ni0. 5Zn0. 5Fe2O4/Zn0. 95Co0. 05O nanocomposite as a candidate for photocatalytic applications. Ceramics International, 48(1), 1238–1255.
- The correction of the line profiles for x-ray diffraction peaks by using three analysis methods. AIP Conf. Proc.. 2019;2123(1):020044
- [CrossRef] [Google Scholar]
- Study of the optical properties of Zn doped Mn spinel ferrite nanocrystals shows multiple emission peaks in the visible range –a promising soft ferrite nanomaterial for deep blue LED. J. Mol. Struct.. 2020;1199:127044
- [CrossRef] [Google Scholar]
- Synthesis and characterization of CdFe2O4 nanoparticles: Application for the removal of Methyl Green under solar irradiation. Mater. Today Commun.. 2023;35:105630
- [CrossRef] [Google Scholar]
- M. El-Metwaly, N., A. Katouah, H., El-Desouky, M. G., El-Bindary, A. A., & El-Bindary, M. A. (2022). Fabricating of Fe 3 O 4 @Ag-MOF nanocomposite and evaluating its adsorption activity for removal of doxorubicin. Journal of Environmental Science and Health, Part A, 57(13–14), 1099–1115. https://doi.org/10.1080/10934529.2022.2156230.
- Removal of congo red dye from aqueous solutions using znfe2o4/sio2/Tragacanth gum magnetic nanocomposite as a novel adsorbent. Surf. Interfaces. 2019;14:117-126.
- [CrossRef] [Google Scholar]
- Synthesis of nano-magnetic MnFe2O4 to remove Cr(III) and Cr(VI) from aqueous solution: A comprehensive study. Environ. Pollut.. 2020;265:113685
- [CrossRef] [Google Scholar]
- Novel magnetic nickel ferrite nanoparticles modified with poly (aniline-co-o-toluidine) for the removal of hazardous 2, 4-dichlorophenol pollutant from aqueous solutions. RSC Advances. 2022;12(12):7433-7445.
- [Google Scholar]
- Synthesis of coral-like structures of Pr–Yb co-doped YIG: Structural, optical, magnetic and antimicrobial properties. J. Rare Earths 2023
- [CrossRef] [Google Scholar]
- Synthesis and characterization of poly(styrene-block-acrylic acid) diblock copolymer modified magnetite nanocomposite for efficient removal of penicillin G. Compos. B Eng.. 2020;182:107643
- [CrossRef] [Google Scholar]
- Development of dielectric and magnetic properties of advanced nano-engineering composites. Egypt. J. Chem.. 2022;65(11):141-154.
- [Google Scholar]
- Synthesis and characterization of ZnO nanoparticles via zeolitic imidazolate framework-8 and its application for removal of dyes. J. Mol. Struct.. 2020;1210:128029
- [CrossRef] [Google Scholar]
- Rare earth metal (Sm) doped zinc ferrite (ZnFe2O4) for improved photocatalytic elimination of toxic dye from aquatic system. Environ. Res.. 2021;197:111047
- [CrossRef] [Google Scholar]
- Photocatalytic application of spinel ferrite nanoparticles and nanocomposites in wastewater treatment: Review. Sustain. Mater. Technol.. 2020;23:e00140.
- [Google Scholar]
- Spinel ferrite nanoparticles and nanocomposites for biomedical applications and their toxicity. Mater. Sci. Eng. C. 2020;107:110314
- [CrossRef] [Google Scholar]
- Equilibrium and kinetic studies on acid dye Acid Red 88 adsorption by magnetic ZnFe2O4 spinel ferrite nanoparticles. J. Colloid Interface Sci.. 2013;398:152-160.
- [CrossRef] [Google Scholar]
- Structural and magnetic properties of Cr doped NiZn-ferrite nanoparticles prepared by surfactant assisted hydrothermal technique. Ceram. Int.. 2015;41(5, Part A):6417-6423.
- [CrossRef] [Google Scholar]
- Kumar, G., Shah, J., Kotnala, R. K., Singh, V. P., Sarveena, Garg, G., Shirsath, S. E., Batoo, K. M., & Singh, M. (2015). Superparamagnetic behaviour and evidence of weakening in super-exchange interactions with the substitution of Gd3+ ions in the Mg–Mn nanoferrite matrix. Materials Research Bulletin, 63, 216–225. https://doi.org/10.1016/j.materresbull.2014.12.009.
- Impact of Gd3+ doping on structural, electronic, magnetic, and photocatalytic properties of MnFe2O4 nanoferrites and application in dye-polluted wastewater remediation. Environ. Sci. Pollut. Res.. 2023;30(7):18820-18842.
- [CrossRef] [Google Scholar]
- Adsorption of congo red dye from aqueous solutions by prepared activated carbon with oxygen-containing functional groups and its regeneration. Adsorpt. Sci. Technol.. 2019;37(1–2):160-181.
- [CrossRef] [Google Scholar]
- Synthesis, structural, optical and dispersion parameters of La-doped spinel zinc ferrites ZnFe2-xLaxO4 (x = 0.00, 0.001, 0.005, 0.01 and 0.015) Vacuum. 2020;182:109780
- [CrossRef] [Google Scholar]
- Adsorption and electrochemical behavior investigation of methyl blue onto magnetic nickel-magnesium ferrites prepared via the rapid combustion process. J. Alloys Compounds. 2021;885:160969
- [CrossRef] [Google Scholar]
- Rapid selective separation and recovery of a specific target dye from mixture consisted of different dyes by magnetic Ca-ferrites nanoparticles. Chem. Eng. J.. 2015;262:517-526.
- [CrossRef] [Google Scholar]
- Combustion process for magnetic copper–cobalt ferrite and its Congo red adsorption property. Mater. Res. Express. 2022;9(7):075003
- [CrossRef] [Google Scholar]
- The influence of manganese ions doping on nanosheet assembly NiFe2O4 for the removal of Congo red. J. Alloy. Compd.. 2018;763:771-780.
- [CrossRef] [Google Scholar]
- Enhancement in magnetic and dielectric properties of the ruthenium-doped copper ferrite(Ru-CuFe2O4) nanoparticles. J. Magnet. Magnet. Mater.. 2019;476:18-23.
- [CrossRef] [Google Scholar]
- An overview of the structure and magnetism of spinel ferrite nanoparticles and their synthesis in microemulsions. Chem. Eng. J.. 2007;129(1):51-65.
- [CrossRef] [Google Scholar]
- Cobalt ferrite nanoparticles prepared by microwave hydrothermal synthesis and adsorption efficiency for organic dyes: Isotherms, thermodynamics and kinetic studies. Adv. Powder Technol.. 2020;31(11):4552-4562.
- [CrossRef] [Google Scholar]
- Modeling of phenol removal from water by NiFe2O4 nanocomposite using response surface methodology and artificial neural network techniques. J. Environ. Chem. Eng.. 2021;9(4):105576
- [CrossRef] [Google Scholar]
- Muedi, K. L., Masindi, V., Maree, J. P., Haneklaus, N., & Brink, H. G. (2022). Effective Adsorption of Congo Red from Aqueous Solution Using Fe/Al Di-Metal Nanostructured Composite Synthesised from Fe(III) and Al(III) Recovered from Real Acid Mine Drainage. Nanomaterials, 12(5), Article 5. https://doi.org/10.3390/nano12050776.
- Magnetite nanoparticles as sorbents for dye removal: A review. Environ. Chem. Lett.. 2021;19(3):2487-2525.
- [CrossRef] [Google Scholar]
- Impact of crystallites on enhancement of bandgap of Mn1-xZnxFe2O4 (1 ≥ x ≥ 0) nanospinels. Chem. Phys. Lett.. 2020;745:137240
- [CrossRef] [Google Scholar]
- Patil, A. D., Patange, S. M., Dighe, P. M., Shaikh, S. F., Rana, A. ul H. S., Pandit, B., & Jadhav, S. S. (2022). Tuning the structural, optical and magnetic properties of NiCuZn (Ni0.4Cu0.3Zn0.3Fe2O4) spinel ferrites by Nb2O5 additive. Ceramics International. https://doi.org/10.1016/j.ceramint.2022.06.016.
- Kinetics, Isotherm, Thermodynamics, and Recyclability of Exfoliated Graphene-Decorated MnFe 2 O 4 Nanocomposite Towards Congo Red Dye. J. Chem.. 2019;2019:1-16.
- [CrossRef] [Google Scholar]
- What Does Nanoparticle Stability Mean? J. Phys. Chem. C. 2019;123(27):16495-16507.
- [CrossRef] [Google Scholar]
- Investigation of the structural, magnetic and dielectric properties of Mn-doped Bi2Fe4O9 produced by reverse chemical co-precipitation. Mater. Chem. Phys.. 2019;229:39-48.
- [CrossRef] [Google Scholar]
- Synthesis and adsorption properties of nanocrystalline ferrites for kinetic modeling development. Int. J. Appl. Ceram. Technol.. 2019;16(2):693-705.
- [CrossRef] [Google Scholar]
- Green synthesis of zinc oxide nanoparticles using lychee peel and its application in anti-bacterial properties and CR dye removal from wastewater. Chemosphere. 2023;327:138497
- [CrossRef] [Google Scholar]
- Nanosized spinel ferrites synthesized by sol-gel autocombustion for optimized removal of azo dye from aqueous solution. J. Nanomater.. 2015;16(1):237:237.
- [CrossRef] [Google Scholar]
- Low sintering effect on structural, electrical and magnetic properties of rare-earth metal ion Er3+-substituted nickel–zinc spinal ferrites. J. Mater. Sci. Mater. Electron.. 2022;33(2):635-651.
- [CrossRef] [Google Scholar]
- Sarveena. (2021). Chapter 11—Structural and Magnetic Properties of Ni Nanoferrites Doped With Rare Earth and Transition Metals. In G. K. Bhargava, S. Bhardwaj, M. Singh, & K. M. Batoo (Eds.), Ferrites and Multiferroics: Fundamentals to Applications (pp. 91–106). Springer. https://doi.org/10.1007/978-981-16-7454-9_5.
- Detailed analysis of structural, optical and photo catalytic properties of spinel nickel doped magnesium zinc ferrites at different substitutions. Inorg. Chem. Commun.. 2022;142:109505
- [CrossRef] [Google Scholar]
- Characterization of grain structure in nanocrystalline gadolinium by high-resolution transmission electron microscopy. J. Materi. Res.. 2009;24
- [CrossRef] [Google Scholar]
- Facile Synthesis of Cobalt Ferrite (CoFe2O4) Nanoparticles in the Presence of Sodium Bis (2-ethyl-hexyl) Sulfosuccinate and Their Application in Dyes Removal from Single and Binary Aqueous Solutions. Nanomaterials. 2021;11(11) Article 11
- [CrossRef] [Google Scholar]
- Comparative Study of CoFe2O4 Nanoparticles and CoFe2O4-Chitosan Composite for Congo Red and Methyl Orange Removal by Adsorption. Nanomaterials. 2021;11(3):711.
- [CrossRef] [Google Scholar]
- Optical Behaviour of Zinc Ferrite Nanoparticles. AIP Conf. Proc.. 2010;1276(1):137-143.
- [CrossRef] [Google Scholar]
- Structural, magnetic, elastic, dielectric and electrical properties of hot-press sintered Co1−xZnxFe2O4 (x=0.0, 0.5) spinel ferrite nanoparticles. J. Magnet. Magnet. Mater.. 2018;447:48-57.
- [CrossRef] [Google Scholar]
- Magnetic Fe3O4 nanoparticles loaded papaya (Carica papaya L.) seed powder as an effective and recyclable adsorbent material for the separation of anionic azo dye (Congo Red) from liquid phase: Evaluation of adsorption properties. J. Mole. Liq.. 2022;345:118255
- [CrossRef] [Google Scholar]
- Structural, electrical and magnetic studies of Ni0.7Mn0.2Cu0.1Fe2-xAlxO4 (x = 0, 0.05, 0.1, 0.15, 0.2 and 0.25) nano-ferrite synthesized by sol-gel technique. Chin. J. Phys.. 2022;80:334-348.
- [CrossRef] [Google Scholar]
- Kinetic and Isotherm Modelling of the Adsorption of Congo Red Dye onto NiFe2O4 and NiFe2O4 decorated Exfoliated Graphite. IOP Conf. Ser.: Mater. Sci. Eng.. 2020;991(1):012085
- [CrossRef] [Google Scholar]
- Taneja, S., Thakur, P., Kumar, R., Hemalatha, S., Slimani, Y., Ravelo, B., & Thakur, A. (2022). Nanostructured Rare Earth Nd3+doped Nickel–Zinc–Bismuth Spinel Ferrites: Structural, Electrical and Dielectric Studies. Ceramics International, 48(19, Part A), 27731–27738. https://doi.org/10.1016/j.ceramint.2022.06.073.
- Superparamagnetic La doped Mn–Zn nano ferrites: Dependence on dopant content and crystallite size. Mater. Res. Express. 2016;3(7):075001
- [CrossRef] [Google Scholar]
- Dysprosium doped Cu0.8Cd0.2DyxFe2-xO4 nano ferrites: A combined impact of Dy3+ on enhanced physical, optical, magnetic, and DC-electrical properties. Ceram. Int. 2022
- [CrossRef] [Google Scholar]
- The development of a new efficient adsorbent for the removal of methylene blue. Sep. Sci. Technol.. 2016;51(15–16):2511-2518.
- [CrossRef] [Google Scholar]
- Kinetic and equilibrium studies of Congo red dye adsorption on cabbage waste powder. Environ. Chem. Ecotoxicol.. 2020;2:24-31.
- [CrossRef] [Google Scholar]
- Removal of water-soluble azo dye by the magnetic material MnFe2O4. J. Chem. Technol. Biotechnol.. 2005;80(1):20-27.
- [CrossRef] [Google Scholar]
- The investigation of synergistic and competitive interaction between dye Congo red and methyl blue on magnetic MnFe2O4. Chem. Eng. J.. 2014;246:88-96.
- [CrossRef] [Google Scholar]
- NaHCO3 assisted multifunctional Co3O4, CuO and Mn2O3 nanoparticles for tartrazine removal from synthetic wastewater and biological activities. Mater. Today Commun.. 2022;33:104946
- [CrossRef] [Google Scholar]
- Magnetically separable Ni0.6Fe2.4O4 nanoparticles as an effective adsorbent for dye removal: Synthesis and study on the kinetic and thermodynamic behaviors for dye adsorption. Chem. Eng. J.. 2014;258:218-228.
- [CrossRef] [Google Scholar]
- Effect of Gd and La doping on the structure, optical and magnetic properties of NiZnCo ferrites. Ceram. Int.. 2019;45(5):6236-6242.
- [CrossRef] [Google Scholar]


