

Translate this page into:
Identify promising IKK-β inhibitors: A docking-based 3D-QSAR study combining molecular design and molecular dynamics simulation
⁎Corresponding authors. wucjcdtcm@163.com (Chunjie Wu), tcmwangjiaolong@163.com (Jiaolong Wang)
-
Received: ,
Accepted: ,
This article was originally published by Elsevier and was migrated to Scientific Scholar after the change of Publisher.
Peer review under responsibility of King Saud University.
Abstract
Inhibitor of nuclear factor kappa B kinase subunit beta (IKK-β), a specific regulator of nuclear factor-κB (NF-κB), is considered a valid target to design novel drugs to treat rheumatoid arthritis, glomerulonephritis and various cancers. In this study, in order to design and then identify promising compounds targeting IKK-β, a series of reported IKK-β inhibitors were used to develop 3D-QSAR models. Docking-based and minimization-based poses were generated for model construction. CoMSIA model #8 based on docking poses was selected due to its satisfactory internal and external validation results and the sufficient information delivery capability. After a contour map analysis, 41 new designs were depicted based on a graphical design scheme and 25 of them were assessed as eligible for screening. Compound 21MX007 has aroused our attention for its both competitive QSAR-prediction and docking-scoring result. Detailed docking interactions of 21MX007-protein complex were investigated via a deep analysis of docking results and a comparative molecular dynamics simulation. Strong interactions and an extra hydrogen bond which echoes the H-bond requirements of substituent acquired from the design scheme were observed. From MD analysis, 21MX007-protein system was tested. The system was proved to have good stability in terms of a downward trend of RMSD and Rg values and a continuous and stable H-bond interaction and a lower average binding free energy. Thus, compound 21MX007 was successfully identified as a promising IKK-β inhibitor.
Keywords
3D-QSAR
Molecular docking
Molecular dynamics simulation
IKK-β
Molecular design

1 Introduction
Nuclear factor-κB (NF-κB) is a multipotent transcription factor (Rahman and Mcfadden, 2011; Cildir et al., 2016). It plays an important role in immune regulation, inflammatory response and cell growth. NF-κB signaling pathway is closely related to various acute or chronic inflammatory diseases like rheumatoid arthritis (RA) and glomerulonephritis. Its abnormal expression has also been widely reported in various forms of cancer (Baeuerle and Henkel, 1994; Sankar et al., 1998). In non-stimulated cells, NF-κB forms multi-subunit complex with IκB-α, a member of the inhibitor of NF-κB (IκB) family. IκB inhibits the activity of homologous or heterodimer complexes of NF-κB, and enables the complexes sequestered in the cytoplasm (Liu et al., 2011).
IκB kinase (IKK) is an upstream molecule of NF-κB, plays a key part in the activation of NF-κB signaling pathway. IKK comprises three subunits: IKK-α, IKK-β and IKK-γ (Lauria et al., 2011). IKK-α and IKK-β are catalytic subtypes, while IKK-γ are regulatory subtype. Inflammatory stimulation triggers the structural mutation of Ser177 and Ser181 of IKK-β, leading to the activation of this kinase. Activated IKK-β mediates the phosphorylation of the two adjacent serine residues of IκB (Ser32/Ser36) and triggers the ubiquitination and subsequent proteasomal degradation of IκB, leading to the release and activation of NF-κB. Due to the nucleus migration of released NF-κB, The NF-κB signaling pathway is activated. This pivotal role makes the inhibition of IKK-β a promising way to the treatment of inflammatory diseases or cancers. (Hacker and Karin, 2006; Scheidereit, 2006; Schmid and Birbach, 2008).
In recent years, IKK-β has become a hot target for drug research. Studies have shown positive results of IKK-β inhibitors in many animal models of inflammation (Fang et al., 2020; Mbalaviele et al., 2009). However, there is still room for further modification and improvement of IKK-β inhibitors due to the non-specific toxicity and poor drug selectivity which have limited their lasting effectiveness and wider use (Paola et al., 2014; Weber et al., 2000; Durando et al., 2017). Therefore, further design and modification of compounds targeting IKK-β have considerable scientific significance.
Quantitative structure-activity relationship (QSAR) is an important method for studying molecular structures with activities via introducing three-dimensional structure information of molecules for quantitative structure-activity relationship research. As a precursor for synthetic drugs studies, QSAR method has been widely used on account of its high efficiency and accuracy (Tong et al., 2021; Hao et al., 2018; Tong et al., 2021). In the present research, a docking-based QSAR study based on a series of IKK-β inhibitors followed by rational molecular designs and MD simulation was taken. Wish to identify certain compounds that carry potentials for further investigation.
2 Materials and methods
2.1 Computer configuration and software
All our works were performed on a Dell workstation with Intel (R) Core (TM) i7-8700 CPU @ 3.20-GHz and 8 GB of RAM with softwares of ChemDraw TM Professional 15.0 (www.cambridgesoft.com), Discovery Studio 4.5.0 (www.accelrys.com), Schrödinger Suites 2017e4 (www.schrodinger.com) and Sybyl X-2.1 (www.tripossoftware.com).
2.2 Molecular depiction and clustering
IKK-β inhibitors for docking-based QSAR study were extracted from two reports (Christopher et al., 2007; Miller et al., 2011). A total of 32 compounds were selected. ChemDraw 15.0 was used to depict two-dimensional (2D) structure of each molecule Fig. 1. Then three-dimensional (3D) graphics were acquired after Input each structure information into Discovery Studio 4.5.0.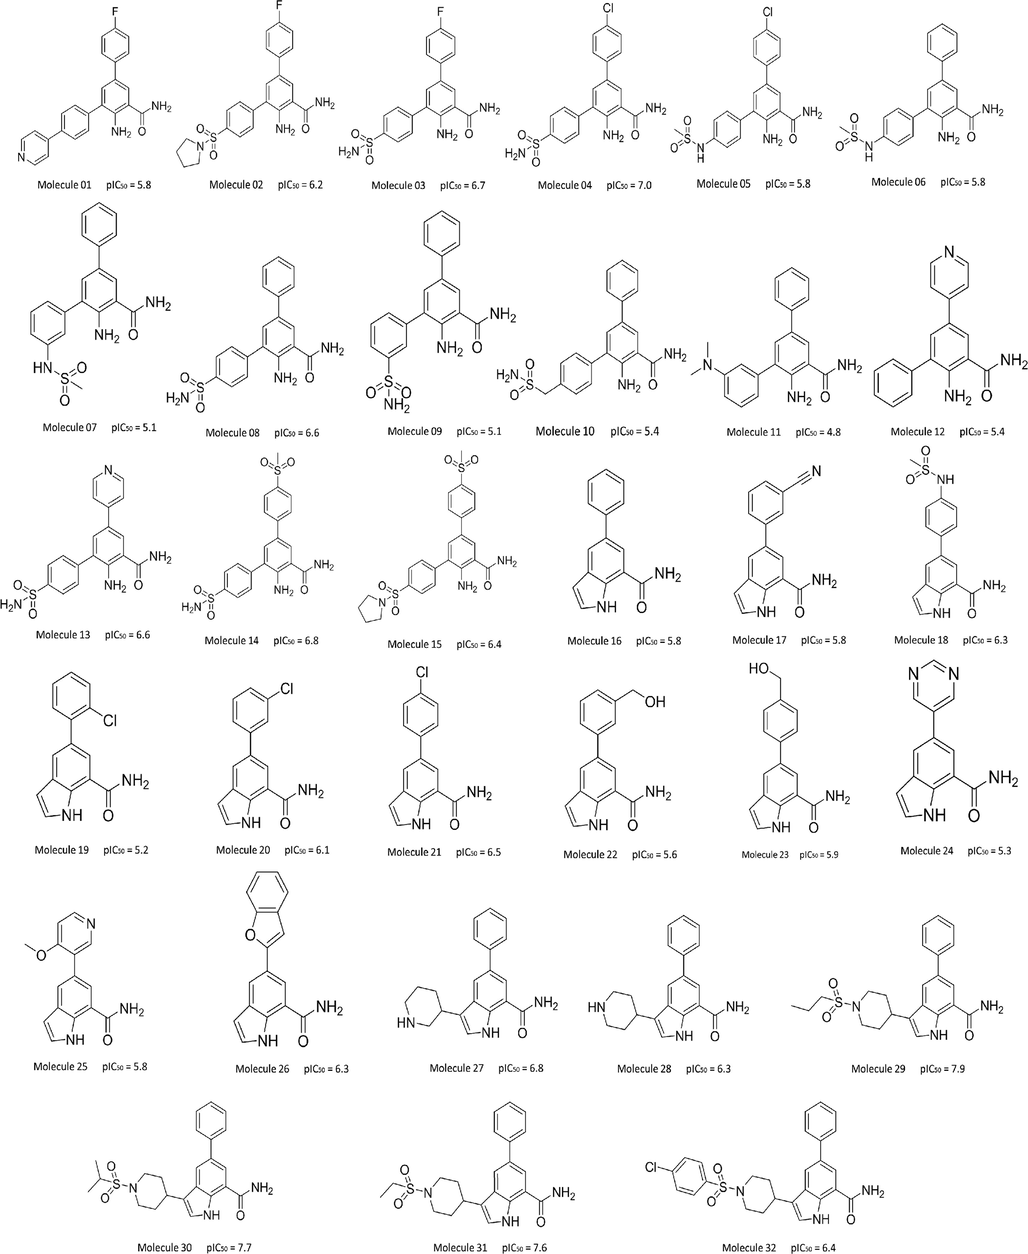
Reported IKK-β inhibitors and their experimental pIC50 values.
As a rational molecular partition contributes the generation of a more representative training set and test set with sufficient structural diversity and good span of biological activity (Wang et al., 2020), fingerprint-based clustering was carried out for bring out a constructive training set and an eligible test set. Three molecular fingerprint algorithms in Discovery Studio 4.5.0 were used for molecular clustering: Model definition language public keys (MDL), functional class fingerprint 6 (FCFP) and extended-connectivity fingerprint 6 (ECFP) (Sprous, 2009). Dataset was set to divide into six subsets. One molecule was selected from each subset for test set. Molecule selection for test set follows such principles: (i) There is a certain activity gradient. (ii) Exclude the lowest and the highest activity. (iii) There is structural diverse.
2.3 Docking based QSAR
2.3.1 Selection of docking scenario
In order to obtain the docking results with optimal accuracy, a selection of docking scenario was implemented. We have five available molecular docking protocols: LibDock and CDOCKER from Discovery Studio, Glide SP and Glide XP from Schrödinger Suites, and surflex-dock Gemx from Sybyl. Crystal structures of IKK-β were acquired from RCSB Protein Data Bank (www.rcsb.org). Every protocol-structure combination (docking scenario) was evaluated via a re-docking operation: docking the crystal ligand back into the original site and calculating the root-mean-square deviation (RMSD) value with the original pose in the same spatial coordinate system (Peng et al., 2018; Huang et al., (4)(2017)).
2.3.2 Validation of selected docking scenario
A decoy set test was implemented to validate the capacity of the chosen docking scenario. Five high-activity and five low-activity compounds were randomly selected for this validation. The chosen scenario executes each docking. Score sorting is the judgment criteria (Zhou et al., 2015).
2.3.3 Generation of molecular poses and molecular alignment
Weather the molecular poses maximizes the information between ligands and the receptor should be a critical factor in the success or failure of a modeling (Cheng and Xiao, 2015). Docking poses were thus adopted for the construction of QSAR models. When comparison with QSAR models using receptor independent alignment or with approaches that do not need molecular alignment, using docking-based molecular poses to establish QSAR models may reward us more nature-mapping results (Chen et al., 2013; Yu et al., 2013). The selected docking scenario was used to execute the detailed docking operation for generation of docking-based molecular poses.
A good molecular alignment determines if a sufficiently robust model can be acquired. In order to mostly convey the structural features of common skeleton, aminobenzamide part was used as common skeleton for alignment. The top-activity of Molecule 29 was used as alignment reference. “Align Database” in Sybyl X-2.1 executed the alignment (Kawabata and Nakamura, 2014).
As competitors, other two groups of molecular poses were generated using minimization algorithms of Smart Minimizer and Powell in Discovery Studio. Identical alignment procedure was implemented on the competitors.
2.3.4 Descriptor fields calculation
Sybyl X-2.1 was used to calculate CoMFA and CoMSIA descriptor fields. For CoMFA calculation, cutoffs were set at 30.0 kcal/mol. For CoMSIA calculation, the attenuation factor was set at 0.3. pIC50 values were merged in the spreadsheet after a one-to-one correspondence of the activity data into a text document file (Yoo et al., 2007).
2.3.5 Partial least squares analysis
A calculation scheme of a two stage PLS analysis was used for model statistical evaluation. The first stage was a leave-one-out (LOO) cross-validation analysis. Optimum number of components (N) and the squared cross-validation coefficient (q2) are the most important parameters can we get at this stage. In stage two, according to the acquired N value, a no-validation analysis was carried out to generate the statistical parameters of r squared (r2), Fisher’s values, and standard error of estimate (SEE). The regression fitting of created QSAR models are assessed by a comprehensive analysis of these statistical parameters (Nagarajan et al., 2017; Tong et al., 2017).
2.3.6 External validation
Whether a QSAR can predict is vital. It means that a strict external validation must be focused (Gramatica, 2007). In the present research, two external validation algorithms were carried out based on activity prediction of test set.
Predictive r2 (r2pred) is one of the most common used indicators that reflects prediction feasibility of the QSAR models. The calculation for r2pred is based on Eq. (1) (Oprea et al., 1994).
The value of Q2(F2) was used as a secondary validation for we have considered that the activity span may influence the computed result. The subtrahend of the denominator of this formula changes from the average activity of the training set to the average activity of the test set. This change means the QSAR model shall have sufficient predict boundary to ensure an acceptable Q2(F2) value. The calculation for predictive Q2(F2) follows Eq. (2) (Roy and Mitra, (6)(2011)450–474.).
2.4 Molecule design
Collect all the valuable clues we can get from the graphical contour maps which were extracted from the created QSAR models and our earlier analysis of the superimposed docking poses of all reported IKK-β inhibitors, a molecular design scheme was summarized. According to this design scheme, dozens of query compounds was depicted. An identical docking procedure was implemented on each designed compound, those failed to have consistency of binding orientation with the reported IKK-β inhibitors were excluded to ensure the reliability and comparability of our further screening. Docking pose of each eligible query compound was delivered to further study (Kakarla et al., 2016; Jing et al., 2017).
2.5 Molecule screening
QSAR model was used to predict all eligible query compounds after an identical molecular alignment procedure was implemented. The predicted activity was the screening indicator. Molecular docking was implemented on each query compound, Docking scoring and interaction-energy value were used as another criterion for screening. Our screening principle for potential molecules is that both QSAR-prediction and docking-scoring result are highly competitive (Wang et al., 2019).
2.6 Result rationality analysis
Detailed docking analysis was implemented on screened promising molecules to unveiling their detail interactions with IKK-β protein to visualize if there is a reasonable relation between structure change and activity promotion. Interaction view function in Discovery Studio was used to display receptor-ligand interactions. Screened promising molecules were then placed into graphical contour maps to validate its design rationality via an overlapping analysis.
2.7 Molecular dynamics simulation
A comparative molecular dynamics simulation study was carried out using Amber18 package (Romelia et al., 2013). The force field of ff14SB was used for protein and the general AMBER force field (GAFF) was used for ligands (Maier et al., 2015). Complex of screened potential molecule with target protein was the research object while molecule29-protein complex and solo protein were contrasts. Complex was firstly loaded into the TLEAP module for adding hydrogen atoms, antagonizing ions and neutralizing protein charge. The system was then placed into a TIP3P water box for setting periodic boundary conditions. Topology and coordinate data were saved. The following molecular dynamics simulation workflow includes four steps: energy optimization, heating, equilibration and production dynamics simulation. The first step was energy optimization with coordinate restriction of heavy atoms. 5000 steps of conjugate gradient optimization and 5000 steps of the deepest descent optimization was implemented on water molecules and ions. Then energy optimization with all restrictions released, system was optimized by 5000 steps of conjugate gradient and 5000 steps of deepest descent as well. The minimized system was then placed in an NVT ensemble for heating from 0 K to 300 K in 50 ps. 50 ps NPT ensemble simulation was performed to equilibrate the system after heating. 100 ns production dynamics simulation under NPT ensemble was then performed with the temperature stayed at 300 K and the pressure at 1 atmosphere. The time step was 2 fs. One frame of trajectory was held every 20 ps. CPPTRAJ module was carried out for data analysis while MMPBSA.py module was used to calculate the combined free energy (Hu et al., 2018; Uba et al., 2020).
2.8 Prediction of pharmacokinetics and drug-like properties
Pharmacokinetics properties of the selected compounds were estimated using the Qikprop module in Schrödinger suits. Of which, physically significant descriptors and pharmaceutically relevant properties were estimated uses its attached QSAR models (Ioakimidis et al., 2010; Grover et al., 2014). Besides, Lipinski and Veber rulers were used to test the drug-like properties of screened compounds (Veber et al., 2002; Lipinski et al., 2001).
3 Results
3.1 Clustering analysis
Fingerprint-based clustering offered three different partitions. According to the molecule selection principle, three test set was then built. The grouping results of the training set and test set are shown in Table 1. *Test-set compounds; FCFP, functional class fingerprint; ECFP, extended-connectivity fingerprint; and MDL, model definition language.
Cluster number
Serial number of compound
MDL
FCFP
ECEP
1
02,15*,29,30
02,05,15*
03,04,05,06,08,10,13,14,15*
2
26,27*,28
26,27,28,29,30*
25,26*
3
01,11,12,16,17,19*,20,21,24
01,12,13,16,17,18*,24,25
27,28,29,30*,31,32
4
22,23,31,32*
19*,20,21,22,23
16,17,18*,19,20,21,22,23,24
5
03,04,05,06,07,08,09,10,13,14*,18
06,07,08,09,10,11,14*
01,02*,12
6
25*
03,04,31,32*
07,09*,11
3.2 Docking based QSAR
3.2.1 Selection of docking scenario
Docking scenarios were assessed via calculation of RMSD values and the superposition graphic of the best docking pose and the initial pose is shown in Fig. 2. With the obvious good overlay and the lowest RMSD value of 0.3856, docking protocol of CDOCKER combined with crystal structure of PDB code 4KIK was chosen for our entire study because this docking scenario was most likely to reproduce the natural binding modes of the ligands. In order to keep the evaluation conditions consistent, the following parameters were maintained in subsequent studies: Chain A of the 4KIK protein was used for docking. A site sphere with radius of 14 Å was created around the original ligand as the binding site and then being set as docking receptor. The ligands were docked into the binding site defined as “flexible”.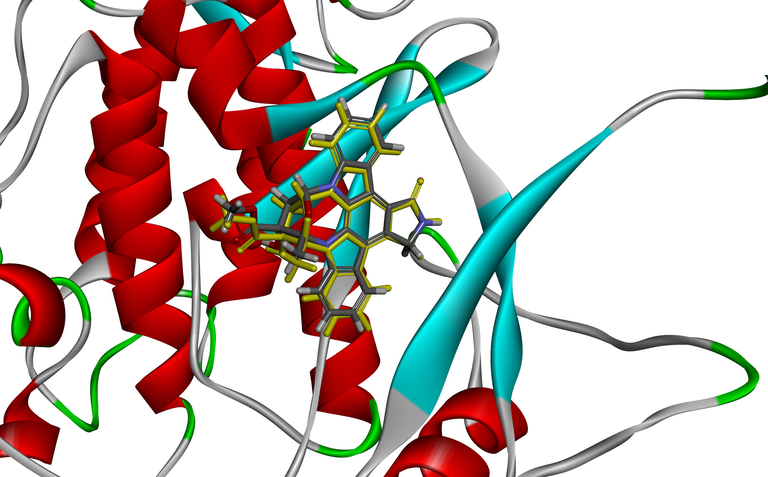
Superposition graphic of the best docking pose and the initial pose of original ligand of 4KIK.
3.2.2 Validation of selected docking scenario
Decoy-set validation result was shown in Table 2. The selected docking scenario have successfully discriminated the active and inactive when using “CDOCKER-INTERACTION-ENERGY” value as the metric, demonstrates that the chosen docking protocol and crystal structure pairing is reliable for docking studies.
Compound number
Reported pIC50
CDOCKER-INTERACTION-ENERGY
Grouping
03
6.7
−50.5109
Active
29
7.9
−50.3599
Active
31
7.6
−49.9353
Active
04
7.0
−49.9242
Active
13
6.6
−49.2912
Active
05
5.8
−48.4493
Inactive
01
5.8
−47.4131
Inactive
11
4.8
−46.9120
Inactive
28
6.3
−43.9831
Inactive
12
5.4
−43.1040
Inactive
3.2.3 Generation of molecular poses and molecular alignment
As expected, all compounds embedded into the cavity with a nearly identical conformational orientation. Fig. 3A: Amide and the nitrogen atom are almost perfectly overlapped. Shared skeleton parts were embedded into cavity while their terminals were gathering at an H-bond active region. Such similar conformational orientation indicates that docking-based molecular poses could provide rational and reliable alignment and H-bond interactions which are happening at the terminal may influence the receptor-ligand binding, Fig. 3B. The superposition graphic of docking poses of compounds with the original ligand of 4KIK is shown in Fig. 3C: a consistency of binding orientation and similar interaction potency was observed, indicating the reliability and rationality of using docking poses of the inhibitors for QSAR modeling base on protein crystal of 4KIK. Using aminobenzamide part as common skeleton, all molecule poses were well aligned, no unacceptable terminal furcation was observed. Fig. 3D. Same as docking-based poses, the two groups of minimization-based poses were well aligned.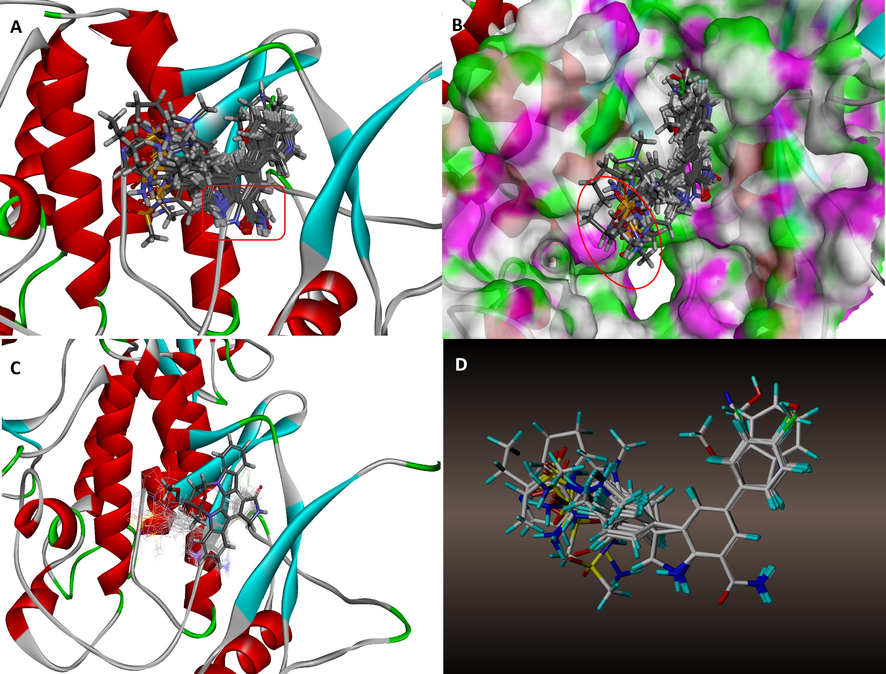
(A) Superimposition of all docking poses, (B) Steric relation of H-bond surface with docking poses, (C) Superposition of docking poses of compounds with the original ligand of 4KIK, (D) Alignment of training set molecules acquired from docking poses.
3.2.4 QSAR model selection
Using CoMSIA algorithm, each database can theoretically create 27 models by random matching of 5 descriptor fields. Along with all CoMFA models, 252 candidate models were generated from 9 databases. All CoMFA models and 3 CoMSIA models with best statistical data from each database are shown in Table 3 S, steric; E, electrostatic; H, hydrophobic; D, hydrogen bond donor; A, hydrogen bond acceptor; q2, cross-validated correlation coefficient; N, number of components; r2, non-cross-validated correlation coefficient; SEE, standard error estimate; F, Fisher’s values; FCFP, functional class fingerprint; ECFP, extended-connectivity fingerprint; MDL, model definition language.
Model no.
Model name
Leave one out cross-validation
Non-cross-validation
External validation
Field contribution
N
q2
r2
SEE
F
r2pred
Q2(F2)
S
E
H
D
A
Docking_MDL
1
CoMFA
5
0.502
0.967
0.321
224.642
0.521
0.497
0.785
0.215
2
CoMSIA_SHA
6
0.488
0.957
0.298
186.835
0.477
0.456
0.451
0.242
0.307
3
CoMSIA_SDA
7
0.492
0.955
0.342
208.646
0.511
0.480
0.388
0.270
0.342
4
CoMSIA_SHDA
8
0.479
0.946
0.302
188.952
0.485
0.491
0.251
0.189
0.235
0.325
Docking_FCFP
5
CoMFA
7
0.546
0.980
0.212
452.314
0.545
0.521
0.812
0.188
6
CoMSIA_SDA
8
0.612
0.991
0.112
512.523
0.588
0.590
0.333
0.354
0.313
7
CoMSIA_SHA
8
0.580
0.989
0.157
462.524
0.567
0.556
0.354
0.212
0.434
8
CoMSIA_SHDA
8
0.662
0.997
0.051
683.295
0.650
0.617
0.126
0.220
0.290
0.364
Docking_ECEP
9
CoMFA
6
0.515
0.978
0.221
225.561
0.502
0.478
0.764
0.236
10
CoMSIA_SDA
8
0.598
0.995
0.123
488.648
0.591
0.578
0.284
0.241
0.475
11
CoMSIA_HDA
9
0.577
0.984
0.228
345.812
0.555
0.521
0.297
0.330
0.373
12
CoMSIA_SHDA
9
0.643
0.995
0.065
589.342
0.621
0.586
0.142
0.242
0.301
0.315
Smart Minimizer_MDL
13
CoMFA
5
0.599
0.980
0.124
345.412
0.600
0.553
0.674
0.326
14
CoMSIA_SEA
7
0.532
0.975
0.202
155.231
0.516
0.508
0.356
0.391
0.253
15
CoMSIA_SEHA
7
0.498
0.964
0.232
128.546
0.482
0.478
0.221
0.254
0.204
0.321
16
CoMSIA_SEAD
8
0.469
0.952
0.315
127.863
0.424
0.452
0.257
0.261
0.224
0.258
Smart Minimizer_FCFP
17
CoMFA
6
0.575
0.975
0.274
161.642
0.564
0.583
0.642
0.358
18
CoMSIA_SHA
7
0.585
0.986
0.165
222.557
0.592
0.572
0.344
0.352
0.304
19
CoMSIA_SEA
7
0.558
0.980
0.216
214.851
0.516
0.498
0.431
0.282
0.287
20
CoMSIA_SEH
8
0.512
0.977
0.289
186.742
0.486
0.481
0.452
0.341
0.207
Smart Minimizer_ECEP
21
CoMFA
5
0.605
0.998
0.092
456.146
0.610
0.600
0.662
0.338
22
CoMSIA_SEA
7
0.557
0.978
0.246
156.631
0.581
0.568
0.351
0.287
0.362
23
CoMSIA_SHDA
9
0.566
0.986
0.202
221.758
0.590
0.595
0.245
0.278
0.145
0.332
24
CoMSIA_HEA
8
0.502
0.962
0.298
89.675
0.521
0.489
0.252
0.356
0.392
Powell_MDL
25
CoMFA
5
0.555
0.981
0.202
172.452
0.523
0.518
0.611
0.389
26
CoMSIA_SEH
8
0.570
0.988
0.162
284.592
0.553
0.498
0.375
0.321
0.304
27
CoMSIA_SEA
8
0.567
0.971
0.186
84.672
0.509
0.511
0.428
0.224
0.230
28
CoMSIA_SHA
7
0.521
0.966
0.251
121.797
0.528
0.487
0.399
0.284
0.317
Powell_FCFP
29
CoMFA
6
0.618
0.994
0.075
479.314
0.598
0.554
0.668
0.332
30
CoMSIA_SEA
8
0.582
0.993
0.145
187.791
0.565
0.562
0.377
0.289
0.334
31
CoMSIA_SDA
8
0.580
0.988
0.164
177.682
0.567
0.575
0.400
0
0.281
0.319
32
CoMSIA_SHDA
9
0.552
0.964
0.219
74.721
0.521
0.509
0.365
0.186
0.256
0.193
Powell_ECEP
33
CoMFA
5
0.587
0.984
0.146
187.227
0.599
0.589
0.562
0.438
34
CoMSIA_SHA
8
0.579
0.978
0.299
111.562
0.546
0.462
0.363
0.315
0.322
35
CoMSIA_SDA
7
0.524
0.965
0.273
155.033
0.476
0.451
0.322
0.361
0.317
36
CoMSIA_SEH
6
0.527
0.945
0.372
81.784
0.429
0.468
0.416
0.220
0.364
As our most concern for model selection was its predictive ability, investigation of external validation results was prioritized. As expected, model #8 derived from docking-based poses has an optimal external validation outcome in terms of r2pred of 0.650 and Q2(F2) of 0.617, It demonstrates that model #8 carries the best prediction reliability compared to other models.
Internal validation tests the construction rationality of created models. The statistical values of model #8 were r2 of 0.997, q2 of 0.662, F value of 683.295 and a low SEE value of 0.051. Although the results are not optimal in some values (for example, r2 of Model #21 is slightly better), the overall prominence and coordination tells that model #8 is rationally constructed and is sufficient robust for further studies. Moreover, because model #8 is built by 4 descriptor fields, its sufficient information delivery capability is beneficial for further contour maps analysis.
All reported inhibitors were predicted using model #8. Comparison of the reported and predicted activities is shown in Table 4 and Fig. 4. No observation of obviously exceptional separation points demonstrates the reliable prediction ability of model #8.
Compound
Reported pIC50
Predicted pIC50
Residual
01
5.8
5.787
−0.013
02
6.2
6.178
−0.022
03
6.7
6.703
0.003
04
7
7.014
0.014
05
5.8
5.805
0.005
06
5.8
5.829
0.029
07
5.1
5.122
0.022
08
6.6
6.579
−0.021
09
5.1
5.095
−0.005
10
5.4
5.38
−0.02
11
4.8
4.775
−0.025
12
5.4
5.452
0.052
13
6.6
6.591
−0.009
14*
6.8
6.443
−0.357
15*
6.4
5.921
−0.479
16
5.8
5.944
0.144
17
5.8
5.763
−0.037
18*
6.3
5.874
−0.426
19*
5.2
5.663
0.463
20
6.1
6.09
−0.010
21
6.5
6.4
−0.100
22
5.6
5.612
0.012
23
5.9
5.881
−0.019
24
5.3
5.284
−0.016
25
5.8
5.839
0.039
26
6.3
6.279
−0.021
27
6.8
6.792
−0.008
28
6.3
6.268
−0.032
29
7.9
7.923
0.023
30*
7.7
6.987
−0.713
31
7.6
7.614
0.014
32*
6.4
6.218
−0.182
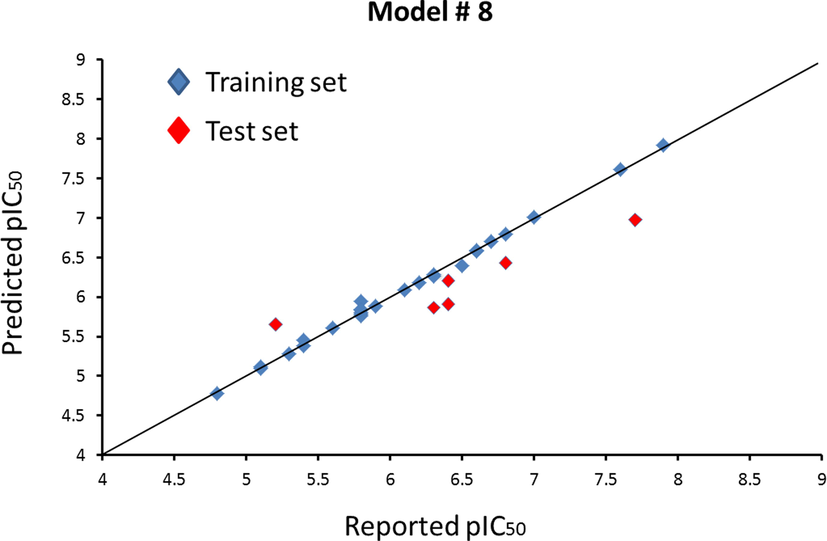
Plots of reported activities versus predicted activities of compounds in the training set and test set based on model #8.
3.2.5 Contour maps analysis
A deep analysis on graphical contour maps was carried out to inspire us clues for molecular structural modification. Molecule 29 was used as reference for analysis.
Steric contour maps: Favorable and undesirable interaction regions that relate to molecular steric features are displayed in forms of green and yellow modules In Fig. 5A. The branch that link to pyrrole is wrapped in green modules, indicates that appropriate steric modification is acceptable on this part. However, the outer layer of the green region is adjacent to yellow modules. It tells that the modification degree on this branch must be limited, excessive structural expansion will bring negative effects.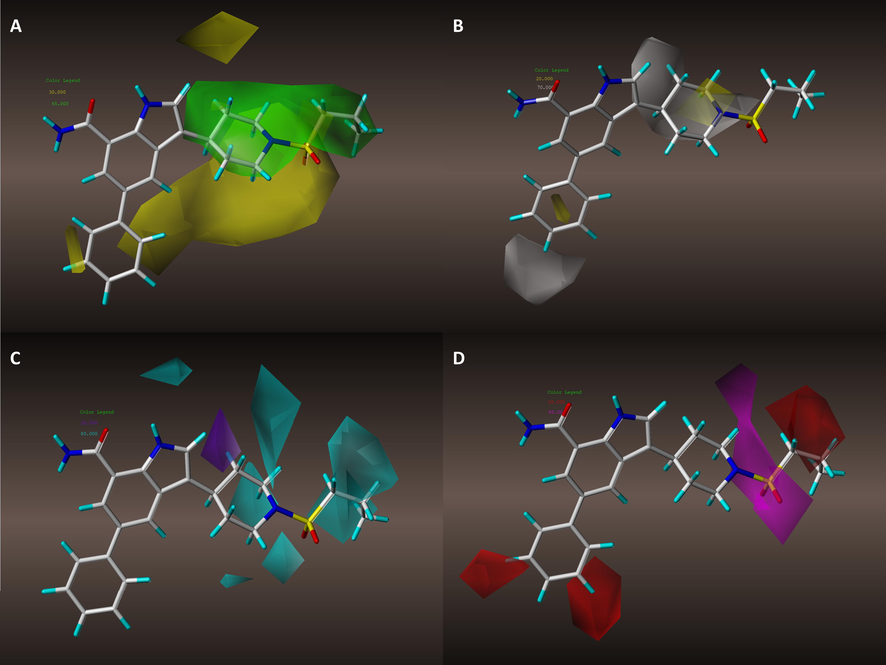
Contour maps in combination with Molecule 29: (A) steric contour maps of model #8; (B) hydrophobic contour maps of model #8; (C) Hydrogen bond donor contour maps of model #8; (D) Hydrogen bond acceptor contour maps of model #8.
Hydrophobic contour maps: Fig. 5B displays hydrophobic contour maps which white modules denote hydrophilic-favored while yellow modules represent hydrophobic-favored regions. Nitrogen atom and carbon atom of C2 and C3 on piperidine is covered by hydrophilic-favored modules while carbon atom of C1 is designated to hydrophobic-favored regions. The graphic information tells that any substitution on piperidine part should be placed with proper hydrophobic features on certain site.
Hydrogen bond donor contour maps: Fig. 5C displays Hydrogen bond donor contour maps, cyan modules denote Hydrogen bond donor favored regions and the purple denotes the unfavorable. Nitrogen atom, carbon atom of C1 on piperidine and the terminal of this active branch are designated to cyan areas. It indicates that any substituent groups with H-bond donor features being placed at these regions may bring positive effects. C2 position on piperidine is designated to an unfavorable module, it means H-bond donor substitution on this site should be avoid.
Hydrogen bond acceptor contour maps: Fig. 5D displays Hydrogen bond acceptor contour maps. Dimethyl sulfone, nitrogen atom and carbon atom of C1 on piperidine are designated to a purple module (H-bond acceptor favored region), it shows that bring H-bond acceptors to these sites benefits the molecule activity. Branch terminal, C3 and C5 on benzene are designated to H-bond acceptor unfavorable region, such graphic information well echoes the analysis results of H-bond donor contour maps.
3.3 Molecule design
After a comprehensive analysis of graphical contour maps and superimposed docking results, a molecular design scheme was generated and shows in Fig. 6:1. The terminal of the active branch shall provide H-bond donor features, 2. Excessive steric expansion on both side of the active branch shall be avoid, 3. Any substituent group on C1 of piperidine shall carry hydrophilic characters. 4. Retain dimethyl sulfone is rational because H-bond acceptor character is needed at this point. Based on such design scheme, 41 query compounds were depicted using ChemDraw 15.0. An identical docking procedure as the compounds for QSAR modeling was then implemented on each query compound. 16 of the compounds were assessed as ineligible as they failed to have a consistency of binding orientation with the reported inhibitors. Thus, docking poses of the remaining 25 eligible query compounds were sent to further screening.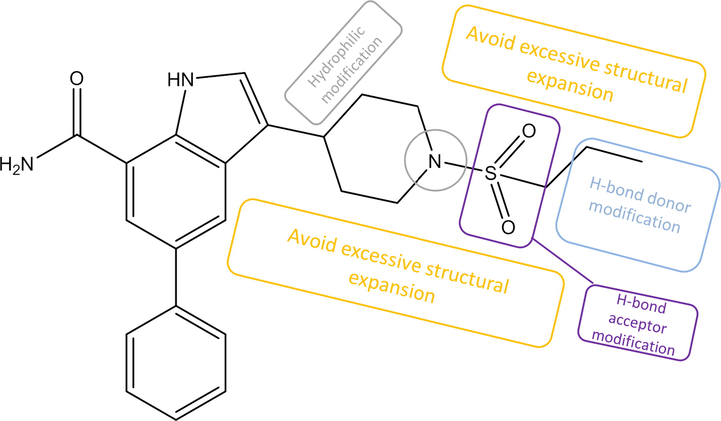
Molecule design scheme.
3.4 Molecule screening
The two combined molecule screening procedure was implemented on the 25 eligible query compounds, Our selection criteria is that the predicted activity higher than 7.5 and docking scoring lower than −50.00 of CDOCKER-INTERACTION-ENERGY. Compounds of 21MX004, 21MX007, 21MX016 and 21MX030 were predicted to have an activity higher than 7.5. Compounds of 21MX007, 21MX011, 21MX012, 21MX013 and 21MX039 were scoring lower than −50.00 of CDOCKER-INTERACTION-ENERGY. Query compound 21MX007 (predicted activity of 7.667, CDOCKER-INTERACTION-ENERGY value of −56.7153) was the only candidate with both competitive QSAR-prediction and docking-scoring result and naturally aroused our attention, Table 5 and Fig. 7.
Query Compounds
Predicted pIC50
CDOCKER-INTERACTION-ENERGY value
21MX016
7.701
−48.2113
21MX007
7.667
−56.7153
21MX004
7.616
−48.7572
21MX030
7.537
−51.4314
21MX021
7.443
−45.9682
21MX022
7.316
−47.4529
21MX038
7.176
−50.0122
21MX009
7.079
−49.6021
21MX011
6.988
−55.6451
21MX013
6.905
−55.8692
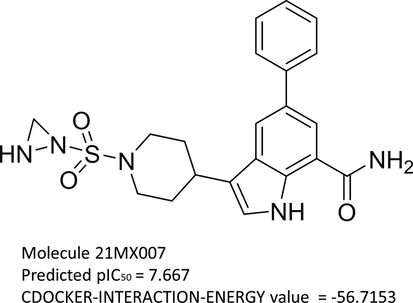
2D structure of molecule 21MX007.
3.5 Result rationality analysis
Detailed docking interactions of 21MX007-protein and molecule29-protein are shown in Fig. 8. Similar interactions with ASP166, GLU61 and MET96 were observed from both ligands. Due to the docking pose change caused by terminal structure difference, an overall preferable hydrophobic interaction between 21MX007 and protein is observed: Richer hydrophobic interaction formed by benzene part and stronger hydrophobic interaction happened on benzoheterocycle in terms of shorter bond length of the sulfur-aromatic interaction and the prime hydrophobic interaction between ligand and VAL29, Fig. 8A and B. Moreover, 21MX007 has formed an H-bond between secondary nitrogen-atom on triatomic ring with residue of ASP103. Such extra interaction may answers the result of favorable predicted activity and a higher docking scoring. This H-bond forming information perfectly echoes the hydrogen bond requirements of substituent acquired from the design scheme, Fig. 8C and D. Fig. 8G shows the steric relation between 21MX007 and the hydrophobicity surface of the binding pocket: The modification part of triatomic ring is wrapped by blue surfaces, indicating that the hydrophilic modification is rational. Fig. 8H shows the steric relation between 21MX007 and the H-bond surface. As expected, H-bond donating secondary nitrogen-atom on triatomic ring well meets the H-bond accepter surface (in green), tells the H-bond donating modification at the terminal of the molecule is rational.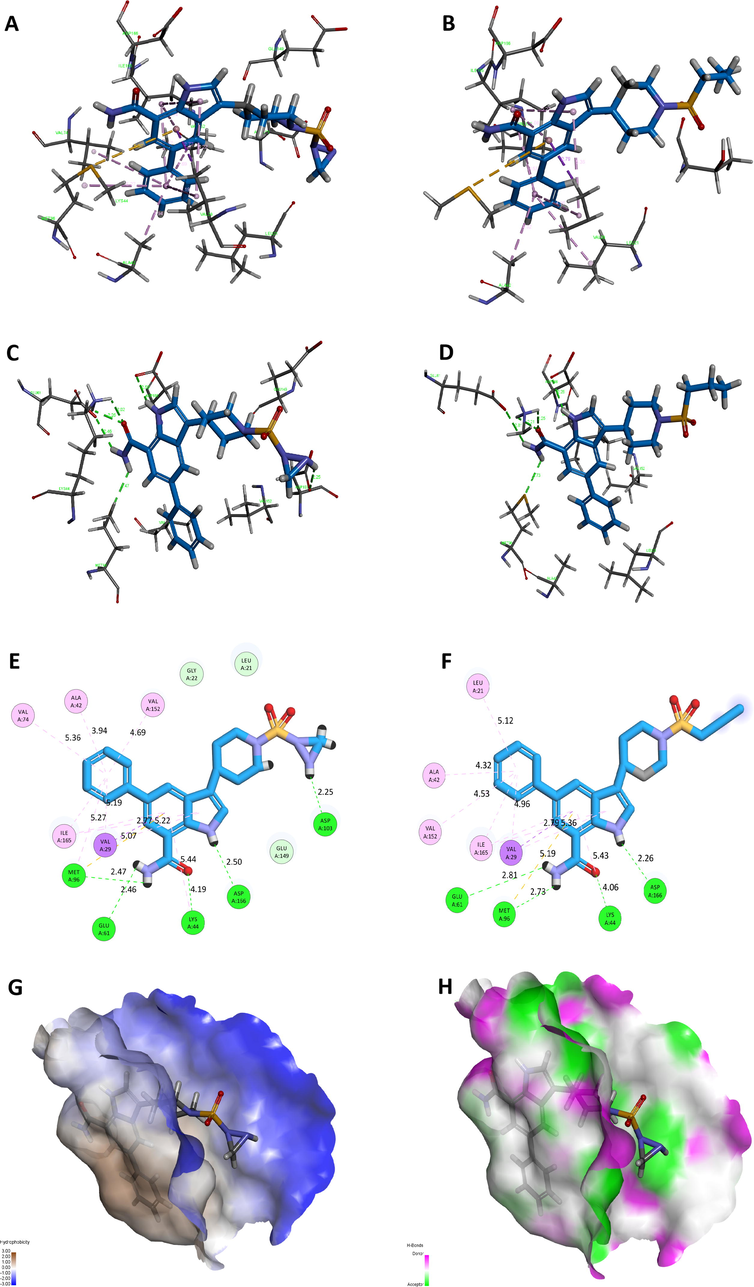
Detailed interactions between receptor and ligand: (A) Hydrophobic interaction of 21MX007-protein, (B) Hydrophobic interaction of molecule29-protein, (C) H-bond interaction of 21MX007-protein, (D) H-bond interaction of molecule29-protein, (E) 2D interaction map of 21MX007-protein, (F) 2D interaction map of molecule29-protein, (G) Interaction map of hydrophobicity surface of 21MX007-protein, (F) Interaction map of H-bond surface of 21MX007-protein.
Compound 21MX007 was placed into graphical contour maps to analysis its design rationality. Fig. 9. displays the Overlapping graphics of Compound 21MX007 with each contour map. Shows in Fig. 9A, the active branch of Compound 21MX007 has successfully avoided the steric-unfavorable areas. In Fig. 9B, hydrophilic nitrogen atom on piperidine immerses in white modules, which may benefits the activity. In the H-bond field (Fig. 9. C and D), modifications on the active branch well meet both the H-bond donor and acceptor requirements: H-bond donor of secondary nitrogen atom on triatomic ring is designated to a large cyan module while H-bond acceptor of sulfur atom is wrapped by purple module. Such telling correlation was even further confirmed via an observation of an extra formed H-bond between secondary nitrogen atom and the receptor. Both detailed docking and contour map analysis demonstrate the design rationality of Compound 21MX007.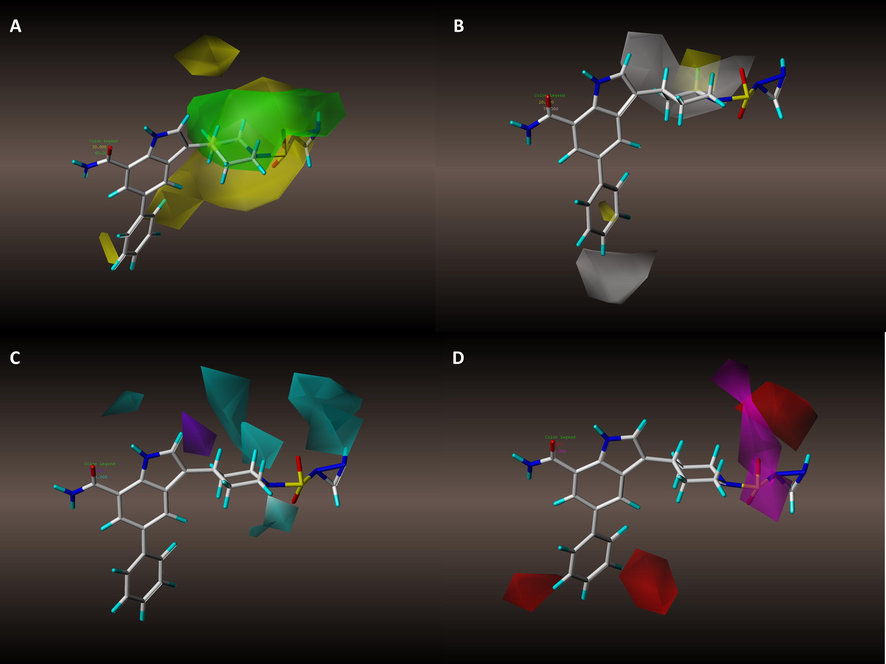
Contour maps in combination with compound 21MX007. (A) Steric contour maps of model #8. (B) Hydrophobic contour maps of model #8. (C) H-bond donor contour maps of model #8. (D) H-bond acceptor contour maps of model #8.
3.6 Molecular dynamics simulation
3.6.1 RMSD
RMSD was used to quantify how much the complex has changed over the simulation time and was a key indicator to describe the stability of each complex. RMSD curves of all complexes are shown in Fig. 10. 21MX007 complex fluctuated in the early stage. After a clear oscillation at 60 ns, the complex structure tends to be stable, indicating that the ligand-protein interaction does suppressed significant structural changes in the complex with the extension of time. However, such tendency to stable was no observed on the molecule29 complex. 21MX007 complex has a deviation in RMSD within a range between 2.5 Å and 4.2 Å at the stabilization period of the trajectory while the value for molecule29 complex is 3.2 Å to 4.8 Å and for solo protein is 2.5 Å to 4.4 Å at this period of time, indicating that 21MX007 complex relatively more stable comparison with the contrasts.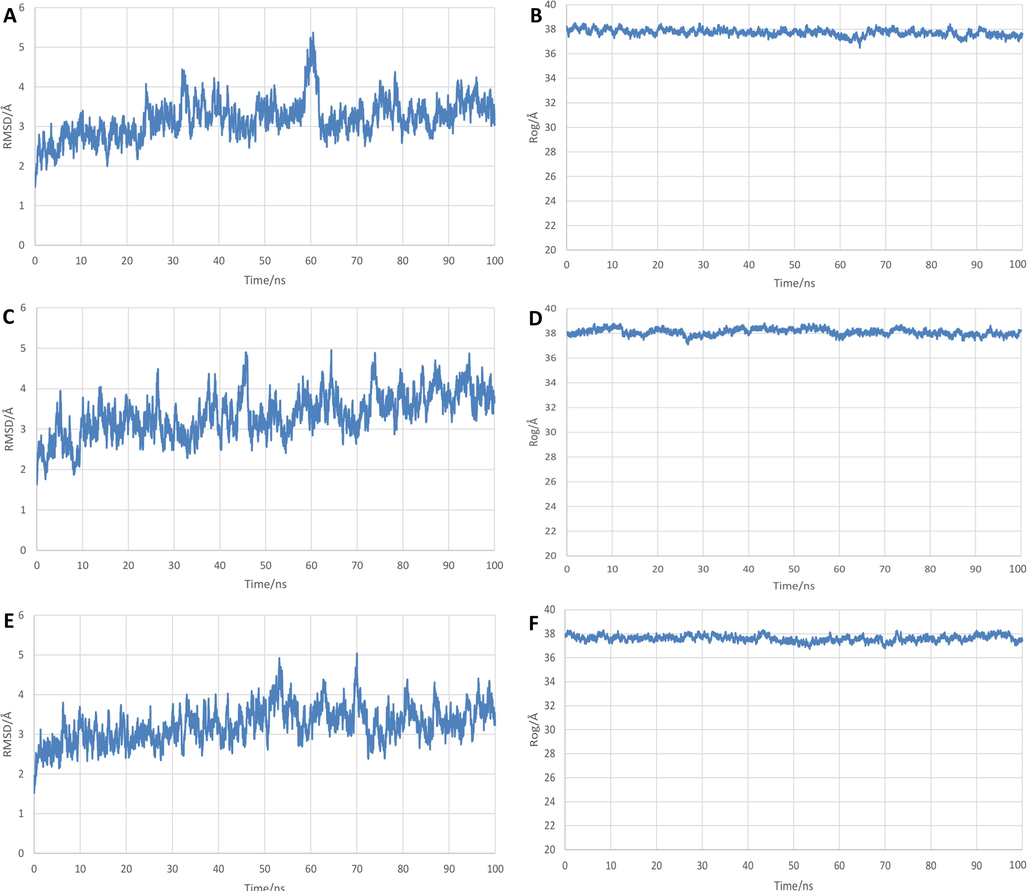
MD results of systems:(A) RMSD of protein-21MX007 system, (B) Rg of protein-21MX007 system, (C) RMSD of protein-molecule29 system, (D) Rg of protein-molecule29 system, (E) RMSD of solo protein system, (F) Rg of solo protein system.
3.6.2 Radius of gyration
The definition of Radius of gyration (Rg) could be described as the root-mean-square distance of the collection of atoms from their common center of gravity and it describes the overall spread of a molecule and the compactness of a complex. Radius of gyration outcomes are shown in Fig. 10. 21MX007 complex is observed a more distinct downward trend compared to molecule29 complex and the solo protein after the systems have reached the stabilization stage. 21MX007 complex has a deviation in Rg between 36.9 Å and 38.1 Å while the Rg value for molecule29 complex is 37.5 Å to 38.7 Å and for solo protein is 37.1 Å to 38.1 Å. It indicates that the bindings in the complex make the protein more stable.
3.6.3 Hydrogen bond interactions
Hydrogen bond interactions between protein and ligand are a crucial part of inter-molecular recognition. Numbers of hydrogen bonds formed during 100 ns MD simulation are shown in Fig. 11. Because some weak hydrogen bonds could be formed and were easily disappeared, the numbers of hydrogen bonds for both complexes were not fixed. However, only 21MX007 complex is observed to have continuous and stable H-bond interactions while aperiodic interruption is happened in molecule29 complex. In other words, stronger H-bond interactions were observed in 21MX007 complex compare to complex of molecule29.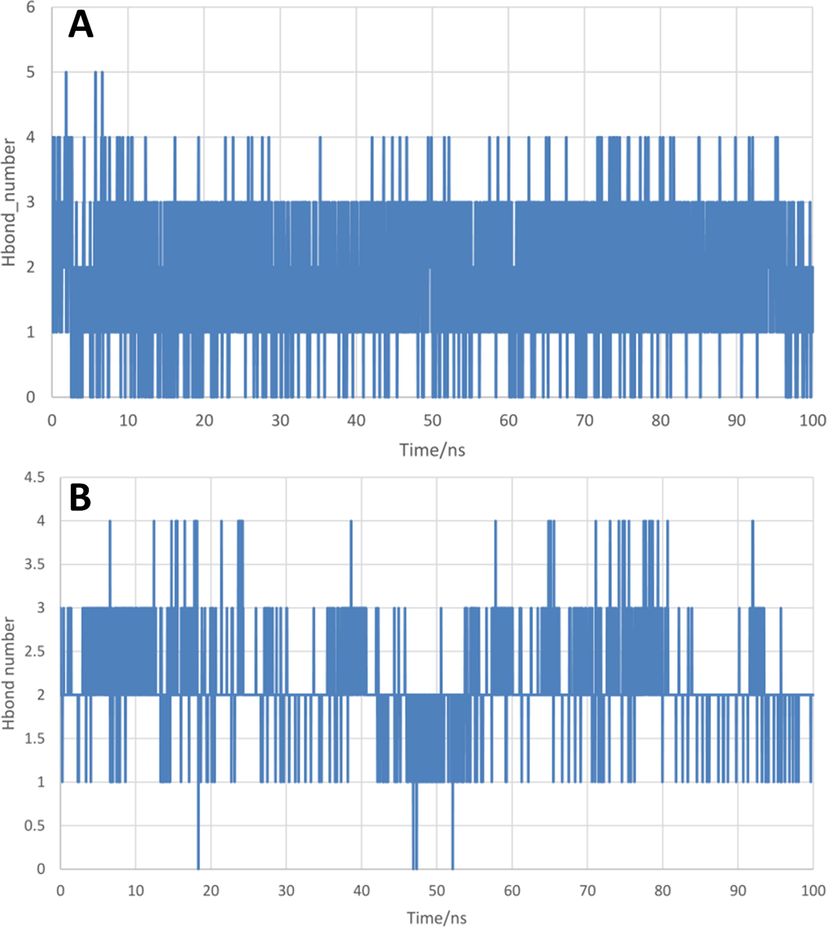
The numbers of inter-molecular hydrogen bonds between IKK-β active site residues with (A) compound 21MX007, (B) molecule29.
3.6.4 Binding free energy
The binding free energy (ΔGbind) in this study was defined as:
The Binding free energy was calculated by using the kinetic conformation in the range of 60−100 ns. Average of −60.01 kcal/mol of the system indicated the good binding affinity of compound 21MX007. The main contribution comes from van der Waals potential energy and electrostatic action, which are −55 kcal/Mol and –33 kcal/mol respectively. The hydrogen bonding between ligand and receptor is the main source of electrostatic interaction.
3.7 Prediction of pharmacokinetics and drug-like properties
QikProp module in Schrödinger suits was used to calculate physically significant descriptors and pharmaceutically relevant properties of compound 21MX007. The results are shown in Table 6, each main Physico-chemical descriptor of compound 21MX007 is predicted within recommended range and an non CNS activity. Beside, compound 21MX007 has passed both Lipinski and Veber rulers. In general, compound 21MX007 possesses acceptable pharmacokinetics and drug-like properties.
Descriptors
Comp21MX007
Recommended range
SASA
701.096
300–1000
QPLogS
−6.507
−6.5–0.5
Percent human oral absorption
84.061%
>80% high
<25% poor
CNS activity
−2
−2 inactive
2 active
BBB partition coefficient
−1.87
−3.0–1.2
AlogP
1.285
−0.4–5.6
4 Conclusion
IKK-β has aroused much attention in recent years for it has been considered to be a valid drug target for treatment of inflammatory diseases or cancers. In order to identify promising IKK-β inhibitors, a study combining docking-based QSAR research, docking and molecular dynamics simulations was executed using 32 reported IKK-β inhibitors as data basis.
In our study, combined approaches were successfully applied to investigate promising IKK-β inhibitors. In the 3D-QSAR study, predictive docking-based model was acquired after a strict internal-external evaluation. A graphical design scheme was depicted via a carefully analysis of contour maps and 41 new molecules were designed based on this scheme. Through activity prediction and comparison of docking affinity, compound 21MX007 was focused for its preeminent activity and preferable docking score. Detailed interaction with IKK-β was then investigated via a deep look of the binding mode of compound 21MX007. Compared with control molecule, Richer hydrophobic and an extra H-bond interactions which were consistent with the design principles were observed from protein-21MX007 complex. From MD analysis, Stabilization tendency of protein-21MX007 system in terms of RMSD and Rg values was observed. Moreover, continuous and stable H-bond interactions and a lower average binding free energy demonstrate the good binding affinity of compound 21MX007. The pharmacokinetics prediction and drug-like properties tests have shown the good drug-being potential of compound 21MX007. In summary, after a systematic screening and evaluation, compound 21MX007 could be considered to be a promising IKK-β inhibitor for further studies.
Funding
This research was funded by Xinglin Scholar Research Premotion Project of Chengdu University of TCM (CXTD2018007).
Acknowledgement
We are deeply grateful to Dr. YuZong Chen (Bioinformatics and Drug Design Group, Department of Pharmacy, National University of Singapore, Singapore) and Dr. ShengYong Yang (State Key Laboratory of Biotherapy and Cancer Center, West China Hospital, Sichuan University, China) for their continuous encouragement and valuable suggestions.
Declaration of Competing Interest
The authors declare that they have no known competing financial interests or personal relationships that could have appeared to influence the work reported in this paper.
References
- Function and activation of NF-kappa B in the immune system. Annu. Rev. Immun.. 1994;12(1):141-179.
- [CrossRef] [Google Scholar]
- Docking-based 3D-QSAR modeling of the inhibitors of IMP metallo-β-lactamase. Med. Chem. Res.. 2013;22(4):1730-1739.
- [CrossRef] [Google Scholar]
- Receptor-based 3d-qsar in drug design: methods and applications in kinase studies. Curr. Top. Med. Chem.. 2015;16(13)
- [CrossRef] [Google Scholar]
- The discovery of 2-amino-3,5-diarylbenzamide inhibitors of ikk-alpha and ikk-beta kinases. Bioorg. Med. Chem. Lett. 2007;17(14):3972-3977.
- [CrossRef] [Google Scholar]
- Noncanonical NF-κB Signaling in Health and Disease. Trends Mol. Med.. 2016;22(5):414-429.
- [CrossRef] [Google Scholar]
- Sulfasalazine-induced crystalluria causing severe acute kidney injury. Am. J. Kidney Dis.. 2017;70(6):869-873.
- [CrossRef] [Google Scholar]
- Fang, J., Cao, Z., Song, X., Zhang, X., Xiao, F., 2020. Rhoifolin Alleviates Inflammation of Acute Inflammation Animal Models and LPS-Induced RAW264.7 Cells via IKKβ/NF-κB Signaling Pathway. Inflammation, 43(6), 1-11. doi: 10.1007/s10753-020-01286-x.
- Principles of QSAR models validation: internal and external. QSAR Comb. Sci. 2007;26(5):694-701.
- [CrossRef] [Google Scholar]
- Computational identification of novel natural inhibitors of glucagon receptor for checking type II diabetes mellitus. BMC Bioinformatics. 2014;15(Suppl. 16):S13.
- [CrossRef] [Google Scholar]
- Regulation and Function of IKK and IKK-Related Kinases. Science S Stke. 2006;357:re13.
- [CrossRef] [Google Scholar]
- Using 3D-QSAR and molecular docking insight into inhibitors binding with complex-associated kinases CDK8. J. Mol. Struct.. 2018;1173(5):498-511.
- [CrossRef] [Google Scholar]
- Pharmacophore modeling, multiple docking and molecular dynamics studies on Wee1 kinase inhibitors. J. Biomol. Struct. Dyn.. 2018;37(10):2703-2715.
- [CrossRef] [Google Scholar]
- Discovery of new SIRT2 inhibitors by utilizing a consensus docking/scoring strategy and structure-activity relationship analysis. J. Chem. Inf. Model. 2017;57(4):669.
- [CrossRef] [Google Scholar]
- Ioakimidis, L., Thoukydidis, L., Mirza, A., Naeem, S., Reynisson, J., 2010. Benchmarking the Reliability of QikProp.Correlation between Experimental and Predicted Values. Molecular Informatics, 27(4), 445-456. doi: 10.1002/qsar.200730051
- Jing, P., Zhang, Y., Ran, T., Xu, A., Jiang, Y., 2017. Qsar modeling and in silico design of small-molecule inhibitors targeting the interaction between e3 ligase vhl and hif-1 $$\\alpha $$ α, Molecular Diversity, 21(3), 1-21. doi: 10.1007/s11030-017-9750-y.
- 3D-QSAR and contour map analysis of tariquidar analogues as multidrug resistance protein-1 (MRP1) inhibitors. Int. J. Pharm. Sci. Res.. 2016;7(2):554-572.
- [CrossRef] [Google Scholar]
- 3D flexible alignment using 2D maximum common substructure: dependence of prediction accuracy on target-reference chemical similarity. J. Chem. Inform. Model.. 2014;54(7):1850-1863.
- [CrossRef] [Google Scholar]
- IKK-β inhibitors: An analysis of drug-receptor interaction by using Molecular Docking and Pharmacophore 3D-QSAR approaches. J. Mol. Graph. Model.. 2011;29(1):72-81.
- [CrossRef] [Google Scholar]
- Experimental and computational approaches to estimate solubility and permeability in drug discovery and development settings. Adv. Drug Deliv. Rev.. 2001;46(1–3):3-26.
- [CrossRef] [Google Scholar]
- Neuronal Intrinsic Mechanisms of Axon Regeneration. Annu. Rev. Neurosci.. 2011;34(1):131-152.
- [CrossRef] [Google Scholar]
- ff14SB: Improving the accuracy of protein side chain and backbone parameters from ff99SB. J. Chem. Theory Comput. 2015;11:3696-3713.
- [CrossRef] [Google Scholar]
- Highly Selective, Tight Binding IκB Kinase-2 (IKK-2) Inhibitor: A Tool to Correlate IKK-2 Activity to the Fate and Functions of the Components of the Nuclear Factor-κB Pathway in Arthritis-Relevant Cells and Animal Models. J. Pharmacol. Exp. Ther. 2009;329(1):14-25.
- [CrossRef] [Google Scholar]
- 3,5-disubstituted-indole-7-carboxamides: the discovery of a novel series of potent, selective inhibitors of ikk-β. Bioorg. Med. Chem. Lett.. 2011;21(8):2255-2258.
- [CrossRef] [Google Scholar]
- 3D-QSAR studies on indole and 7-azoindole derivatives as ROCK-2 inhibitors: an integrative computational approach. Comput. Biol. Chem. 2017;71:104-116.
- [Google Scholar]
- Oprea, T.I., Wallerm, C.L., Marshallm, G.R., 1994. Three-dimensional quantitative structure-activity relationship of human immunodeficiency virus (I) protease inhibitors. 2. Predictive power using limited exploration of alternate binding modes. J. Med. Chem. 37(14), 2206-2215. doi: 10.1021/jm00040a013.
- Amelioration of acute inflammation by systemic administration of a cell-permeable peptide inhibitor of NF-kappaB activation. Arthritis & Rheumatology. 2014;52(3):951-958.
- [CrossRef] [Google Scholar]
- Docking study and antiosteoporosis effects of a dibenzylbutane lignan isolated from Litsea cubeba targeting Cathepsin K and MEK1. Med. Chem. Res.. 2018;27:2062-2070.
- [CrossRef] [Google Scholar]
- Modulation of NF-κB signalling by microbial pathogens. Nat. Rev. Microbiol.. 2011;9(4):291-306.
- [CrossRef] [Google Scholar]
- An overview of the Amber biomolecular simulation package. WIREs Comput. Mol. Sci. 2013;3:198-210.
- [CrossRef] [Google Scholar]
- On various metrics used for validation of predictive QSAR models with applications in virtual screening and focused library design. Comb. Chem. High Throughput Screen. 2011;14(6):450-474.
- [CrossRef] [Google Scholar]
- NF-κB AND REL PROTEINS: evolutionarily conserved mediators of immune responses. Annu. Rev. Immunol.. 1998;16(1):225-260.
- [CrossRef] [Google Scholar]
- IkappaB kinase complexes: gateways to NF-kappaB activation and transcription. Oncogene. 2006;25(51):6685-6705.
- [CrossRef] [Google Scholar]
- IκB kinase β (IKKb/IKK2/IKBKB)—a key molecule in signaling to the transcription factor NF-κB. Cytokine Growth Factor Rev. 2008;19(2)
- [CrossRef] [Google Scholar]
- Fingerprint-based clustering applied to define a QSAR model use radius. J. Mol. Graph. Model. 2009;27(2):225-232.
- [CrossRef] [Google Scholar]
- Peptide Drugs QSAR Study Based on Topomer CoMFA. Lett. Drug Des. Discovery. 2017;14(10):1114-1121.
- [CrossRef] [Google Scholar]
- Structural investigation of tetrahydropteridin analogues as selective PLK1 inhibitors for treating cancer through combined QSAR techniques, molecular docking, and molecular dynamics simulations. J. Mol. Liq.. 2021;335:116235.
- [CrossRef] [Google Scholar]
- Design of novel SHP2 inhibitors using Topomer CoMFA, HQSAR analysis, and molecular docking. Struct. Chem.. 2021;32(3):1-16.
- [CrossRef] [Google Scholar]
- Examining the stability of binding modes of the co-crystallized inhibitors of human HDAC8 by molecular dynamics simulation. J. Biomol. Struct. Dyn.. 2020;38(6):1751-1760.
- [CrossRef] [Google Scholar]
- Molecular properties that influence the oral bioavailability of drug candidates. J. Med. Chem.. 2002;45(12):2615-2623.
- [CrossRef] [Google Scholar]
- In silico drug design of inhibitor of nuclear factor kappa b kinase subunit beta inhibitors from 2-acylamino-3-aminothienopyridines based on quantitative structure–activity relationships and molecular docking. Comput. Biol. Chem.. 2019;78:297-305.
- [CrossRef] [Google Scholar]
- Identify of promising isoquinolone jnk1 inhibitors by combined application of 3d-qsar, molecular docking and molecular dynamics simulation approaches. J. Mol. Struct.. 2020;1225(6):129127.
- [CrossRef] [Google Scholar]
- Suppression of NF-kB activity by sulfasalazine is mediated by direct inhibition of IkB kinases α and β. Gastroenterology. 2000;119(5):1209-1218.
- [CrossRef] [Google Scholar]
- 3d-qsar studies on sildenafil analogues, selective phosphodiesterase 5 inhibitors. Bioorg. Med. Chem. Lett.. 2007;17(15):4271-4274.
- [CrossRef] [Google Scholar]
- Docking-based CoMFA and CoMSIA study of azaindole carboxylic acid derivatives as promising HIV-1 integrase inhibitors. SAR QSAR Environ. Res.. 2013;24(10):819-839.
- [CrossRef] [Google Scholar]
- Combinatorial pharmacophore-based 3d-qsar analysis and virtual screening of FGFR1 inhibitors. Int. J. Mol. Sci.. 2015;16(6):13407-13426.
- [CrossRef] [Google Scholar]


