

Translate this page into:
Impact of solvent type, solvent-water concentration, and number of stages on the extraction of coumarin mixture from tamanu (Calophyllum inophyllum) oil and its antioxidant activity
⁎Corresponding author at: Department of Chemical Engineering, Faculty of Industrial Technology and System Engineering, Institut Teknologi Sepuluh Nopember, Keputih, Sukolilo, Surabaya 60111, Indonesia. gunawan@chem-eng.its.ac.id (Setiyo Gunawan)
-
Received: ,
Accepted: ,
This article was originally published by Elsevier and was migrated to Scientific Scholar after the change of Publisher.
Peer review under responsibility of King Saud University.
Abstract
Natural products have been receiving the spotlight from the people of developing and developed countries in recent years due to rising health care expenses and global financial crises. These natural products are the resources for bioactive compounds used in the drug development process. Tamanu seed oil is used for traditional remedies and cosmetic ingredients. The dried seed produces an oil with a yield of 50–75 %. Previous works reported that the seed oil comprised coumarins, one of the eminent groups of phenolics. Coumarins have anticancer, antimicrobial, anti-inflammatory, anticoagulant, antiviral, wound healing properties, and anti-HIV effects. Extraction is often referred to as the sample preparation method as its essential to purify bioactive compounds. In this work, coumarin mixture from tamanu oil was extracted by batchwise multi stages extraction. The effects of solvent used (methanol and ethanol), solvent–water concentration, and the number of stages were studied. The optimal conditions for the extraction of the coumarin mixture were 90 % ethanol and eight stages of extraction, which contributed to 50.73 ± 0.16 % of purity and 92.95 ± 3.76 % of recovery. Also, these conditions removed up to 66 % free fatty acids (FFA) and 100 % triglycerides (TG). It was found that the DPPH inhibition at 400 ppm shows that 90 % ethanol has the highest inhibition (57.72 ± 2.70 %) with an IC50 value of 305 ppm. Moreover, various compounds like pyrrole-2 carboxylate, epicrinamidine, cholestane, and hydroxysclerodin trimethyl ether were also detected in the polar fraction of tamanu oil.
Keywords
Batchwise solvent extraction
Calophyllum inophyllum oil
Coumarin mixture
DPPH inhibition
Health

1 Introduction
Natural products have been receiving the spotlight from the people of developing and developed countries in recent years due to rising health care expenses and financial crises throughout the world (Zhang et al., 2018). These natural products are the resources for bioactive compounds used in the drug development process. A bioactive compound is a product of a secondary metabolite, which significantly affects the life of organisms. The substance is deemed nonvital for the growth or reproduction of organisms, and its quantity is rather limited. However, it helps maintain organisms’ existence from their predators (Mosunova et al., 2020). According to Jamwal et al. (2018), four groups of secondary metabolites are phenolics, terpenes, nitrogen-containing compounds, and sulfur-containing compounds.
Tamanu (Calophyllum inophyllum) is a tall evergreen plant originally from East Africa, India, Sri Lanka, Southeast Asia, Malesia, northern Australia, and the Pacific islands (Lim, 2016). Now, this species has spread globally to East Asia (Japan, Taiwan, Province of China), Somalia, Nigeria, and The United States (Ong et al., 2014). The height of this tree is up to 32 m, and it grows mostly at the seaside (Prabakaran & Britto, 2012). The tree is adaptable to harsh environments like high salinity of the soil, soaring temperature, poor nutritional value, strong breeze, and drought. It has leathery leaves to shield them from salt spray and excess moisture evaporation (Göltenboth et al., 2006).
The dried seed of C. inophyllum produces an oil with a yield of 50–75 % (Rajendran et al., 2021), which has been extensively researched as biodiesel feedstock in several countries, especially India, Malaysia, Indonesia, and Australia during 2011–2017 (Arumugam & Ponnusami, 2019). The oil is also used for traditional remedies and cosmetic ingredients. The seed oil has the effect of reducing arthritis, inflammation, gonorrhea, itching skin, rheumatism, and scabies. It is also used as a wound healing and soothing agent (Lim, 2016). Previous works reported that the seed oil comprised one of the eminent groups of phenolics, coumarins. They are calophyllolide (1), inophyllum C (2), inophyllum E (3) (Spino et al., 1998; Yimdjo et al., 2004), inophyllum P (4), inophyllum B (5) (Spino et al., 1998), calaustralin (6) (Yimdjo et al., 2004), tamanolide (7), tamanolide D (8), tamanolide P (9) (Leu et al., 2009). Calophyllolide was reported to have anticancer (Itoigawa et al., 2001), antimicrobial (Yimdjo et al., 2004), anti-inflammatory (Saxena et al., 1982), anticoagulant (Arora et al., 1962), antiviral (Laure et al., 2008), and wound healing (Nguyen et al., 2017) properties. Inophyllum C, inophyllum E, and inophyllum A showed anticancer and anti-HIV effects (Itoigawa et al., 2001). Meanwhile, inophyllum P and inophyllum B had the potential to be an inhibitor of HIV (Kostova & Mojzis, 2007; Patil et al., 1993). In general, coumarin and its derivatives shows inhibitory effect against different cancer cells including prostate, renal, breast, laryngeal, lung, colon, CNS, leukemia, malignant melanoma (Bhattarai et al., 2021). The structure of coumarins found in tamanu oil were depicted in Fig. 1.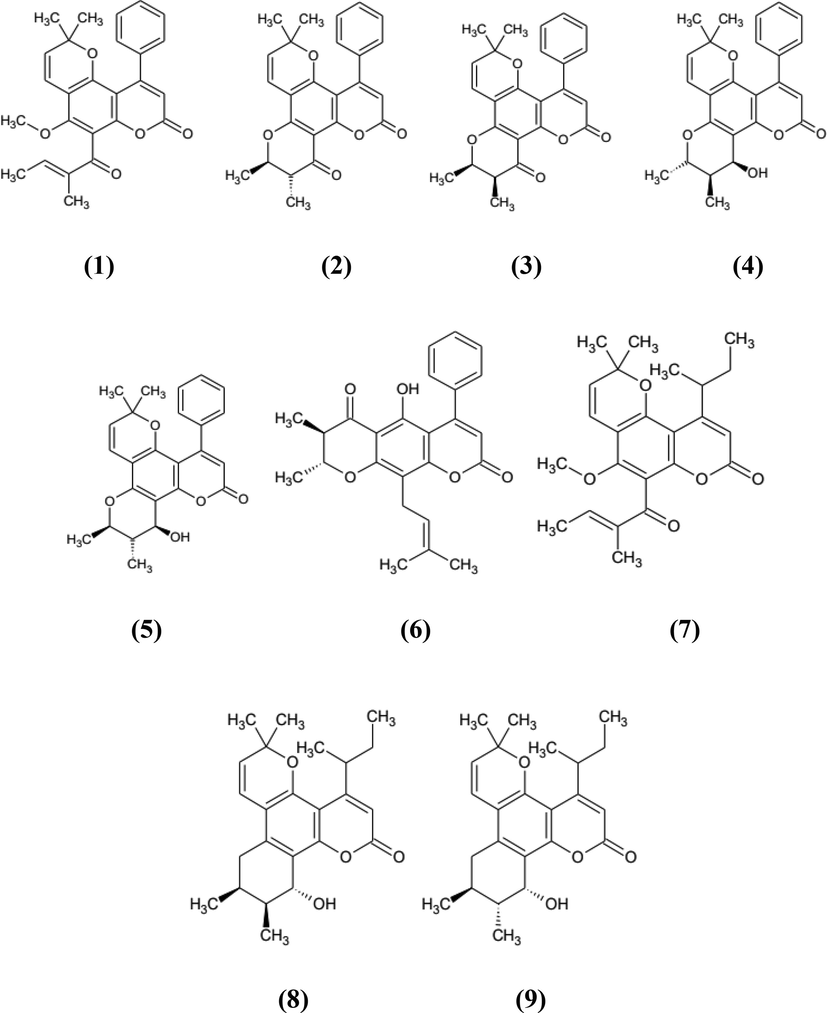
The structure of coumarins.
Previous works isolated coumarins by column chromatography, which is difficult to support large-scale production. In addition, there were no data regarding their recovery (Spino et al., 1998; Yimdjo et al., 2004). Moreover, Gunawan et al. (2020) isolated calophyllolide from tamanu oil with relatively low purity (12.92 %). Batchwise solvent extraction is a process in which the solutes in a liquid solution are transferred or removed to another liquid (the immiscible one). The immiscible liquid must have a different density and selectivity toward solutes in the liquid solution. It is often referred to as the sample preparation method as its essential for purifying bioactive compounds (Azmir et al., 2013). This method was chosen because the operation is relatively simple, the solvents can be recycled, and it supports large-scale production. Aparamarta et al. (2016) isolated the main compound in tamanu oil, triglycerides (TG), using a batchwise solvent extraction method with purity up to 98 %. Therefore, this study aims to evaluate three factors contributing to the purity and recovery of coumarin mixture in the polar lipid fraction (PLF): solvent type, solvent–water concentration, and the number of extraction stages. The antioxidant capacity and the compounds in the PLF were also studied. General full factorial design was used in this study to optimize the results obtained from factors with different numbers of levels.
2 Material and methods
2.1 Materials
The C. inophyllum seed oil was supplied from Jarak Lestari cooperative in Cilacap, Indonesia. DPPH free radical (2,2-diphenyl-1-picrylhydrazil) was purchased from Smartlab (India), and ascorbic acid was purchased from Sigma Aldrich (Sternheim, Germany). Thin-layer chromatography (TLC) silica gel aluminum sheets (20 cm × 20 cm × 250 µm) and acetic acid were purchased from Merck (Darmstadt, Germany). All solvents were obtained from Chemical Indonesia Multi Sentosa (Surabaya, Indonesia).
2.2 Coumarin mixture extraction
The method was previously described by Aparamarta et al. (2016), but with modifications on the solvent. First, 50 g (54 mL) of tamanu oil was dissolved in 187.5 g (285 mL) of n-hexane, then followed by the addition of a polar solvent. N-hexane and the polar solvent ratio was 1:3 (g/g). The mass ratio of tamanu oil to solvents was 1:5 (g/g). The polar solvent is referred to the ethanol (EtOH) with a concentration of 70 %, 80 %, 90 %, and 96 % (solvent in water), and methanol (MeOH) with a concentration of 70 %, 80 %, 90 %, and 100 % (solvent in water). Then, the mixture was put on top of a hotplate stirrer and stirred at speeds of 300 rpm for 5 min. Soon after, the mixture was introduced into a separatory funnel to form upper (n-hexane fraction) and lower (polar solvent fraction) layers. Next, the polar solvent fraction was separated from the n-hexane fraction. This polar solvent fraction was designated as PLF 1 after solvent removal. For stage 2, the fresh polar solvent was added to the n-hexane fraction with a volume equal to the polar solvent volume in stage 1. Then, the process was followed by stirring the mixture and separating and removing the polar solvent to obtain PLF 2. Next, the steps were repeated until the eighth stage. After that, each PLF was analyzed by TLC and GC analyses.
2.3 Thin-layer chromatography (TLC) analysis
Before applying the sample to the silica gel-coated aluminum sheet, the starting line was drawn with a pencil. Then, the samples were applied to the marked spots. Afterward, the mobile phase was introduced to the TLC chamber, and its level was maintained below the spots’ mark. Next, the silica gel-coated aluminum sheet was immersed in the mobile phase with a lid on top of the chamber. The mobile phase was made of n-hexane, ethyl acetate, and acetic acid with a ratio of 80:20:1 (v/v). After the spots were developed, the sheet was taken out from the chamber, and it was dried at room temperature. Then, the spots were seen under a UV light chamber (λ254 nm). This method is for qualitative analysis, as described by Aparamarta et al. (2016).
2.4 Gas chromatography (GC) analysis
Shimadzu GC-2010 (Kyoto, Japan) with a flame ionized detector (FID) was used to analyze the extracts quantitatively. The sample was injected into a nonpolar column Agilent DB-5HT ((5 %-phenyl)-methylpolysiloxane (15 m × 0.32 mm i.d.; Agilent Technologies, Palo Alto, CA) and carried by nitrogen gas. Hydrogen was required as a flame ignition gas. The temperature of the injector and detector was adjusted to 370 °C. The initial column temperature was 80 °C, then it was increased to 365 °C with a rate of 15 °C/min. At 365 °C, the temperature was held for 8 min. The concentration of the sample injected into the instrument was 20 mg/mL of ethyl acetate.
2.5 Antioxidant capacity
The antioxidant capacity was measured with the method described in the previous work (Do et al., 2014) with modifications. Each sample (40 mg) was dissolved into 100 mL of methanol. This is followed by the dilution of 4 mg of DPPH with 100 mL of methanol. Sample solution (1 mL) was added to 3 mL of DPPH solution. The mixture was put in an incubator shaker for 30 min with a speed of 125 rpm. And then, the absorbance was recorded at 517 nm by using UV–vis spectrophotometer Cecil CE-1011 (Cambridge, UK).
The extract having the highest antioxidant capacity was investigated for its IC50 value and compared to the IC50 value of ascorbic acid. To obtain their IC50 value, the extract was prepared in several concentrations (200, 300, 400, 500, and 600 ppm), and the ascorbic acid with concentrations of 5, 10,15, 20, and 25 ppm. Antioxidant capacity was measured as DPPH inhibition (%) presented in Equation (1).
is the absorbance of DPPH solution without sample and
is the absorbance of sample and DPPH.
2.6 Gas chromatography-mass spectrometry (GCMS) analysis
Agilent 6980 N Network GC System with autosampler was employed to analyze the PLF. The instrument was equipped with Agilent 5937 inert MSD detector and HP-5MS column (0.25 mm × 30 m × 0.25 µm) from J&W Scientific. The inlet was using sample split ratio of 1/100 at 250 °C. The oven was programmed at 50 °C for 5 min, then the temperature was increased at a rate of 10 °C/min until it reached 280 °C. Then, the temperature was held for 15 min. The instrument used a library from Wiley 7.0. A sample volume of 0.4 µL was injected into the instrument.
2.7 Full factorial design
A general full factorial design was used in this study to examine the main effects and interaction effects of several factors consisting different numbers of levels. The factors and levels can be seen in Table 1.
Factor
Levels
Level values
Solvent type
2
Methanol
Ethanol
Concentration
4
70
80
90
100
Number of stages
8
1
2
3
4
5
6
7
8
2.8 Statistical analysis
The results of each analysis were reported as average values with their usual derivations after being performed two times. The software Minitab 18 was used to examine the data. One-way analysis of variance was used for statistical comparisons, and p-value < 0.05 were considered significant.
3 Results and discussion
3.1 Impact of solvent type on the purity and recovery of coumarin mixture
Extraction is acknowledged as the most important part of obtaining high purity and recovery of a certain substance from plants. It is also very challenging to extract a fairly limited compound from plant matrixes because the major components are mostly present in the extract with a high percentage. The extraction method, size of particles, solvents, characteristics of the targeted compounds, and impurities become the determining factors for achieving the best result (Do et al., 2014). Coumarin mixture content in tamanu oil used in this research was only 11.96 %. Besides, triglyceride/TG (51.16 %), free fatty acids/FFA (25.87 %), diglycerides/DG (7.89 %), monoglycerides/MG (0.53 %), and others (2.59 %) were contained in the oil.
In this work, the coumarin mixture from tamanu oil was extracted using low-cost and low boiling point solvents, such as methanol and technical-grade ethanol, as polar solvents with various concentrations (70 %-100 %). It was started by dissolving the oil into n-hexane (nonpolar solvent). Then, a polar solvent like ethanol or methanol with certain composition was added to it. After eight stages of extraction, each PLF was analyzed by TLC and GC. The typical result of TLC analysis is depicted in Fig. 2.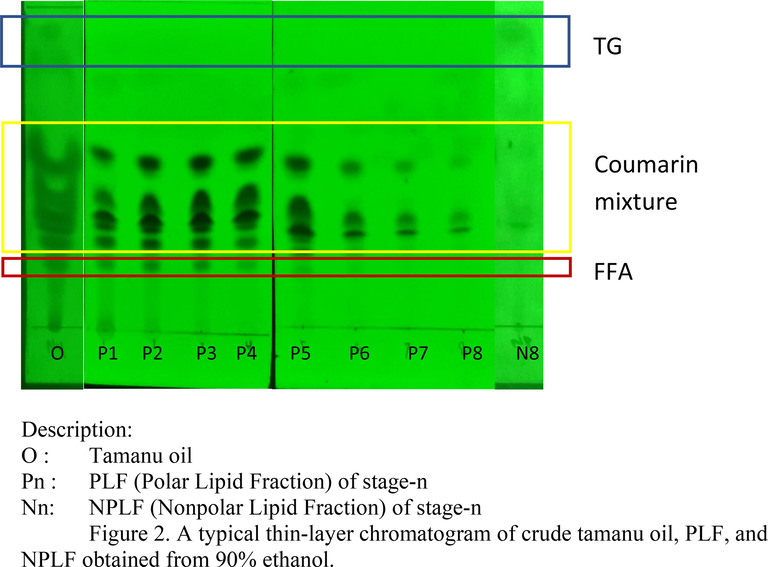
A typical thin-layer chromatogram of crude tamanu oil, PLF, and NPLF obtained from 90% ethanol.
In Fig. 2, it can be seen that crude tamanu oil has spots for TG, coumarin mixture, and FFA. But as the stage of extraction was repeated until the 8th stage, the TG spot was undetected, which means that the compound had been removed from the PLF. In contrast, TG was detected in NPLF8. The number of spots in the coumarin mixture was decreased by adding stages of extraction, also indicating that there was a separation. The purity of the coumarin mixture is depicted in Fig. 3.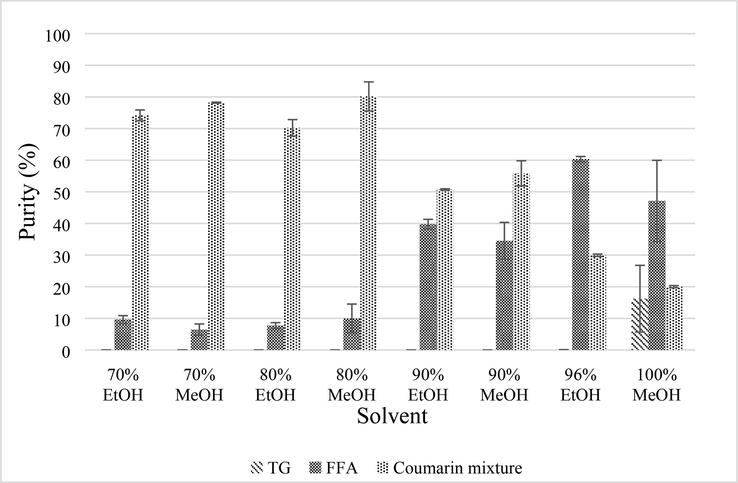
Purity of coumarin mixture, FFA, and TG in PLF 8 obtained from various solvent system.
Fig. 3 shows that the highest purity of coumarin mixture is obtained from 80 % methanol (80.26 ± 4.59 %). This is followed by 70 % methanol (78.18 ± 0.16 %), 70 % ethanol (74.16 ± 1.73 %), 80 % ethanol (70.23 ± 2.61 %), 90 % methanol (55.86 ± 3.96 %), 90 % ethanol (50.73 ± 0.23 %), 96 % ethanol (29.95 ± 0.37 %), and 100 % methanol (20.01 ± 0.35 %). This result stipulates that the purity of coumarin increased by the higher polarity of a solvent. The polarity index of ethanol and methanol are 5.1 and 6.6, respectively (Snyder, 1974). However, statistical analysis shows that the coumarin mixture produced by ethanol or methanol has insignificant difference (p > 0.05).
The recovery of the coumarin mixture is shown in Fig. 4. It implies that the highest recovery of coumarin mixture is obtained by employing 90 % methanol (96.03 ± 3.65 %). Then, the recovery of coumarin mixture is decreased by the following orders: 90 % ethanol (92.95 ± 2.66 %), 96 % ethanol (92.65 ± 2.51 %), 80 % methanol (80.88 ± 0.75 %), 100 % methanol (73.55 ± 6.23 %), 80 % ethanol (70.23 ± 1.38 %), 70 % methanol (32.74 ± 5.12 %), and 70 % ethanol (30.60 ± 0.21 %). Overall, solvent type gives significant results for coumarin mixture recovery (p < 0.05). However, the statistical analysis between the result of 90 % methanol and 90 % ethanol shows there is an insignificant difference. Previous works reported that methanol is the best to extract phenolic compounds from plants (Boskov et al., 2021; Chigayo et al., 2016; Do et al., 2014; Hapsari et al., 2022; Metrouh-Amir et al., 2015; Tan et al., 2013; Turkmen et al., 2006). Ethanol extraction is preferred to methanol because ethanol is less toxic. The lethal dose of methanol is 1 g/kg body weight (1 g = 1.2 mL), while the lethal dose of ethanol is 3–5 g/kg body weight depending on the alcohol tolerance and organs’ condition (Jacobsen & McMartin, 1996).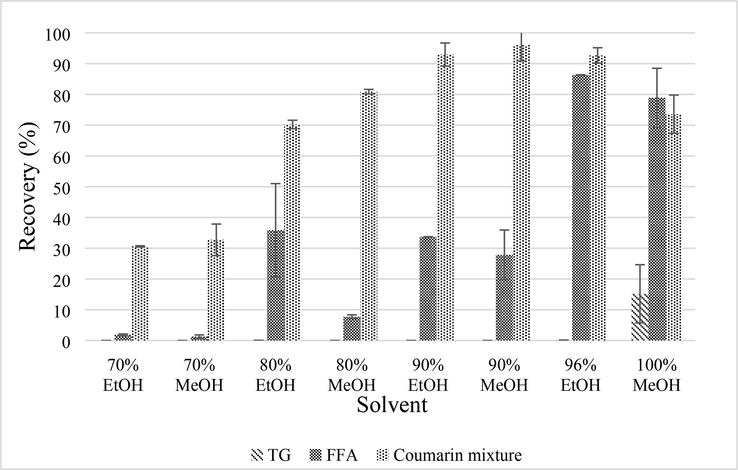
Recovery of coumarin mixture, FFA, and TG in PLF 8 obtained from various solvent system.
3.2 Impact of solvent–water concentration on the purity and recovery of coumarin mixture
Water is a substance with a polarity index of 9. By adding water, the polarity of solvent becomes the addition of pure solvent’s index polarity multiplied by its percentage and water’s index polarity times multiplied by its percentage in the mixture. It can be seen in Fig. 2 that reducing water concentration in solvent results in the decrease of coumarin mixture purity. When the concentration of water was reduced, the solvent became less polar, and it became a suitable medium for FFA and TG to dissolve.
There is another theory to explain this phenomenon designated as LogP. It is a comparison of compound solubility between two immiscible solvents. Commonly, these solvents are 1-octanol (lipophilic) and water (lipophobic). LogP of water, solvents, compounds and their representatives are listed in Table 2. Coumarin (calophyllolide) has the lowest value amongst all of tamanu oil’s compounds, which means that coumarin is more hydrophilic than other compounds. Therefore, this substance is soluble in the solvent system containing a relatively high percentage of water. A concentration of 70 % methanol or ethanol resulted in coumarin mixture purity up to 70 %. However, its recovery decreased to 30 %. It indicates that at this concentration, the coumarin mixture becomes less soluble. In Hapsari et al. (2022), most of the researchers found that high phenolic content was achieved by using methanol and ethanol with concentrations of 50 %-100 % (solvent in water)(Boskov et al., 2021; Chigayo et al., 2016; Do et al., 2014; Metrouh-Amir et al., 2015; Tan et al., 2013; Turkmen et al., 2006). aRetrieved from EPI Suite v.4.11.
Compounds
LogP
Triglyceride
Tristearin
23.93
Triolein
23.29
Tripalmitin
20.99
Diglyceride
1,3-distearin
15.07
1,3-diolein
14.64
1,3-dipalmitin
13.11
Free fatty acid
Stearic acid
7.94
Oleic acid
7.73
Palmitic acid
6.96
Monoglyceride
Monostearin
6.62
Monoolein
6.40
Monopalmitin
5.63
Coumarin
Calophyllolide
5.21
Ethanol
−0.14
Methanol
−0.63
Water
−1.38
3.3 Impact of number of stages on the purity and recovery of coumarin mixture
The extraction was conducted sequentially until the eighth stage to increase the recovery of the coumarin mixture. Each PLF was analyzed by GC to obtain the content of each compound. Compositions of PLF obtained from 90 % ethanol were tabulated in Table 3. The result shows that coumarin mixture purity gradually decreased from stage 1 (68.34 ± 0.06 %) to stage 8 (50.73 ± 0.16 %). Ten percent of water in the polar solvent can not dissolve TG, instead of 39.79 ± 1.08 % of FFA accumulated in the last stage. It happened because the molecule structure of FFA consists of long chain hydrocarbon and a hydroxyl group. This hydroxyl group has a polar nature which can be attracted to the hydroxyl group in the structure of water or ethanol when the atoms are polarized.
Stage
FFA (%)
Coumarin mixture (%)
MG (%)
DG (%)
TG (%)
Others (%)
1
18.79 ± 0.58a
68.34 ± 0.06
3.12 ± 0.08
0.00 ± 0.00
0.00 ± 0.00
8.86 ± 2.26
(4.04 ± 1.32)b
(32.05 ± 11.78)
(32.80 ± 10.97)
(0.00 ± 0.00)
(0.00 ± 0.00)
(21.50 ± 9.99)
1–2
25.19 ± 0.84
63.00 ± 0.05
3.06 ± 0.02
0.08 ± 0.11
0.00 ± 0.00
8.28 ± 1.70
(10.24 ± 1.60)
(55.64 ± 11.21)
(60.99 ± 11.82)
(0.12 + 0.17)
(0.00 ± 0.00)
(35.79 ± 11.91)
1–3
28.08 ± 0.24
60.68 ± 0.58
2.95 ± 0.05
0.12 ± 0.17
0.00 ± 0.00
7.90 ± 1.42
(15.14 ± 1.86)
(70.78 ± 8.65)
(77.82 ± 8.77)
(0.24 ± 0.34)
(0.00 ± 0.00)
(44.37 ± 11.66)
1–4
31.27 ± 0.48
58.01 ± 0.36
2.77 ± 0.02
0.14 ± 0.20
0.00 ± 0.00
7.60 ± 1.29
(19.84 ± 1.49)
(79.66 ± 7.02)
(85.87 ± 7.24)
(0.32 ± 0.45)
(0.00 ± 0.00)
(49.81 ± 11.19)
1–5
34.07 ± 1.03
55.63 ± 0.13
2.60 ± 0.02
0.16 ± 0.22
0.00 ± 0.00
7.37 ± 1.26
(24.03 ± 0.67)
(85.00 ± 6.29)
(89.85 ± 7.15)
(0.39 ± 0.55)
(0.00 ± 0.00)
(53.44 ± 11.02)
1–6
35.82 ± 0.82
54.13 ± 0.08
2.49 ± 0.01
0.17 ± 0.25
0.00 ± 0.00
7.24 ± 1.20
(27.29 ± 0.58)
(89.28 ± 4.60)
(92.73 ± 5.68)
(0.45 ± 0.64)
(0.00 ± 0.00)
(56.44 ± 10.61)
1–7
37.82 ± 0.91
52.43 ± 0.01
2.38 ± 0.03
0.19 ± 0.27
0.00 ± 0.00
7.05 ± 1.16
(30.54 ± 0.21)
(91.64 ± 3.79)
(93.96 ± 5.33)
(0.51 ± 0.72)
(0.00 ± 0.00)
(58.14 ± 10.25)
1–8
39.79 ± 1.08
50.73 ± 0.16
2.29 ± 0.03
0.20 ± 0.29
0.00 ± 0.00
6.88 ± 1.12
(33.68 ± 0.08)
(92.95 ± 3.76)
(94.62 ± 5.21)
(0.58 ± 0.82)
(0.00 ± 0.00)
(59.31 ± 10.24)
In Table 3, it can be observed that the recovery of the coumarin mixture was significantly increased from 32.05 ± 11.78 % to 92.95 ± 3.76 %. The recovery of FFA was also increased from 4.04 ± 1.32 % to 33.68 ± 0.08 % due to the van der Waals force between a molecule of FFA and ethanol or water. The recovery of TG dan DG was very low because molecules of TG and DG consist of long chain hydrocarbon. The main difference between these two compounds is the number of the hydroxyl group in their molecules. TG has no hydroxyl group, while DG has one. In contrast, recovery of MG in the eighth stage was up to 92.95 ± 3.76 % because there are two hydroxyl groups per molecule of MG. Statistically, a number of stages have a significant effect on the purity and recovery of the coumarin mixture.
A general full factorial design was conducted to study the impact of all parameters combined together on the purity and recovery of coumarin mixture extraction from tamanu oil. The one-factor-at-a-time (OFAT) was not selected for this extraction optimization because the method is unable to determine the interaction between factors. There were three factors: solvent type, solvent–water concentrations, and the number of extraction stages. Technical grade ethanol concentrations consist of 4 levels (70, 80, 90, and 96 %) and methanol concentrations were 70 %, 80 %, 90 %, 100 %. Meanwhile, the number of extraction stage consists of 8 levels (1st stage to 8th stage). The total runs for this experiment were 2 × 4 × 8 × 2 replicate = 168 experiments. The goodness of the model fit for purity and recovery of coumarin mixture was checked by using a normal probability plot, as depicted in Fig. 5. It can be seen that points of coumarin mixture purity and recovery form the straight lines associated with normal distribution. Table 4 indicates that each factor statistically significant toward the purity of coumarin mixture with p-value < 0.05 as well as interaction between solvent type*solvent concentrations and solvent concentration*number of stages. However, the interaction among the three factors are insignificant. The R2 value shows that the model can explain a 98.92 % variation in the purity of coumarin mixture.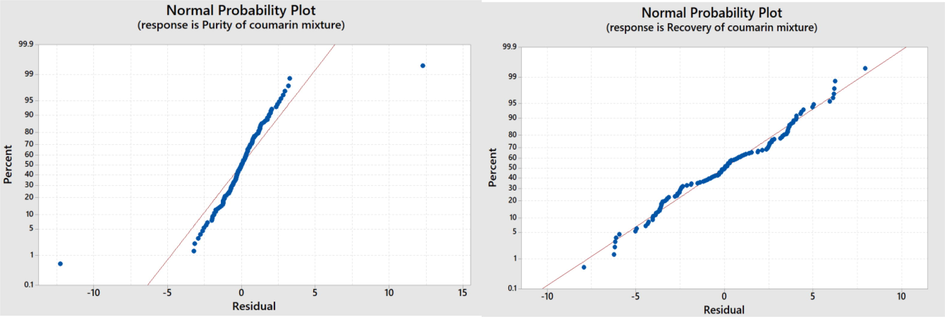
Normal probability plot of residuals for purity (a) and recovery (b) of coumarin mixture.
Source
DF
Adj SS
Adj MS
F-Value
P-Value
Analysis of variance test result for the purity of coumarin mixture
Model
63
48883.3
775.9
93.26
0.000
Linear
11
45020.2
4092.7
491.93
0.000
Solvent type
1
24.0
24.0
2.88
0.094
Solvent concentration
3
44471.2
14823.7
1781.76
0.000
Number of stages
7
525.0
75.0
9.02
0.000
2-Way Interactions
31
3773.1
121.7
14.63
0.000
Solvent type*Solvent concentration
3
2832.5
944.2
113.48
0.000
Solvent type*Number of stages
7
58.2
8.3
1.00
0.440
Solvent concentration*Number of stages
21
882.5
42.0
5.05
0.000
3-Way Interactions
21
90.0
4.3
0.52
0.954
Solvent type*Solvent concentration*Number of stages
21
90.0
4.3
0.52
0.954
Error
64
532.5
8.3
Total
127
49415.8
Source
S
R2
R2 (adj)
R2 (pred)
Model summary
2.88
98.92
97.86
95.69
The significance of each factor and their interactions toward coumarin mixture recovery is presented in Table 5. Interaction between solvent concentrations and number of stages as well ass interaction of the three factors are statistically insignificant (p-value > 0.05). However, the R2 value indicates that the model represents a 98.67 % variation in the coumarin mixture’s recovery.
Source
DF
Adj SS
Adj MS
F-Value
P-Value
Analysis of variance test result for the recovery of coumarin mixture
Model
63
103,611
1644.6
75.56
0.000
Linear
11
94,425
8584.1
394.36
0.000
Solvent type
1
232
232.4
10.68
0.002
Solvent concentration
3
61,974
20658.0
949.04
0.000
Number of stages
7
32,219
4602.7
211.45
0.000
2-Way Interactions
31
8935
288.2
13.24
0.000
Solvent type*Solvent concentration
3
4262
1420.6
65.26
0.000
Solvent type*Number of stages
7
218
31.2
1.43
0.208
Solvent concentration*Number of stages
21
4455
212.2
9.75
0.000
3-Way Interactions
21
251
11.9
0.55
0.937
Solvent type*Solvent concentration*Number of stages
21
251
11.9
0.55
0.937
Error
64
1393
21.8
Total
127
105,004
Source
S
R2
R2 (adj)
R2 (pred)
Model summary
4.66
98.67
97.37
94.69
The general full factorial design was employed in this study to obtain the optimal conditions for coumarin mixture extraction from tamanu seed oil. The optimal conditions for maximizing the extraction efficiency (purity and recovery) are: aqueous methanol with a concentration of 80 % and using eight stages of extraction with composite desirability of 0.8710, which are indicated in Fig. 6. These predicted results (80.165 % purity and 80.875 % recovery) are in agreement with the experiment result (80.163 ± 4.59 % purity and 80.879 ± 5.05 % recovery) showing that the predicted model is valid. Nevertheless, extraction is the first step for purifying a compound, and a higher recovery of the coumarin mixture is preferred. For this reason, 90 % ethanol is chosen as the optimal condition to extract the coumarin mixture since the result between 90 % ethanol (50.73 ± 0.16 % purity and 92.95 ± 3.76 % recovery) and 90 % methanol (55.86 ± 3.96 % purity and 96.03 ± 5.17 %) is considered insignificant (p-value < 0.05). No previous work reported the extraction of coumarin mixture from tamanu oil.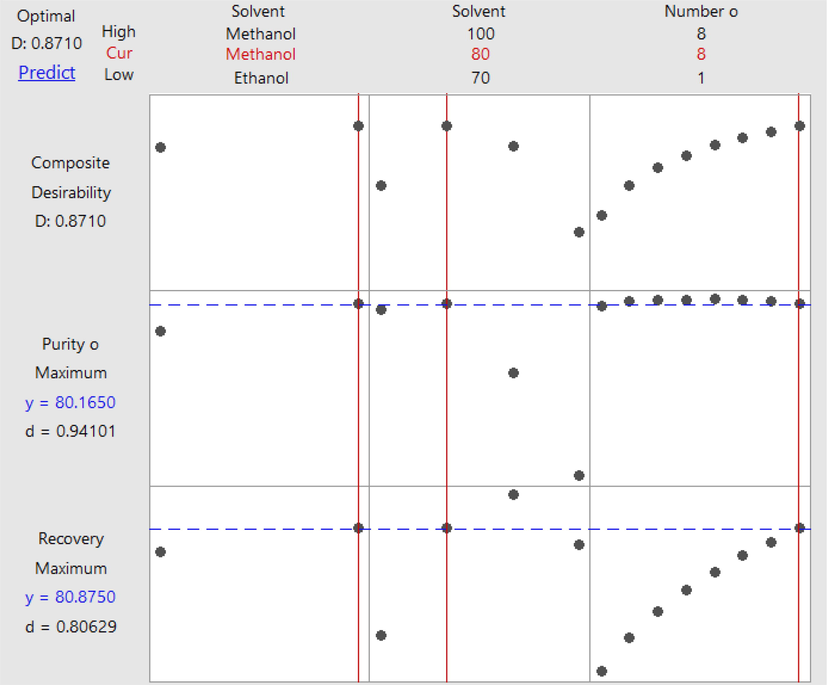
Optimization response of coumarin mixture‘s purity and recovery.
3.4 Antioxidant capacity of coumarin mixture extracts
DPPH is frequently used for the evaluation of antioxidant capacity from plant extract. The color is black in its powder state. However, it turns to deep purple when it dissolves in a solvent like methanol. This color is emitted by the displacement of the odd electron on the nitrogen atom of DPPH. The color of DPPH can change from purple to yellow or colorless when it is neutralized. The neutralization of DPPH occurs when it reacts with any compound capable of donating its proton (hydrogen). The highest absorption band of DPPH is at 517 nm. The extracts from tamanu oil were analyzed for their antioxidant capacity at a concentration of 400 ppm. The prominent anti free radical, ascorbic acid, was used as the positive control in this assay. The extract with the highest inhibition percentage and ascorbic acid were examined in IC50 value, defined as the quantity of antioxidant substance required to deplete half concentration of DPPH. A lower IC50 value means that a small amount of the substance is capable of decreasing 50 % of DPPH concentration. The results of DPPH inhibition are shown in Table 6.
Solvent
DPPH inhibition at 400 ppm
70 % Ethanol
43.59 ± 1.23 %
70 % Methanol
39.35 ± 0.76 %
80 % Etanol
51.63 ± 3.12 %
80 % Methanol
49.42 ± 0.46 %
90 % Ethanol
57.72 ± 2.70 %
90 % Methanol
54.39 ± 3.55 %
96 % Ethanol
50.25 ± 0.24 %
100 % Methanol
34.75 ± 1.46 %
Based on Table 6, the highest inhibition is produced by 90 % ethanol and followed by 90 % methanol in a slight percentage. It happens because the recovery of coumarin mixture and FFA are quite high in PLF of 90 % ethanol. DPPH activity is inhibited if there is a proton donating compound. Besides the coumarin mixture, FFA has the capability to donor its proton because of a hydroxyl group on its molecule. Then, the PLF of 90 % ethanol and ascorbic acid were evaluated for their IC50 value. The IC50 value of the PLF of 90 % ethanol and ascorbic acid were 305 and 13.3 ppm, respectively.
3.5 Identification of coumarin mixture
PLF was analyzed by GCMS to give further identification of its composition. The list of compounds can be seen in Table 7. Various compounds like pyrrole-2 carboxylate, epicrinamidine, cholestane, and trimethyl ether were detected in the polar fraction of tamanu oil. Pyrrole-2 carboxylate (10) has been employed in the synthesis for inhibitors of AIDS and other pharmaceuticals (Trofimov and Nedolya, 2008). In addition, epicrinamidine (11) has potential to be an anticancer, anti bacterial, and antitumor agent (Sebola et al., 2020). Their structure can be seen in Fig. 7. However, the quality of compounds is under 95 %. Therefore, isolation is required as the next step to give a more accurate GCMS analysis.
Retention time (min)
Compound name
Similarity (%)
24.51
t-Butyl (Z)-5-[2′,5′-dihydro-5′-oxofuran-2′-ylidene) methyl]-3,4-dimethyl-1H-pyrrole-2-carboxylate
64
25.33
Epicrinamidine
70
25.69
Epicrinamidine
91
26.40
Methyl 6-methyl-11,12-dioxo-12-phenyl-12-aza-tricyclo[8.3.0.0(3,8)]tridec-3(8),4,6-trien-4-carboxylate
52
26.86
Anti-4-Aza-B-homo-5.alpha.-cholestan-3-one
72
27.18
3-Aza-B-homo-5.alpha.-cholestan-4-one
64
27.50
8-Hydroxysclerodin trimethyl ether
53
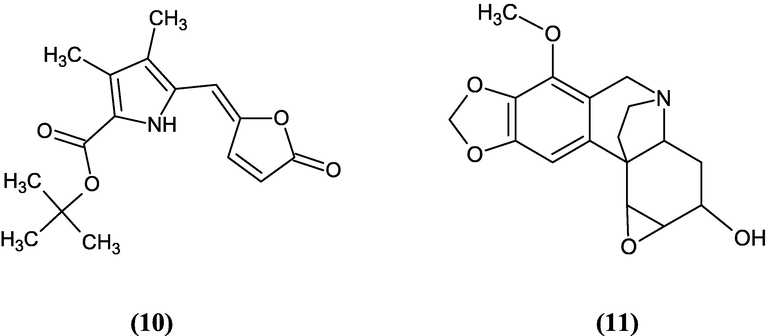
The structure of pyrrole-2 carboxylate (10) and epicrinamidine (11).
4 Conclusion
The effects of solvent type, solvent–water concentration, and a number of stages on the extraction of coumarin mixture from tamanu (Calophyllum inophyllum) oil and its antioxidant activity were investigated in this work. The solvent type was insignificantly affected the purity of coumarin mixture in the PLF but its recovery. Both solvent–water concentration and number.
of stages affected the purity and recovery of coumarin mixture. The optimal conditions for the extraction of coumarin mixture were 90 % ethanol and eight stages of extraction, which contributing to 50.73 ± 0.16 % of purity and 92.95 ± 3.76 % of recovery. Also, these conditions removed up to 66 %% FFA and 100 % TG. Moreoever, the DPPH inhibition at 400 ppm shows that 90 % ethanol has the highest inhibition (57.72 ± 2.70 %) with IC50 value of 305 ppm. It was found that various compounds like pyrrole-2 carboxylate, epicrinamidine, cholestane, and hydroxysclerodin trimethyl ether were also detected in the polar fraction of tamanu oil.
Acknowledgments
The authors would like to give an appreciation to the Directorate General of Resources for Science, Technology and Higher Education, Ministry of Research and Technology/National Research and Innovation Agency of Republic Indonesia (No. 1561/PKS/ITS/2022) for the financial support in this research.
Declaration of Competing Interest
The authors declare that they have no known competing financial interests or personal relationships that could have appeared to influence the work reported in this paper.
References
- Separation and purification of triacylglycerols from nyamplung (Calophyllum inophyllum) oil by batchwise solvent extraction. Ind. Eng. Chem. Res.. 2016;55(11):3113-3119.
- [CrossRef] [Google Scholar]
- Calophyllolide, a complex coumarin anticoagulant from Calophyllum inophyllum Linn. J. Pharm. Pharmacol.. 1962;14(1):534-535.
- [CrossRef] [Google Scholar]
- Biodiesel production from Calophyllum inophyllum oil a potential non-edible feedstock: an overview. Renew. Energy. 2019;131:459-471.
- [CrossRef] [Google Scholar]
- Techniques for extraction of bioactive compounds from plant materials: a review. J. Food Eng.. 2013;117(4):426-436.
- [CrossRef] [Google Scholar]
- Bhattarai, N., Kumbhar, A. A., Pokharel, Y. R., & Yadav, P. N. (2021). Anticancer Potential of coumarin and its derivatives. Mini Reviews in Medicinal Chemistry, 2021;21(19):2996-3029. doi: 10.2174/1389557521666210405160323. PMID: 33820507.
- Black locust flowers: antioxidant extraction kinetics, reducing capacity, mineral composition, and antioxidant activity. Chem. Eng. Commun.. 2021;209(9):1182-1190.
- [CrossRef] [Google Scholar]
- Phytochemical and antioxidant properties of different solvent extracts of Kirkia wilmsii tubers. Asian Pac. J. Trop. Biomed.. 2016;6(12):1037-1043.
- [CrossRef] [Google Scholar]
- Effect of extraction solvent on total phenol content, total flavonoid content, and antioxidant activity of Limnophila aromatica. J. Food Drug Anal.. 2014;22(3):296-302.
- [CrossRef] [Google Scholar]
- Göltenboth, F., Langenberger, G., & Widmann, P. (2006). BEACH FORESTS. In Ecology of Insular Southeast Asia: The Indonesian Archipelago. Elsevier B.V. https://doi.org/10.1016/B978-0-444-52739-4.50016-4.
- Gunawan, S., Pamungkas, B., Shantika, C., Hapsari, S., & Wirawasista, H. (2020). Calophyllolide Separation from Calophyllum inophyllum Oil by Silica Gel Adsorption. Materials Science Forum, 988, 101–107. https://doi.org/10.4028/www.scientific.net/MSF.988.101.
- Phenolic and flavonoid compounds extraction from Calophyllum inophyllum leaves. Arab. J. Chem.. 2022;15(3):103666
- [CrossRef] [Google Scholar]
- Cancer chemopreventive agents, 4-phenylcoumarins from Calophyllum inophyllum. Cancer Lett.. 2001;169:15-19.
- [Google Scholar]
- Alcohols and glycols. In: Human Toxicology. ELSEVIER SCIENCE B.V; 1996. p. :623-648.
- [CrossRef] [Google Scholar]
- Plant growth regulator mediated consequences of secondary metabolites in medicinal plants. J. Appl. Res. Med. Aromat. Plants. May 2018;9:26-38.
- [CrossRef] [Google Scholar]
- Biologically active coumarins as inhibitors of HIV-1. Future HIV Ther.. 2007;1(3):315-329.
- [CrossRef] [Google Scholar]
- Screening of anti-HIV-1 inophyllums by HPLC-DAD of Calophyllum inophyllum leaf extracts from French Polynesia Islands. Anal. Chim. Acta. 2008;624(1):147-153.
- [CrossRef] [Google Scholar]
- New tricyclic and tetracyclic pyranocoumarins with an unprecedented C-4 substituent. structure elucidation of tamanolide, tamanolide D and tamanolide P from Calophyllum inophyllum of French Polynesia. Magn. Reson. Chem.. 2009;47:989-993.
- [CrossRef] [Google Scholar]
- Lim, T. K. (2016). Edible Medicinal and Non-Medicinal Plants. In Edible Medicinal and Non-Medicinal Plants. Springer Dordrecht. https://doi.org/10.1007/978-3-319-26065-5.
- Solvent effect on total phenolic contents, antioxidant, and antibacterial activities of Matricaria pubescens. Ind. Crop. Prod.. 2015;67:249-256.
- [CrossRef] [Google Scholar]
- The biosynthesis of fungal secondary metabolites: from fundamentals to biotechnological applications. Ref. Module Life Sci.. 2020;1–19
- [CrossRef] [Google Scholar]
- Anti-inflammatory and wound healing activities of calophyllolide isolated from Calophyllum inophyllum Linn. PLoS One. 2017;12(10):1-16.
- [Google Scholar]
- Optimization of biodiesel production and engine performance from high free fatty acid Calophyllum inophyllum oil in CI diesel engine. Energ. Conver. Manage.. 2014;81:30-40.
- [CrossRef] [Google Scholar]
- The inophyllums, novel inhibitors of HIV-1 reverse transcriptase isolated from the Malaysian tree, Calophyllum inophyllum Linn. J. Med. Chem.. 1993;36(26):4131-4138.
- [Google Scholar]
- Biology, agroforestry and medicinal value of Calophyllum inophyllum L. (Clusiacea): a review. Int. J. Nat. Prod. Res.. 2012;1(2):24-33.
- [Google Scholar]
- Rajendran, N., Gurunathan, B., & I., A. E. S. (2021). Optimization and technoeconomic analysis of biooil extraction from Calophyllum inophyllum L. seeds by ultrasonic assisted solvent oil extraction. Industrial Crops and Products, 162(January), 113273. https://doi.org/10.1016/j.indcrop.2021.113273
- Eftect of Calophyllolide, a nonsteroidal anti-inflammatory agent, on capillary permeability. J. Med. Plant Res.. 1982;44:246-248.
- [Google Scholar]
- Antibacterial and anticancer activity and untargeted secondary metabolite profiling of crude bacterial endophyte extracts from Crinum macowanii baker leaves. Int. J. Microbiol.. 2020;2020
- [CrossRef] [Google Scholar]
- Classification of the solvent properties of common liquids. J. Chromatogr.. 1974;92:223-230.
- [CrossRef] [Google Scholar]
- Anti-hiv coumarins from calophyllum seed oil. Bioorg. Med. Chem. Lett.. 1998;8:3475-3478.
- [Google Scholar]
- Effects of extraction solvent system, time and temperature on total phenolic content of henna (Lawsonia inermis) stems. Int. Food Res. J.. 2013;20(6):3117-3123.
- [Google Scholar]
- Pyrroles and their Benzo Derivatives: Reactivity. In: Katritzky Alan R., Ramsden Christopher A., Scriven Eric F.V., Taylor Richard J.K., eds. Comprehensive Heterocyclic Chemistry III. Vol 3. Elsevier; 2008. p. :45-268.
- [Google Scholar]
- Effects of extraction solvents on concentration and antioxidant activity of black and black mate tea polyphenols determined by ferrous tartrate and Folin-Ciocalteu methods. Food Chem.. 2006;99(4):835-841.
- [CrossRef] [Google Scholar]
- Antimicrobial and cytotoxic agents from Calophyllum inophyllum. Phytochemistry. 2004;65(20):2789-2795.
- [CrossRef] [Google Scholar]
- Techniques for extraction and isolation of natural products: a comprehensive review. Chinese Med. (United Kingdom). 2018;13(1):1-26.
- [CrossRef] [Google Scholar]


