

Translate this page into:
Impregnation of nanoclay montmorillonite by choline chloride-urea for selective CO2, N2, and O2 adsorption: Experimental and modeling
⁎Corresponding authors. aghaemi@iust.ac.ir (Ahad Ghaemi), Shahrokh@iust.ac.ir (Shahrokh Shahhosseini)
-
Received: ,
Accepted: ,
This article was originally published by Elsevier and was migrated to Scientific Scholar after the change of Publisher.
Peer review under responsibility of King Saud University.
Abstract
In this study, we successfully utilized a green chemistry approach to prepare an adsorbent by functionalizing Montmorillonite with Choline Chlroride: Urea (a Deep Eutectic Solvent) to compare CO2, O2, and N2 adsorption. We conducted studies on the adsorption mechanism using a volumetric system at temperatures ranging from 25 to 55 °C under pressures of up to 9 bar. We assessed the effects of acid activation concentration, solvent concentration, and adsorbent mass on the CO2/O2 and CO2/N2 adsorption ratios (mg/mg). Characterization analyses confirmed that modification of interlayer spaces, ion exchange content, and Al/Si occurred through acid treatment and solvent impregnation. The CO2 adsorption mechanism demonstrated a heterogeneous multilayer and chemophysical sorption nature, which was in agreement with the Hill isotherm and Ellovich kinetic model. In contrast, the O2 and N2 mechanisms were in agreement with a monolayer nature, which matched the Langmuir isotherm and first-order kinetic model. We achieved the optimum adsorption ratio of CO2/O2 and CO2/N2 at 35 °C, while the highest individual adsorption for all three gases was obtained at 25 °C. At 35 °C, 5 bar, and 0.5 g, the highest uptake adsorption was 208.6 mg/g for CO2, 72.6 mg/g for O2, and 39.3 mg/g for N2. Thermodynamic parameters showed that the adsorption nature of CO2, O2, and N2 was exothermic (ΔH < 0) with values of −14.49 Kj/mol, −7.74 Kj/mol, and −4.09Kj/mol, respectively. The study's experimental and modeling results showed a corresponding interpretation, which was remarkable. The adsorbent exhibited desirable renewability at adsorption/desorption cycles with remarkable uptake capacity, making it a highly potential adsorbent for CO2 capture from flue gases. The selectivity of CO2 towards O2 and N2 was almost 2.1 and 3.9, respectively.
Keywords
Adsorption
CO2/N2
CO2/O2
Deep eutectic solvent
Isotherm
Nanoclay

1 Introduction
The necessity of prompt actions to diminish the emission of greenhouse gases has been taken into more consideration than before (The evidence is clear: the time for action is now, 2030); (Duffy et al., 2022) due to the increasing rate of climate change disasters (storms, floods, and seasonal temperature fluctuations) (Moore et al., 2022; Hansen, 2022; Climate Change, 2022), the glaciers melting, and the ocean rise levels in recent years (Hooper, 2022). Recently, executives of industries and researchers have been considering a green approach to development projects (Ghazali et al., 2020); (Shahzad et al., 2022) , including the improvement of environmentally friendly processes (Chen et al., 2022), optimization of utility consumption (Na et al., 2022), using renewable energy (Kabeyi and Olanrewaju, 2022), reduction of chemicals usage, and utilization of biodegradable materials in the technologies. (Moshood et al., 2022) These approaches have a direct or indirect impact on reducing the emission of flue gas pollutants, e.g., N2O, CO2, and CH4 gases, into the atmosphere, water, and soil (Mocerino et al., 2022). CO2 accounts for 76 % of the total emission of greenhouse gases (GHGs) (Global Emissions - Center for Climate and Energy SolutionsCenter for Climate and Energy Solutions, 2023), with current levels standing at 413 ppm. The urgency of developing CO2 capture technologies has become crucial due to the effects of flue gas, as the largest CO2 emission source, on climate change and the reduction of health risks (Ou et al., 2021; Anderson et al., 2020; Barrett et al., 2022). Amine gas–liquid absorption is commercially available in Carbon Capture and Storage (CCS) units that currently cost around 50 to 110 USD/t (Garcia et al., 2022). However, the method has faced delays in investment decisions due to various executive problems, i.e., the foaming, the complexity of the operation (Niazmehr et al., 2016), and the high costs of supplying chemicals to these units, have. In addition, there are some technical problems with gas–liquid operation, such as adsorbent poisoning and the liquid carryover from the gas-sweetening unit to the downstream units. Even during emergency shut-downs, a large volume of chemical solution is directed to the oily wastewater unit, which increases treatment costs. Therefore, cryogenic processes, adsorption, membrane, and catalytic conversion have been studied for commercialization in recent years (Ziobrowski and Rotkegel, 2022; Kazemifar, 2022; Mahmoudi Marjanian et al., 2021).
Adsorption has been proposed as a cost-effective process to reduce maintenance costs and provide more controllable operation for many CO2 absorption projects from flue gases (Garcia et al., 2022); (Wang and Song, 2020) . So far, scientists and engineers have evaluated many adsorbents such as zeolites (Novikova and Belchinskaya, 2016), activated carbon (Garcia et al., 2022), aerogel, heteroatom-doped porous carbons (Bai et al., 2023); (Bai et al., 2023) , porous organic polymers (Sang et al., 2021), MOFs (Qi et al., 2023), NaHCO3, and nanoclays (Wang et al., 2010); (Chouikhi et al., 2019) . Most CO2 adsorption studies have functionalized absorbent bases with various alkanol amine groups. Nevertheless, the current adsorption process achieved more beneficiaries than amine gas–liquid absorption systems (Wang et al., 2010). Still, the following challenges indirectly reduce the effectiveness of the process, including creating non-degradable waste in the environment and high energy consumption in the adsorbent regeneration (Garcia et al., 2022); (Wang and Song, 2020) . Therefore, a few researches have been started in recent years to develop cheap adsorbents with a biocompatible approach in the flue gas separation to meet the needs of industries and investors for a process with optimal energy and material consumption (Ghazali et al., 2020); (Chouikhi et al., 2019) ; (Hussin et al., 2021) . CCS design comprises many parts where evaluating the pressure in a range that provides a minimum pressure drop of 3 bar; seems necessary (Muhammad et al., 2021).
Deep Eutectic Solvents (DES) have been proposed as an alternative to overcome the drawbacks associated with other solvents (Ghazali et al., 2020). DESs are obtained by combining two or three substances with the ability to combine Hydrogen Bond Acceptor (HBA) and Hydrogen Bond Donor (HBD) (Smith et al., 2014) with/without another activant agent. DESs provide favorable characteristics, such as thermal resistance, tuneability, reversibility, and lower regeneration temperature (Smith et al., 2014; Sarmad et al., 2016; Mirza et al., 2018; Aboshatta and Magueijo, 2021). Moreover, their higher absorption capacity and lower price than ionic liquids and other solvents have created a suitable technical and economic justification. The mixture of choline chloride and urea (ChCl: U(1:2)) has been one of the most widely used deep solvents in CO2 absorption research, mainly due to its non-toxicity, degradability, biological interaction, and easy synthesis (Sarmad et al., 2016); (Mirza et al., 2015) ; (Wazeer et al., 2021) . However, inadequate research has been done on the use of this solvent to functionalize the adsorbents. The presence of silicate layer besides free hydroxide in MMT octahedral structure implies on qualified position to make a polarized composition with ChCl: U. The intermolecular interactions, governed by forces such as van der Waals forces, hydrogen bonding, and electrostatic forces, play a fundamental role in the chemo-physical adsorption of gas molecules to the solid surface (Novikova and Belchinskaya, 2016); (Mohammadi et al., 2020; Mohammadi et al., 2021; Mohammadi and Abdullah, 2020) . Understanding and characterizing these intermolecular forces are crucial for predicting and interpreting adsorption behavior, including the shape of adsorption isotherms and the dynamics of the adsorption process. While many technical analyses such as Wiberg bond index (WBI), total density of states (TDOSs), natural charge, and natural electron configuration in the literature confirm the chemical complexity or van del Waals forces between molecules (Mohammadi et al., 2020); (Mohammadi and Abdullah, 2020) , some studies considers an indirect interpretation to demonstrate the quality of the adsorption phenomenon.
Ghazali et al. (Ghazali et al., 2020) improved the adsorption capacity of mesoporous silica using the triple solvent DES (ChCl:U: PEI). Hossin et al. (Hussin et al., 2021) obtained an adsorption capacity of 37.2 mg/g at 25 °C and 1 bar using the DES (Choline Hydroxide: Urea). However, the studies mentioned above were done at atmospheric pressure without comparison with the adsorption of O2, N2, or other gases. Evaluation of flue gas flow mainly indicates the presence of O2, N2, CO2, SOX, and NOX (Wang and Song, 2020). ChCL: U solvent has shown good CO2 selectivity towards N2, O2, and even SOX (Isaifan and Amhamed, 2018); (Aissaoui et al., 2017) , but so far, there has been no report comparing the N2 and O2 with CO2 adsorption capacity for ChCl: U impregnated adsorbents, and even this kind of evaluation, for other functionalized types of adsorbates, is lacking. Moreover, using cheaper and more accessible solid support can reduce the total cost of the adsorption. Nanoclays, such as Montmorillonite (MMT), kaolin, and bentonite, which act as cheap, compatible, and highly available adsorbents, have been used along with the inoculation of amine groups or chemical solvents (Chouikhi et al., 2019); (Wang et al., 2014) ; (Gómez-Pozuelo et al., 2019) . In contrast, the development of nanoclays with DESs for CO2 adsorption has not been investigated. Nevertheless, based on conclusive evidence, nanoclay MMT has been claimed as a beneficial CO2 adsorbent; Still, there is no report on CO2 selectivity in the flue gas or an individual comparison of CO2 adsorption toward O2 and N2 adsorption.
MMT is composed of tetrahedral silicate and octahedral hydroxide layers with a ratio of 2:1, which has the chemical composition (Xi et al., 2007): (Ca0.12 Na0.32 K0.05)[Al3.01 Fe(III)0.41 Mg0.54][Si7.98 Al0.02]O20(OH)4. The polygonal structure of Montmorillonite allows it to adsorb various pollutants due to interlayer porosity, free hydroxyl, exchangeable ions, and metal oxides. However, MMT’s porosity and specific surface area are limited (less than 35 m2/g) (Amari et al., 2018; Petrovic et al., 2021; Horri et al., 2020). The use of acid activation and leaching of some metal ions, such as Al and Fe, has made it possible to increase surface characteristics by more than 10 times. Horri et al. (Horri et al., 2020) demonstrated that HCl acid activation of MMT increased specific surface area from 39 to 202 m2/g, resulting in much more efficient adsorption of CO2. Penchah et al. (Ramezanipour Penchah et al., 2021) confirmed the CO2 adsorption desirability of even raw MMT functionalized by di-ethanolamine (DEA). Unambiguously, the high potential of MMT for CO2 adsorption is illustrated (Gómez-Pozuelo et al., 2019); (Ramezanipour Penchah et al., 2021) ; (Khajeh and Ghaemi, 2020) . At the same time, there are many deficit studies for the mixture of a greener composite and comparing all flue gas adsorption individually or simultaneously.
In the limited studies of green solvent (e.g., DES) inoculation on previous adsorbents (Ghazali et al., 2020); (Hussin et al., 2021) ; (Patiño et al., 2014) , there has been no analysis of the effect of acid activation, kinetics, and isotherms adsorption to realize the CO2 selectivity toward O2 and N2. Analyzing the CO2 adsorption mechanism and comparing it with O2 and N2 along with isothermal data and thermodynamic parameters while determining the adsorption mechanism provides the possibility of scale-up, designing the regeneration cycle, and detecting the amount of physical or chemical absorption (Al-Ghouti and Da’ana, 2020). Fig. 1 illustrates the high potential of coinciding utilizing the ChCl: Urea and MMT as eco-friendly adsorbents for separating CO2 from N2 and O2. Regarding the highest emission content of flue gas related to 41 % of power plants and 24 % of industries, many priorities have been revealed to them for CO2 mitigation goals. The smaller kinetic diameter of CO2 compared to O2 and N2, in addition to the significant differences in critical temperature and quadrupole moment numbers, makes it potentially easier to separate CO2 through porous media.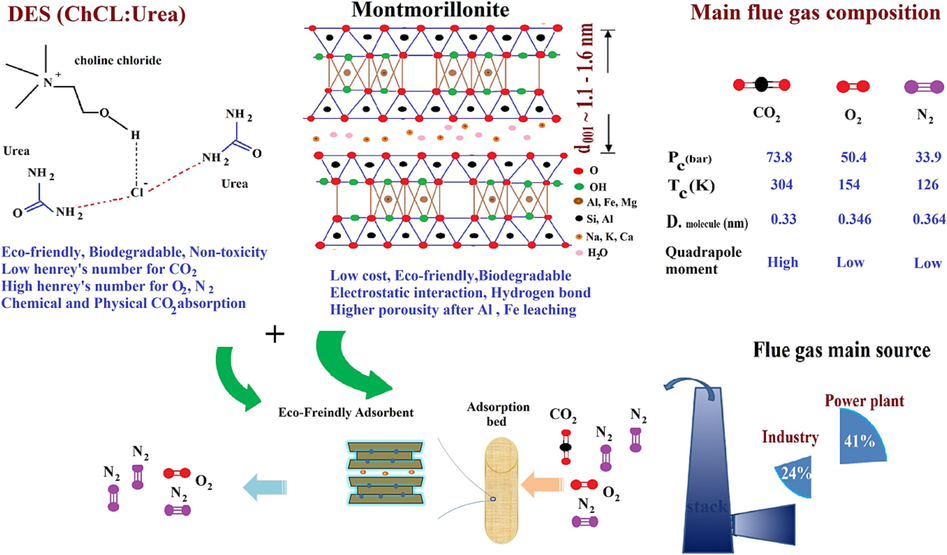
Schematic of fundamental advantages of eco-friendly adsorbent containing MMT and DES.
There has been a need to develop a selective CO2 adsorbent that targets N2 and O2, using a deep eutectic solvent impregnated on a mineral source. To date, there has been no investigation demonstrating the experimental and adsorption model study of CO2, N2, and O2 for the DES-MMT composite. To further explore practical adsorption and characterization models for the main components of flue gas, a batch-scale study was conducted using a low carbon footprint emission adsorbent. In this study, a complete evaluation and comparison of CO2, O2, and N2 adsorption using Montmorillonite base adsorbent in three states: raw, acid surface modified, and inoculated with DES has been carried out. Operating parameters of temperature and pressure have been investigated for different concentrations of surface modification with acid activation and solvent inoculation. To better understand and confirm the experimental results, isotherm models, kinetics, and thermodynamic parameters of the adsorbent for all three gases have been compared. This research has conceptually related the results of adsorbent characterization to kinetic and isotherm models of individual gases of CO2, O2, and N2; to show a biocompatible adsorption potentials for actual application at flue gas sweetening units.
2 Experimental
2.1 Materials and adsorbent acid activation
The nano-clay montmorillonite, with an interlayer spacing of 1–3 nm, a density of 0.7 g/cm3, and a purity of 99.0 %, was purchased from Sigma Aldrich Co. Choline chloride with a purity of 99.9 %, urea with a purity of 99.9 %, and hydrochloric acid with 37.0 % was prepared from Luba Chemi. The methanol as a solvent with a 99.9 % purity was obtained from Sigma Aldrich.
Before acid activation, the MMT was calcined at 100 °C for 4 h to remove moisture and labeled as MMT100. A suspension of nano-clay and deionized water was then prepared and stirred using a magnetic stirrer to swell. Sample processing was performed at 80 °C.
After reaching the desired temperature of suspension, the solution of the nano-clay suspension was brought to the required volume and concentration with the hydrochloric acid solution. Each gram of sample was dispersed in 10.0 mL of a hydrochloric acid solution of the desired concentration. Using a magnetic stirrer, the reaction medium was kept homogeneous during the 4-hour acid activation at reflux. Hydrochloric acid concentrations of 1, 3.5, and 6 M were used. After this step, the samples were separated and washed with deionized water until the pH reached 5. The samples were then dried in an oven at 80 °C for 24 hr, slowly pulverized, and processed into a powder.
In the final step, the powder samples were placed in an oven at 80 °C for further use. After leaching with the desired acid molarity, the MMT was named MMT100-acid molarity (e.g., MMT100-3.5).
2.2 DES preparation and adsorbent modification procedure
To prepare DES (ChCl: U) corresponding amounts of urea and choline chloride were weighted according to 2: 1 M ratio. The urea and choline chloride samples were then mixed on a magnetic heater surface and stirred at 80 °C for 2 h. DES solution, which was colorless and transparent, then formed as a mentioned procedure by Sarmad et al (Sarmad et al., 2016). Due to the excessive moisture absorption of choline chloride, the samples were placed in a vacuum oven at a temperature of 80 °C for 24 h. After evaluating the acid-washing samples, the optimal acid-activated concentration was selected, and DES inoculation was performed. DES weight ratios were determined and weighted by MMT. The methanol solvent was then added at a rate of 15 mL per g of all weighted ingredients. MMT was added after the liquid DES, and the methanol temperature reached 75 °C. After that, the mixture was reflux-stirred with a stirrer at 75 °C for 2 h (Ghazali et al., 2020). The mixture was then stirred for 5 min using a 20 kHz ultrasound with a power of 50 W. Finally, the samples labeled as MMT100- optimum acid molarity-DES.percent% (e.g., MMT100-3.5-DES30%) were placed in a vacuum oven at 80 °C to remove the methanol solvent. After 24 h, an MMT-acid activated-DES adsorbent prepared as a powder was produced. Fig. 2 illustrates the overall procedure for adsorbent sample preparation.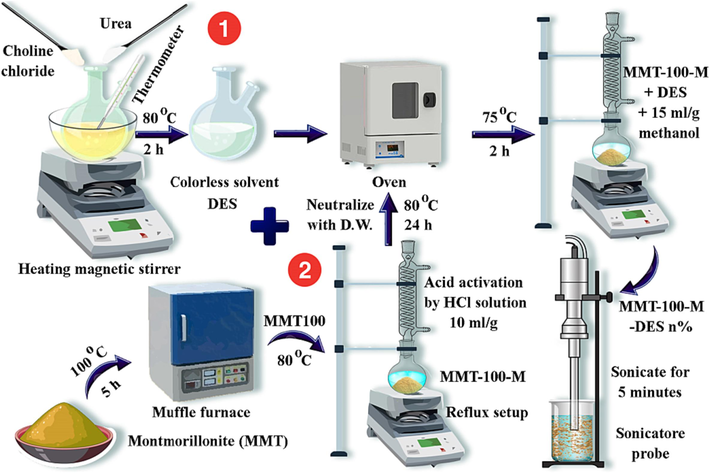
Preparation procedures of adsorbent samples.
2.3 Characterization of adsorbent
The adsorbent was characterized through several analyses including FE-SEM, EDX, FTIR, XRD, BET, and DTA. The acid activation and solvent impregnation on the morphology of the adsorbent and the porosity type characteristics were evaluated using FE-SEM analysis (FEI Sirion 200 field emission scanning electron microscope). Philips- × 130 instruments EDX microanalysis detector (model 6636) was utilized for elemental analysis of adsorbent. Fourier transform infrared (FTIR) spectra analysis was carried out by Shimadzu IR-470 spectrometer by the method of KBr pellet. BET analysis was used by Micromeritics ASAP 2020 M analyzer at 77.3 K. Thermal gravimetric analysis (TGA) was carried out as DTA with a DTG 60 Shimadzu at 5 °C min −1 heating rate under a nitrogen atmosphere and was performed in the temperature ranges of 30–750 °C. X-ray diffraction (XRD) analysis for solid mesoporous powders was carried out using an X’Pert Pro X-ray diffractometer operated at 40 kV and 40 mA. A Numerix DXP-X10P took energy dispersive X-ray spectroscopy (EDX) analysis to perform the specimen elemental analysis. Spectra were obtained in the range 5° < 2θ < 90°. Bragg’s law (Eq. (1) was followed to analyze reflections and d-spacing calculation (Horri et al., 2020).
2.4 Set up and operational parameters
According to Fig. 3, the laboratory device is composed of a batch cylindrical reactor with a volume of 160 mL and a stainless steel material. The reactor is equipped with a thermometer and pressure transmitter, connected to a receiving panel, and records temperature and pressure changes every second. An electrical heater is mounted to the reactor to regulate the temperature better. Before each experiment, the adsorbent sample was placed in the vacuum oven at 80 °C for 1 h. After reaching the approximate ambient temperature, it was weighted by a digital scale with 0.001 g accuracy. The weighted sample was placed inside the reactor chamber, and the reactor was sealed to prevent any leakage. The gas to be adsorbed is then injected into the reactor at the desired pressure and temperature, and the adsorption process is allowed to proceed for 60 min. The adsorption percentage and capacity are calculated using equations (Eq. (2), Eq. 3–4). It is important to note that the equilibrium pressure changes of the adsorbed gas were observed to stabilize after about 1 h of testing.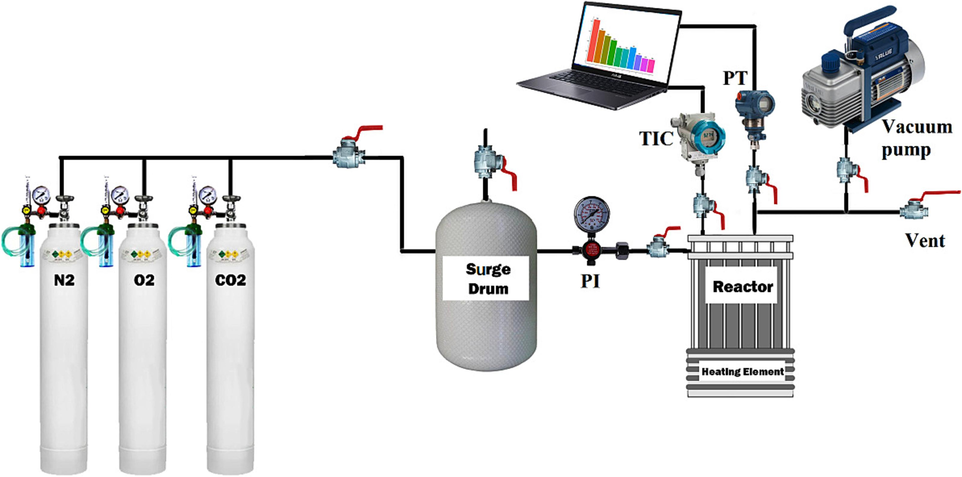
Schematic of adsorption set-up.
Where, Pi, Pe, qe, V, Mgas, R, w, Z, T and B are initial pressure, equilibrium pressure, reactor volume, molecular weight gas, universal gas constant, adsorbent weight, compressibility coefficient, temperature, and first virial constant, respectively.
Eq.5 was used as correlation coefficient error (R2), representing the percentage of variations in the dependent variable to determine the best fitting models to the experimental data.
3 Results and discussion
3.1 Physical properties
SEM was used to diagnose MMT morphology before and after the modifications. As Fig. 4(a & b) show, the overall state of the particles is maintained after modification. In contrast, the average particle size decreased from 250 to 700 nm in raw condition to the average particle size of 70 to 250 nm after modification with the 3.5 M acid level. The entanglement of particles with crystalline corners in Fig. 4 (a) makes it quite evident that after acid modification in Fig. 4 (b), the number of crystalline particles decreased. Fractionated lamellas and the formation of flaky particles occurred with an irregular arrangement at different angles. This phenomenon reduces particle density and increases porosity and interlayer space (Khajeh and Ghaemi, 2020). Additionally, in Fig. 4 (c), after inoculation of solvent, not only is the increase in surface density evident but also crystalline particles are created due to the filling of interlayer spaces and tetrahedral and octahedral corners of acid-modified MMT particles (Horri et al., 2020).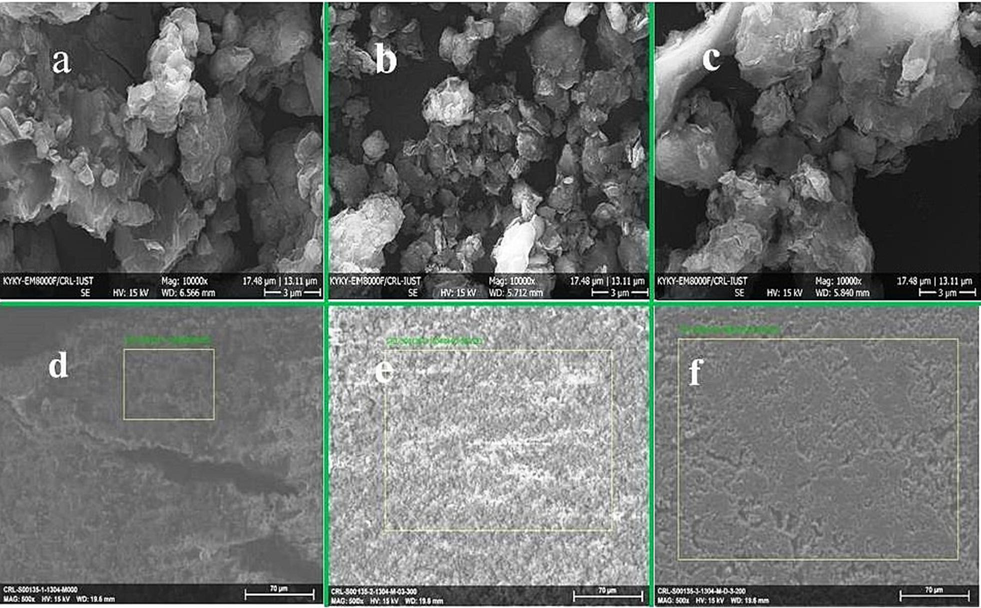
SEM with 10000X magnification: MMT (a), MMT100-3.5 (b) and MMT100-3.5-DES30 (c); EDX area diagnose: MMT (d), MMT100-3.5 (e), and MMT100-3.5-DES30 (f).
As evident in the magnification used by elemental analysis (EDX) in Fig. 4 (d, e & f), solvent inoculation covers the porous atmosphere of acid-modified adsorbent. It creates an integrated and dense state that increases adsorption. Elemental composition analysis (Table 1) with the EDX technique shows the presence of critical elements Si, Al, and K in pre and post-activation samples, which have been observed in MMT, bentonite, and zeolite analyses (Chouikhi et al., 2019); (Silva et al., 2019) . According to Table 1, the reduction of Al, Fe, and alkaline metals in the samples MMT100-3.5 shows the leaching of these elements due to acid modification. The presence of N, C, and Cl in the sample of MMT100-3.5-DES30 also indicates solid-based ChCl: U solvent inoculation.
Elements
O
Si
C
Al
Cl
N
Fe
Ca
K
Mg
Na
Ti
Sum.
Sample
MMT100
50.73
28.27
–
11.6
–
–
4.05
1.17
1.25
1.38
0.92
0.63
100
MMT100-3.5
51.11
33.28
–
10.26
0.11
–
2.18
0.17
0.91
0.95
0.46
0.57
100
MMT-3.5-DES30
41.87
21.85
8.34
7.83
8.05
7.63
1.68
0.13
0.84
0.89
0.37
0.52
100
FTIR technique is used to detect different functional groups, as shown in Fig. 5. The band's intensity of less than 1338 cm−1 and between 3210 cm−1 and 3800 cm−1 indicates the internal and external structure of nanoclay (Khajeh and Ghaemi, 2020); (Stanly et al., 2019) . So, the peaks at 469 cm−1 and 1040 cm−1 are referred to as the Si-O-Si bond in the octagonal structure of the first and third sheets in MMT. Bands between 3210 cm−1 and 3800 cm−1 were also absorbed into the concentration of interlayer cations (K+, Ca2+, Mg2+, Na+) and aqueous phase hydrate (Horri et al., 2020). The peak in 695 cm−1 and 796 cm−1 refers to Si-O- bonding caused by irregular quartz components in nanoclay structure (Atilhan et al., 2016). Also, Al-Fe-OH and Al-Al-OH transplantation are referred to peaks 842 cm−1 and 952 cm−1, respectively (Zhou et al., 2019). In addition, peak 952 cm−1 is also referred to as Si-OH in some references (Horri et al., 2020); (Tyagi et al., 2006) . In M1 and M2 curves, after acid activation with concentrations of 3.5 and 6 M, respectively, peak spans of 1040 cm−1 (wave between 900 and 1100) and 3423 cm−1, attributed to the effects of changing the internal structure of smectite and leaching cations (due to the reduction of peak intensity) (Khajeh and Ghaemi, 2020). The bending of peaks 842 cm−1 and 952 cm−1 in the M1 and M2 curves is also evident after acid washing, which is the exfoliation of the middle sheet communicated in the octahedral structure of the nano-clays (Horri et al., 2020). By adding DES solvent with concentrations of 30 % and 50 % - MD1 and MD2-curves, peak 952 cm−1 due to NH reaction in urea with Si-OH and Al-Al-OH, the peak intensity has been drawn, and even with increasing solvent concentration, the bending of this peak has increased. In addition, the increase in peak intensity of 1667 cm−1 and 1622 cm−1 in MD1 and MD2 curves compared to M0, M1, and M2 curves are affected by the carbonyl C = O bond in urea (Ghazali et al., 2020). The bending of peak 1426 cm−1 in MD1 and MD2 curves indicates the presence of CH2 in choline chloride, with increasing solvent concentration (Hussin et al., 2021). Also, peaks 1452 cm−1 and 1490 cm−1 show NH and CH2 bonds, respectively, proving the complete inoculation of ChCl: U solvent. Reduction of peak intensity and curved bending around wave intensities of 3600 cm−1 to 3700 cm−1 could be related to hydrogen bonding of water, increased scissor vibration, and interlayer cations bonding with solvent (Tyagi et al., 2006). The relative angle alteration in the zone 3300 cm−1 in MD1 and MD2 curves also indicates the presence of NH after solvent inoculation.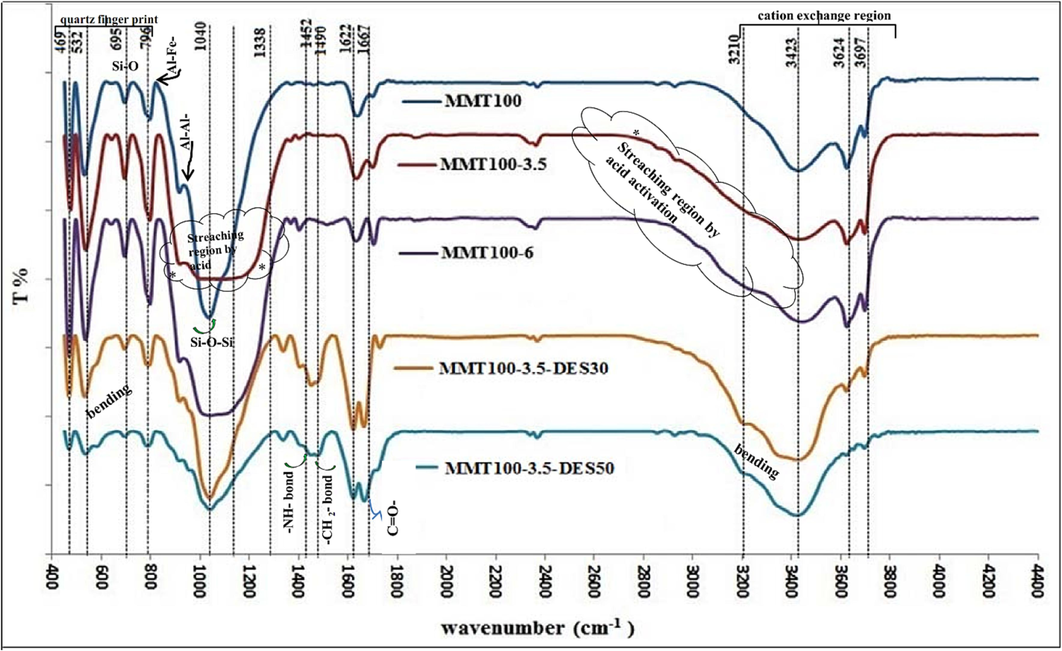
FTIR spectra of raw, acid-activated, and DES-impregnated MMT.
XRD was used to evaluate the crystalline structure of raw and modified MMT. As Fig. 6 shows, due to an increase in MMT acid treatment up to 1 M (curve A1), 3.5 M (curve A2), and 6 M (curve A3), a shift change in plane d001 occurred from 2θ, 5.43° to 5.66°, 6.171° and, 5.92°, respectively. This phenomenon led to an increase in interlayer distance from 1.43 to 1.49, 1.63, and 1.60 nm due to the leaching of metal ions in the tetrahedral sheet of both sides after 1, 3, and 6 M HCl treatments, respectively. 2θ of 6.17°, 19.93°, 35.74°, and 61.99° are the characteristic signs of MMT, which is subsequently linked to d001, d020, d110, and d060 of MMT (Petrovic et al., 2021); (Horri et al., 2020) . The peaks at 21.21° and 26.56° are affected by d101 (a quartz polymorph) and quartz, respectively (Khajeh and Ghaemi, 2020). As Fig. 6 shows, peaks in the range of 35°, 26°, 21°, and 20° remain constant in the acid washing curve (A1, A2, and A3) compared to the base curves (A0).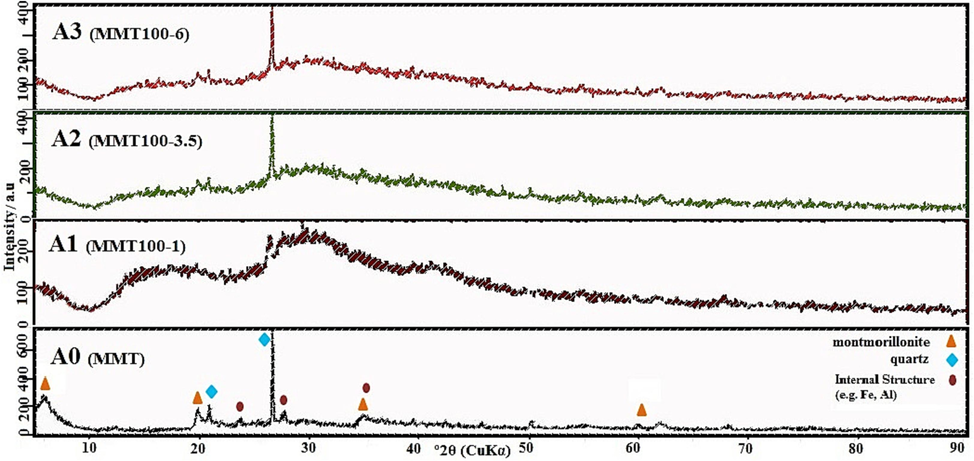
XRD pattern of adsorbent after different acid activation conditions.
In contrast, acid washing at 1 M increased the amorphous phase and changed morphology in regions 2θ of 23.7° and 35.8° due to irregular displacement, and leaching of ore oxide. By increasing the concentration of acid washing (A2), the exfoliation of Al and Fe became complete to find a more balanced distribution of crystalline and amorphous phases. Effective differentiation peaks in the 2θ range of 5° to 6° in the acid washing curve of 3.5 M (A2) compared to acid washing of 6 M (A3) and a slight difference in the interlayer space even though the consumption of more acid can indicate the optimum acid-washing with a concentration of 3.5 M (Khajeh and Ghaemi, 2020); (Taheri et al., 2019) . Conventional MMT base peaks are preserved in shape after inoculating with ChCl: U solvent (Fig. 7). The direction of the 2θ angle to the right indicates a decrease in interlayer distance due to solvent fixation in all solid base pores. Also, Fig. 7 illustrates that the balancing of the overall height of the AD curve relative to A2 can be affected by the penetration of solvents in tetrahedral, octahedral, and amorphous phase restoration around cluster platelet sheets.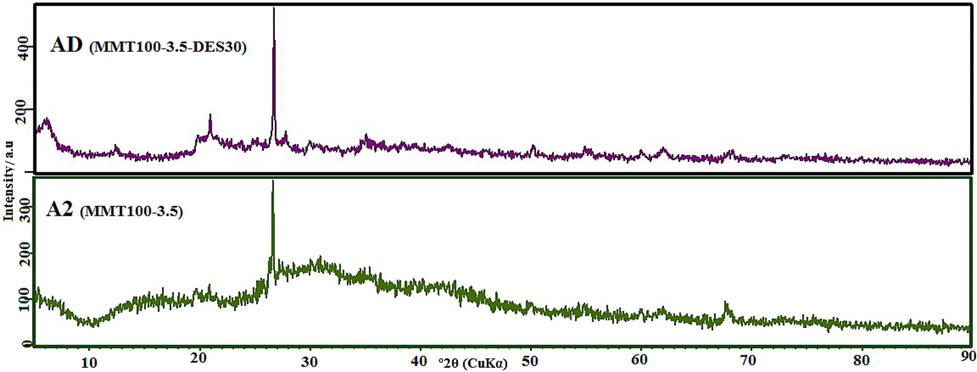
XRD pattern of adsorbent after solvent impregnation.
Fig. 8 shows the pore size distribution of MMT base before and after acid activating with different concentrations by using the Barrett − Joyner − Halenda (BJH) technique. The first evident thing that is the similar variations in the overall trend in the curves of different samples, which, as a result, indicates the preservation of the inclusive structure of the nano-clay. With increasing acid concentration, the peak height in the curve has increased, indicating a deeper local slit-shaped pore. The raw MMT cavity size range is 2–10 nm, and after acid-washing, 1 M has reached an average range of 3–15 nm, which is attributed to the creation of mesoporous adsorbent. After acid washing of 3.5 M, the size distribution of cavities is more integrated and in the range of 5 to 14 nm, which contributed to the uniform discharge of Al and Fe ions in tetrahedral and octahedral planetary particles.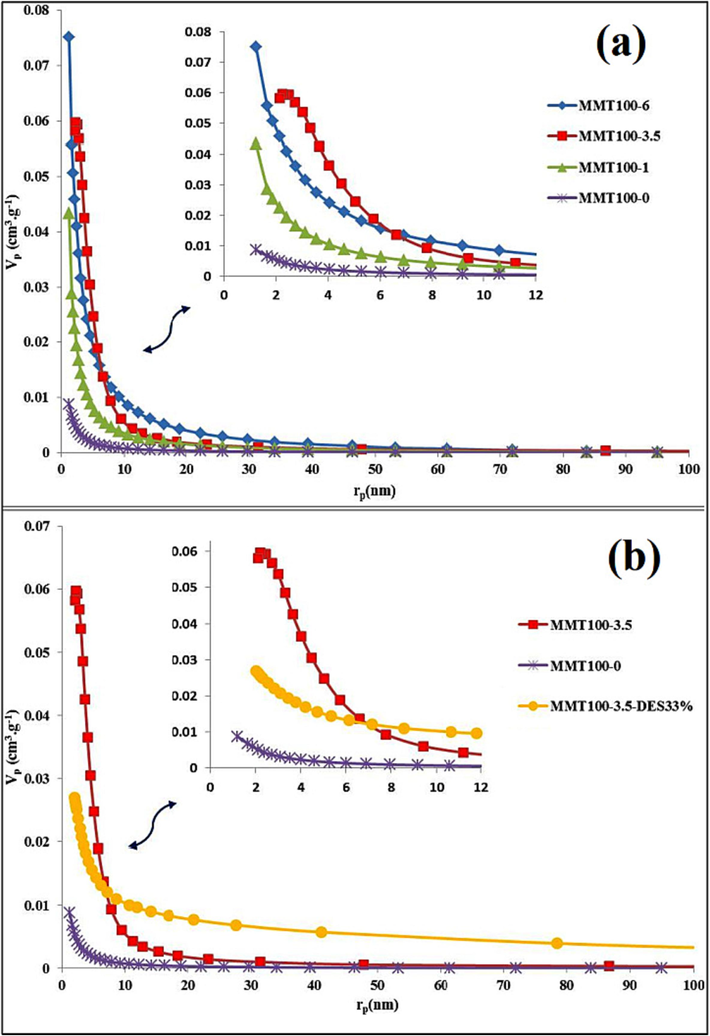
Pore size distribution (BJH curve): (a) comparison of raw, acid-activated samples; (b) raw, acid-activated, and DES-impregnated MMT samples.
On the other hand, the size distribution of cavities in a completely mesoporous range increases the selectivity of CO2 adsorption compared to larger-diameter molecules (Gómez-Pozuelo et al., 2019); (Su et al., 2019) . The optimum concentration of acid-washing is devoted to 3.5 M. compared to 1 and 6 M. for the following reasons: much less frequency of macro cavities (100–50 nm), increase in minimum cavity size, more proportional and integrated distribution of cavity size and increase in cavity gap volume. As Fig. 8 shows, solvent inoculation on acid washing adsorbent with 3.5 M has created a wholly mesoporous and uniform cavity size distribution between 2 and 12 nm, increasing the adsorption capability. Although the overall structure of the nanoclay base is preserved and like the 3.5 M. acid washing sample, macro pore cavities are very limited, indicating the strength of the crystalline structure while the distributed porosity in all particles. The results of BET tests in Table 2 also show that the optimum acid-washing state with a concentration of 3.5 M has occurred. The specific surface area and total volume of vacant space from 41 and 0.056 reached 228 m2/g and 0.594 cm3/g, respectively. In other words, the special surface was affected 5.6 times, and the total volume of cavities was 10.6 times. The high quality of cavity distribution and approximately 11 times the volume of cavities, compared to other research, have been extraordinary, which can be noted in the optimal conditions of time, temperature, stirring speed, and the use of reflux during acid activation, which many studies (Novikova and Belchinskaya, 2016); (Taheri et al., 2019) ; (Jozefaciuk and Bowanko, 2002) have pointed out to these conditions.(See Table 3).
Parameter
Adsorbent
MMT
MMT100-1
MMT100-3.5
MMT100-6
MMT100-3.5-DES30
SBET [m2 /g]
40.5
98.5
228
171
189
Vt [cm3 /g]
0.056
0.238
0.594
0.525
0.357
Average Pore Size [nm]
2.65
3.68
5.24
4.19
4.39
ΔH
ΔS
ΔG (kJ/mol) @ °C
(kJ/mol)
(kJ/mole K)
25
35
45
55
CO2
−14.498
−0.026
−6.816
−6.559
−6.301
−6.04346
O2
−7.749
−0.009
−4.953
−4.859
−4.765
−4.67118
N2
−4.091
0.001
−4.197
−4.201
−4.204
−4.20776
The N2 adsorption–desorption curve in Fig. 9 also shows an increased volume of adsorbed molecules due to increased porosity caused by acid washing of 3.5 M. The overall structure of the solid BET curve is maintained before and after surface modifications. While the adsorption volume increased in the range of 0.4 to 0.95 relative pressures, and at relative pressure near zero, it was very restricted. This pattern of absorption/desorption of N2 conforms to the IUPAC classification (Ramli et al., 2018). It follows type IV isotherms related to the adsorbents with mesoporous cavities, besides a slight distribution of micro-cultures. The hysteresis cycle of these materials is similar to the H3 type, which shows the presence of gap holes in MMT-laminated particles. The thickness and length of the hysteresis cycle due to acid-washing of 3.5 M has increased significantly, which causes capillary growth, and increased adsorption (Taheri et al., 2019). After solvent inoculation, the width of the hysteresis layer is quite similar to the acid-modified dimension base, and the hysteresis length is in the relative pressure range of 0.4 to 0.95. However, the thickness of the hysteresis cycle has been reduced due to the filling of pores by solvent.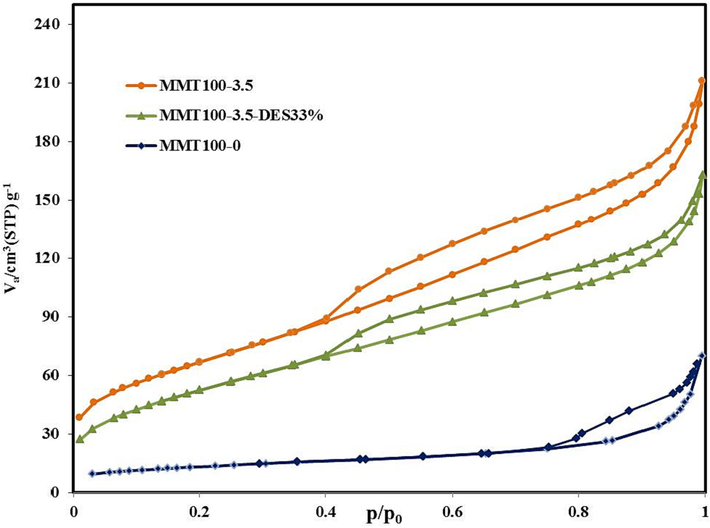
N2 adsorption and desorption isotherm.
3.2 Adsorption at different conditions of acid activation
The effect of acid treatment on the adsorption capacities of CO2, O2, and N2 at temperatures of 35 and 55 °C has been investigated. Fig. 10 shows the CO2/O2/N2 adsorption capacity trends in the raw MMT and the MMT acid activated with concentrations at 1.0, 3.5, and 6.0 M. It is evident that the capacity of CO2 adsorption at 35 and 55 °C has been significantly increased by increasing the acid activation concentration up to 3.5 M. Then, the increased acid concentration of 6.0 M decreased the CO2 adsorption slightly. Such a trend follows the trend of BET changes in Table 2. As a result, the increase in CO2 adsorption has been affected by the increase in porosity and specific surface area, so optimal adsorption and optimal BET occurred in surface modification with a 3.5 M concentration. However, the higher acid concentration leads to the destruction of the internal layer and the local collapse of some tetrahedral sheets (Petrovic et al., 2021); (Khajeh and Ghaemi, 2020) .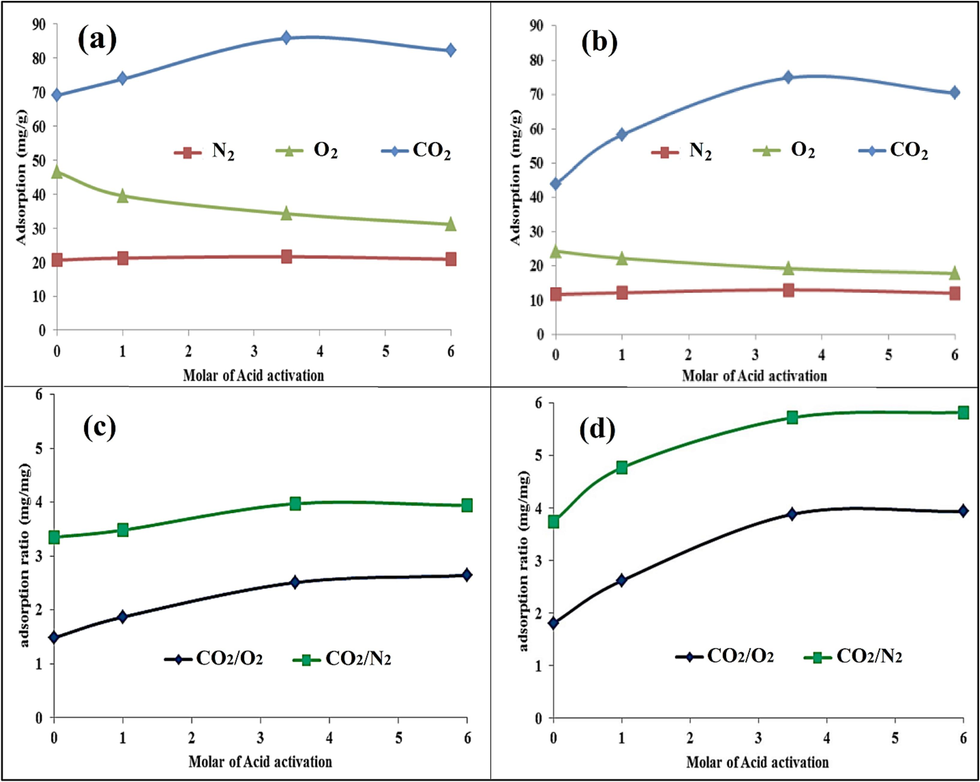
Effect of acid activation molarity on: Adsorption capacity of CO2, O2, N2 at (a): 35 °C, (b): 55 °C; The ratio of adsorption capacity CO2 to O2 and N2; at (c): 35 °C, (d): 55 °C.
Unlike CO2, the adsorption capacity of O2 has gradually decreased with the increase in acid treatment concentration. This trend can be mainly attributed to reduced cationic ions such as Na+, K+, and Mg2+, which mitigate the physical adsorption through electrostatic force (Zhou et al., 2019). In addition, the reduction of Al concentration after leaching disfavors the activation of O2 to form reactive O-2, leading to a low potential for O2 adsorption. Such a trend has even been observed in the catalytic adsorption of O2 in CO conversion to CO2 while reducing the concentration of Al3+, Na+, and Mg2+ ions (Sánchez-López et al., 2021); (Navlani-García et al., 2016) . Fig. 10 (a,b) depict that the adsorption of N2 has a semi-constant trend versus the acid activation intensity of the solid base. As Fig. 10(c, d) shows, the ratio of the adsorption capacity of CO2 to N2 has increased due to the increase in porosity due to the rise in the intensity of acid-washing at both 35 and 55 °C. It has maximum extremism at a temperature of 35°, and concentration of 3.5 M. Further, at 55 °C, the ratio of CO2 to N2 and even the ratio of O2 have a completely upward trend with the increase in acid-washing concentration. The CO2 to O2 adsorption capacity ratio curve also had the same state as CO2 to N2 but in a lower change range. This phenomenon, which can be related to the lower critical temperature (Zhou et al., 2019) of N2 and O2 compared to CO2, the higher quadruple properties (Ramli et al., 2018) of CO2, the increase in the OH concentration (Ghazali et al., 2020), and the Lewis acid property (Sarmad et al., 2016); (Zhang et al., 2021) ; (Jedli et al., 2018) of CO2, shows the importance of the quality of surface modification with acid washing on improving selectivity. In other words, with the increase of acid washing concentration, the ratio of adsorption capacity CO2 to O2 and N2 has reached from 1.5 mg/mg and 3.5 mg/mg to 2.5 mg/mg and 3.9 mg/mg at temperatures of 35 °C, respectively.
3.3 Comparison of CO2, N2, and O2 adsorption at different concentration impregnation of DES
After screening the modified samples with different acid molarities, the optimal conditions were selected as 3.5 M from the viewpoint of CO2 adsorption and selectivity towards O2 and N2. To activate the adsorbent, according to Fig. 11, the effect of solvent concentration in percentages of 20, 30, 40, and 50 % by weight on the adsorption capacity of CO2, O2, and N2 has been investigated. As Fig. 11 shows, by adding a concentration of 20 to 40 % of DES, chemical and physical adsorption has increased, both at 35 °C and 25 °C temperatures, and it has a maximum extreme in the range of 30 % weight of the solvent. While increasing the solvent concentration, gradually from the range of 40 % weight, the physical adsorption capacity of the solid base has decreased, which is affected by the filling of vacant sites (Ghazali et al., 2020); (Hussin et al., 2021) and the reduction of electrostatic forces. However, the physicochemical adsorption contribution of DES at 50 % concentration is utterly superior to the adsorption capacity contribution of the MMT base. Such a trend in the adsorption of O2 and N2 with the change of DES concentration is not very apparent, the main reason for which is the prominent quadruple moment of CO2 (4.3*10^-26 esu.cm2) compared to N2 (1.5 *10^-26 esu.cm2) and O2 (0.39 *10^-26 esu.cm2) (Ramli et al., 2018). On the other hand, by adding solvent to the MMT base, the ratio of Si to Al and alkaline cations has decreased further, and the possibility of activation of O2 to O2– and access to the active sites of cations exchange has decreased (Navlani-García et al., 2016). Additionally, in some references, it has been pointed out that Henry’s number of CO2 is significantly different from that of O2 and N2 in ionic liquids, and that Henry’s number of oxygen and nitrogen may be at least 22 and 14 times the individual limit of CO2 (50 to 350 bar) (Ramli et al., 2018), respectively. As Fig. 11 (c, d) shows, the inoculation of the appropriate concentration of solvent at a weight ratio of 30 % has improved the ratio of CO2 adsorption capacity to O2 and N2. Besides, the selectivity of CO2 to N2 at a temperature of 35 °C has improved more compared to a temperature of 25 °C. In comparison, the selectivity of CO2 to N2 in the temperature range of 35 °C and 25 °C has followed a relatively similar trend. In other words, in the optimal state, the ratio of adsorption capacity of CO2 to O2 and N2 has reached 4.81 and 2.89 from 3.96 and 2.48 mg/mg, respectively. In general, the optimal concentration of 30 % of the solvent has increased the adsorption capacity of the adsorbent by about 27 % compared to the raw base. While this value for O2 and N2 was in the range of 11 and 9 %, respectively. Higher CO2 adsorption capacity through support functionalizing with a solvent with high nitrogen content was confirmed in many studies (Oschatz and Antonietti, 2018); (Hamdy et al., 2021) .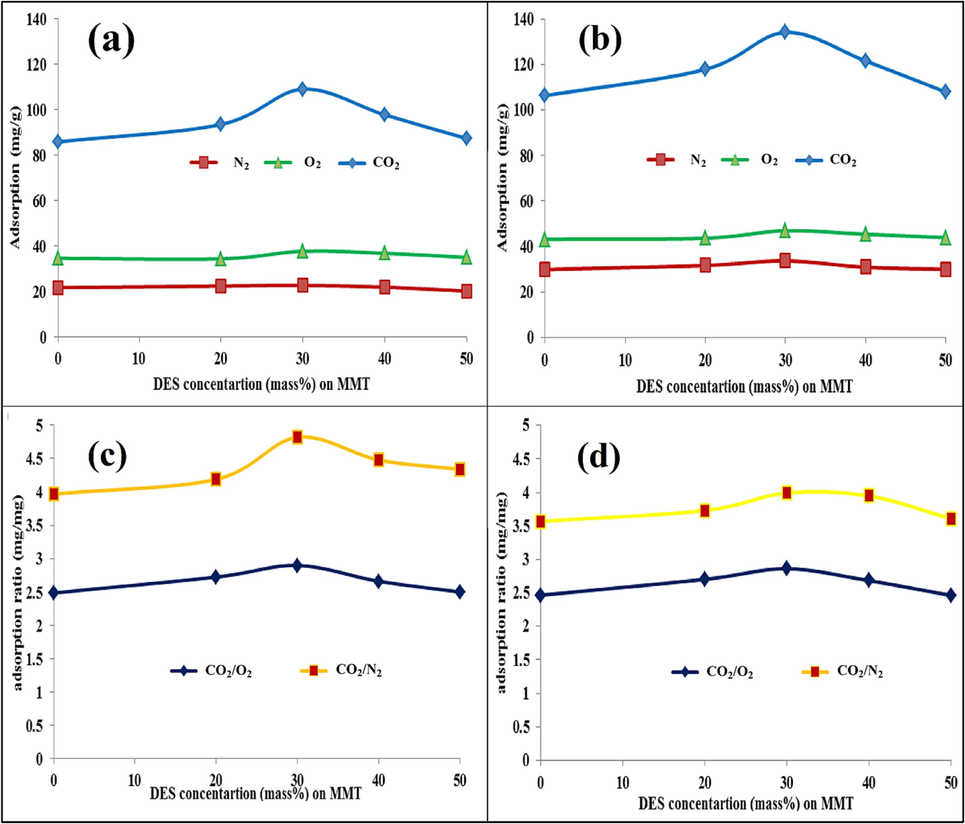
Above row: Adsorption capacity versus DES concentration for CO2, O2, and N2 at (a): 35 °C, (b): 25 °C; Below row: The ratio of adsorption capacity CO2 to O2 and N2 versus DES concentration; at (c): 35 °C, (d): 25 °C.
3.4 Effect of operational parameters on CO2, N2, and O2 adsorption
Temperature and pressure were studied as two operating parameters to see how they affected the adsorption capacities and selectivities of all three gases. As Fig. 12(a) shows, with the increase in temperature from 25 to 55 °C, the adsorption capacity has decreased linearly. This process does not only show the exothermicity of the process for each gas (Taheri et al., 2019), but also the sharper slope of variations for CO2 adsorption, the higher interaction energy of its adsorption compared to O2 and N2, which have placid slopes of variations; in such a way that CO2 adsorption capacity has increased from 78 to 133.2 mg/g and O2 and N2 from 31.6 and 48 to 18.1 and 31.2 mg/g, respectively. The fact that lowering the temperature has increased the adsorption capacity (Khajeh and Ghaemi, 2020); (Taheri et al., 2019) ; (Ramezanipour Penchah et al., 2021) of CO2, O2, and N2 gases was also observed in the evaluation of acid treatment concentration and the solvent concentration effect. Besides, the evaluation of the effect of temperature in this section, according to Fig. 12(b), shows an optimal temperature range where the adsorption ratio of CO2 to O2 and N2 has reached the maximum extremes of 2.79 and 4.63, respectively. In other words, although the temperature of 25 °C has a higher CO2 adsorption capacity than the temperature of 35 °C the selectivity of CO2 to O2 and N2 was higher at 35 °C. The evaluation of the pressure effect of CO2, O2, and N2 adsorption capacities at the optimum selectivity temperature of 35 °C has been investigated. As Fig. 12(c) shows, the trend of increasing the adsorption capacity has increased with increasing pressure from 1 to 9 bar for each gas; while the capacity of CO2 is much higher than that in O2 and N2. This fact is consistent with the critical temperature of each gas and the condensability of CO2 gas at higher pressure (Zhang et al., 2021). However, the intensity of increasing O2 and N2 adsorption under pressure 3 bar affected a more significant uptake than other pressures for the experimental result; so in Fig. 12(d), the adsorption ratio of CO2 to O2 and N2 at 3 bar pressure has a minimum extreme of 3.69 and 2.32, respectively. This phenomenon shows that due to the permeability of O2 and N2 compared to CO2, there is a critical pressure, after which the selectivity process increases with a very moderate slope. In previous research (Ariyanto et al., 2021); (Xie et al., 2016) , the selectivity of CO2 over CH4 has been greatly increased at pressures > 10 bar. The 3D in Fig. 13 illustrates the interaction of various pressure and temperature ranges on adsorption capacity over 3600-seconds. It is clear from the data that CO2 exhibits a higher adsorption capacity at higher pressures and lower temperatures compared to O2 and N2.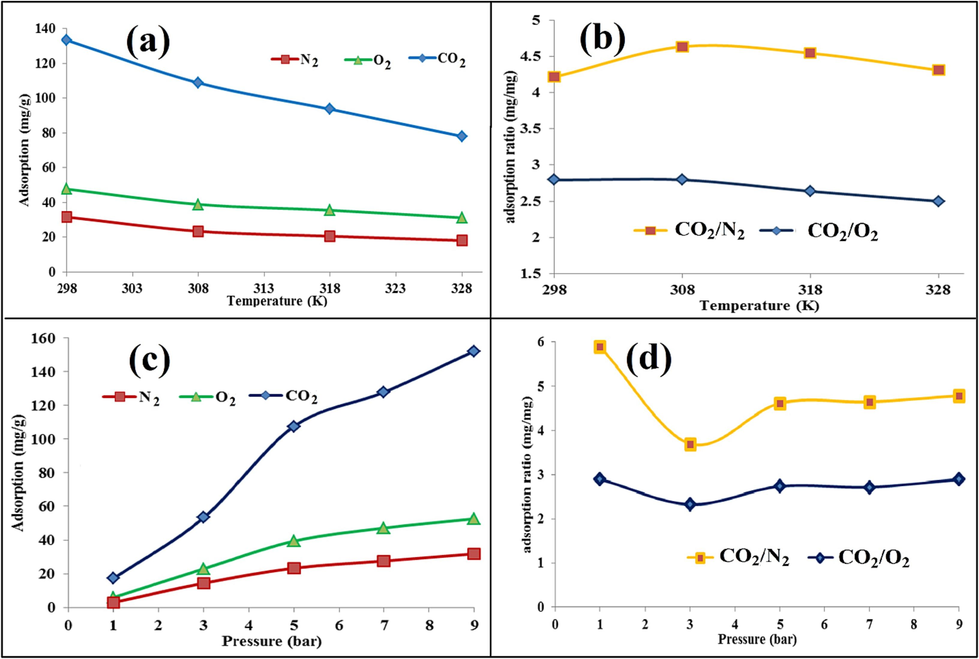
Comparison of CO2, O2, and N2 adsorption at T & P: effect of temperature (a), the effect of pressure (c); Comparison of adsorption ratio (CO2/O2 and CO2/N2): the effect of T (b), the effect of P (d).
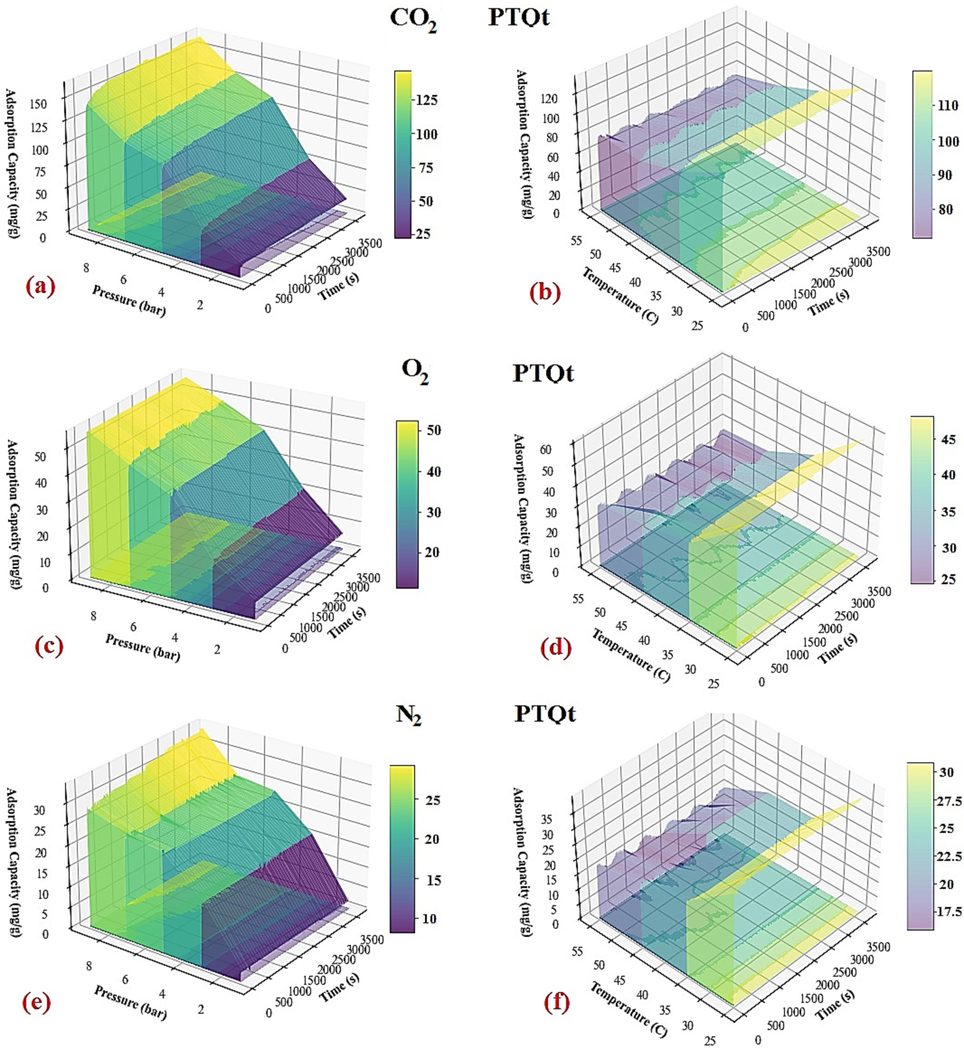
Effect of operational parameters through time vs. adsorption Capacity: (a): Pressure (P)-Time (t)-Ads. (CO2) capacity (Q), (b): Temperature (T)-Time (t)-Ads. (CO2) capacity (Q), (c): Pressure (P)-Time (t)-Ads. (O2) capacity (Q), (d): Temperature (T)-Time (t)-Ads. (O2) capacity (Q), (e): Pressure (P)-Time (t)-Ads. (N2) capacity (Q), (f): Temperature (T)-Time (t)-Ads. (N2) capacity (Q).
3.5 Effect of adsorbent weights
Fig. 14 (a) shows the adsorption capacity variations in terms of adsorbent mass. As seen in part a (Fig. 14), reducing the weight of the absorbent has triggered an increase in adsorption loading. This phenomenon shows a decrease in pressure drop, a decrease in penetration resistance, and an increase in the level of access to active sites by gas molecules, which is in relatively good agreement with other research (Hamdy et al., 2021); (Jiang et al., 2023) . Having a lesser kinetic diameter of CO2 than O2 and N2 implies (Ramli et al., 2018); (Zhang et al., 2021) higher CO2 affinity toward internal diffusion, and consequently, a steeper slope in CO2 uptake than O2 and N2. In other words, by reducing the adsorbent mass from 1.0 to 0.5 g, the CO2 uptake capacity (while other conditions were kept constant) has reached 212 mg/g from 108 mg/g, which has almost doubled; even though this ratio was about the same for O2 and N2. In Fig. 14(b), the ratio of adsorption of CO2 to O2 in the weights of 0.5, 1.0, 2.0, and 3.0 g of the adsorbent has not altered much. This ratio for CO2 to N2 is also maintained in the range of 4.8 mg/mg to 6.5 mg/mg. Evidently, in the mass of 1.0 g of the adsorbent, it has reached the value of half, and with the increase of the mass of the adsorbent to 2.0 and 3.0 g, a higher adsorption ratio of CO2 to N2 has been reached. Maintaining the adsorption ratio of CO2 to O2 and N2 in the range of 3.0 mg/mg and 6.0 mg/mg, respectively, after the mass of 2.0 g shows the creation of more selective adsorption for CO2, the proper distribution of particles, and interlayer porosity.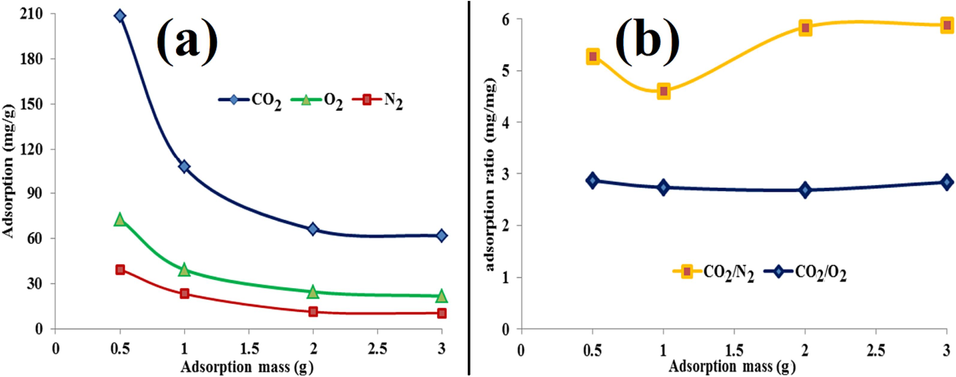
Effect of adsorbent mass on (a) adsorption of CO2 to O2 and N2, (b) adsorption ratio: CO2/O2 and CO2/N2.
3.6 Comparison of thermodynamic parameters for CO2, N2, O2
The realization of thermodynamic parameters effectively determines the type of adsorbent, the degree of disorder, the possibility of a spontaneous process, the adsorption density, and the interaction energy (Jedli et al., 2018); (Ebelegi et al., 2020) . In this research, ΔH°, ΔS°, and ΔG° based on the equations of Van’t Hoff’ S at a pressure of 5 bar, a temperature of 35°, 1 g of adsorbent with activated acid of 3.5 and inoculation of 30 % of the solvent is investigated (Eq. (6)-Eq. (8).
Where T, Pi, Pe, V, and W, are gas temperature (K), initial pressure, final pressure, process container volume (cm), and absorbent weight (g), respectively. Table 1 shows that the values of ΔH°, ΔS°, and ΔG° of CO2 gas are significantly higher than those of O2 and N2 gas. Although the value of ΔH° of CO2 gas is lower than 20 kJ/mol (-14.5 kJ/mol), its significant difference with ΔH° of O2 gas (-7.7 kJ/mol) and N2 (-4 kJ/mol) indicates stronger bonds and the possibility of a portion of chemical adsorption in addition to physical absorption (van der Waals type, electrostatic, and hydrogen bond). The comparison of the negative values of ΔS° of CO2 and O2 gas indicates the degree of disorder of each gas during the approximate value of the equality of CO2 to O2. Meanwhile, the positive degree of ΔS° of nitrogen gas confirms the results of the previous parameters and the higher selectivity of CO2 to N2 in different conditions of temperature, pressure, and concentration.
As the curve in Fig. 15 shows, the degree of distribution Ln(Kd) has a linear decrease with increasing temperature, indicating the reaction’s exothermic nature and the inverse effect of temperature on adsorption capacity. According to Fig. 16, the CO2 adsorption percentage attributed to the range of 9 to 6, considerably, more appropriate than the CO2 adsorption percentage of other articles (Khajeh and Ghaemi, 2020), and the O2 and N2 adsorption percentage in this research with the range of 6 to 4 and 5 till 3, respectively. On the other hand, the higher ΔG° value of CO2 gas than O2 and N2 shows the greater degree of the spontaneity of this gas, which has decreased with increasing temperature due to the weakening of the adsorption interaction energy. As shown in Table 4, according to the values of the thermodynamic parameters of the optimized adsorbent, while creating an exothermic process, spontaneity, and selectivity, it has a much better adsorption percentage than other research (Khajeh and Ghaemi, 2020); (Fu et al., 2019) ; (Mashhadimoslem et al., 2022) .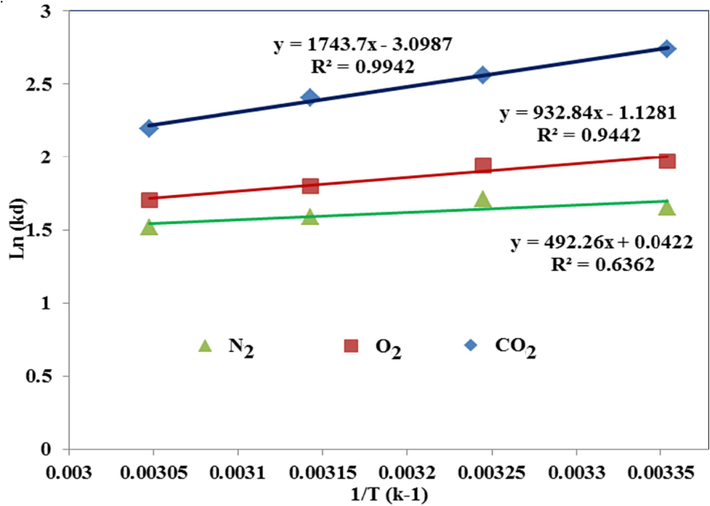
Experimental Van’t Hoff plots of CO2, O2, and N2 for MMT100-3.5-DES30.
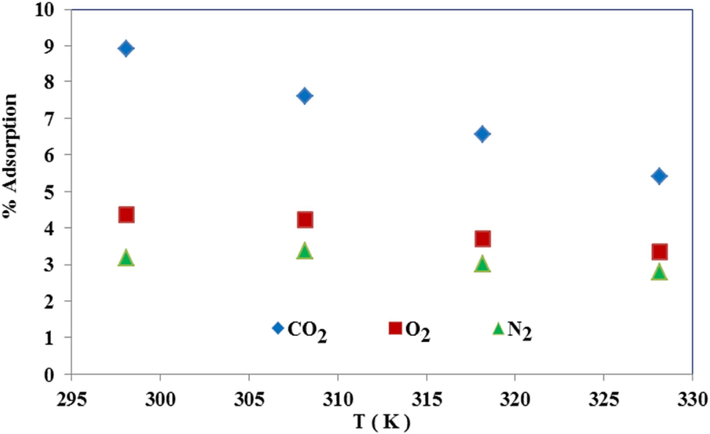
Adsorption percent of CO2, O2, and N2 for MMT100-3.5-DES30.
Gas
T (°C)
P (bar)
Max. Ads. (%)
(kJ/mol)
(kJ/mole. K)
(kJ/mol)
Adsorbent (Ref.)
CO2
65
5
4.7
19.24
0.074
−5.76
N-MMT (Khajeh and Ghaemi, 2020)
CO2
20
6
8.5
−11.31
−0.01
−8.29
EM-TE-30 (Taheri et al., 2019)
CO2
25
6
5.5
−17.97
−0.035
−7.67
GAC-10–500 (Mashhadimoslem et al., 2022)
N2
25
6
3.2
−13.58
−0.025
−6.05
GAC-10–500 (Mashhadimoslem et al., 2022)
O2
25
6
4.4
−13.96
−0.024
−6.73
GAC-10–500 (Mashhadimoslem et al., 2022)
N2
25
3
- (2.1 mmol/g)
−16.54
−0.14
−3.58
5A (Fu et al., 2019)
O2
25
3
- (0.26 mmol/g)
−11.97
−0.12
−1.37
5A (Fu et al., 2019)
3.7 Adsorption isotherms, adsorption kinetic and selectivity of CO2, N2, and O2
To evaluate the performance of the adsorption mechanism, estimation of the adsorption capacity at saturation pressure or higher, volume and time of adsorption, the possibility of scale-up, matching the results with isotherm models and the kinetics of adsorption, this research has been done (Ayawei et al., 2017); (Wang and Guo, 2020) . Using the regression coefficient is one of the most common methods of determining the compatibility of experimental and modeling results; the closer R2 is to one, the corresponding model will have desirability (Ramezanipour Penchah et al., 2021); (Ayawei et al., 2017) . Fig. 17 shows the isotherm models with R2 > 0.98 for the adsorption of CO2, N2, and O2. Among the two-, three-, and four-parameters isotherm models that have been explained in detail in various reports (Ayawei et al., 2017), the isotherm models of Langmuir, Freundlich, Temkin, Dubinin Radushkevich (RK), and Hill have been reliable with the experimental results of this research and their nonlinear relationship is presented in Eqs (9) to (13), respectively. The evidence shows that the Hill model provides the best fit for experimental data of CO2 adsorption, while the Langmuir model indicates the best fit for practical results of N2 and O2 adsorption. This is due to the fact that the Hill model represents the heterogeneous, multi-layer, and chemo-physorption process, which aligns with the higher CO2 uptake compared to the lower O2 and N2 uptake observed with adsorbents that follow the physorption and single-layer model of the Langmuir.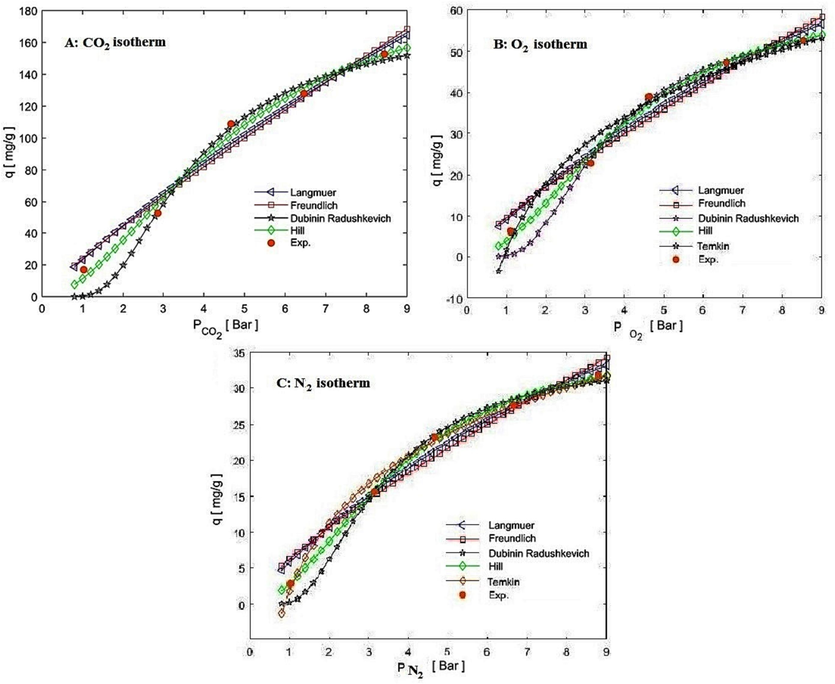
Isotherm models of CO2, O2, and N2 compared to corresponding experimental data.
Where qe, qm, and P are attributed to equilibrium adsorption capacity, saturated adsorption capacity, and equilibrium pressure, respectively. (kL), (kF, n), (A, B), (kE, E), and (n, kD) relate to the parameters of the isotherm models of Langmuir, Freundlich, Temkin, Dubinin − Radushkevich (DR), and Hill, respectively. The Langmuir and Freundlich are mentioned as the most common models representing the single-layer and multi-layer adsorption, respectively. The qm and kL in eq. (9) illustrate the mono-layer saturatuin adsorption capacity and physical adsorption, respectively; which are the highest value for CO2 among flue gases here. The Kf ((barn.mg)/g) and n in Freundlich model, are related to capacity and intensity of adsorption, respectively. By increase the amount of kf, the adsorbate uptake increases. The value of n greater than 1 and less than 2, specifies desirable adsorption. Also, bT and E represent the adsorption heat and the adsorption free energy, conducting energy-related evidence in the DR and Temkin isotherm models. The range of E < 8 value displays the physical adsorption and in the range of 8 < E < 16 states the chemical adsorption (Al-Ghouti and Da’ana, 2020); (Khajeh and Ghaemi, 2020) ; (Ayawei et al., 2017) . Table 5 shows that the adsorption of N2 and O2 provided the best fit to the experimental results and theoretical model with the Langmuir and Temkin isotherms. In comparison, CO2 is dedicated to the Hill, DR, and Freundlich isotherm models. The adsorption of N2 agreed with the Langmuir isotherm model the most, which indicates the mono-layer surface physisorption and the repulsion of adsorbed molecules with each other have occurred. The matching of the Langmuir isotherm with the experimental results of all three gases was obtained as follows: N2 > O2 > CO2. The results mentioned above confirm the high ratio of adsorption of CO2 to N2 and O2 in different conditions, which is caused by the favorable structure of hydrogen bond and multilayer adsorption for CO2 gas compared to the limited and single-layer adsorption for N2 and O2. Also, the Freundlich number of the adsorbent between 1 and 2 (≃1.2) shows the desirability of the synthesized adsorbent (Taheri et al., 2019). Hill model number (n) greater than one shows a better adsorption quality (Ayawei et al., 2017), in which n≃ 1.9 indicates the minimum interaction of two OH molecules or NH2 molecules with the adsorbate molecules.
Model
Parameters
CO2
O2
N2
Langmuir
qm
695
165.4
82.98
kL
0.035
0.057
0.074
R2
0.9865
0.9874
0.9916
Freunlich
kF
23.85
9.601
6.183
n
1.124
1.218
1.285
R2
0.9849
0.9793
0.9799
D-R
qm
176.3
60.68
34.96
kE
2.03
1.85
1.612
E
0.552
0.52
0.551
R2
0.9948
0.9937
0.9919
Hill
qs
204.3
64.35
37.56
n
1.837
1.991
1.926
kD
16.88
15.45
12.619
R2
0.9953
0.9939
0.9912
Temkin Model
A
1.08
1.076
1.137
B
65.5
23.391
13.613
R2
0.9746
0.9861
0.9963
To understand the path of the adsorption equilibrium command mechanism, the kinetic models of the first order, the second order, and Ellovich have been investigated, presented in Eqs (14) to (16), respectively.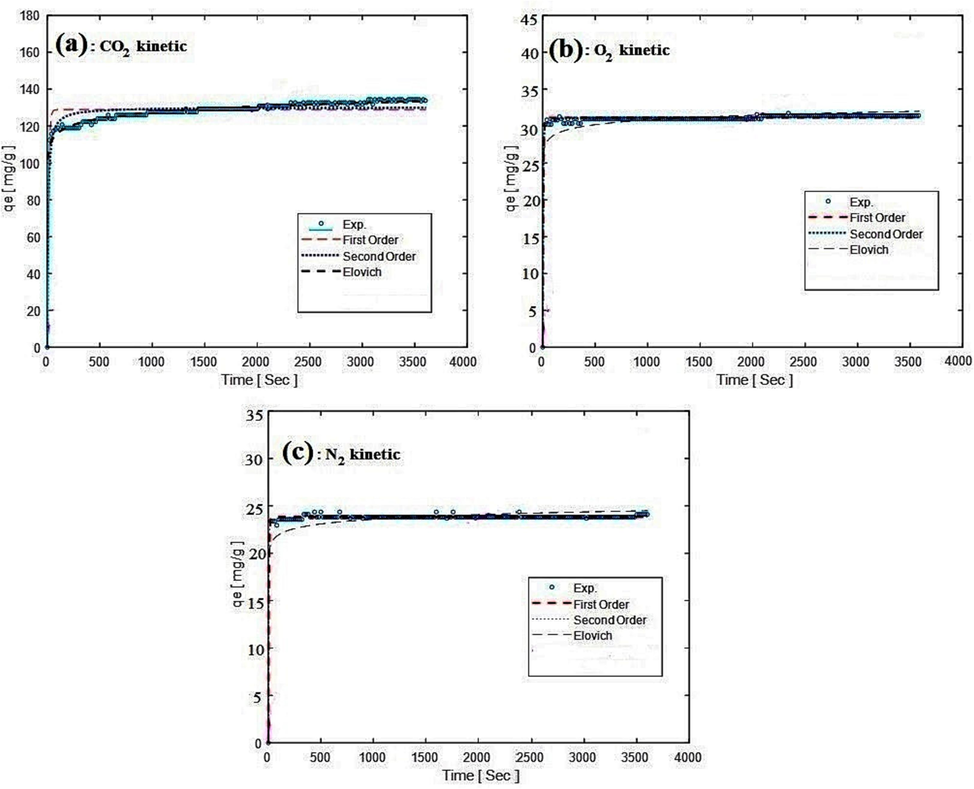
Comparison of experimental data fitting with kinetic models for CO2, O2, and N2 adsorption.
Kinetic Model
Parameter
CO2
O2
N2
First Order
qe
128.94
62.21
47.61
kl
0.091
0.176
0.197
R2
0.912
0.993
0.996
Second Order
qe
130.2
62.31
47.57
K2
0.0011
0.0151
0.0284
R2
0.945
0.991
0.994
Elovich
α
0.023
0.032
0.048
β
24.546
14.342
9.267
R2
0.976
0.776
0.422
adsorbate
support
Solvent (wt.%)
T(°C), P(bar)
BET (m2/g)
qe (mg/g)
Kinetic model
Isotherm model
ref
CO2
AC
ZnCl2 (0.1)
25, 10
719.2
277.2
Fractional
sips
(Mashhadimoslem et al., 2022)
O2
AC
ZnCl2 (0.1)
25, 10
719.2
184.6
Fractional
sips
(Mashhadimoslem et al., 2022)
N2
AC
ZnCl2 (0.1)
25, 10
719.2
100.8
Fractional
sips
(Mashhadimoslem et al., 2022)
CO2
MMT
NaOH(30)
35, 7.0
144.3
78.7
Elovich
Toth
(Khajeh and Ghaemi, 2020)
CO2
MMT
–
45, 5.0
9.9
22.2
Elovich
–
(Khajeh and Ghaemi, 2020)
CO2
MMT
DEA (22)
30, 9.0
25.7
281.8
Elovich
Hill
(Ramezanipour Penchah et al., 2021)
CO2
MMT
–
30, 9.0
4.8
219.8
Elovich
Hill
(Ramezanipour Penchah et al., 2021)
CO2
MMT
APTH (35)
25, 50
8.5
213.4
–
–
(Atilhan et al., 2016)
N2
5A
–
−35, 3
–
77.4
–
Langmuir
(Fu et al., 2019)
O2
5A
–
−35, 3
–
73.6
–
Langmuir
(Fu et al., 2019)
CO2
MMT
DES (30)
25, 5
189.0
134.1
Elovich
Hill
This study
CO2
MMT
–
25, 5
189.0
106.3
–
–
O2
MMT
DES (30)
25, 5
189.0
46.4
1st order
Langmuir
N2
MMT
DES (30)
25, 5
189.0
33.2
1st order
Langmuir
To analyze the separation potential of the three gases in this research, intrinsic selectivity was used according to the research of Bao et al. (Bao et al., 2011), who used Henry’s law to estimate the relationship between equilibrium data and equilibrium pressure (Eq. (17). According to Eq. (18), the selectivity of component A toward component B is determined.
Where, qe, K, Pe, and α are adsorption capacity (mg/g), equilibrium pressure (bar), permanent constant, and selectivity factor.
As Table 8 shows, despite the decrease in selectivity at a pressure of around 3 bar, the selectivity of CO2 toward N2 and O2 surges with increasing pressure. As the results of the previous sections showed, reducing the weight of the adsorbent increased the adsorption capacity; for instance, for 0.5 g adsorbent, the selectivity of CO2 to N2 and O2 at temperature 35 °C and pressure 5 bar was 6.58 and 2.97, respectively. These results are remarkable compared to the selectivity research of Mashhadi et al. (Mashhadimoslem et al., 2022) and Duczinski et al. (Duczinski et al., 2020), while the biocompatibility and cheaper base of this research make it more sustainable, and beneficial. Fig. 19 depicts the mechansim of the possible CO2, O2, and N2 adsorption with MMT100-3.5-DES30.
P(bar)
1
3
5
7
9
CO2/N2
4.15
2.41
2.93
3.11
3.76
CO2/O2
2.16
1.91
2.06
2.04
2.18
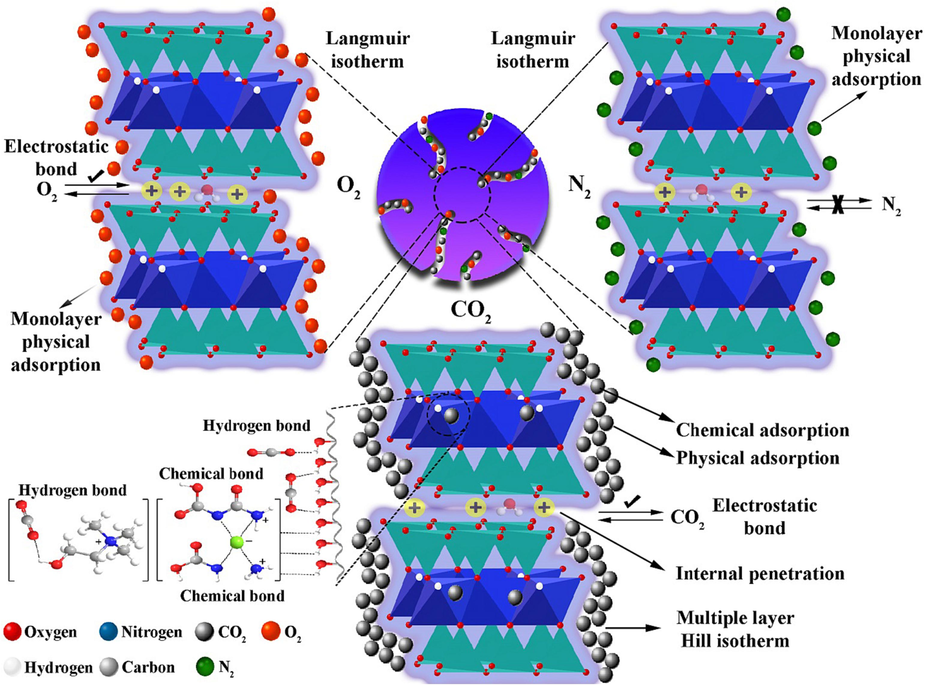
Mechanism of adsorption by MMT100-3.5ChCL: U30%.
3.8 Regeneration of MMT100-3.5-DES30
Evaluating different cycles of CO2, O2, and N2 adsorption and checking the custody of CO2 selectivity over O2 and N2 after adsorbent regeneration have revealed its cost-to-benefit ratio, industrial usability, and flexibility (Hussin et al., 2021); (Jiang et al., 2023) ;
(Bao et al., 2011). To analyze the conditions of regeneration, the DTA curve of the main adsorbent was investigated. Fig. 20 shows that up to the temperature of 100 °C, less than 1.5 % by weight has been reduced, which can be related to methanol condensation (in the inoculation stage) and absorbent moisture. Next, up to 270 °C, with a gradual process, about 28.5 % of the weight decreased; this was attributed to DES molecules in agreement with the literature (Xie et al., 2016) demonstrated the disappearing of ChCl: U up to around 300 °C.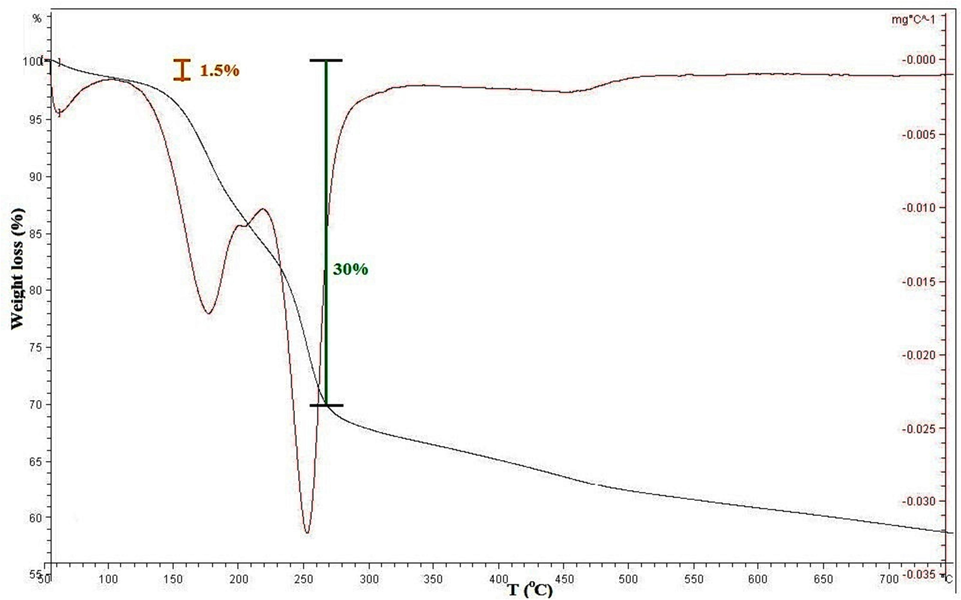
DTA of MMT100-3.5-DES30.
Further, up to the temperature of 750 °C, the process of changing the weight of the absorbent (mg/°C) has been approximately constant. According to the DTA, the regeneration temperature is considered to be between 80 and 120 °C. As the curve in Fig. 21 shows, the amount of CO2 adsorption after regeneration and its selectivity compared to O2 and N2 at 100 °C was higher than that at 80 °C and 120 °C, which indicates the renewability of the specific surface area of the adsorbent and the main concentration of the solvent in this condition. Furthermore, the regeneration of the adsorbent and the preservation of its selectivity after eight cycles at the regeneration temperature of 100 °C are presented (Fig. 22). The percent of the CO2 adsorption efficiency against eight cycles did not drop significantly compared to the initial cycle; it even maintained the selectivity number adsorbent, which shows industrial usability.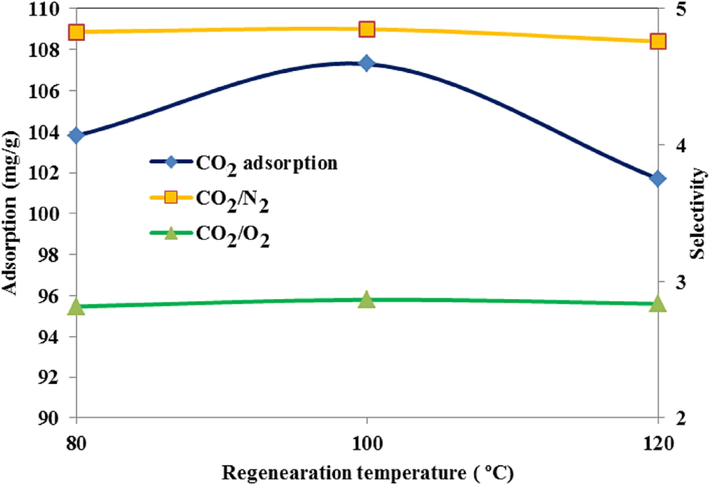
Effect of regeneration temperature of MMT100-3.5-DES30 on adsorption capacity of CO2, O2, and N2.
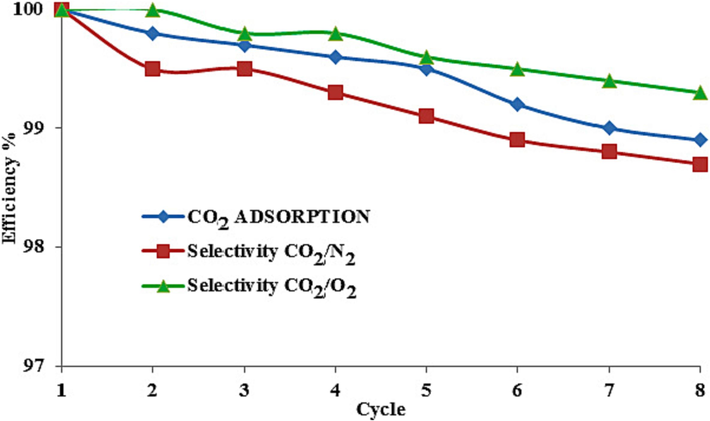
Recycling performance of MMT100-3.5-DES30 for efficiency of CO2 adsorption, CO2/N2, and CO2/O2 selectivities.
4 Conclusion
The study presents a conceptual method for comparing the adsorption of individual main flue gas compositions using isotherm, kinetic models, and thermodynamic parameters evaluation in a specific adsorbent at batch scale reactor. The results revealed different types of isotherm and kinetic models for CO2 adsorption compared to N2 and O2. This approach could be a strategic foundation for future investigations to explore monolayer adsorption for O2 and N2, while demonstrating higher CO2 uptake due to multi-layer chemophysical sorption. This differs from previous studies, which reported similar isotherm and kinetic models for individual CO2, O2, and N2. MMT100-M−DESn were synthesized through improved HCl activation of montmorillonite (MMT) nano clay and impregnation with Choline Chloride: Urea (ChCl: U) as a Deep Eutectic Solvent (DES). During acid surface activation, the CO2 adsorption increased significantly due to rising 9.5 times and 5 times more than those values of the specific area (35 m2/g) and pore volume (0.33 m3/g) of bare MT, respectively. In contrast, that decreased the O2 adsorption due to the leaching of cationic ions; while exhibiting a negligible effect on N2 adsorption. The results indicated that more active groups were achieved for acidic gas molecules in such a way as to improve CO2 adsorption by up to 19 % approximately. While the adsorption ratio of CO2/O2 and CO2/N2 increased gradually along with both consequent surface activation and then ChCl: U functionalized MMT100-3.5. Experimental results revealed the direct and reversed impact of pressure and temperature on CO2, O2, and N2 uptake capacity in a more significant affective trend for CO2 than O2 and N2. Modeling results exhibited desirable accordance with operational parameters effect and characterization value of adsorbent. In agreement with higher CO2 uptake adsorption, the CO2 isotherm model fitted well with the heterogeneous multilayer Hill isotherm model; while O2 and N2 showed higher regression to the Langmuir monolayer isotherm model, having less potential of active sites for physical adsorption. The kinetic model of CO2 was obtained in the highest fitting with the Ellovich model showing the mechanism of physi-chemisorption, which was in agreement with the first-order model. Despite the similar exothermic nature adsorption for CO2, O2, and N2 with ΔH (kJ/mol), −14.6, −7.7, and −4.1, respectively, the ΔH (kJ/mol.K), of N2(0.001) showed un randomness nature vice versa of that for O2 (-0.009) and CO2 (-0.026). The adsorption capacity increased by reducing the adsorbent weight, whereas the highest value of 217 mg/g was obtained at 35 °C, 5 bar, and 0.5 g adsorbent (MMT100-3.5-DES30) for CO2, O2, and N2, respectively. The adsorption ratio (mg/mg) of CO2/N2 and CO2/O2 was optimum at 35 °C, either 1 or 9 bar around 6.5 and 3, respectively. The CO2 uptake capacity and selective nature after adsorption/desorption cycles demonstrated a desirable and thermal stable adsorbent with high potential for green industrial application of CO2 capture.
CRediT authorship contribution statement
Aminreza Ansari: Conceptualization, Data curation, Writing – original draft, Writing – review & editing, Visualization, Investigation, Validation, Formal analysis, Methodology. Shahrokh Shahhosseini: Conceptualization, Data curation, Writing – review & editing, Visualization, Investigation, Validation, Formal analysis, Methodology, Supervision, Resources, Project administration. Ahad Ghaemi: Conceptualization, Funding acquisition, Data curation, Writing – review & editing, Visualization, Investigation, Validation, Formal analysis, Methodology, Supervision, Resources, Project administration and Software.
Acknowledgements
We gratefully acknowledge the financial support of Parsian Gas Refinary
Declaration of competing interest
The authors declare that they have no known competing financial interests or personal relationships that could have appeared to influence the work reported in this paper.
References
- A comprehensive study of CO2 absorption and desorption by choline-chloride/levulinic-acid-based deep eutectic solvents. Molecules. 2021;26(18)
- [CrossRef] [Google Scholar]
- Potential applications of deep eutectic solvents in natural gas sweetening for CO2 capture. Rev. Chem. Eng.. 2017;33(6):523-550.
- [CrossRef] [Google Scholar]
- Al-Ghouti MA, Da’ana DA. Guidelines for the use and interpretation of adsorption isotherm models: A review. J Hazard Mater. 2020;393:122383. doi:10.1016/J.JHAZMAT.2020.122383.
- Amari A, Gannouni H, Khan MI, Almesfer MK, Elkhaleefa AM, Gannouni A. Effect of Structure and Chemical Activation on the Adsorption Properties of Green Clay Minerals for the Removal of Cationic Dye. Appl Sci 2018, Vol 8, Page 2302. 2018;8(11):2302. doi:10.3390/APP8112302.
- A factor of two: how the mitigation plans of ‘climate progressive’ nations fall far short of Paris-compliant pathways. Clim. Policy. 2020;20(10):1290-1304.
- [CrossRef] [Google Scholar]
- Improving the separation of CO2/CH4 using impregnation of deep eutectic solvents on porous carbon. ACS Omega. 2021;6(29):19194-19201.
- [CrossRef] [Google Scholar]
- High-pressure methane, carbon dioxide, and nitrogen adsorption on amine-impregnated porous montmorillonite nanoclays. J. Chem. Eng. Data. 2016;61(8):2749-2760.
- [CrossRef] [Google Scholar]
- Modelling and interpretation of adsorption isotherms. J. Chem.. 2017;2017
- [CrossRef] [Google Scholar]
- Synthesis and characterization of polyphenylene sulfide resin-derived S-doped porous carbons for efficient CO2 capture. Colloids Surf. A Physicochem. Eng. Asp.. 2023;674:131916
- [CrossRef] [Google Scholar]
- N-doped porous carbon derived from macadamia nut shell for CO2 adsorption. Fuel Process Technol.. 2023;249:107854
- [CrossRef] [Google Scholar]
- Adsorption equilibria of CO2, CH4, N2, O2, and Ar on high silica zeolites. J. Chem. Eng. Data. 2011;56(11):4017-4023.
- [CrossRef] [Google Scholar]
- Barrett J, Pye S, Betts-Davies S, et al. Energy demand reduction options for meeting national zero-emission targets in the United Kingdom. Nat Energy 2022. Published online June 27, 2022:1-10. doi:10.1038/s41560-022-01057-y.
- Chen WQ, Hauschild MZ, Huang B jia, Kara S, Sutherland JW, Umeda Y. Life cycle engineering and sustainable manufacturing for net-zero targets and environmental sustainability. Resour Conserv Recycl. 2022;186:106480. doi:10.1016/J.RESCONREC.2022.106480.
- Chouikhi N, Cecilia JA, Vilarrasa-García E, et al. CO2 Adsorption of Materials Synthesized from Clay Minerals: A Review. Miner 2019, Vol 9, Page 514. 2019;9(9):514. doi:10.3390/MIN9090514.
- Climate Change 2022: Impacts, Adaptation and Vulnerability | Climate Change 2022: Impacts, Adaptation and Vulnerability. Accessed January 18, 2023. https://www.ipcc.ch/report/ar6/wg2/.
- Enhancement of CO2/N2 selectivity and CO2 uptake by tuning concentration and chemical structure of imidazolium-based ILs immobilized in mesoporous silica. J. Environ. Chem. Eng.. 2020;8(3):103740
- [CrossRef] [Google Scholar]
- Duffy K, Gouhier TC, Ganguly AR. Climate-mediated shifts in temperature fluctuations promote extinction risk. Nat Clim Chang 2022 1211. 2022;12(11):1037-1044. doi:10.1038/s41558-022-01490-7.
- Interpretation of adsorption thermodynamics and kinetics. Open J. Phys. Chem.. 2020;10(3):166-182.
- [CrossRef] [Google Scholar]
- Thermodynamic analysis of molecular simulations of N2 and O2 adsorption on zeolites under plateau special conditions. Appl. Surf. Sci.. 2019;480:868-875.
- [CrossRef] [Google Scholar]
- Technical analysis of CO2 capture pathways and technologies. J. Environ. Chem. Eng.. 2022;10(5):108470
- [CrossRef] [Google Scholar]
- Impregnating deep eutectic solvent choline chloride:urea:polyethyleneimine onto mesoporous silica gel for carbon dioxide capture. J. Mater. Res. Technol.. 2020;9(3):3249-3260.
- [CrossRef] [Google Scholar]
- Global Emissions - Center for Climate and Energy SolutionsCenter for Climate and Energy Solutions. Accessed January 21, 2023. https://www.c2es.org/content/international-emissions/.
- CO2 adsorption on amine-functionalized clays. Micropor. Mesopor. Mater.. 2019;282:38-47.
- [CrossRef] [Google Scholar]
- The application of amine-based materials for carbon capture and utilisation: an overarching view. Mater. Adv.. 2021;2(18):5843-5880.
- [CrossRef] [Google Scholar]
- Central banking challenges posed by uncertain climate change and natural disasters. J. Monet. Econ.. 2022;125:1-15.
- [CrossRef] [Google Scholar]
- Horri N, Sanz-Pérez ES, Arencibia A, Sanz R, Frini-Srasra N, Srasra E. Effect of acid activation on the CO2 adsorption capacity of montmorillonite. Adsorpt 2020 265. 2020;26(5):793-811. doi:10.1007/S10450-020-00200-Z.
- Effect of acid activation on the CO2 adsorption capacity of montmorillonite. Adsorption. 2020;26(5):793-811.
- [CrossRef] [Google Scholar]
- Adsorption of CO2 on palm shell based activated carbon modified by deep eutectic solvent: Breakthrough adsorption study. J. Environ. Chem. Eng.. 2021;9(4):105333
- [CrossRef] [Google Scholar]
- Review on carbon dioxide absorption by choline chloride/urea deep eutectic solvents. Adv. Chem.. 2018;2018:1-6.
- [CrossRef] [Google Scholar]
- Adsorption kinetics and thermodynamics properties of Supercritical CO2 on activated clay. J. Pet. Sci. Eng.. 2018;166:476-481.
- [CrossRef] [Google Scholar]
- Sorption direct air capture with CO2 utilization. Prog. Energy Combust. Sci.. 2023;95:101069
- [CrossRef] [Google Scholar]
- Effect of acid and alkali treatments on surface areas and adsorption energies of selected minerals. Undefined. 2002;50(6):771-783.
- [CrossRef] [Google Scholar]
- Sustainable energy transition for renewable and low carbon grid electricity generation and supply. Front. Energy Res.. 2022;9:1032.
- [CrossRef] [Google Scholar]
- A review of technologies for carbon capture, sequestration, and utilization: Cost, capacity, and technology readiness. Greenh. Gases Sci. Technol.. 2022;12(1):200-230.
- [CrossRef] [Google Scholar]
- Exploiting response surface methodology for experimental modeling and optimization of CO2 adsorption onto NaOH-modified nanoclay montmorillonite. J. Environ. Chem. Eng.. 2020;8(2):103663
- [CrossRef] [Google Scholar]
- Nanoclay montmorillonite as an adsorbent for CO2 capture: Experimental and modeling. J. Chinese Chem. Soc.. 2020;67(2):253-266.
- [CrossRef] [Google Scholar]
- Investigation of the ultrasound assisted CO2 absorption using different absorbents. Process Saf. Environ. Prot.. 2021;149:277-288.
- [CrossRef] [Google Scholar]
- Adsorption equilibrium, thermodynamic, and kinetic study of O2/N2/CO2 on functionalized granular activated carbon. ACS Omega. 2022;7(22):18409-18426.
- [CrossRef] [Google Scholar]
- Experiments and thermodynamic modeling of the solubility of carbon dioxide in three different Deep Eutectic Solvents (DESs) J. Chem. Eng. Data. 2015;60(11):3246-3252.
- [CrossRef] [Google Scholar]
- Carbon dioxide capture by deep eutectic solvent impregnated sea mango activated carbon. J. Chem. Eng. Data. 2018;60(11):3246-3252.
- [CrossRef] [Google Scholar]
- The evaluation of the impact on the quality of the atmosphere of all activities carried out in the ports of Naples and Salerno. Case Stud. Chem. Environ. Eng.. 2022;6:100263
- [CrossRef] [Google Scholar]
- Mohammadi MD, Abdullah HY. Adsorption of 1-chloro-1,2,2,2-tetrafluoroethane on pristine, Al, Ga-doped boron nitride nanotubes: a study involving PBC-DFT, NBO analysis, and QTAIM. https://doi.org/101139/cjc-2020-0309. 2020;99(1):51-62. doi:10.1139/CJC-2020-0309.
- The adsorption of chlorofluoromethane on pristine and Ge-doped silicon carbide nanotube: a PBC-DFT, NBO, and QTAIM study. Mol. Simul.. 2020;46(17):1405-1416.
- [CrossRef] [Google Scholar]
- Enhancing the absorption of 1-chloro-1,2,2,2-tetrafluoroethane on carbon nanotubes: an ab initio study. Bull. Mater. Sci.. 2021;44(3):1-11.
- [CrossRef] [Google Scholar]
- Moore FC, Lacasse K, Mach KJ, Shin YA, Gross LJ, Beckage B. Determinants of emissions pathways in the coupled climate–social system. Nat 2022 6037899. 2022;603(7899):103-111. doi:10.1038/s41586-022-04423-8.
- Sustainability of biodegradable plastics: New problem or solution to solve the global plastic pollution? Curr. Res. Green Sustain. Chem.. 2022;5:100273
- [CrossRef] [Google Scholar]
- Application of advanced exergy analysis for optimizing the design of carbon dioxide pressurization system. Energy. 2021;228:120580
- [CrossRef] [Google Scholar]
- Optimization of energy efficiency, energy consumption and CO2 emission in typical iron and steel manufacturing process. Energy. 2022;257:124822
- [CrossRef] [Google Scholar]
- Pd/zeolite-based catalysts for the preferential CO oxidation reaction: ion-exchange, Si/Al and structure effect. Catal. Sci. Technol.. 2016;6(8):2623-2632.
- [CrossRef] [Google Scholar]
- Reduction of chloride ions in the diethanol amine cycle and improvement of the natural gas sweetening. J. Nat. Gas Sci. Eng.. 2016;31:730-737.
- [CrossRef] [Google Scholar]
- Novikova L, Belchinskaya L. Adsorption of Industrial Pollutants by Natural and Modified Aluminosilicates. Clays, Clay Miner Ceram Mater Based Clay Miner. Published online March 9, 2016. doi:10.5772/61678.
- A search for selectivity to enable CO2 capture with porous adsorbents. Energy Environ. Sci.. 2018;11(1):57-70.
- [CrossRef] [Google Scholar]
- Can updated climate pledges limit warming well below 2°C?; Increased ambition and implementation are essential. Science (80-). 2021;374(6568):693-695.
- [CrossRef] [Google Scholar]
- DES assisted synthesis of hierarchical nitrogen-doped carbon molecular sieves for selective CO2versus N2 adsorption. J. Mater. Chem. A. 2014;2(23):8719-8729.
- [CrossRef] [Google Scholar]
- Influence of surface modification on selective CO2 adsorption: A technical review on mechanisms and methods. Micropor. Mesopor. Mater.. 2021;312:110751
- [CrossRef] [Google Scholar]
- Active sites modulation with Runge-Gross theorem: CO2 capture by porphyrinic metal–organic frameworks at excited states. AIChE J.. 2023;69(5):e17994.
- [Google Scholar]
- Ramezanipour Penchah H, Ghaemi A, Ghanadzadeh Gilani H. Efficiency increase in hypercrosslinked polymer based on polystyrene in CO2 adsorption process. Polym Bull 2021 796. 2021;79(6):3681-3702. doi:10.1007/S00289-021-03678-X.
- Eco-friendly CO 2 adsorbent by impregnation of diethanolamine in nanoclay montmorillonite. Environ. Sci. Pollut. Res. Int.. 2021;28(39):55754-55770.
- [CrossRef] [Google Scholar]
- Ramli NA, Hashim NA, Aroua MK. Prediction of CO2/O2 absorption selectivity using supported ionic liquid membranes (SILMs) for gas–liquid membrane contactor. https://doi.org/101080/0098644520171387854. 2018;205(3):295-310. doi:10.1080/00986445.2017.1387854.
- Recent advances in catalysis based on transition metals supported on zeolites. Front. Chem.. 2021;9:627.
- [CrossRef] [Google Scholar]
- N-rich porous organic polymers based on Schiff base reaction for CO2 capture and mercury(II) adsorption. J. Colloid Interface Sci.. 2021;587:121-130.
- [CrossRef] [Google Scholar]
- Screening of deep eutectic solvents (DESs) as green CO2 sorbents: from solubility to viscosity. New J. Chem.. 2016;41(1):290-301.
- [CrossRef] [Google Scholar]
- Adoption of green innovation technology to accelerate sustainable development among manufacturing industry. J. Innov. Knowl.. 2022;7(4):100231
- [CrossRef] [Google Scholar]
- Tailoring natural zeolites by acid treatments. J. Mater. Sci. Chem. Eng.. 2019;7(2):26-37.
- [CrossRef] [Google Scholar]
- Deep Eutectic Solvents (DESs) and their applications. Chem. Rev.. 2014;114(21):11060-11082.
- [CrossRef] [Google Scholar]
- Carbon dioxide adsorption studies on modified montmorillonite clay/reduced graphene oxide hybrids at low pressure. J. Environ. Chem. Eng.. 2019;7(5):103344
- [CrossRef] [Google Scholar]
- Amino-functionalized hypercrosslinked polymers for highly selective anionic dye removal and CO2/N2 separation. New J. Chem.. 2019;43(44):17267-17274.
- [CrossRef] [Google Scholar]
- High CO2 adsorption on amine-functionalized improved mesoporous silica nanotube as an eco-friendly nanocomposite. Energy and Fuels. 2019;33(6):5384-5397.
- [CrossRef] [Google Scholar]
- The evidence is clear: the time for action is now. We can halve emissions by 2030. — IPCC. Accessed January 21, 2023. https://www.ipcc.ch/2022/04/04/ipcc-ar6-wgiii-pressrelease/.
- Determination of structural modification in acid activated montmorillonite clay by FT-IR spectroscopy. Spectrochim. Acta A Mol. Biomol. Spectrosc.. 2006;64(2):273-278.
- [CrossRef] [Google Scholar]
- Wang W, Xiao J, Wei X, Ding J, Wang X, Song C. Development of a new clay supported polyethylenimine composite for CO2 capture. Appl Energy. 2014;113(C):334-341. doi:10.1016/J.APENERGY.2013.03.090.
- Adsorption kinetic models: Physical meanings, applications, and solving methods. J. Hazard. Mater.. 2020;390:122156
- [CrossRef] [Google Scholar]
- CO2 capture by solid adsorbents and their applications: current status and new trends. Energy Environ. Sci.. 2010;4(1):42-55.
- [CrossRef] [Google Scholar]
- Carbon capture from flue gas and the atmosphere: A perspective. Front. Energy Res.. 2020;8:265.
- [CrossRef] [Google Scholar]
- Wazeer I, Hadj-Kali MK, Al-Nashef IM. Utilization of Deep Eutectic Solvents to Reduce the Release of Hazardous Gases to the Atmosphere: A Critical Review. Mol 2021, Vol 26, Page 75. 2020;26(1):75. doi:10.3390/MOLECULES26010075.
- Modification of the surfaces of Wyoming montmorillonite by the cationic surfactants alkyl trimethyl, dialkyl dimethyl, and trialkyl methyl ammonium bromides. J. Colloid Interface Sci.. 2007;305(1):150-158.
- [CrossRef] [Google Scholar]
- Solubilities of CO2, CH4, H2, CO and N2 in choline chloride/urea. Green Energy Environ.. 2016;1(3):195-200.
- [CrossRef] [Google Scholar]
- Molecular simulation of C2H4/CO2/N2/O2 adsorption characteristics in lignite and anthracite. AIP Adv.. 2021;11(8):085205
- [CrossRef] [Google Scholar]
- Zhou C, Tong D, Yu W. Smectite Nanomaterials: Preparation, Properties, and Functional Applications. Nanomater from Clay Miner A New Approach to Green Funct Mater. Published online January 1, 2019:335-364. doi:10.1016/B978-0-12-814533-3.00007-7.
- Comparison of CO2 separation efficiency from flue gases based on commonly used methods and materials. Materials (Basel). 2022;15(2)
- [CrossRef] [Google Scholar]


