Translate this page into:
In silico identifying MET/FN1/TGFBI as molecular targets in drug-resistant head and neck cancer and preclinical repurposing sulfasalazine for enhanced therapeutic efficacy
⁎Corresponding author. JHChen.md168@gmail.com (Jia-Hong Chen) d621108006@tmu.edu.tw (Jia-Hong Chen)
-
Received: ,
Accepted: ,
This article was originally published by Elsevier and was migrated to Scientific Scholar after the change of Publisher.
Abstract
Head and neck squamous cell carcinoma (HNSCC) is a highly aggressive cancer affecting over half a million people worldwide each year. Although recent FDA-approved treatments, like cetuximab, have shown promise, the five-year survival rate remains below 50 %. This underscores the need to identify molecular signatures predicting clinical outcomes and potential therapeutic targets. Notably, the alteration of tyrosine-protein kinase Met (c-Met), a hepatocyte growth factor (HGF) receptor, stimulates tumor growth and metastasis across various cancers. However, its role and clinical implications in HNSCC remain unexplored. In HNSCC, MET's downstream signaling, mediated by phosphoinositide 3-kinase (PI3K)/protein kinase B (Akt), is activated by fibronectin 1 (FN1), an extracellular matrix protein, fostering cancer progression. Additionally, FN1 and transforming growth factor-β (TGFB) are known to induce epithelial-mesenchymal transition in numerous cancers, leading to metastasis. Our computational analysis revealed significant upregulation of MET/FN1/TGFBI in HNSC at the mRNA level compared to normal samples. Given the immune system's pivotal role in HNSC progression, we analyzed the association of our target genes with immune infiltration. Our findings suggest a correlation between MET/FN1/TGFBI oncogenes and various stromal cells, highlighting their potential role in cancer recurrence and therapeutic resistance. We further explored the therapeutic potential of sulfasalazine, an anti-inflammatory drug. Molecular docking experiments revealed that sulfasalazine had a strong affinity for MET, FN1, and TGFBI, outperforming standard inhibitors in binding energy. These observations suggest sulfasalazine could be a promising MET/FN1/TGFBI gene signature inhibitor. Our study offers preclinical evidence supporting sulfasalazine as a standalone therapeutic agent and an adjunct to counteract cisplatin resistance in HNSC cells.
Keywords
Head and neck squamous cell carcinoma (HNSCC)
Cisplatin resistance
cancer-associated fibroblasts (CAF)
Sulfasalazine
1 Introduction
Head and neck squamous cell carcinoma (HNSCC) is one of the most common cancer types in the world, constituting about 91 % of all head and neck cancers (Szyfter, 2021). Several heterogenic diseases originate from HNSC; these include the oral cavity, throat, larynx, and salivary (McDermott and Bowles, 2019; Guo et al., 2021). Approximately 600,000 new cases are reported yearly, with more than 300,000 succumbing to the disease (Siegel et al., 2022; Hashim et al., 2017; Alfouzan, 2021; Fitzmaurice et al., 2017; Yan et al., 2020). Additionally, almost 40 % of HNSCC patients are diagnosed with advanced stages of cancer when the treatment is less effective, thus leading to an overall survival rate of less than 5 years (Hashim et al., 2019; Cohen et al., 2018; Kitamura et al., 2020). Significant advances have been made in the treatment of HNSCC over the past decade, and the current treatment includes surgery and radiotherapy (RT), sometimes combined with chemotherapy (CT) and immunotherapy, for the management of advanced-stage disease (Clin et al., 2022; Bye et al., 2020; Pezdirec et al., 2019; Wang et al., 2019; Vermorken and Specenier, 2010; Aragón et al., 2022). Conversely, targeted therapies have gained increased attention in recent years. (Kundu and Nestor, 2012). A deeper understanding of molecular mechanisms underlying HNSCC still needs to be investigated. Currently, more efforts have been made to understand different mutations in cancer.
Numerous studies indicate that overexpression of MET signaling in HNSC fosters cancer progression and metastasis, often resulting in poor clinical outcomes and metastasis, consequently leading to poor clinical outcomes (Uchida, 2001; Lo Muzio et al., 2004). Furthermore, c-MET has been implicated in promoting tumorigenesis, invasion, angiogenesis, and inhibiting apoptosis in HNSC. This is achieved primarily through the activation of the phosphoinositide 3-kinase (PI3K) pathway, followed by protein kinase B (Akt) activation (Keysar et al., 2017; Arnold et al., 2017; Guo et al., 2021). Crizotinib, the standard treatment targeting MET, has been shown to inhibit the MET pathway across various cancer types. However, resistance to this treatment often develops in patients (Birchmeier et al., 2003; Jung et al., 2020). Research by Zhou W. H et al. highlighted that the PI3K/Akt signaling pathway, when activated by fibronectin 1 (FN1), can stimulate HNSC development (Zhou et al., 2022). FN1, an extracellular matrix (ECM) protein, is found to be overexpressed in HNSC. Its overexpression has been linked with cancer development, progression, and increased radiation resistance in HNSC (Zollinger and Smith, 2017; Pankov and Yamada, 2002). Notably, FN1 has been associated with tumor progression and stemness across various cancers, positioning it as a potential immunotherapeutic target (Lieverse et al., 2020; Efthymiou et al., 2020; Amundson and Smilenov, 2010; Li et al., 2020; Wang et al., 2019; Li et al., 2019). Yet, the relationship between FN1 and HNSC remains underexplored, underscoring the need for deeper investigation into FN1′s molecular mechanisms within HNSC. In addition to its potential role in tumorigenesis, FN1 is instrumental in connecting tumor cells to the extracellular matrix (ECM), thereby facilitating cell migration and differentiation (Amundson and Smilenov, 2010; Hynes, 1986; Astrof and Hynes, 2009).
Recent research indicates that a high epithelial-to-mesenchymal transition (EMT) score in HNSCC correlates with elevated expression of EMT markers,including FN1 and transforming growth factor-β (TGFB) (Liu et al., 2020; Ko et al., 2020). TGFB is secreted by tumor cells and stromal cells such as the fibroblasts and is instrumental in activating the tumor microenvironment (TME) (Chen et al., 1999). Overexpression of TGFBI has been observed in HNSC, and it plays a significant role in cell adhesion, tumor initiation, invasion, and metastasis (Kim et al., 2000). Additionally, overexpression of TGFBI has been reported in HNSC and plays a significant role in tumor initiation, invasion, and poor clinical outcomes (Peng et al., 2022; Thapa et al., 2007).
Collectively, these findings hint at a potential interaction among MET/FN1/TGFBI in HNSC. In this study, we utilized bioinformatics approaches to predict the expression of MET/FN1/TGFBI in HNSC. Sulfasalazine is a niclosamide derivative anti-inflammatory drug containing sulfapyridine, a sulfonamide antibiotic, used for managing rheumatoid arthritis that is severe and resistant (Wahl et al., 1998; Conaghan et al., 1997). It has anti-cancer effects on human tumors, including;lung cancer (Lay et al., 2007), and colorectal cancer stemness and metastasis (Leung et al., 2022) and human glioblastoma (Robe et al., 2004), However, its impact on head and neck cancer remains largely unexplored. While the exact mechanism of sulfasalazine's action requires further investigation, it has been demonstrated to inhibit NF-nB activation at various stages (Arlt et al., 2002; Weber et al., 2000), which has the potential to offer new opportunities for enhancing therapeutic approaches for individuals with cancer (Arlt et al., 2001; Müerköster et al., 2003). In this context, we presented both in vitro and in vivo evidence suggesting that sulfasalazine exhibits anti-HNSC functionalities by suppressing the tumorigenic/stemness signature MET/FN1/TGFBI and reversing cisplatin-resistance in HNSC cells.
2 Materials and methods
2.1 Identification of differentially expressed genes (DEGs)
Genetic mutations regulate gene expression in normal and cancer cells. To identify the top 25 overexpressed genes in HNSC, we utilized UALCAN, an online platform analyzing TCGA genomic data., which included the MET/FN1/TGFBI signaling pathway (Chandrashekar et al., 2017) ( https://ualcan.path.uab.edu/analysis.html). Moreover, the mRNA expression levels of the targeted genes were further validated using UALCAN and Gene Set Cancer Analysis (GSCA), ( https://bioinfo.life.hust.edu.cn/GSCA/), an online web tool used to analyze genomic and immunogenomic gene set (Liu et al., 2023). We used GSCA to explore Gene Set Variation Analysis (GSVA) of the association between immune infiltrate/clinical and MET/FN1/TGFBI expression score.
2.2 Overexpression analysis of MET/FN1/TGFBI oncogenes in HNSC
To validate the overexpression of MET/FN1/TGFBI genes in HNSC, we used the UALCAN tool; In this context, we examined the expression levels of MET, FN1, and TGFBI across various cancer stagesFN1TGFBI. FN1TGFBI Additionally, we conducted a thorough exploration of the correlation in gene expression patterns among the selected gene signatures. Subsequently, we employed the GEPIA online platform (https://gepia2.cancer-pku.cn/#index) to ascertain the overall survival implications when MET/FN1/TGFBI are expressed in HNSC. A significance threshold of P < 0.05 was applied to determine statistical significance in our analysis.
2.3 Functional analysis of DEGs in HNSC pathogenesis
To determine the relationship among MET/FN1/TGFBI signatures, we utilized String ( https://string-db.org/), an online database to construct protein network clusters containing nodes and edges (von Mering et al., 2003). Herein, we analyzed the protein–protein interaction (PPI) among these genes. Accordingly, the interactions comprised an enrichment average local clustering coefficient of 0.78, PPI enrichment p-value of 8.29 x10⁻⁶, and the confidence cutoff value representing the interaction links was adjusted to 0.900 as the highest scoring link. Moreover, we predicted the gene enrichment analysis to determine the gene ontology (GO) analysis, which was used to define the biological processes (BP) and Kyoto Encyclopedia of Genes and Genomes (KEGG). The analyses were implemented using the DAVID Gene Functional Classification web tool ( https://david.ncifcrf.gov/) (Huang et al., 2007) to test the significant statistical enrichment. Moreover, the results were analyzed using the functional enrichment analysis tool (FunRich) with the criterion set to p < 0.05. (Pathan et al., 2015) ( https://www.funrich.org/).
2.4 Analysis of genomic alterations of MET/FN1/TGFBI in HNSC
To further analyze genetic mutations of MET/FN1/TGFBI oncogenic signatures, we used the cBio Cancer Genomics Portal (cBioportal: https://www.cbioportal.org/), This portal classifies gene alterations by the percentage of individual genes affected by amplification, facilitating further analysis.
2.5 Correlation between MET/FN1/TGFBI oncogenic and immune infiltrating cells in HNSC
Gene Set Cancer Analysis (GSCA) was used to investigate the correlation between immune infiltrating cells and MET/FN1/TGFBI. Herein, we first determined the copy number to estimate the association between immune cells' infiltration and our selected gene set. Based on RNA sequencing data, the infiltrates were determined using the Immune Cell Abundance Identifier (ImmuCellAI). ( https://bioinfo.life.hust.edu.cn/ImmuCellAI/). Moreover, we explored the GSVA score module to estimate the association between immune cells' infiltrates and MET/FN1/TGFBI expression level from the RNA seq. data, with P value ≤ 0.05; and FDR ≤ 0.05 considered statistically significant.
2.6 Molecular docking of protein-ligand interactions
To evaluate the strength of interactions of Sulfasalazine with MET/FN1/TGFBI signatures, we performed molecular docking analysis. First, the crystal structures of Proto-Oncogene, Receptor Tyrosine Kinase (MET) (PDB id: 3VW8), Fibronectin 1 (FN1) (PDB id:5E52), and Transforming Growth Factor Beta Induced (TGFBI) (PDB id:5VQP), were downloaded from RCSB PDB (Protein Data Bank) in PDB format (Berman et al., 2000). The 3D structure of sulfasalazine (CID:5339) was retrieved from ( https://pubchem.ncbi.nlm.nih.gov/compound/) and was downloaded from PubChem in SDF format. Moreover, we used a graphic user interface of AutoDock software to convert all the PDB files to PDBQT format (Trott and Olson, 2010). The co-crystallized water molecules and other atoms were removed, apart from the protein residues and Zn ions in the structure. The clean protein molecule was added with Kollman charges, parameters related to solvation, and polar hydrogens. Once all the parameters were added, the protein was considered a rigid molecule and saved in PDBQT format for molecular docking studies. For visualization and interpretation of the docking results, we used Discovery Studio software (Mokgautsi et al., 2021).
2.7 Cellular viability assay
Survival rate analysis was carried out using the sulforhodamine B (SRB) assay, a well-established method in scientific research (Vichai and Kirtikara, 2006; Orellana et al., 2016). In a detailed experimental setup, HNSCC cells, specifically (CAL27 and SAS) were seeded at a concentration of (104 cells/well) in 96-well plates. These cells underwent a series of treatments, including exposure to sulfasalazine (SFZ) and cisplatin (CDDP), administered both individually and in combination. Following the designated treatment period, the number of viable cells was determined using the SRB reagent, providing a quantitative measure of the cellular response to the applied treatments. This method allows for a comprehensive evaluation of the efficacy of sulfasalazine and cisplatin, both separately and in combination, in influencing the survival of HNSCC cells.
2.8 Colony formation assay
CAL27 and SAS cells (300 cells/well) were seeded into 6-well culture plates (Corning Inc., Corning, NY, USA), treated with 50 μM of SFZ, and incubated for 6 days at 37 ◦C. This extended incubation allowed for a thorough exploration of the sustained effects and responses of CAL27 and SAS cells to the administered SFZ concentration, providing a detailed understanding of the cellular dynamics over this specified duration.The cells underwent three rounds of cold phosphate-buffered saline (PBS) washing, followed by fixation using 10 % trichloroacetic acid (TCA) and staining with 0.4 % sulforhodamine B (SRB). Following this, the cells were subjected to three additional PBS washes and subsequently air-dried at room temperature.Micrographs were taken, and the number of colonies was determined using the ImageJ software version 1.49 (https://imagej.nih.gov/ij/). Aggregates with a diameter ≥ 100 μm were considered a colony.
2.9 Tumor sphere formation assay
The sphere formation assay was conducted as follows: specifically, CAL27 and SAS cells (5 x10⁵ cells/well) were seeded into the ultra-low-attachment six-well plates containing stem cell medium; serum-free RPMI 1640 medium supplemented with B27 and 20 ng/mL human basic fibroblast growth factor (bFGF) (Invitrogen, Grand Island, NY, USA), and epidermal growth factor (20 ng/mL, Millipore, Bedford, MA). The plates were incubated in the presence or absence of SFZ for 48 h. The aggregated spheres (diameter > 50 μm) were counted and photographed with an inverted phase-contrast microscope.
2.10 Cell-migration assay
5 x 10⁴ cells/well of HNSCC cell lines (CAL27 and SAS, were seeded in 24 well plate (insert) (ThermoFisher, Taipei, Taiwan), 20 % FBS containing media was added to the lower chamber and incubated for 24 h at 37 °C,
Subsequent to the incubation, a detailed procedural step involved the careful removal of non-invaded cells from the upper chamber, ensuring a selective focus on the cells that had successfully invaded the lower chamber. These invaded cells were then subjected to staining using sulforhodamine B (SRB), a method for assessing cell viability and proliferation. The outcomes of these processes were thoroughly photographed through microscopic imaging, providing a comprehensive analysis of the invasive properties of CAL27 and SAS cells under the experimental conditions.
2.11 Western blot analysis
Proteins from cell lysates harvested from different experiments were separated using a standard SDS-PAGE method with a Mini-Protean III system (Bio-Rad, Taiwan) and transferred onto PVDF membranes using Trans-Blot Turbo Transfer System (Bio-Rad, Taiwan). The membranes were first blocked with 10 % skim milk for 30 min and probed with primary antibodies in the cold overnight. Secondary antibodies were then added. The immunosignals were detected and visualized using an ECL detection kit. Images of the immunosignals were obtained using the UVP BioDoc-It system (Upland, CA, USA). The signal intensity was determined using ImageJ software.
2.12 Real-time PCR reaction
Total RNA was isolated and purified using TRIzol-based protocol (Life Technologies) according to the protocol provided by the vendor. Total RNA (10 ng) was then reverse transcribed using QIAGEN OneStep RT-PCR Kit (QIAGEN, Taiwan), and the PCR reaction was performed using a Rotor-Gene SYBR Green PCR Kit (400, QIAGEN, Taiwan). Please refer to the supplementary information for the primer sequences.
2.13 In vivo studies
Animal experiments received ethical approval and adhered strictly to the ethical standards outlined by Taipei Medical University, as indicated by the Affidavit of Approval (approval no. LAC-2017–0161). Twenty-four female NOD/SCID mice, aged 6 weeks with an average weight of 26.02 ± 1.64 g, were sourced from BioLASCO (Taipei, Taiwan). These mice were then housed in accordance with standard laboratory conditions at the Animal Center of Taipei Medical University. Mice were randomly stratified into four cohorts (n = 6), and a subcutaneous injection of 6 × 10⁵ of CDDP-resistant SAS tumoroids which was administered to the right hind flank to initiate tumor growth. The treatment groups were as follows: group A received sulfasalazine exclusively (5 mg/kg body weight five times per week), group B received cisplatin exclusively (5 mg/kg five times per week), and group C underwent combined treatment (5 mg/kg five times per week). Group D functioned as the control and received 0.5 mL of phosphate-buffered saline (PBS). Changes in body weight (BW) and tumor growth were monitored weekly utilizing an electronic weighing scale and standard calipers. The final tumor volume was calculated using the formula: tumor volume = ½ (length × width^2) (Wu et al., 2020; Lawal et al., 2023). Following a 4-week treatment period, animals were subjected to mild anesthesia and euthanized, as previously outlined (Olugbodi et al., 2020).
2.14 Statistical analysis
Data analysis was conducted using GraphPad Prism for Windows (GraphPad Software, La Jolla, CA, USA). Data from treatment groups were compared with the control using Student's t-test. Data were considered statistically significance at p < 0.05 (*), p < 0.001 (**), and p < 0.0001 (***).
3 Results
3.1 Identification potential oncogenic signature in HNSC
To identify the overexpressed gene in HNSC, we explored the TCGA database from UALCAN tool, and identified 25 overexpressed genes in HNSC (red), as compared to normal adjacent samples (blue) as shown on a heat map (Fig. 1A). To further analyze, we performed mRNA expression analysis and identified MET/FN1/TGFBI to be significantly upregulated in HNSC among the other 25 overexpressed genes (Fig. 1 B, E), We then explored the GSCA database to investigate the gene set variation (GSV). Interestingly, we found that MET/FN1/TGFBI oncogenic set was overexpressed in HNSC tumor tissue when analyzed at clinical and pathological settings (Fig. 1 F, G). P-value < 0.05 was considered statistically significant.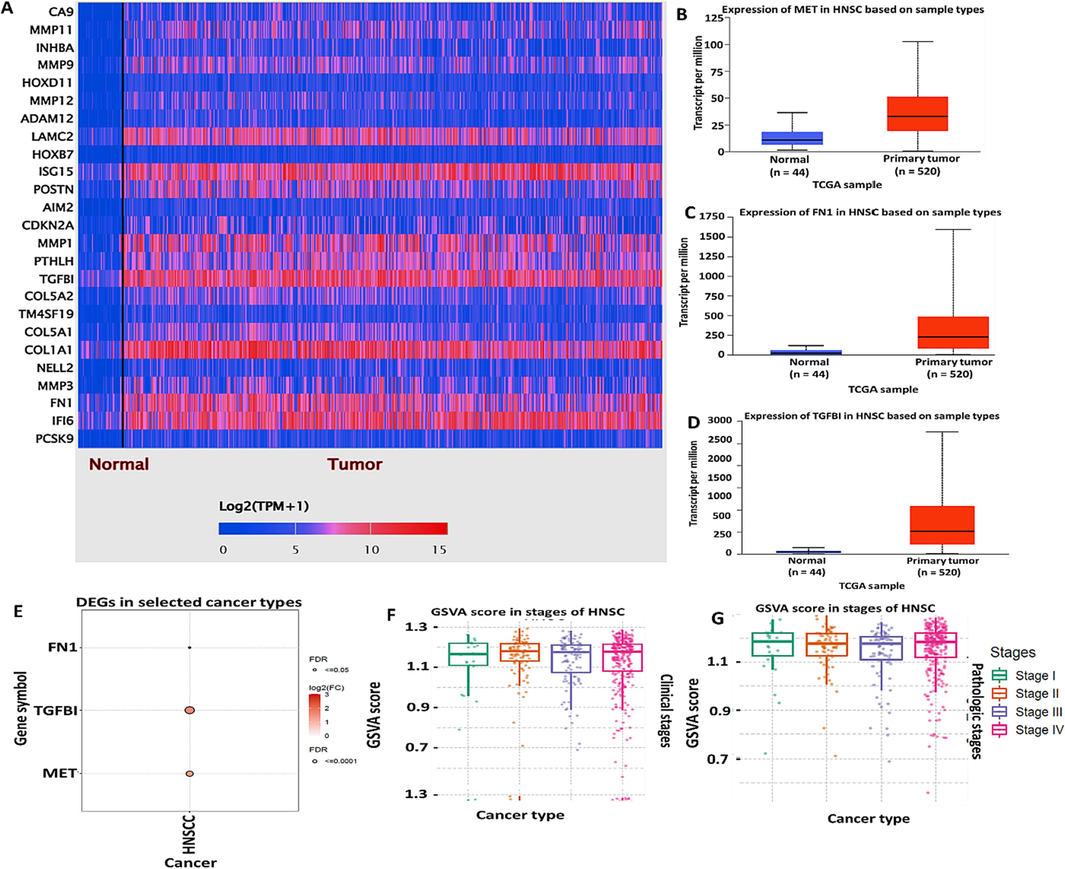
MET/FN1/TGFBITGFBII oncogenic signature is overexpressed in Head and neck cancer (HNSC) (A) heat map showing the top 25 overexpressed genes in HNSC samples as compared to normal samples (B-D) MET/FN1/TGFBI oncogenes are highly expressed in HNSC samples at mRNA level, as compared to their counterparts (E) shows significant gene overexpression of MET/FN1/TGFBI in HNSC (F-G) MET/FN1/TGFBI gene sets associated with high tumor burden in all tumor stages (I-IV) at clinical and pathological settings.
3.2 Overexpression of MET/FN1/TGFBI signature is associated with HNSC cancer metastasis, and poor prognosis
To further investigate whether these genes are associated with HNSC metastasis, we analyzed their expression level through the tumor stages using the UALCAN tool. The MET/FN1/TGFBI expression in normal samples was lower than their counterparts based on nodal metastatic pathological status. Node 0 (N0) is associated with regional lymph node metastasis. (N1), with metastases in 1 to 3 axillary lymph nodes (N3) with metastases in 4 to 9 axillary lymph nodes and (N4), with metastases in 10 or more axillary lymph nodes (Fig. 2A-C), thus suggesting that these signature associated with HNSC metastasis. Moreover, we investigated the gene correlation among the target genes. As anticipated, we identified a significant correlation between MET and TGFBI, FN1 and TGFBI, and FN1 and MET in HNSC tumors, with a pearson correlation coefficient (r = 0.45, 0.44 and 0.38) respectively(Fig. 2D-F). Furthermore, we performed the overall survival and found that overexpression of MET/FN1/TGFBI oncogenes was associated with shorter patient survival, thus leading to poor prognosis HNSC (Figure G-I).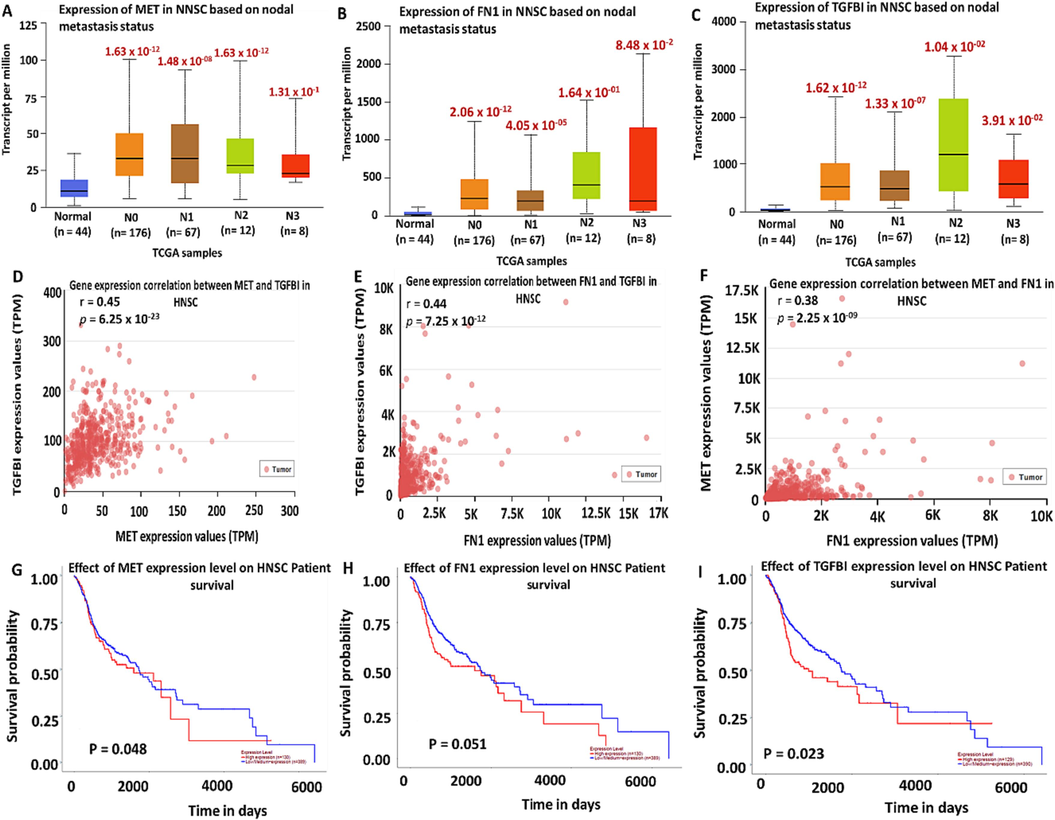
Overexpression of MET/FN1/TGFBITGFBII signature is associated with HNSC cancer metastasis and poor prognosis (A-C) Overexpression of MET/FN1/TGFBI at different nodal metastatic status (N0-N3). (D-F) MET, FN1, and TGFBI are correlated in HNSC tumor samples. (G-I) MET/FN1/TGFBI upregulation is associated with shorter patient survival in HNSC. P < 0.05 is considered significant.
3.3 The protein–protein interaction network and enrichment analysis MET/FN1/TGFBI signatures
The interaction network among MET/FN1/TGFBI -proteins was determined using the string database. Accordingly, we constructed the network clusters consisting of gene co-expression, gene fusion, gene neighborhood, and gene co-occurrence. Interestingly, we identified interaction between MET with FN1, MET with TGFBI, and FN1 with TGFBI within network clustering. The interactions had an initial of 3 nodes, 3 edges, 2 average node degrees and were increased to 13 nodes, 53 edges, and 8.15 average node degrees. Moreover, the interactions also had an average local clustering coefficient of 0.838, a PPI enrichment p-value of 1.62x10⁻¹¹, and the confidence cutoff value representing the interaction links was adjusted to 0.900 as the highest scoring link (Fig. 3A). Moreover, we used Gene-mania tool, to determine the gene-gene interaction, and as anticipated, we identified gene interaction among MET, FN1, and TGFBI, and this involved different networks, including physical interactions, co-expression, predicted, co-localization, genetic alterations and pathway and shared protein domain networks (Fig. 3B). For further analysis, we retrieved the functional enrichments within the network, including biological processes (BP) and KEGG pathways and analyzed them through DAVID web-tool, and further used FunRich software for visualization. Based on the results, we identified six (6) significantly the enriched BP included; signaling transduction, cell communication, regulation of immune response, regulation of cell proliferation, regulation of cell cycle and apoptosis, in addition the analysis also revealed six (6) affected KEGG pathway as shown in (Fig. 3C, D) with the criterion set to p < 0.05.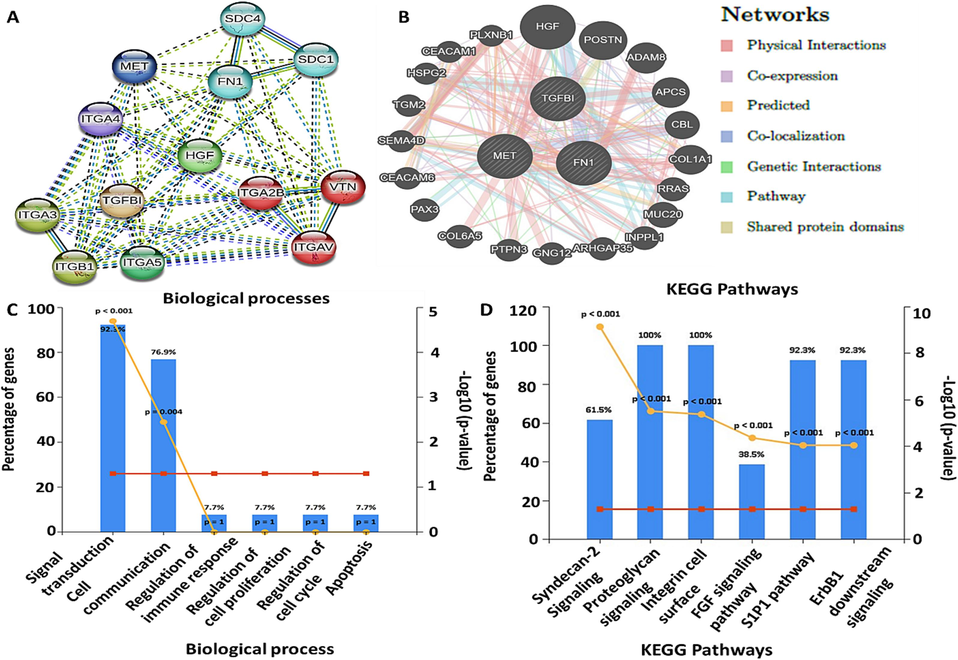
Interactions between MET/FN1/TGFBITGFBII signatures at Protein and gene level. (A) Protein-protein interactions among MET/FN1/TGFBI in the same network cluster. (B) Gene-gene interaction among the target genes. (C) enriched top six (6) biological processes (BP) (D) affected the top six (6) KEGG pathways.
3.4 Analysis of genomic alterations of MET/FN1/TGFBI
The genetic mutations of the target oncogenic signatures were analyzed using cBioportal software; accordingly, the high mRNA expressions level of MET/FN1/TGFBI was associated with putative copy alteration, including shallow deletion and gene amplification, which may promote more aggressive tumor, therapeutic resistance and metastasis (Fig. 4A-C). Furthermore, we identified MET, FN1, and TGFBI gene amplification in HNSC (1.2 %, 5 %, and 0.8 %, respectively, Fig. 4D). Moreover, among the top 10 mutated genes in HNSC, FN1 showed 75 % mutation, followed by MET (17 %) and TGFBI (8 %); these results suggested cell proliferation, invasion, and progression (Fig. 4E).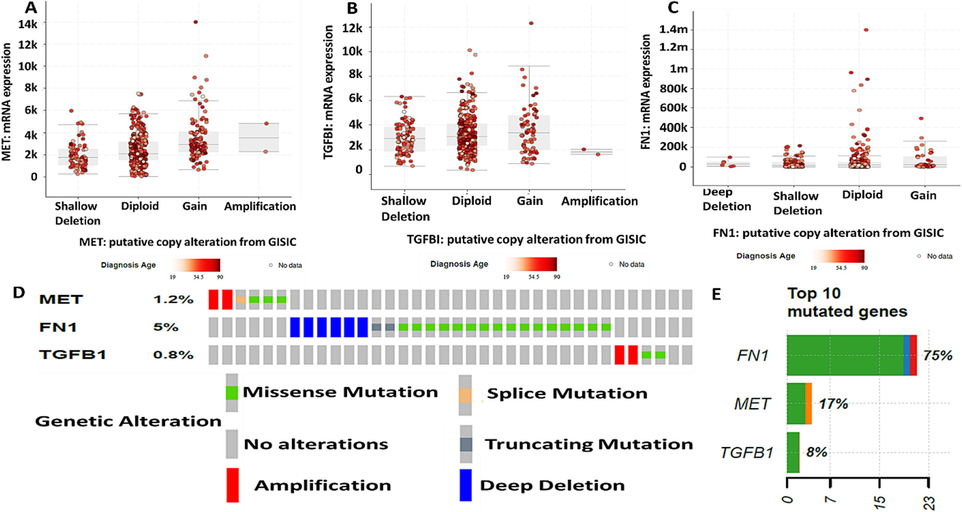
MET/FN1/TGFBITGFBII genes are mutated in HNSC (A-C) Putative copy alteration based on shallow deletion, diploid, gain, and amplification of MET, TGFBI, and FN1. (D) genetic alteration based on amplification percentage of MET (1.2%), FN1 (5%), and TGFBI (0.8%). (E) percentages of genetic mutations among 10 other genes; FN1 (75%), MET (17%), and TGFBI (8%).
3.5 Elevated MET/FN1/TGFBI expression is associated with an immune suppressive tumor microenvironment in HNSC
Next, we examined the relationship between the expression of MET/FN1/TGFBI and the tumor immune microenvironments of HNSC using the TISIDB database (Ru et al., 2019). We first identified that MET; FN1 and TGFBI expression was most significantly elevated in the mesenchymal subtype of HNSC (Fig. 5A). Also, our analysis showed that MET expression was significantly associated with immune inhibitor TGFBR1, while both FN1 and TGFBI were associated with PDCD1LG2 (PD-L2) (Fig. 5B). TGFBI and FN1 expression significantly correlated with the infiltration of regulatory T cells (Treg) while MET expression did not appear to impact immune cell infiltration (Fig. 5C) significantly.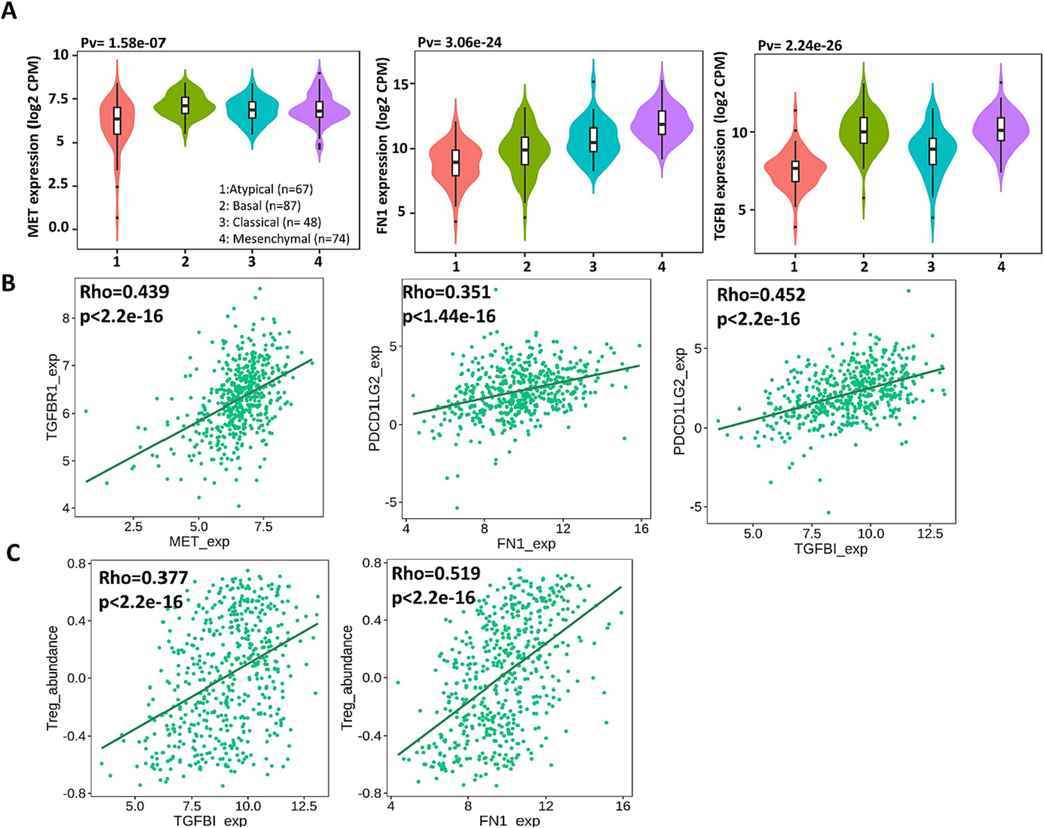
MET/FN1/TGFBITGFBII Expression is associated with immune suppression in HNSC. (A) Violin plots demonstrate the expression of MET, FN1, and TGFBI across different HNSC subtypes. Kruskal-Wallis Test was used to determine statistical significance. (B) Scatter plots demonstrate the correlation between MET, FN1 and TGFBI expression to immune inhibitors, TGFBR1 and PDCD1LG2 (PD-L2). The Spearman correlation test was used to determine correlation significance. (C) Scatter plots reveal that TGFBI and FN1 expression was significantly correlated with the Treg infiltration.
3.6 TGFBI and FN1 geneset enrichment analysis strongly correlated with myofibroblasts and metastasis
Next, we inquired the Jesen Tissues gene set library and found that TGFBI (upper table, Fig. 6) and FN1 (lower table, Fig. 6) gene sets were both strongly associated with the genes identified in the myofibroblasts. Genes strongly associated with metastasis, namely, MMP14, TGFB1 (from the TGFBI gene set) and COL1A1, COL1A2 (from the FN1 gene set) further reinforced our hypothesis that TGFBI /FN1 oncogenic signature was involved in HNSC metastasis and drug resistance. Furthermore, POSTN (Periostin) was shared in the myofbiroblast associated gene sets of TGFBI and FN1 (the insert venn diagram, Fig. 6). These findings linked TGFBI and FN1 with myofibroblasts (or cancer-associated fibroblasts), a major immune suppressive stromal cell lineage within the TME and a promoter for metastasis and drug resistance.
Jesen Tissues gene set library analysis. Upper and lower tables list the top 5 tissue types that are significantly associated with the TGFBI and FN1 gene sets, respectively. The venn diagram shows POSTN, as the overlapping gene shared by in the myofibroblasts associated with TGFBI and FN1 gene sets.
3.7 In silico molecular docking analysis exhibited unique binding affinities between sulfasalazine and the MET/FN1/TGFBI signature
After establishing the oncogenic roles of MET/FN1/TGFBI signature and its association with CAFs, we proposed to examineDocking results revealed potential inhibitory effects of Sulfasalazine when bound to MET/FN1/TGFBI oncogenic signature. The binding affinity results of Sulfasalazine in complex with MET, FN1, and TGFBI were much higher, with Gibbs free energies (ΔG) of (- 8 0.7 kcal/mol, − 7.9 kcal/mol, and – 7.0 kcal/mol) (Fig. 7), respectively as compared with their standard inhibitors Crizotinib (MET: − 8.3 kcal/mol) and Galunisertib (TGFBI: − 7.0 kcal/mol), which showed lower binding energies (Fig. 8 A, B). Subsequently, we used PyMol software and the discovery studio web tool for visualization to interpret the acquired results. Accordingly, several interactions were shown to stabilize the protein–ligand interactions, including a high number of conventional hydrogen bonds, van der Waals forces, carbon-hydrogen bonds, Pi anions, Pi-sigma, Pi-Pi stacked, and amide Pi-stacked, with their respective amino acids as shown in Table 1.(See Table 2).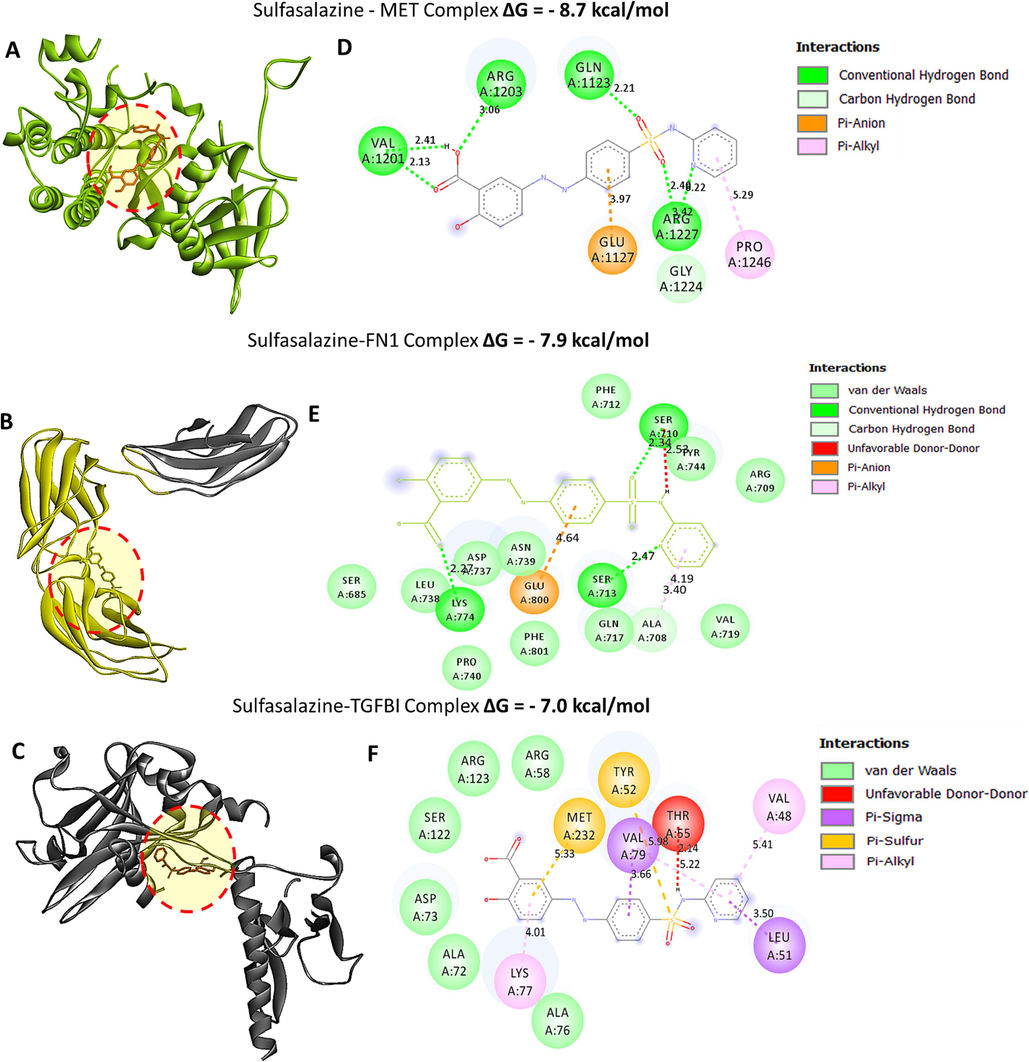
Protein-ligand interactions between MET/FN1/TGFBITGFBII with sulfasalazine. (A-C) 3D structures showing interaction between MET, FN1 and TGFBI in complex with sulfasalazine, the results show higher binding energies of the proteins and the ligand i.e. (ΔG) of 8.7 kcal/mol, 7.9 kcal/mol and 7.0 kcal/mol for MET, FN1 and TGFBI respectively. (D-F) 2D structure showing putative docking poses of ligand–receptor interactions displayed by conventional hydrogen bonds. The accompanying table gives binding energies of ligand–receptor interactions, including different types of interactions and the amino acid residues involved.
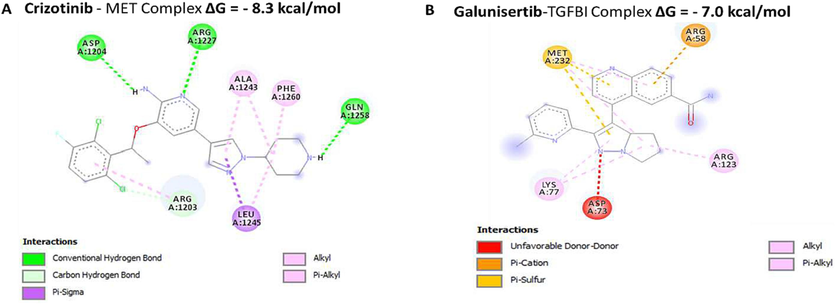
Protein-ligand interactions between MET/ TGFBI with sulfasalazine. (A-B) 2D structures showing interaction between MET and TGFBI in complex with standard inhibitors, the results show lower binding energies of the proteins and the ligand i.e. Crizotinib (MET: − 8.3 kcal/mol) and Galunisertib (TGFBI: − 7.0 kcal/mol), which showed lower binding energies hydrogen bonds. The accompanying table gives binding energies of ligand–receptor interactions, including different types of interactions and the amino acid residues involved.Crizotinib - MET Complex.
Sulfasalazine- MET Complex
(ΔG = −8.7 Kcal/mol)
Type of interactions and number of bonds
Distance of interacting Amino acids
Conventional Hydrogen bond (2)
VAL1201(2.31Å), ARG1203 (3.06 Å), ARG1227(2.40Å), GLN1123 (2.21Å)
Salt Bridge
Glu205, GLU206
Van der Waals forces
TRP629, VAL656, VAL711, HIS740, ASN710
Carbon hydrogen bond
SER630
Pi-Pi Stacked
TYR547
Pi-Pi T shaped
TYR666
Amide Pi-Stacked
TYR662
Pi-Alkyl
PHE357
Sulfasalazine- FN1 Complex
(ΔG = −7.9 Kcal/mol)
Type of interactions and number of bonds
Distance of interacting Amino acids
Conventional Hydrogen bond (3)
SER110(2.34Å), SER713 (2.47Å) & LYS774 (2.27Å)
Van der Waals forces
SER685, ASP737, ASN739, GLN717
Carbon hydrogen bond
ALA708
Pi-Anion
GLU800
Sulfasalazine- TGFBI Complex
(ΔG = −7.0 Kcal/mol)
Type of interactions and number of bonds
Distance of interacting Amino acids
Van der Waals forces
ARG58, ARG123, SER122, ASP73, ALA72
Pi-Sigma
VAL79, LEU51
Crizotinib - MET Complex (ΔG = −8.3 Kcal/mol)
Type of interactions and number of bonds
Distance of interacting Amino acids
Conventional Hydrogen bond (3)
ASP1204(5.34Å), ARG1227 (3.47Å) & GLN1257 (4.01Å)
Carbon hydrogen bond
ARG1203
Pi-Sigma
LEU1245
Pi-Alkyl
PHE1260, ALA1243
Galunisertib- TGFBI Complex
(ΔG = −7.0 Kcal/mol)
Type of interactions and number of bonds
Distance of interacting Amino acids
Pi-Cation
ARG58
Pi-Sulfur
MET238
Alkyl
LYS77
Pi-Alkyl
ARG123
3.8 Sulfasalazine treatment inhibited HNSC tumorigenesis and cancer stemness
To validate our hypothesis, we performed in vitro assays using human HNSC cell lines, CAL27 and SAS. First, sulfasalazine (SFZ) treatment reduced CAL27 and SAS cell viability in a dose dependent manner (Fig. 9A). In addition, SFZ treatment (50 μM, lower than IC50 values) significantly reduced the colony-forming (Fig. 8B), migratory (Fig. 9C) and tumor spheroid-generating (Fig. 9D) abilities. More importantly, we found that the combination of SFZ (100 µM) and CDDP (1 µM) (both lower than their respective IC50 values) suppressed the expression of the oncogenic signature, MET, TGFBI and FN1, as shown on the western blot (Fig. 9E).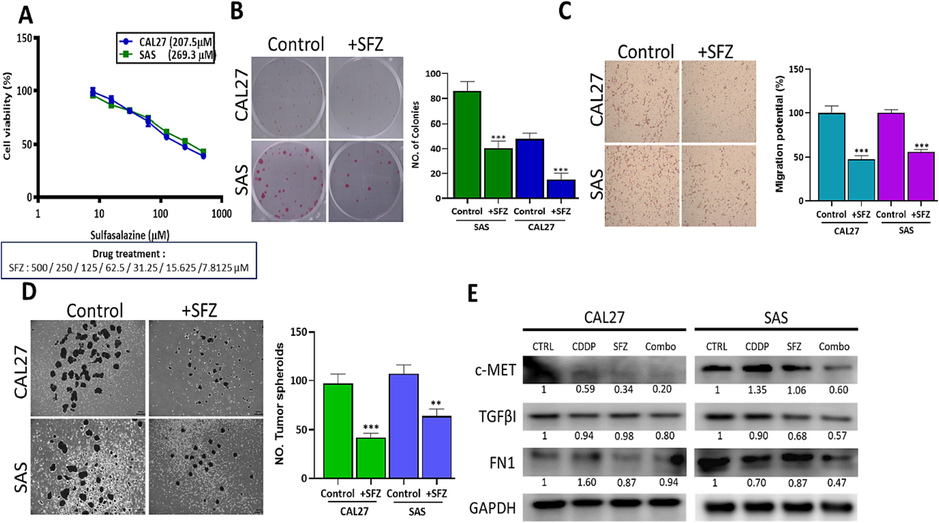
Sulfasalazine (SFZ) treatment suppressed HNSC tumorigenesis and stemness via downregulating c-Met/TGFBI /FN1 expression. (A) SFZ treatment dose-dependently reduced cell viability in CAL27 and SAS cells. SFZ treatment significantly reduced the colony-forming (B), migration (C), and tumorsphere-forming abilities (D) of CAL27 and SAS cells. Western blot analysis demonstrates that SFZ suppressed MET, TGFB1, and FN1 expression in CAL27 and SAS cells compared to their vehicle-treated counterparts (E). **p < 0.05, ***p < 0.01.
3.9 In vivo evaluation of sulfasalazine in overcoming cisplatin resistance in HNSC
Finally, we conducted in vivo validation of the in vitro findings using a xenograft mouse model of HNSC. Mice were subcutaneously injected with CDDP-resistant SAS tumoroids (SAS tumorspheres with CAFs, mimicking cisplatin resistance) and subsequently divided into different groups: vehicle control, SFZ (15 mg/Kg, 5 times/week ip injection), CDDP (1 mg/Kg, twice/week ip injection), and the combination treatment. We observed that tumor growth was significantly delayed in mice treated with SFZ compared to the control group. Adding SFZ resensitized the tumors to CDDP treatment and significantly reduced the combined treatment group's tumor burden (Fig. 10A, B). The average body weight did not significantly differ among the SFZ and combination treatment groups, while a slight decrease was observed in the cisplatin-only group (Fig. 10C). Tumor samples were then harvested to assess stemness using spheroid-forming assays. Consistent with expectations, the real-time PCR analysis of the harvested tumor cells showed a significantly reduced expression of MET, TGFB1, and FN1 in the combination and CDDP samples, as well as decreased expression of CAF markers, including α-SMA and vimentin, compared to the control and SFZ-only groups (Fig. 10D-E).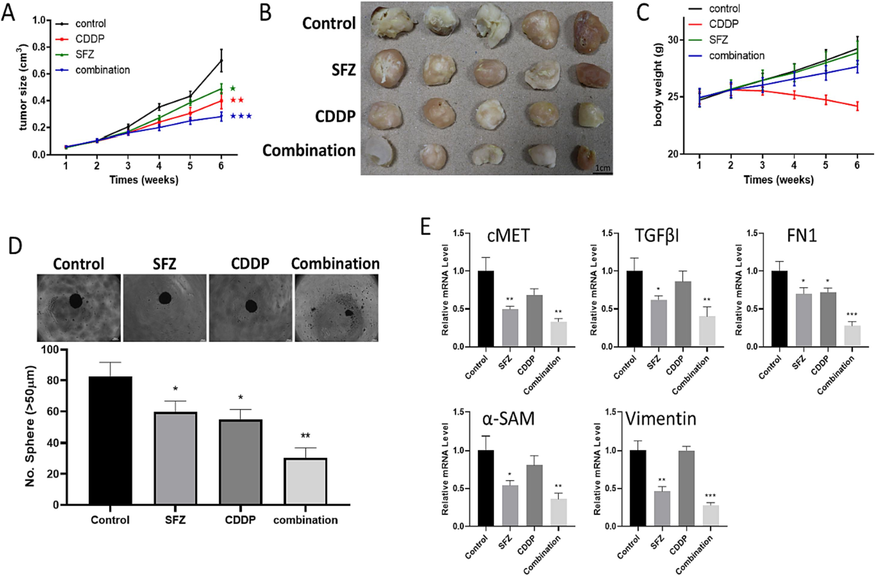
SFZ suppressed HNSC tumorigenesis and improved the in vivo efficacy of Cisplatin. (A, B) The tumor volume size over time. The average tumor weight shows that the combination of SFZ and CDDP treatments significantly delayed tumor growth and reduced tumor burden compared to SFZ treatment alone. (C) Changes in the body weight of mice were illustrated in a graph. (D) The spheroid forming ability was significantly reduced in tumor samples from the SFZ and cisplatin combination treatment group. (E) qPCR analysis demonstrated decreased expression levels of genes MET, TGFB1, and FN1 in the combination and CDDP samples and decreased expression of CAF markers, including α-SMA and vimentin, compared to the control and SFZ-only groups. Statistical significance is denoted by * (p < 0.05), ** (p < 0.01), *** (p < 0.001), and **** (p < 0.0001).
4 Discussion
In this study, we set out to identify therapeutic targets and drugs for treating drug-resistant HNSC. We took a bioinformatics approach and identified MET/FN1/TGFBI as a potential oncogenic signature associated with drug resistance and cancer stemness. We identified MET/FN1/TGFBI as a potential oncogenic signature contributing to cisplatin resistance in HNSC.
Tyrosine-protein kinase Met (c-Met) is the cell surface receptor and has been shown to promote different functions, including cell progression and metastasis when activated in several tumor types (Birchmeier et al., 2003). Interestingly, c-MET has been reported to exert a crucial role in regulating immunity through its ligand HGF, which modulates autoimmunity (Molnarfi et al., 2015). Moreover, low levels of c-MET were demonstrated to be expressed by CD8 + T cells, thus suggesting its role in tumor immunity (Freudlsperger et al., 2010; Benkhoucha et al., 2017). Recent reports have shown that MET activates Phosphoinositide 3-kinase (PI3K), an enzyme that regulates various cell functions, such as cell proliferation and progression in multiple cancers, including HNSC (Rogers et al., 2005; Gao et al., 2018; Simpson et al., 2015). Others have also shown that Met inhibitor (crizotinib) suppressed the expression of PI3K and attenuated proliferation and migration in HNSC cells (Gao et al., 2018). Zhou W. H et al. also demonstrated that PI3K/Akt signaling pathway activated by fibronectin 1 (FN1) promoted HNSC tumorigenesis (Zhou et al., 2022). FN1 is a member of the extracellular matrix (ECM) protein (Zhou et al., 2022; Zollinger and Smith, 2017; Pankov and Yamada, 2002; Lieverse et al., 2020; Efthymiou et al., 2020; Li et al., 2020; Wang et al., 2019; Li et al., 2019; Liu et al., 2020; Pao and Chmielecki, 2010; Williams, 2000; Qadir et al., 2019; Nan et al., 2021; Tang et al., 2022; Huang et al., 2022), and FN1 is overexpressed in malignant solid tumors such as HNSC and associated with distant metastasis (Kumra and Reinhardt, 2016; Lal et al., 1999). Also, FN1 promotes cancer stemness and metastasis by supporting tumor cells to escape from the primary site. (Malik et al., 2010; Shinde et al., 2018). These findings agreed with our bioinformatics results, where FN1 expression was significantly associated with the mesenchymal subtype of HNSC. Interestingly, the mesenchymal subtype is associated with poor survival in surgically resected, early-stage, node(-) oral cavity squamous cell carcinoma, which is often expected to have favorable outcomes (Mayhew et al., 2022). Solid tumors with the mesenchymal subtype are considered to be established from an active epithelial-to-mesenchymal transition (EMT) (Peng et al., 2019; Dongre and Weinberg, 2019; Foroutan et al., 2017). Additionally, tumor-infiltrating cancer-associated fibroblasts (CAFs) have been shown to express EMT genes, including FN1 and TGFB (Leung et al., 2022). TGFB is one of the prevalent canonical drivers of EMT; its dysregulation promotes cancer stem cells and metastasis (Chen et al., 2021; Muraoka-Cook et al., 2005).
Studies have shown that MET ad FN1 expression correlated with the clinicopathological parameters and the poor survival of HNSC patients (Freudlsperger et al., 2010). We also found that MET/FN1/TGFBI gene set expression was associated with high tumor burden in all tumor stages (I-IV), supporting this signature's importance in HNSC. More importantly, our findings revealed that elevated MET/FN1/TGFBI expression was associated with shorter overall survival in HNSC patients. To further analyze, we investigated the correlation between MET/FN1/TGFBI oncogenic and immune infiltrating cells in HNSC. Interestingly, RNA seq data from ImmuneCellAI revealed that MET/FN1/TGFBI oncogenes correlated with endothelial cells, CAFs, and macrophages, suggesting its additional role in shaping the immune tumor microenvironment. Based on our bioinformatics results and others, MET/FN1/TGFBI appeared to be an essential oncogenic signature to be targeted for therapy.
The current standard chemotherapeutic agent for HNSC is a platin-based regimen. Although effective initially, most patients exhibit resistance eventually. Hence, discovering alternative agents that can overcome cisplatin resistance was our goal. Here, we evaluated the anticancer activities of sulfasalazine (an FDA-approved drug for treating rheumatoid arthritis and inflammatory bowel diseases) to provide preclinical evidence for treating HNSC. Previous studies demonstrated the anticancer properties of sulfasalazine against several cancers, including GBM, lung cancer, and colon cancer (Robe et al., 2004; Lay et al., 2007; Leung et al., 2022), but its application in HNSC has not been fully appreciated. Herein, we performed in silico molecular docking and found that binding affinity results of sulfasalazine in complex with MET, FN1, and TGFBI were much higher, with Gibbs free energies (ΔG) of (- 8 0.7 kcal/mol, − 7.9 kcal/mol, and – 7.0 kcal/mol), respectively as compared with their standard inhibitors Crizotinib (MET: − 8.3 kcal/mol) and Galunisertib (TGFBI: − 7.0 kcal/mol). These findings, thus, suggest that sulfasalazine might be a potential inhibitor of MET/FN1/TGFBI signaling pathway in HNSC recurrence. In support, our data validated that sulfasalazine treatment reduced tumorigenic properties such as cell viability, migration, colony, and tumorsphere formation in the HNSC cell lines; more importantly sulfasalazine significantly reduced MET/FN1/TGFBI expression in HNSC tumoroids. Also, sulfasalazine resensitized HNSC cells to cisplatin and decreased expression of CAF markers, including α-SMA and vimentin, and suppressed the tumor burden in HNSC tumoroid-bearing xenograft model.
5 Conclusion
In summation, we identified the overexpression of MET/FN1/TGFBI oncogenic signatures in HNSC. We found that the upregulation of this signature promoted HNSC growth, migration, self-renewal ability, cisplatin resistance. Moreover, molecular docking of sulfasalazine in complex MET/FN1/TGFBI revealed high binding energies with shorter binding distances than their standard inhibitors. Our observations strongly suggested that sulfasalazine functioned as an suppressor of the MET/FN1/TGFBI signaling pathway in HNSC. Sulfasalazine served as a single agent or in combination with cisplatin to resensitize HNSC cells to cisplatin and reduced CAF transformation in preclinical models. Further investigation is warranted for sulfasalazine's transition into the clinical setting.
6 Authors' contributions
NM: Carried out the study and wrote the manuscript. A-TH W and JH C designed and oversaw the study. S-Y Ch, J-C L and T-A G, assisted in the analyses and manuscript writing. All authors agree to be accountable for all aspects of work, ensuring integrity and accuracy.
Funding sources
Alexander TH Wu is supported by the National Science and Technology Council, Taiwan (111-2314-B-038-098 and 111-2314-B-038-142). Sheng-Yao Cheng is funded by a research grant from Tri-service General Hospital (TSGH-D-112063). Jih-Chin Lee is funded by a Tri-Serive General Hospital grant (TSGH-D-112060) and the National Science and Technology Council, Taiwan (110-2314-B-016*044-MY3). Jia-Hong Chen is also supported by Tri-service General Hospital (TSGH-C01-112025).
Acknowledgments
We appreciate Mr. Po-Yang Huang's excellent technical support of the in vivo experiments.
Declaration of competing interest
The authors declare that they have no known competing financial interests or personal relationships that could have appeared to influence the work reported in this paper.
References
- Integration of biological knowledge and gene expression data for biomarker selection: FN1 as a potential predictor of radiation resistance in head and neck cancer. Cancer Biol. Ther.. 2010;10(12):1252-1255.
- [Google Scholar]
- Head and neck cancer in Cali, Colombia: Population-based study. Community Dent. Oral Epidemiol.. 2022;50(4):292-299.
- [Google Scholar]
- Inhibition of NF-kappaB sensitizes human pancreatic carcinoma cells to apoptosis induced by etoposide (VP16) or doxorubicin. Oncogene. 2001;20(7):859-868.
- [Google Scholar]
- Autocrine production of interleukin 1beta confers constitutive nuclear factor kappaB activity and chemoresistance in pancreatic carcinoma cell lines. Cancer Res.. 2002;62(3):910-916.
- [Google Scholar]
- Identification of a novel population of highly cytotoxic c-Met-expressing CD8(+) T lymphocytes. EMBO Rep.. 2017;18(9):1545-1558.
- [Google Scholar]
- Met, metastasis, motility and more. Nat. Rev. Mol. Cell. Biol.. 2003;4(12):915-925.
- [Google Scholar]
- Exercise and nutrition interventions in patients with head and neck cancer during curative treatment: A systematic review and meta-analysis. Nutrients. 2020;12(11)
- [Google Scholar]
- UALCAN: A portal for facilitating tumor subgroup gene expression and survival analyses. Neoplasia. 2017;19(8):649-658.
- [Google Scholar]
- A human genome map of comparative anchor tagged sequences. J. Hered.. 1999;90(4):477-484.
- [Google Scholar]
- A KDM4-DBC1-SIRT1 axis contributes to TGF-b induced mesenchymal transition of intestinal epithelial cells. Front. Cell. Dev. Biol.. 2021;9:697614
- [Google Scholar]
- Head and neck cancer and asbestos exposure. Occup. Environ. Med.. 2022;79(10):690-696.
- [Google Scholar]
- Epidemiology and demographics of the head and neck cancer population. Oral Maxillofac. Surg. Clin. North Am.. 2018;30(4):381-395.
- [Google Scholar]
- New insights into the mechanisms of epithelial-mesenchymal transition and implications for cancer. Nat. Rev. Mol. Cell. Biol.. 2019;20(2):69-84.
- [Google Scholar]
- Shaping up the tumor microenvironment with cellular fibronectin. Front. Oncol.. 2020;10:641.
- [Google Scholar]
- Global, regional, and national cancer incidence, mortality, years of life lost, years lived with disability, and disability-adjusted life-years for 32 cancer groups, 1990 to 2015: A systematic analysis for the global burden of disease study. JAMA Oncol.. 2017;3(4):524-548.
- [Google Scholar]
- A transcriptional program for detecting TGFβ-induced EMT in cancer. Mol. Cancer Res.. 2017;15(5):619-631.
- [Google Scholar]
- Prognostic value of c-Met expression in oral squamous cell carcinoma. Exp. Ther. Med.. 2010;1(1):69-72.
- [Google Scholar]
- Carcinoma associated fibroblasts derived from oral squamous cell carcinoma promote lymphangiogenesis via c-Met/PI3K/AKT in vitro. Oncol. Lett.. 2018;15(1):331-337.
- [Google Scholar]
- Epidemiological trends of head and neck cancer: A population-based study. Biomed. Res. Int.. 2021;2021:1738932.
- [Google Scholar]
- Overexpressed HGF promotes metastasis of squamous cell carcinoma of the head and neck through the PI3K/Akt and JNK signaling pathways. Future Oncol.. 2021;17(33):4527-4543.
- [Google Scholar]
- Hormone factors play a favorable role in female head and neck cancer risk. Cancer Med.. 2017;6(8):1998-2007.
- [Google Scholar]
- Head and neck cancer prevention: from primary prevention to impact of clinicians on reducing burden. Ann. Oncol.. 2019;30(5):744-756.
- [Google Scholar]
- The DAVID Gene Functional Classification Tool: a novel biological module-centric algorithm to functionally analyze large gene lists. Genome Biol.. 2007;8(9):R183.
- [Google Scholar]
- Novel prognostic matrisome-related gene signature of head and neck squamous cell carcinoma. Front. Cell. Dev. Biol.. 2022;10:884590
- [Google Scholar]
- Squamous cell carcinoma of head and neck: what internists should know. Korean J. Intern. Med.. 2020;35(5):1031-1044.
- [Google Scholar]
- Regulation of head and neck squamous cancer stem cells by PI3K and SOX2. J. Natl. Cancer Inst.. 2017;109(1)
- [Google Scholar]
- Identification of motifs for cell adhesion within the repeated domains of transforming growth factor-beta-induced gene, betaig-h3. J. Biol. Chem.. 2000;275(40):30907-30915.
- [Google Scholar]
- Current trends and future prospects of molecular targeted therapy in head and neck squamous cell carcinoma. Int. J. Mol. Sci.. 2020;22(1)
- [Google Scholar]
- Index of cancer-associated fibroblasts is superior to the epithelial-mesenchymal transition score in prognosis prediction. Cancers (Basel). 2020;12(7)
- [Google Scholar]
- Fibronectin-targeted drug delivery in cancer. Adv. Drug Deliv. Rev.. 2016;97:101-110.
- [Google Scholar]
- A public database for gene expression in human cancers. Cancer Res.. 1999;59(21):5403-5407.
- [Google Scholar]
- Identification of INFG/STAT1/NOTCH3 as γ-Mangostin's potential targets for overcoming doxorubicin resistance and reducing cancer-associated fibroblasts in triple-negative breast cancer. Biomed. Pharmacother.. 2023;163:114800
- [Google Scholar]
- Sulfasalazine suppresses drug resistance and invasiveness of lung adenocarcinoma cells expressing AXL. Cancer Res.. 2007;67(8):3878-3887.
- [Google Scholar]
- Preclinical identification of sulfasalazine's therapeutic potential for suppressing colorectal cancer stemness and metastasis through targeting KRAS/MMP7/CD44 signaling. Biomedicines. 2022;10(2)
- [Google Scholar]
- FN1, SPARC, and SERPINE1 are highly expressed and significantly related to a poor prognosis of gastric adenocarcinoma revealed by microarray and bioinformatics. Sci. Rep.. 2019;9(1):7827.
- [Google Scholar]
- Secreted Phosphoprotein 1 (SPP1) and Fibronectin 1 (FN1) are associated with progression and prognosis of esophageal cancer as identified by integrated expression profiles analysis. Med. Sci. Monit.. 2020;26:e920355.
- [Google Scholar]
- Human fibronectin extra domain B as a biomarker for targeted therapy in cancer. Mol. Oncol.. 2020;14(7):1555-1568.
- [Google Scholar]
- Regulation of FN1 degradation by the p62/SQSTM1-dependent autophagy-lysosome pathway in HNSCC. Int. J. Oral Sci.. 2020;12(1):34.
- [Google Scholar]
- GSCA: an integrated platform for gene set cancer analysis at genomic, pharmacogenomic and immunogenomic levels. Brief Bioinform.. 2023;24(1)
- [Google Scholar]
- Scatter factor receptor (c-Met) as possible prognostic factor in patients with oral squamous cell carcinoma. Anticancer Res.. 2004;24(2c):1063-1069.
- [Google Scholar]
- Plasma fibronectin promotes lung metastasis by contributions to fibrin clots and tumor cell invasion. Cancer Res.. 2010;70(11):4327-4334.
- [Google Scholar]
- Mesenchymal gene expression subtyping analysis for early-stage human papillomavirus-negative head and neck squamous cell carcinoma reveals prognostic and predictive applications. Front. Oncol.. 2022;12:954037
- [Google Scholar]
- Epidemiology of head and neck squamous cell carcinomas: impact on staging and prevention strategies. Curr. Treat. Options Oncol.. 2019;20(5):43.
- [Google Scholar]
- Network pharmacological analysis through a bioinformatics approach of novel NSC765600 and NSC765691 compounds as potential inhibitors of CCND1/CDK4/PLK1/CD44 in cancer types. Cancers (Basel). 2021;13(11)
- [Google Scholar]
- Hepatocyte growth factor: A regulator of inflammation and autoimmunity. Autoimmun Rev.. 2015;14(4):293-303.
- [Google Scholar]
- Usage of the NF-kappaB inhibitor sulfasalazine as sensitizing agent in combined chemotherapy of pancreatic cancer. Int. J. Cancer. 2003;104(4):469-476.
- [Google Scholar]
- Dual role of transforming growth factor beta in mammary tumorigenesis and metastatic progression. Clin. Cancer Res.. 2005;11(2 Pt 2):937s-s943.
- [Google Scholar]
- Comprehensive identification of potential crucial genes and miRNA-mRNA regulatory networks in papillary thyroid cancer. Biomed. Res. Int.. 2021;2021:6752141.
- [Google Scholar]
- Silver nanoparticles stimulates spermatogenesis impairments and hematological alterations in testis and epididymis of male rats. Molecules. 2020;25(5)
- [Google Scholar]
- Orellana, E.A. and A.L. Kasinski, Sulforhodamine B (SRB) Assay in Cell Culture to Investigate Cell Proliferation. Bio Protoc, 2016. 6(21).
- Rational, biologically based treatment of EGFR-mutant non-small-cell lung cancer. Nat. Rev. Cancer. 2010;10(11):760-774.
- [Google Scholar]
- FunRich: An open access standalone functional enrichment and interaction network analysis tool. Proteomics. 2015;15(15):2597-2601.
- [Google Scholar]
- EGFR-TKI resistance promotes immune escape in lung cancer via increased PD-L1 expression. Mol. Cancer. 2019;18(1):165.
- [Google Scholar]
- TGFBI secreted by tumor-associated macrophages promotes glioblastoma stem cell-driven tumor growth via integrin αvβ5-Src-Stat3 signaling. Theranostics. 2022;12(9):4221-4236.
- [Google Scholar]
- Swallowing disorders after treatment for head and neck cancer. Radiol. Oncol.. 2019;53(2):225-230.
- [Google Scholar]
- Clinical correlation of opposing molecular signatures in head and neck squamous cell carcinoma. BMC Cancer. 2019;19(1):830.
- [Google Scholar]
- In vitro and in vivo activity of the nuclear factor-kappaB inhibitor sulfasalazine in human glioblastomas. Clin. Cancer Res.. 2004;10(16):5595-5603.
- [Google Scholar]
- The phosphoinositide 3-kinase signalling pathway as a therapeutic target in squamous cell carcinoma of the head and neck. Expert Opin. Ther. Targets. 2005;9(4):769-790.
- [Google Scholar]
- TISIDB: an integrated repository portal for tumor-immune system interactions. Bioinformatics. 2019;35(20):4200-4202.
- [Google Scholar]
- Autocrine fibronectin inhibits breast cancer metastasis. Mol. Cancer Res.. 2018;16(10):1579-1589.
- [Google Scholar]
- Targeting the PI3K/AKT/mTOR pathway in squamous cell carcinoma of the head and neck. Oral Oncol.. 2015;51(4):291-298.
- [Google Scholar]
- FN1 promotes prognosis and radioresistance in head and neck squamous cell carcinoma: From radioresistant HNSCC cell line to integrated bioinformatics methods. Front. Genet.. 2022;13:1017762.
- [Google Scholar]
- TGFBIp/betaig-h3 protein: a versatile matrix molecule induced by TGF-beta. Int. J. Biochem. Cell. Biol.. 2007;39(12):2183-2194.
- [Google Scholar]
- AutoDock Vina: improving the speed and accuracy of docking with a new scoring function, efficient optimization, and multithreading. J. Comput. Chem.. 2010;31(2):455-461.
- [Google Scholar]
- Role of HGF/c-met system in invasion and metastasis of oral squamous cell carcinoma cells in vitro and its clinical significance. Int. J. Cancer. 2001;93(4):489-496.
- [Google Scholar]
- Vermorken, J.B. and P. Specenier, Optimal treatment for recurrent/metastatic head and neck cancer. Ann Oncol, 2010. 21 Suppl 7: p. vii252-61.
- Sulforhodamine B colorimetric assay for cytotoxicity screening. Nat. Protoc.. 2006;1(3):1112-1116.
- [Google Scholar]
- STRING: a database of predicted functional associations between proteins. Nucleic Acids Res.. 2003;31(1):258-261.
- [Google Scholar]
- Sulfasalazine: a potent and specific inhibitor of nuclear factor kappa B. J. Clin. Invest.. 1998;101(5):1163-1174.
- [Google Scholar]
- MicroRNA-432 is downregulated in cervical cancer and directly targets FN1 to inhibit cell proliferation and invasion. Oncol. Lett.. 2019;18(2):1475-1482.
- [Google Scholar]
- Wang, S., et al., A Review on Curability of Cancers: More Efforts for Novel Therapeutic Options Are Needed. Cancers (Basel), 2019. 11(11).
- Suppression of NF-kappaB activity by sulfasalazine is mediated by direct inhibition of IkappaB kinases alpha and beta. Gastroenterology. 2000;119(5):1209-1218.
- [Google Scholar]
- Molecular pathogenesis of oral squamous carcinoma. Mol. Pathol.. 2000;53(4):165-172.
- [Google Scholar]
- Ovatodiolide, isolated from Anisomeles indica, suppresses bladder carcinogenesis through suppression of mTOR/β-catenin/CDK6 and exosomal miR-21 derived from M2 tumor-associated macrophages. Toxicol. Appl. Pharmacol.. 2020;401:115109
- [Google Scholar]
- Yan, F., et al., The Evolution of Care of Cancers of the Head and Neck Region: State of the Science in 2020. Cancers (Basel), 2020. 12(6).
- The overexpression of Fibronectin 1 promotes cancer progression and associated with M2 macrophages polarization in head and neck squamous cell carcinoma patients. Int. J. Gen. Med.. 2022;15:5027-5042.
- [Google Scholar]


