

Translate this page into:
In-situ electrochemical study of chalcopyrite pressure oxidation leaching from 110 °C to 150 °C under saturated vapor pressure
⁎Corresponding authors. wangwei@smm.neu.edu.cn (Wei Wang), xief@smm.neu.edu.cn (Feng Xie)
-
Received: ,
Accepted: ,
This article was originally published by Elsevier and was migrated to Scientific Scholar after the change of Publisher.
Peer review under responsibility of King Saud University.
Abstract
Pressure oxidation leaching behavior of chalcopyrite in sulfuric acid solution from 110 °C to 150 °C were investigated by in-situ electrochemical methods. Leaching experiments under saturated vapor pressure conditions were used to simulate the anoxic environment that may be encountered in industrial applications. Scanning electron microscope and X-ray photoelectron spectroscopy were used to characterize the morphology and the chemical status of chalcopyrite surface. Results show that the copper extraction was increased with the increase of leaching temperature. Under the optimal leaching conditions under saturated vapor pressure, the copper and iron extraction are 8.3% and 29.8%, respectively. When the temperature increased from 110 °C to 150 °C, the self-corrosion potential and electrochemical reaction resistance firstly increased and then decreased. In contrast, the resistance of the passive film was always increased with the increase of temperature. The electrochemical study results indicated that the increase in temperature affected the oxidation of chalcopyrite by altering the kinetics of the cathodic reaction and the anodic passivation. Both the self-corrosion current density (icorr) and rate constant were affected by the reduction of Fe(III). The XPS results show that elemental sulfur and H3O(Fe3(SO4)2(OH)6) were the main leaching solid products. The formation of H3O(Fe3(SO4)2(OH)6) not only caused a decrease in cathodic reaction kinetics, but also increased the resistance of mass transfer process. Due to the faster release of iron, copper-rich sulphides were formed, which mixed with the elemental sulfur and/or H3O(Fe3(SO4)2(OH)6) led to coverage of the chalcopyrite surface.
Keywords
Chalcopyrite
Pressure oxidation
Leaching
Passivation
Electrochemistry

1 Introduction
As one of the most refractory and abundant minerals, chalcopyrite accounts for 70% of the world’s copper-bearing reserves (Ahn et al., 2021; Olubambi and Potgieter, 2009). At present, copper extraction from chalcopyrite is mainly achieved by conventional pyrometallurgical technology. These pyrometallurgical processes have their advantages, but they are hard to treat the low-grade ores and avoid the emission of harmful SO2 (Córdoba et al., 2008). In contrast, hydrometallurgical extraction of copper from chalcopyrite has been considered to be a promising alternative due to its environmental friendliness and high efficiency, especially when the amount of rich copper ores is constantly decreasing (Ruiz et al., 2014).
Extensive studies, mainly focused in sulfuric acid media and hydrochloric acid media, have suggested that the leaching kinetics is unsatisfactory due to the refractory of chalcopyrite and the formation of passive layer(s) (Córdoba et al., 2009; Hackl et al., 1995; Xian et al., 2013). Extensive debates stills exist in the surface passive layer formation mechanism. Element sulfur (Bai et al., 2021; Dutrizac, 1989), polysulfide (Hackl et al., 1995), and iron hydroxy-oxide (Buckley and Woods, 1984; Stott et al., 2000) have all been proposed as the main components of the passive layer with different leaching mechanisms, based on the products detected on chalcopyrite surfaces. Methods such as bio-oxidation (Stott et al., 2000), oxidant-oxidation (Carrillo-Pedroza et al., 2010; Tomas and Milan 1990; Wu et al., 2020) and pre-treatment (Bafghi et al., 2013; Baláž and Achimovičová, 2006) have been proposed to improve the leaching kinetics of chalcopyrite. Despite of preliminary success achieved through these methods, the leaching efficiency was still unsatisfactory. The copper extraction of only 5% could be achieved in sulfuric acid solution (Bai et al., 2021). The activation energy for leaching of chalcopyrite with hydrogen peroxide was 19.6 kJ/mol, indicating the diffusion control of surface layer (PetroviĆ et al., 2018). To date, the treatment of chalcopyrite hydrometallurgical techniques under atmospheric conditions has not been successfully applied on an industrial scale due to the extremely slow leaching kinetics (Koleini et al., 2010). Hence, there is a need to develop an effective and promising strategy for chalcopyrite leaching and to better understand the leaching mechanism.
Pressure-oxidation leaching of chalcopyrite was widely studied due to faster leaching kinetics compared to atmospheric-oxidation leaching. Previous studies have shown that pressure-oxidation leaching of chalcopyrite has great potential to commercialize (Mojtahedi et al., 2020). Yu et al. investigated the dissolution of chalcopyrite in sulfuric acid solution from 125 to 175 °C at the oxygen pressure range of 0.52–2.76 MPa, and they pointed out that the main products were sulfate together with slightly elemental sulfur (Yu et al., 1973). Vizsolyi et al. studied leaching residue, and they suggested that elemental sulfur and hydrolyzed iron were major products of chalcopyrite dissolution in sulfuric solution at 110 °C (Vizsolyi et al., 1967). Previous studies were mainly focused on pressure leaching mechanism by conventional leaching tests and ex-situ spectroscopic methods. To our knowledge, only few studies were available on the pressure leaching mechanism of chalcopyrite using in-situ electrochemical methods. There is a growing need to develop in-situ research techniques to study the solid–liquid interface during chalcopyrite leaching processes. Oxygen partial pressure plays an important role in the oxidation of chalcopyrite. Consequently, the dissolved oxidant in the solution would have a great impact on the leaching kinetics of chalcopyrite. Given the iron content of chalcopyrite, it is expected that the produced redox pair Fe(III)/Fe(II) would have a significant effect on the dissolution of chalcopyrite.
The purpose of this investigation was to understand the pressure oxidation mechanism from the perspective of electrochemistry by using in-situ electrochemical methods. Leaching experiments were performed in sulfuric acid solution in the temperature range of 110 °C to 150 °C, which was used to simulate the anoxic environment that may be encountered in industrial applications. The influence of temperature and applied potential on chalcopyrite dissolution behavior was studied by in-situ electrochemical characterizations, including cyclic voltammetry (CV), open circuit potential (OCP), chronoamperometry, potentiodynamic polarization, and electrochemical impedance spectroscopy (EIS). Scanning electron microscope (SEM) and X-ray photoelectron spectroscopy (XPS) were applied to study the microstructure and chemical status of chalcopyrite surface.
2 Experimental
2.1 Materials
The chalcopyrite used in this study was natural ore from a mine in Guangxi, China. The elemental composition of raw materials was determined by chemical titration method, showing 32.60 wt% of Cu, 36.60 wt% of S, and 22.63 wt% of Fe. The chalcopyrite used for leaching experiments was broken by a jaw crusher and its size fraction was no>75 μm. All the solutions used in this study were made of distilled water and analytical reagent. The phase composition was determined by the X-ray diffraction (XRD) analysis, as shown in Fig. 1, suggesting the ore was composed with a well-crystallized chalcopyrite.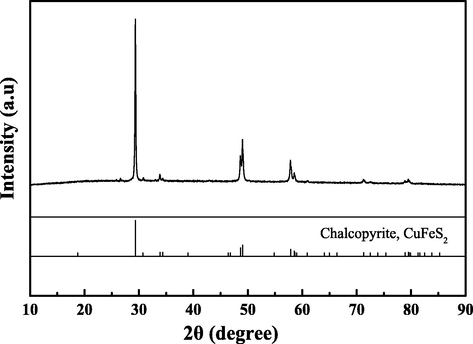
X-ray diffraction analysis of chalcopyrite ore.
2.2 Experiments
The experimental studies were performed in two parallel steps, the leaching, and the electrochemical steps.
2.2.1 Leaching experiments
The leaching experiments were carried out in an autoclave with a controlling pressure accessory with an inert gas (Nitrogen), and the diagram of autoclave was shown in Fig. 2(a). The autoclave containing 500 mL of 1.0 mol/L sulfuric acid solution with mechanical agitation at the speed of 550 rpm. For each leaching experiment, 5g of chalcopyrite was leached at the target temperature. At the end of the leaching experiment, the leaching system was rapidly cooled in air, and the obtained slurry was immediately filtered to obtain the pregnant leaching solution and the leaching residue. The copper concentrations and iron concentrations of the pregnant leaching solution were determined by an atomic absorption spectrophotometer (AA240FS, Agilent Technologies Inc, Santa Clara, CA, USA).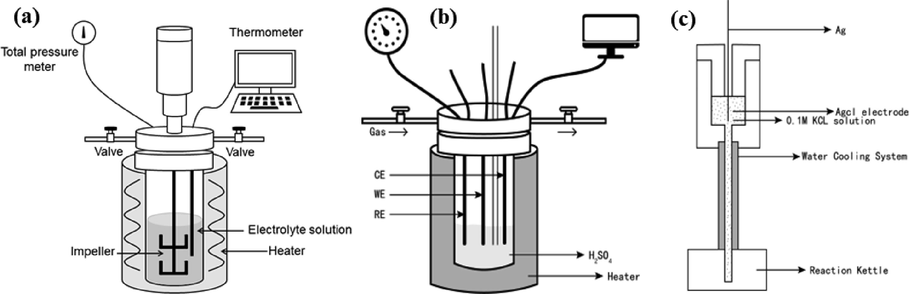
The diagram of (a) autoclave and (b) electrochemical experiment system, and the schematic illustration of (c) external pressure balanced
electrode.
2.2.2 Electrochemical experiments
The electrochemical experiments were carried out in an autoclave equipped with three electrodes system, as shown in Fig. 2. The experiments were performed by an electrochemical workstation (VersaSTAT. 4) which controlled by versastudio software. The working electrode (WE) was prepared by sealing the bulk chalcopyrite in synthetic resin, leaving only one face with a geometry area of 1 cm2 to contact with the leaching solution. SEM-EDS analysis confirmed that the composition of work electrode surface was uniform. A platinum wire was used as the counter electrode (CE) and an external pressure balanced Ag/AgCl electrode (Cui et al., 2018; Macdonald et al., 1979) was used as the reference electrode (RE). For each electrochemical test, the electrolyte of reference electrode was refreshed and the reproducibility was ensured by a standard Ag/AgCl electrode. All potentials used in this study was converted to the saturated hydrogen electrodes (25 °C) according to the following relationship (Cui et al., 2018; Macdonald et al., 1979):
To avoid the formation of secondary minerals during the heating processes, only half of the electrolyte was pumped into the autoclave to avoid the contact of the working electrode and the electrolyte. When the system was heated to the required temperature, the remained electrolyte was pumped into the autoclave by a pressure pump. The OCP measurements were carried out for 1800 s to ensure that a quasi-steady state was achieved between the working electrode and the electrolyte before potentiodynamic tests. Potentiodynamic tests were carried out by changing the potential at a potential sweep rate of 1 mV/s. The CV tests scanned forward direction from OCP to 1100 mV at a potential sweep rate of 10 mV/s. The potentiostatic polarization measurements were carried out in range of 411 mV-714 mV at 130 °C. The EIS tests were performed with the frequency in a range of 50 kHz-0.01 Hz at open circuit potential, and potentiostatic measurements were carried out at 411 mV, 554 mV, and 714 mV at 130 °C.
3 Results and discussion
3.1 Effect of temperature on copper extraction and iron extraction
It is well known that oxygen partial pressure plays an important role in the pressure oxidation of chalcopyrite (Han et al., 2017; Mcdonald and Muir, 2007). As consequence, the available dissolved oxygen in the solution would have a great impact on the leaching kinetics of chalcopyrite. The results from previous thermodynamic analysis on chalcopyrite dissolution mechanisms suggested that non-oxidative dissolution was also a possible dissolution route for chalcopyrite leaching (Lu et al., 2016). Given the iron content of chalcopyrite, it is expected that the produced redox pair Fe(III)/Fe(II) would play an important role in the dissolution process (Gui et al., 2021).
To investigate leaching kinetics of chalcopyrite and simulate the anoxic environment that may be encountered in industrial applications, tests were carried out at different temperatures of 110 °C, 120 °C, 130 °C, 140 °C and 150 °C with saturated vapor pressure, and the leaching results are shown in Fig. 3. As seen in Fig. 3(a-b), the copper extraction and iron extraction increased with the elongation of leaching time at the first 40 min and then kept nearly stable after that. When the leaching temperature was 110 °C, a final copper extraction of 4.5% was achieved, while the final iron extraction was close to 16.4%. Increasing the temperature from 110 °C to 150 °C had a positive effect on copper extraction, and a final copper extraction of 8.3% could be obtained at 150 °C. The obtained results show that the extraction of iron was always higher than that of copper, which suggests the preferential release of iron. The results from previous studies on oxidation of chalcopyrite suggested that the dissolution of chalcopyrite tended to form intermediate (e.g. Cu1-xS, Cu5FeS4 and Cu1-xFe1-yS2) (Han et al., 2017; Lu et al., 2016). The iron extraction was decreased from 29.8% to 17.5% when the leaching temperature increased from 130 °C to 150 °C. Fig. 2(c) shows the effect of temperature and solution pH on the precipitation and stability of various iron precipitates from ferric sulphate solutions (Claassena et al., 2002). As seen in Fig. 3(c), ferric iron maintains its solubility only at a low pH and temperature. The stability of H3O(Fe3(SO4)2(OH)6) increased with the increase of temperature at the study solution pH. In other words, H3O(Fe3(SO4)2(OH)6) was the predominant iron precipitate at the temperature of 150 °C, and the formation of it decreased the iron concentration in the electrolyte.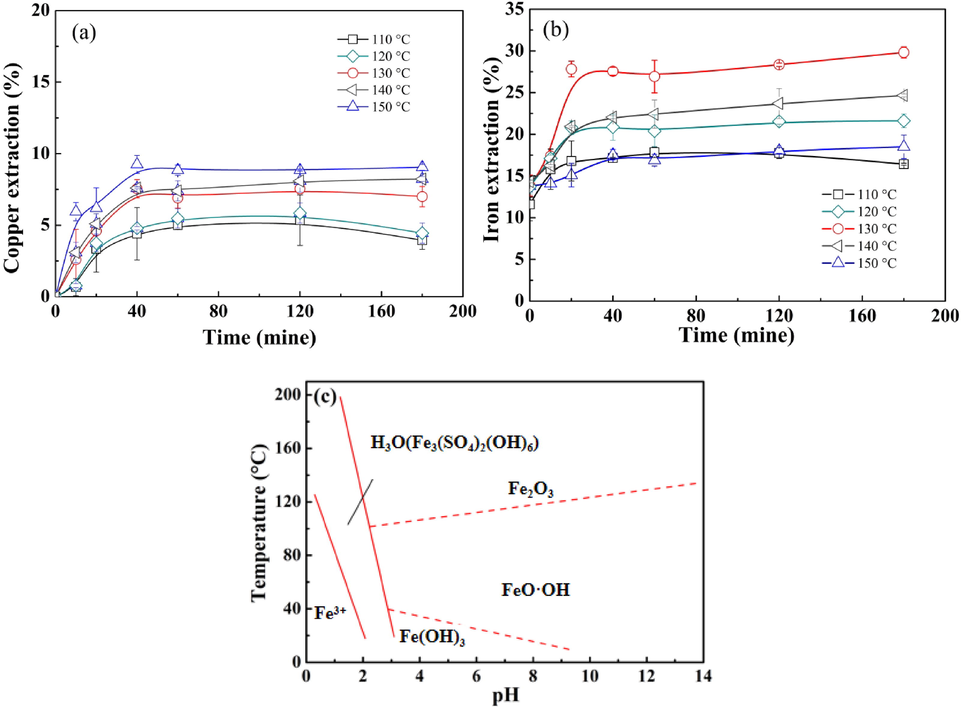
Effect of temperature on (a) copper extraction and (b) iron extraction (H2SO4 concentration: 1.0 mol/L, stirring speed: 550 rpm); (c) the effect of temperature and solution pH on the precipitation and stability of various iron precipitates from ferric sulphate solutions.
3.2 Electrochemical studies of chalcopyrite pressure leaching
3.2.1 Cyclic voltammetry study
Cyclic voltammetry (CV) was used to study the pressure leaching mechanism of chalcopyrite. CV measurements were carried out in 1.0 mol/L sulfuric acid solution at 130 °C, and three cycles between −180 mV and 1100 mV were obtained by sweeping the electrode potential from OCP to 1100 mV at a potential sweep rate of 10 mV/s. Fig. 4 shows the multi-cyclic voltammogram of the chalcopyrite electrode. Three anodic peaks (A1, A2 and A3) and two cathodic peaks (C1 and C2) were observed. According to previous studies, those peaks A1 at the potential of 600 mV were related to the formation of the Cu1-xFe1-yS2 (y > x) surface layer via Reactions (2) (Hackl et al., 1995; Liu et al., 2017). As the potential further increased, as shown in Reaction (3), the previous formed surface layer Cu1-xFe1-yS2 (y > x) transformed to Cu1-x-zS2 (peak A2) (Liu et al., 2017). When the applied potential was further increased from 900 mV to 1100 mV, the dramatically increasing of anodic current density suggests that chalcopyrite was entered an active dissolution status (peak A3) at this potential region (Ghahremaninezhad et al., 2013; Yin et al., 1995). Peak A3 was completely disappeared in the following cycles, suggesting the passivated state of electrode after the first cycle. The disappearance of peak A3 is consistent with the results reported by Ghahremaninezhad et al. (Ghahremaninezhad et al., 2013), which suggested that the accumulation of leaching product led to coverage of the chalcopyrite surface, and the dissolution process was controlled by mass transfer through the surface layer. Two reduction peaks between −180 mV and 0 mV (C1: 0 mV and C2: −100 mV) were observed during inverse scanning. Cui et al. demonstrated that the most probable reaction of peak C1 was the reduction of H+ according to Reaction (4) (Cui et al., 2018). The C2 peak may the related to the reduction of the products produced during the cathodic excursion.

CV for the chalcopyrite electrode in 1.0 mol/L sulfuric acid at a scanning rate of 10 mV/s.
3.2.2 Open circuit potential and potentiodynamic study
In order to investigate the effect of temperature on the electrochemical oxidation behavior of chalcopyrite, open circuit potential (OCP) tests were carried out at the same conditions as the leaching experiment, and the results are shown in Fig. 5(a).The OCP values were affected by the leaching temperature, and the steady state OCP were approximately 218 mV, 305 mV and 258 mV, respectively.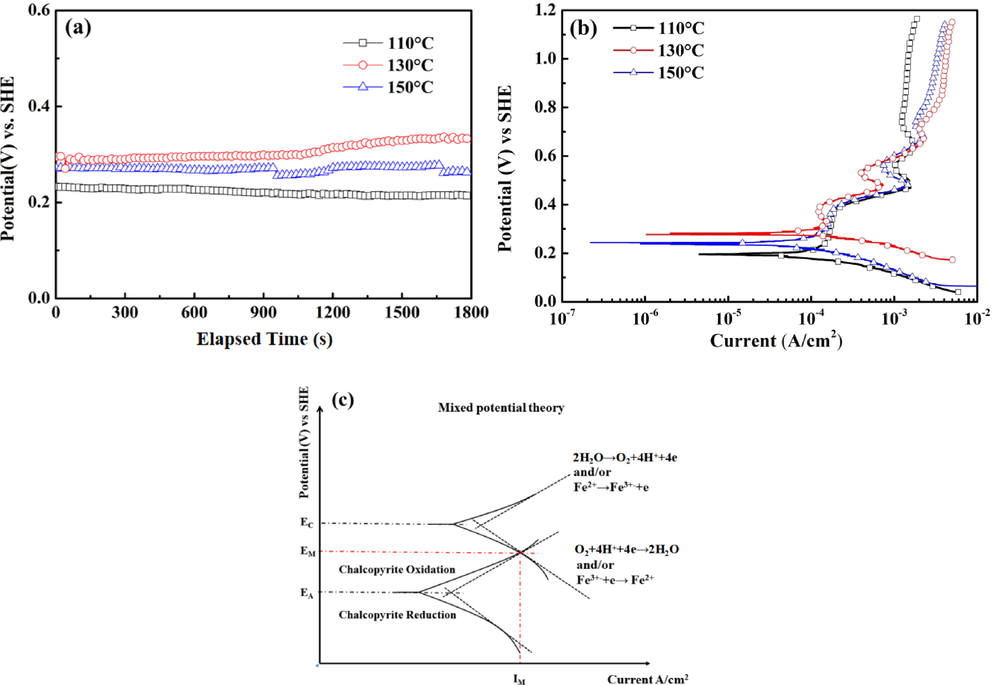
Time-potential relationships (a) and potentiodynamic curves (b) of chalcopyrite electrodes at 130 °C, and (c) the mixed potential theory.
Fig. 5(b) shows the potentiodynamic curves of the chalcopyrite at different temperature. The potentiodynamic curves obtained had a similar E-i profile, suggesting the similar initial properties electrochemical reactions of electrode surfaces in the temperature range of 110 °C to 150 °C at different applied potential. The anodic current density increased rapidly as the potential swept from OCP to 270 mV, which might be caused by the oxidation leaching of chalcopyrite, as shown in Reaction (5) (Dutrizac, 1990; Kartal et al., 2020). When the potential was swept from 270 mV to 400 mV, a distinct passive region was observed on the potentiodynamic curve. The distinct passive region can be attributed to the coverage of surface layer elemental sulfur (S0). As the anodic potential reached 440 mV, the anodic current density once again increased with increasing potential, which is mainly resulted from the oxidation of elemental sulfur (S0) at high potentials, as described in Reaction (6) (Cui et al., 2018; Holmes and Crundwell, 2000).
Anode current density again decreased when the potential increased from 490 mV to 540 mV, which is in good agreement with CV results (peak A1 and A2). Reaction (2) and Reaction (3) were used to describe those electrochemical processes (Hackl et al., 1995; Liu et al., 2017). As the potential increased further to 600 mV, a trans-passive dissolution occurred and the surface layer surface layer Cu1-x-zS2 dissolved via Reaction (7) and electrode entered an active region. Although the elemental sulfur can be oxidized to sulfate at high potentials, the slightly elemental sulfur was detected by XPS experiments (Hackl et al., 1995; Lazaro and Nicol, 2006). As the anodic potential increased above 630 mV, the anode current density decreased with the increase of potential, suggesting that another passive layer was formed on electrode surface. The formation of this passive layer not only caused a decrease in anode current density, but also increased the resistance of mass transfer process.
From Fig. 5(b), it is evident that the passivation potential range was narrowed with the increase of temperature. Due to the passivation of chalcopyrite, the self-corrosion current (icorr) was calculated by extrapolating the cathodic linear Tafel line, and results are shown in Table 1. The self-corrosion current (icorr) first increased and then decreased. Given the iron extraction results in Fig. 2(b), the reduction of Fe(III) would affect the exchange current density and rate constant (Yue and Asselin, 2014). The effect of temperature on the self-corrosion current (icorr) and OCP was illustrated by the mixed potential theory, which was shown in Fig. 5(c). The results shown in Table 1 reveal that the cathode Tafel slope decreased from 0.081 V/decade to 0.069 V/decade, which was results from the increased concentration of Fe(III) and/or the formation of passive layer. The self-corrosion current (icorr), which is corresponding to chalcopyrite dissolution rate, was increased from 1.36 × 10⁻⁴ A/cm2 to 1.79 × 10⁻⁴ A/cm2 resulted from the improvement of cathodic reaction kinetics, indicating that increasing temperature in range of 110–130 °C promoted the leaching of chalcopyrite. When the temperature increased to 150 °C, the formation of H3O(Fe3(SO4)2(OH)6) decreased the Fe(III) concentration and the cathodic reaction kinetics. The cathode Tafel slope was increased from 0.069 V/decade to 0.110 V/decade and the self-corrosion current (icorr) decreased to 1.69 × 10⁻⁴ A/cm2.
Temperature (°C)
Tafel Slope (V/decade)
measured mixed potential
EM (mV)
iM (A/cm2)
110
130
1500.081
0.069
0.110218
305
2581.36 × 10−4
1.79 × 10⁻⁴
1.69 × 10⁻⁴
3.2.3 Electrochemical impedance spectroscopy study
To further determine the effect of temperature on the leaching mechanism of chalcopyrite, EIS measurements were carried out at different temperatures in 1.0 mol/L sulfuric acid solution at OCP condition, and the Nyquist plots and Bode plots are shown in Fig. 6. The obtained results show a similar result to that reported under atmospheric conditions, which suggested that an electrochemical process would be caused by the accumulation of passive layer. Due to the passivation observed on the potentiodynamic curves, two electrochemical processes were existed during the dissolution processes of chalcopyrite and it is reasonable to choose the electrical equivalent circuit Rs(Q1(R1(Q2R2))) to study the mechanisms (Asselin et al., 2007; Cui et al., 2018). The time constant located at high frequency can be associated with the mass transfer resistance caused by passive layer, while the low-frequency semicircle was attributed to the electrode electrochemical reaction.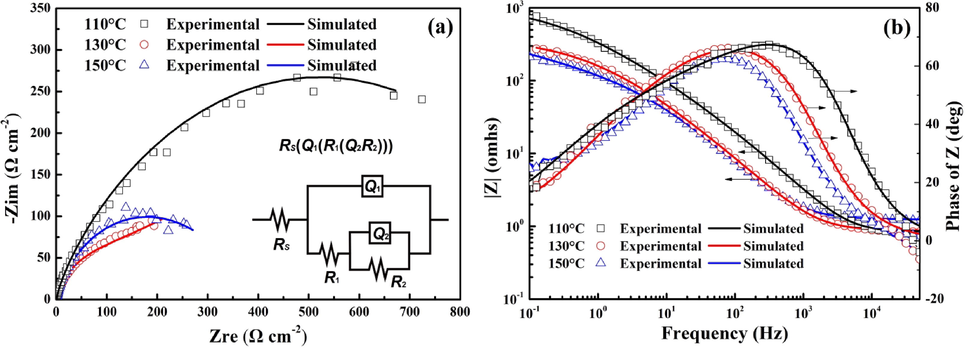
Nyquist plots (a) and Bode plots (b) of chalcopyrite at different temperature (H2SO4 concentration: 1.0 mol/L, saturated vapor pressure).
The corresponding electrical equivalent circuit is shown in Fig. 6(a). Rs is used to represent the resistance of the solution, and R1 and R2 are corresponded to the resistance of the passive film and electrode electrochemical reaction resistance, respectively. Table 2 shows the values of these parameters. As seen in Table 2, the value of R2 decreased from 4.26 × 10⁵ to 3.95 × 10² Ω cm2 when the temperature increased from 110 °C to 130 °C, suggesting the increase in chalcopyrite oxidation rate. When the temperature increased from 130 °C to 150 °C, the value of R2 increased from 3.95 × 10² Ω cm2 to 1.46 × 10³ Ω cm2, which can be related to the decrease in Fe(III) concentration and the enrichment of H3O(Fe3(SO4)2(OH)6). The value of R1 increased with the increase in temperature, which might be caused by the formation of porous elemental sulfur layer. When the temperature increased from 110 °C to 130 °C, the high viscosity and poor mobility of the liquid elemental sulfur led to the value of R1 increased from 1.08 × 10² Ω cm2 to 2.98 × 10³ Ω cm2. As the temperature increased further to 150 °C, the formation of H3O(Fe3(SO4)2(OH)6) resulted in the further increasement of R1 from 2.98 × 10³ Ω cm2 to 4.46 × 10³ Ω cm2.
Temperature(°C)
Electrochemical element
Rs (Ω cm2)
Y0.1
n1
R1 (Ω cm2)
Y0.2
n2
R2(Ω cm2)
110
1.23
4.64 × 10⁻³
0.64
1.08 × 10²
4.61 × 10⁻⁴
0.87
4.26 × 10⁵
130
0.87
2.69 × 10⁻⁴
0.91
2.98 × 10³
1.36 × 10⁻³
0.50
3.95 × 10²
150
0.85
4.20 × 10⁻⁵
0.99
4.46 × 10³
7.81 × 10⁻⁴
0.56
1.46 × 10³
3.2.4 Potentiodynamic polarization study
The passive layer had a significant influence on the leaching kinetic of chalcopyrite (Dutrizac, 1990; Mojtahedi et al., 2020; Vizsolyi et al., 1967). To determine the properties and stability of passive layers formed at different applied potentials, potentiostatic measurements were carried out at 411 mV, 554 mV, and 714 mV at 130 °C, as shown in Fig. 7(a). In the initial polarization stage, the current density decreased with time, which is caused by the formation of passive layers. With the elongation of the polarization time, a sudden increment of the current density was observed due to the breakdown of the passive layers. However, the stability of the passive layers decreased with the increase of the applied potential, and stability time is 1800, 900, and 500 s at 411 mV, 554 mV, and 714 mV, respectively. The final polarization current density at 554 mV and 714 mV is closed to each other, suggesting the surface chemical status of chalcopyrite after polarization at 554 mV and 714 mV for 3600 s might be similar. Meanwhile, a two stage breakdown of the passive film formed at 411 mV was observed, which might be caused by the transfer of chalcopyrite to Cu1-xFe1-yS2 (y > x) and then to Cu1-x-zS2. It can be concluded that passive layers were formed in the potential range of 411 mV to 714 mV, however, the stability of the passive layers dramatically decreased with the increase of applied potential.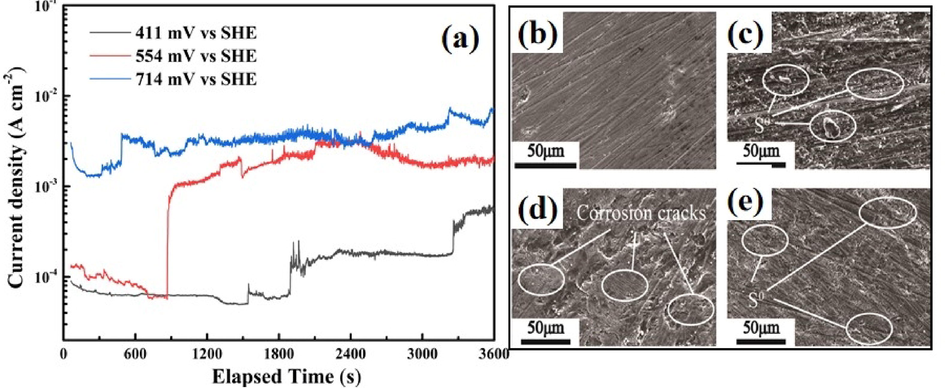
(a) Potentiostatic polarization of chalcopyrite electrode at 411 mV, 554 mV and 714 mV for 3600 s at 130 °C; and scanning electron microscope images of the surface of (b) chalcopyrite electrode, (c) obtained at 411 mV, (d) obtained at 554 mV and (e) obtained at 714 mV for 3600 s.
The morphology of the chalcopyritesurface after potentiostatic tests polarization was studied by the scanning electron microscope, as shown in Fig. 7(b-e). The inhomogeneous distribution of small particles around the active sites was found, which may be related to the formation of elemental sulfur or H3O(Fe3(SO4)2(OH)6). Corrosion cracks were observed on the surface of samples obtained at higher potentials and an increase in the applied potential also led to an increase in the number of corrosion cracks.
3.3 XPS study
As a useful surface study method, XPS was widely used to study the surface chemical states for different metals and ores (Ghahremaninezhad et al., 2013; Kumar et al., 2020; Wu et al., 2018), however, little has been published on chalcopyrite surface chemical states at different potentials during the pressure oxidation process. In order to determine the chemical compositions of passive layer and the surface elemental valence states under the pressure-oxidation conditions, the chalcopyrite electrodes after potentiostatic polarization were used for XPS analysis. Fig. 8(a) shows the high resolution XPS spectra of Cu 2p. As shown in Fig. 8(a), a doublet at about 932.0 eV and 952.6 eV was observed, which can be attributed to Cu 2p3/2 and Cu 2p1/2 orbits of cuprous species, respectively (Bai et al., 2021; Ghahremaninezhad et al., 2013). Based on the suggested binding energies for Cu 2p3/2 of Cu2O (932.8 eV), CuS (932.0 eV) and Cu2S (932.6 eV) (Hirajima et al., 2017; Ghahremaninezhad et al., 2013), the most possible cuprous compound on these samples surfaces would be Cu(I)-S.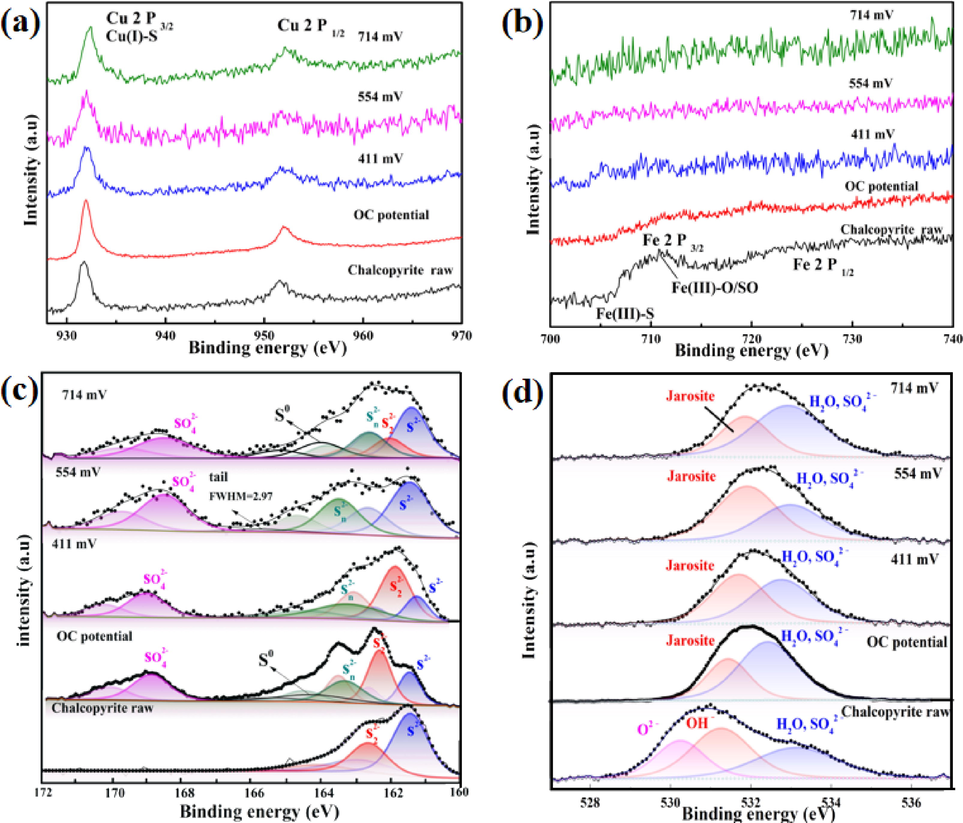
XPS spectrums of (a) Cu 2p, (b) Fe 2p, (c) S 2p and (d) O 1 s of chalcopyrite obtained after potentiostatic polarization for 3600 s at different potentials in 1.0 mol/L sulfuric acid at 130 °C.
Fig. 8(b) shows the Fe 2p spectra of chalcopyrite electrodes after polarized at different potentials. Two peaks at the binding energy of 708.7 eV and 721.3 eV can be related to the Fe atoms in raw structure (Hackl et al., 1995). The iron species detected on the surface of chalcopyrite raw ore were Fe(III)-O/OH and iron sulfide species. For the samples after polarization, both Fe 2p3/2 peak and Fe 2p1/2 peak were absence on the surface of electrode. This is mainly because of the faster depletion rate of iron atoms and the formation of copper-rich sulfide (Mojtahedi et al., 2020).
Fig. 8(c) shows the high resolution XPS spectra of S 2p. The S 2p3/2 peak with binding energy of 161.1 eV was attributed to monosulfide (S2-) (Buckley and Woods, 1984; Harmer et al., 2006; Klauber et al., 2001). The S 2p3/2 peak located at the binding energy of 162.2 eV can be related to the chemical bonds of Cu-S and Fe-S in disulfide (S22-) (Descostes et al., 2000; Ghahremaninezhad et al., 2013; Nakai et al., 1978). The S 2p3/2 peaks centered at 163.3 eV and 164.4 eV can be related to the S 2p3/2 orbits of polysulfide (Sn2-, n > 2) and elemental sulfur (S0), respectively (Hackl et al., 1995; Harmer et al., 2006; Klauber et al., 2001). The S 2p3/2 peak of sulfate and/or residual electrolyte was centered at the binding energy of 168.5 eV (Acres et al., 2010; Buckley and Woods, 1984; Harmer et al., 2004; Harmer et al., 2006). In addition to the peak of S 2p3/2, a broad peak (FWHM﹥2.5) caused by the S 3p to Fe 3d interband excitation was always reported in the previous literatures (Acres. et al., 2011; Ghahremaninezhad et al., 2013; Goh et al., 2010). As shown in Fig. 8(c), elemental sulfur (S0) was detected on the electrode surface at OCP, indicating that elemental sulfur (S0) was one of the leaching product at this potential (Vizsolyi et al., 1967; Wu et al., 2020). The main component of the surface layer was most likely to be the liquid elemental sulfur and the copper-rich sulfides (e.g. disulfide (S22-) and/or polysulfide (Sn2-, n > 2)). Monosulfide (S2-), metal-deficient sulfide phase Cu1-xFe1-yS2 and polysulfide (Sn2-, n > 2) were detected on the electrode surface obtained at 411 mV. When the applied potential was 554 mV, due to the transformation of Cu1-xFe1-yS2 (y > x), polysulfide (Sn2-, n > 2) and sulfate were detected as the main product. The partial coverage of polysulfide (Sn2-, n > 2) not only caused a decrease in exposed electrode area, but also increased the resistance of mass transfer process. As the applied potential increased to 714 mV, Cu1-x-zS2 was oxidized to elemental sulfur (S0) via Reaction (7).
In order to further confirm the surface layer and the leaching product, a series of O 1 s XPS spectra for chalcopyrite electrodes was shown in Fig. 8(d). Based on the open data, the O 1 s peak at 530.6 eV is correspond to the chemical bonds of oxide and adsorbed oxygen, and the O 1 s peak centered at 531.5 eV can be related to OH– orbits of H3O(Fe3(SO4)2(OH)6) or hydroxide species. Ghahremaninezhad et al. studied the pressure-oxidative product of chalcopyrite, they pointed out that H3O(Fe3(SO4)2(OH)6) was produced on the surface of chalcopyrite (Ghahremaninezhad et al., 2013). From Fig. 8(d), it is evident that H3O(Fe3(SO4)2(OH)6) was formation on the surface of chalcopyrite, which caused the decrease of iron concentration.
Fig. 9 shows the speciation of sulfide and oxide on the surface of chalcopyrite electrodes obtained at different potentials. As seen in Fig. 9, surface sulfur species and oxygen species were both affected by applied potential, in other words, the composition of passive layer depends on the leaching conditions. When chalcopyrite was leached at OCP, copper-rich sulfide and elemental sulfur (S0) was the main leaching product of chalcopyrite leaching. The coverage of leaching product led to the passivation of chalcopyrite. When the potential increased from OCP to 411 mV, the content of elemental sulfur was decreased as potential increase, and this result was similar to that reported by Tu et.al (Tu et al., 2017). Considering the results of potentiodynamic study, the trans-passive dissolution of chalcopyrite was a result of the absence of elemental sulfur. As the potential increased to 554 mV, the content of polysulfide (Sn2-) increased to approximately 40.2%. After electrochemical dissolution at 714 mV, elemental sulfur was detected as the oxidation product of Cu1-xFe1-yS2 (y > x). It can be concluded that applied potential plays an important role in determining the chalcopyrite leaching routine.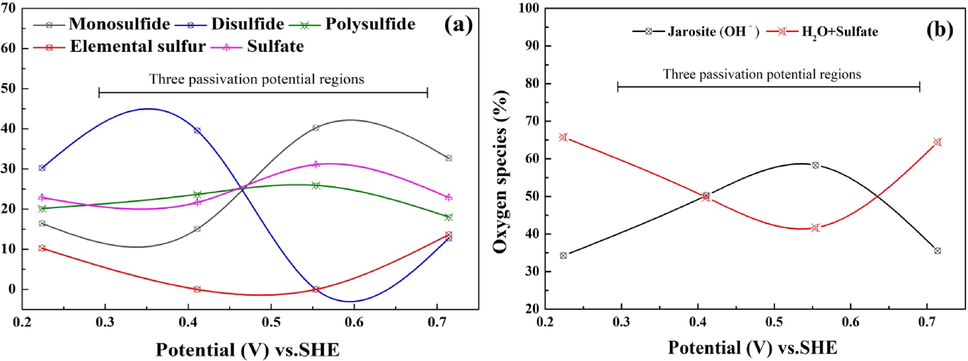
The (a) speciation of sulfur and (b) speciation of oxygen after dissolution at different constant potentials.
4 Conclusion
In-situ electrochemical investigations of pressure leaching of chalcopyrite in 1.0 mol/L sulfuric acid solution from 110 °C to 150 °C with saturated vapor pressure were investigated and a possible leaching mechanism was suggested. It was shown that in-situ electrochemical characterizations could successfully demonstrate the active–passive dissolution of chalcopyrite. When the temperature increased from 110 °C to 150 °C, the corrosion potential (OCP) and electrochemical reaction resistance (R2) first increased and then decreased. The XPS results show that elemental sulfur (S0) and H3O(Fe3(SO4)2(OH)6) were the leaching solid product. The formation of H3O(Fe3(SO4)2(OH)6) not only caused a decrease in cathodic reaction kinetics, but also increased the resistance of mass transfer process. The oxidation–reduction potential of the leaching solution the starting reaction and so that surface chemical situation and surface sulfur species were affected. The leaching product elemental sulfur mixed with the iron-depleted sulfides and/or H3O(Fe3(SO4)2(OH)6) led to the passivation of chalcopyrite.
CRediT authorship contribution statement
Yunlong Bai: Conceptualization, Investigation, Methodology, Writing – original draft. Wei Wang: Supervision, Project administration, Funding acquisition, Writing – review & editing. Feng Xie: Supervision, Project administration, Funding acquisition, Writing – review & editing. Diankun Lu: . Kaixi Jiang: Supervision, Project administration, Funding acquisition. David Dreisinger: Supervision, Project administration, Funding acquisition.
Acknowledgements
This work was supported by the National Natural Science Foundation of China [No. 51574072 and No. 51434001] and Fundamental Research Funds for the Central Universities [No. 2025028].
Declaration of Competing Interest
The authors declare that they have no known competing financial interests or personal relationships that could have appeared to influence the work reported in this paper.
References
- Synchrotron XPS, NEXAFS, and ToF-SIMS studies of solution exposed chalcopyrite and heterogeneous chalcopyrite with pyrite. Miner. Eng.. 2010;23(11):928-936.
- [CrossRef] [Google Scholar]
- Acres., Harmer, S.L., Shui, H.W., Chen, C.H., Beattie, D.A., 2011. Synchrotron scanning photoemission microscopy of homogeneous and heterogeneous metal sulfide minerals. Journal of Synchrotron Radiation, 18(4): 649-657. https://doi.org/10.1107/S0909049511007175
- A comparative kinetic study of chalcopyrite leaching using alternative oxidants in methanesulfonic acid system. Miner. Process. Extr. Metall. Rev.. 2021;1–12
- [CrossRef] [Google Scholar]
- Effect of oxygen on the corrosion behavior of alloy 625 from 25 °C to 200 °C. J. Electrochem. Soc.. 2007;154(4):C215-C229.
- [CrossRef] [Google Scholar]
- Effect of specific surface area of a mechanically activated chalcopyrite on its rate of leaching in sulfuric acid-ferric sulfate media. Metall. Mater. Trans. B. 2013;44(5):1166-1172.
- [CrossRef] [Google Scholar]
- Effect of mechanical activation on leaching behavior and mechanism of chalcopyrite. Miner. Process. Extr. Metall. Rev.. 2021;1–13
- [CrossRef] [Google Scholar]
- Mechano-chemical leaching in hydrometallurgy of complex sulphides. Hydrometallurgy. 2006;84(1):60-68.
- [CrossRef] [Google Scholar]
- An X-Ray photoelectron spectroscopic study of the oxidation of chalcopyrite. Aust. J. Chem.. 1984;37(12):2403-2413.
- [CrossRef] [Google Scholar]
- Evaluation of scid leaching of low grade chalcopyrite using ozone by statistical analysis. Can. Metall. Q.. 2010;49(3):219-226.
- [CrossRef] [Google Scholar]
- Claassena, Meyerb, E.H.O., , J.R., , R.F.S., 2002. Iron precipitation from zinc-rich solutions: defining the Zincor Process. Hydrometallurgy. 67(1-3): 87-108. https://doi.org/10.1016/S0304-386X(02)00141-X
- Córdoba, Mu?Oz, J.A., Blázquez, M.L., González, F., Ballester, A.J.H., 2008. Leaching of chalcopyrite with ferric ion. Part I: General aspects. 93(3-4): 81-87. https://doi.org/10.1016/j.hydromet.2008.04.015
- Córdoba, Muñoz, J.A., Blázquez, M.L., González, F., Ballester, A., 2009. Passivation of chalcopyrite during its chemical leaching with ferric ion at 68°C. Minerals Engineering, 22(3): 229-235. https://doi.org/10.1016/j.mineng.2008.07.004
- In situ electrochemical investigation of acidic pressure oxidation of pyrite at 160–240 °C. J. Electrochem. Soc.. 2018;165(5):C289-C294.
- [CrossRef] [Google Scholar]
- Descostes, M., Mercier, F., Thromat, N., Beaucaire, C., Gautier-Soyer, M., 2000. Use of XPS in the determination of chemical environment and oxidation state of iron and sulfur samples: constitution of a data basis in binding energies for Fe and S reference compounds and applications to the evidence of surface species of an oxidized pyrite in a carbonate medium. Applied Surface Science, 165(4): 288-302. 288-302. https://doi.org/10.1016/S0169-4332(00)00443-8.
- Elemental sulphur formation during the ferric sulphate leaching of chalcopyrite. Can. Metall. Q.. 1989;28(4):337-344.
- [CrossRef] [Google Scholar]
- Elemental sulphur formation during the ferric chloride leaching of chalcopyrite. Hydrometallurgy. 1990;23(2–3):153-176.
- [CrossRef] [Google Scholar]
- Electrochemical and XPS analysis of chalcopyrite (CuFeS2) dissolution in sulfuric acid solution. Electrochim. Acta. 2013;87:97-112.
- [CrossRef] [Google Scholar]
- An X-ray photoelectron and absorption spectroscopic investigation of the electronic structure of cubanite, CuFe2S3. Phys. Chem. Miner.. 2010;37(6):389-405.
- [CrossRef] [Google Scholar]
- The mechanism of ultrasound oxidation effect on the pyrite for refractory gold ore pretreatment. Arabian J. Chem.. 2021;14(4):103045
- [CrossRef] [Google Scholar]
- Passivation of chalcopyrite during oxidative leaching in sulfate media. Hydrometallurgy. 1995;39(1):25-48.
- [CrossRef] [Google Scholar]
- Leaching and kinetic study on pressure oxidation of chalcopyrite in H2SO4 solution and the effect of pyrite on chalcopyrite leaching. J. Sustain. Metall.. 2017;3(3):528-542.
- [CrossRef] [Google Scholar]
- Sulfur species at chalcopyrite (CuFeS2) fracture surfaces. Am. Miner.. 2004;89(7):1026-1042.
- [CrossRef] [Google Scholar]
- The evolution of surface layers formed during chalcopyrite leaching. Geochim. Cosmochim. Acta. 2006;70(17):4392-4402.
- [CrossRef] [Google Scholar]
- Selective flotation of chalcopyrite and molybdenite with H2O2 oxidation [J] Miner. Eng.. 2017;100:83-92.
- [CrossRef] [Google Scholar]
- The kinetics of the oxidation of pyrite by ferric ions and dissolved oxygen: an electrochemical study. Geochim. Cosmochim. Acta. 2000;64(2)
- [CrossRef] [Google Scholar]
- Enhancing chalcopyrite leaching by tetrachloroethylene-assisted removal of sulphur passivation and the mechanism of jarosite formation. Hydrometallurgy. 2020;191:105192
- [CrossRef] [Google Scholar]
- Sulphur speciation of leached chalcopyrite surfaces as determined by X-ray photoelectron spectroscopy. Int. J. Miner. Process.. 2001;62(1):65-94.
- [CrossRef] [Google Scholar]
- Galvanic leaching of chalcopyrite in atmospheric pressure and sulfate media: kinetic and surface studies. Ind. Eng. Chem. Res.. 2010;49(13):5997-6002.
- [CrossRef] [Google Scholar]
- Observation of unusual griffith’s phase behavior in quadruple perovskite oxide CaCu3Mn4O12 (CCMO) synthesized through chemical route. Arabian J. Chem.. 2020;13(4):4895-4903.
- [CrossRef] [Google Scholar]
- A rotating ring-disk study of the initial stages of the anodic dissolution of chalcopyrite in acidic solutions. J. Appl. Electrochem.. 2006;36(4):425-431.
- [CrossRef] [Google Scholar]
- The effect of chloride ions on the electrochemical dissolution of chalcopyrite in sulfuric acid solutions. Electrochim. Acta. 2017;253:257-267.
- [CrossRef] [Google Scholar]
- Thermodynamic analysis of possible chalcopyrite dissolution mechanism in sulfuric acidic aqueous solution. Metals. 2016;6(12):303-318.
- [CrossRef] [Google Scholar]
- Silver-silver chloride thermocells and thermal liquid junction potentials for potassium chloride solutions at elevated temperatures. J. Electrochem. Soc.. 1979;126(9):1618-1624.
- [CrossRef] [Google Scholar]
- Pressure oxidation leaching of chalcopyrite. Part I. Comparison of high and low temperature reaction kinetics and products. Hydrometallurgy. 2007;86(3):191-205.
- [CrossRef] [Google Scholar]
- Pressure leaching of chalcopyrite concentrate with oxygen and kinetic study on the process in sulfuric acid solution. Trans. Indian Inst. Met.. 2020;73(4):975-987.
- [CrossRef] [Google Scholar]
- X-ray photoelectron spectroscopic study of copper minerals. J. Inorg. Nucl. Chem.. 1978;40(5):789-791.
- [CrossRef] [Google Scholar]
- Investigations on the mechanisms of sulfuric acid leaching of chalcopyrite in the presence of hydrogen peroxide. Miner. Process. Extr. Metall. Rev.. 2009;30(4):327-345.
- [CrossRef] [Google Scholar]
- Leaching of chalcopyrite with hydrogen peroxide in hydrochloric acid solution. Transactions of Nonferrous Metals Society of China. 2018;28(7):1444-1455.
- [CrossRef] [Google Scholar]
- Galvanic effect of pyrite on chalcopyrite leaching in sulfate-chloride media. Miner. Process. Extr. Metall. Rev.. 2014;36(1):65-70.
- [CrossRef] [Google Scholar]
- The role of iron-hydroxy precipitates in the passivation of chalcopyrite during bioleaching. Miner. Eng.. 2000;13(10):1117-1127.
- [CrossRef] [Google Scholar]
- Acid leaching of chalcopyrite in the presence of ozone. Can. Metall. Q.. 1990;29(2):133-139.
- [CrossRef] [Google Scholar]
- Electrochemical oxidation of pyrite in pH 2 electrolyte. Electrochim. Acta. 2017;239:25-35.
- [CrossRef] [Google Scholar]
- Copper and elemental sulphur from chalcopyrite by pressure leaching. JOM. 1967;19(11):52-59.
- [CrossRef] [Google Scholar]
- Kinetic and mechanism studies using shrinking core model for copper leaching from chalcopyrite in methanesulfonic acid with hydrogen peroxide. Miner. Process. Extr. Metall. Rev.. 2020;42(1):38-45.
- [CrossRef] [Google Scholar]
- Metal doped manganese oxide octahedral molecular sieve catalysts for degradation of diclofenac in the presence of peroxymonosulfate. Arabian J. Chem.. 2018;11(6):924-934.
- [CrossRef] [Google Scholar]
- Leaching chalcopyrite with sodium chlorate in hydrochloric acid solution. Can. Metall. Q.. 2013;51(2):133-140.
- [CrossRef] [Google Scholar]
- Atmospheric and electrochemical oxidation of the surface of chalcopyrite (CuFeS2) Geochim. Cosmochim. Acta. 1995;59(6):1091-1100.
- [CrossRef] [Google Scholar]
- A kinetic study of the leaching of chalcopyrite at elevated temperatures. Metallurgical Transactions. 1973;4(9):2137-2144.
- [CrossRef] [Google Scholar]
- Kinetics of ferric ion reduction on chalcopyrite and its influence on leaching up to 150 °C. Electrochim. Acta. 2014;146:307-321.
- [CrossRef] [Google Scholar]


