

Translate this page into:
In-situ synthesis of TbAlO3/Tb3Al5O12/Tb2O3 three-component nanocomposite as a heterojunction photocatalyst with a green and eco-friendly approach
⁎Corresponding author. Salavati@Kashanu.ac.ir (Masoud Salavati-Niasari)
-
Received: ,
Accepted: ,
This article was originally published by Elsevier and was migrated to Scientific Scholar after the change of Publisher.
Peer review under responsibility of King Saud University.
Abstract
Abstract
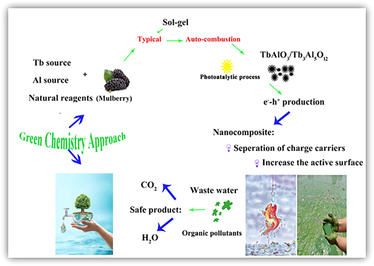
In-situ synthesis of TbAlO3 (TAP)/Tb3Al5O12 (TAG)/Tb2O3 three-component nanocomposite by sol–gel method using natural reactants and investigation of its photocatalytic activity can be considered eco-friendly aspects of this work. The bioactive components of natural compounds may play as a reductant and progress the process through auto-combustion sol–gel technique. It was found that Mulberry has more bioactive components than Capparis spinosa L., so nucleation overtook growth and produced finer particles with less agglomeration. Optical property studies represented a band gap at about 3.8 eV that is different from the amounts related to TAP and TAG. Hence, e--h+ transfers in this nanocomposite were studied by estimation of energy levels of its constituents. According to findings, these components formed a UV-active photocatalyst with Type-I configuration to degrade organic pollutants. In other words, presence of Tb2O3 helped to benefit from properties of two ferroelectric compounds, that they have large band gaps, in photocatalytic reactions. After optimizing the photocatalytic parameters, maximum yield was obtained at about 94 %. Kinetics studies showed the photocatalytic process follows zero-order kinetics. In addition, the oOH was found as the most active promoter agent.
Keywords
TbAlO3/Tb3Al5O12/Tb2O3
Green Chemistry
Nanostructures
Three-Component Nanocomposite
Photocatalyst

1 Introduction
Environmental chemistry and green chemistry are two areas that are in close contact with each other. The former studies the effects of chemical pollutants on nature and the latter investigates the processes that minimize or eliminate these pollutants. Since the development of industries and growth of the population has increased chemical pollution, these areas have received much attention, in recent years (Linthorst 2010, Manahan 2017, Liu et al., 2022).
The photocatalysis process, one of the most useful techniques that can decompose organic pollutants into safe products by absorbing the light and producing the promoter agents, so it is classified as green chemistry. For doing this process, a semiconductor has to absorb light, then electrons and holes as charge carriers are generated in conduction and valence bands, respectively. Next, the surface of the photocatalyst acts as a media to react with pollutants. Finally, a lot of pollutants are eliminated and produced safe products (Serpone 2000, Nassar et al., 2017, Abdtawfeeq et al., 2022).
Photocatalysts are catalysts that will be active under irradiation, so increasing the surface improves their performance. On the other side, delaying the e--h+ recombination can increase the photocatalytic performance, which stems from decreasing size of materials to nanoscale or trapping charge carriers by adding other materials (see Table 1).
Sample Name
Natural Reagent Type
T Calcination (°C)
Products
1
Mulberry
900
Tb(AlO3)/Tb3Al5O12
2
Capparis spinosa L.
900
Tb(AlO3)/Tb3Al5O12
3
Mulberry
800
Tb4Al2O9/TbO1.81
4
Mulberry
1000
Tb(AlO3)/Tb3Al5O12/Tb2O3
Nanomaterials with unique properties have opened a new window for researchers for controlling the properties of materials by changing their morphology and size. These materials affect all aspects of man’s life and are used in various fields. As quantum confinement on the nanoscale increases the band gap and high surface-to-volume ratios in these materials develop catalytic surfaces, preparation of photocatalysts at this scale is essential. Many researches have been done in this area, but the preparation of the photocatalysts with acceptable performance is still a challenge. Preparation of nanocomposites (Aljohani et al., 2021) and using dopants have been considered as techniques for improving the photocatalytic yield through the creation of side levels for increasing the surface and trapping charge carriers in order to delay their recombination. Despite much work that has been done so far, research in this area is still ongoing.
The compounds including the f-block elements represent fascinating properties because of the distinctive electronic structure of these elements. Since the commercial applications of lanthanides as one of the f-block element families are rapidly growing (Atwood 2013), our research team tried to focus on the synthesis of diverse compounds of these elements (Salavati-Niasari, 2005, Dara et al., 2021, Mohassel et al., 2022, Yousefi et al., 2011, Bobinov et al., 2021, Gondo et al., 2022). On the other sides, we always tried to direct their research toward environmental goals and this aim was followed by substituting chemical reagents with natural materials in the synthesis procedure (Dara et al., 2021, Alwany 2022, Salavati-Niasari et al., 2004, Salavati-Niasari et al., 2005, Salavati-Niasari et al., 2009). In addition, the photocatalytic performances of the as-prepared compounds were studied in order to follow green chemistry and eliminate the pollutants to decrease the environmental effects.
Terbium (Tb) is one element of the lanthanide family with oxidation number + 3 in the most of compounds. The most important property of the compounds containing Tb is luminescence which is induced by the intrinsic characteristic of this element, so Tb compounds are usually used as good hosts for different ions (Zorenko et al., 2007, Zorenko et al., 2008, Zorenko and Gorbenko 2009). The luminescence properties of the doped structures can be changed by the type of dopants and distance of Tb-Tb in the host structures. According to the explorations, it was found that the luminescence characteristic of Tb-containing compounds have been notable in comparison with the other properties of them (Yang et al., 2019). Although performance of these compounds in this field, due to their unique electronic properties, is notable, using them in other field have developed in recent years (Mahmoudi-Moghaddam et al., 2022).
TbAlO3 (TAP) and Tb3Al5O12 (TAG), as two important compounds, which belong to the concentrated rare-earth oxides, have large band gaps that have limited their applications in photocatalytic areas and other related fields. However, doping the elements and preparation of nanocomposites are brilliant ways to decrease the band gap and develop their performance in diverse fields. Recently, reports based on using ferroelectric compounds with large band gap as effective photocatalysts have been presented. Although it is to be noted that additive must retain their ferroelectric properties (Rohj et al., 2021). Since TbAlO3 and Tb3Al5O12 are magneto-electric compounds (Mercier and Cursoux 1968) with band gaps about 5.6 eV (2021) and 4.7 eV (Persson 2014), it will be used as an effective photocatalyst in case it becomes a nanocomposite or doping. Tb2O3 is another Tb-containing compound, it is a semiconductor with band gap about 3.82 eV (Horoz et al., 2015). As the matter of fact, TbAlO3/Tb3Al5O12/Tb2O3 nanocomposite prepared in this work, which has been synthesized for the first time, can be considered as a compound with photocatalytic activity. Because of the categorization of heterojunction photocatalysts based on energy level of their constituents and their interactions with each other, this nanocomposite was considered as Type 1. That is why, the excited electrons (in conduction band) and the created holes (in valence band) of TAP were transferred to C.B. and V.B. of TAG, then they flowed in C.B. and V.B. of Tb2O3, respectively. Consequently, band gap decreased in order to absorb light.
So TbAlO3/Tb3Al5O12/Tb2O3 nanocomposite was synthesized in this work using two natural materials Mulberry and Capparis spinosa L. as green reagents by an auto-combustion sol–gel technique. Sol-gel is a chemical method that is used to prepare the different ceramics, metal oxides, and nanocomposites. This method has many advantages for instance production of pure and homogeneous nanoparticles without utilize complex facilities. When nitrate salts are used as the metallic precursor (oxidant agents) and react to the materials containing antioxidant compounds (reductant agents), the sol–gel method is converted to the auto-combustion sol–gel technique. This technique has no need to use metal–organic precursors that are usually used in the common method (Mandizadeh et al., 2015). Furthermore, heat induced by this exothermic reaction can accelerate the formation of the polymeric network and develop it. So, the growth rate of nanoparticles is restricted and the fine nanoparticles with high purity due to the complete reaction between precursors are produced. To benefit from the electronic structure and charge transfer of these compounds, the photocatalytic activity of this nanocomposite was investigated by degrading two dyes under UV irradiation. After optimizing the conditions of photocatalytic reactions, maximum degradation percent was obtained at about 94 %.
2 Materials and methods
2.1 Materials and instruments
All the materials used in this work except Mulberry and Capparis spinosa L. were commercially available and employed without further purification. Tb(NO3)3·6H2O (MW = 435.02 is 0.435 g) and Al(NO3)3·9H2O (MW = 375.134 g) with a purity of over 99 % purchased from Merck company.
XRD (X-ray diffraction) patterns were collected from a diffractometer of the Philips Company with X’PertPro monochromatized Cu Kα radiation (λ = 1.54 Å). Microscopic morphology of the products was studied by FESEM (field emission scanning electron microscopy) (Mira3 tescan) and TEM (transmission electron microscopy) (HT-7700). EDS (energy dispersive spectrometry) analysis was studied by XL30, Philips microscope. Room temperature magnetic properties were investigated using a vibrating sample magnetometer (VSM, made by Meghnatis Daghigh Kavir Company) in an applied magnetic field sweeping between ± 10000 Oe. The UV–vis diffuse reflectance spectrum has been recorded with the aid of a UV–vis spectrophotometer (Shimadzu, UV-2550, Japan) in a range between 200 and 700 nm.
2.2 Extraction procedure of Mulberry and Capparis spinosa L.
At the first, 100 g of fruits were washed with distilled water. After drying, the fruits were crushed and then added to 50 ml of a solution containing 60 % methanol/ distilled water, and next the temperature of the solution was adjusted to 80 °C. This solution was put in a microwave instrument and its power was fixed at 60 W for 5 min. after filtration of suspension, the solution was used (Mollica et al., 2019).
2.3 In-situ synthesis of TbAlO3/Tb3Al5O12 nanocomposite
For a typical procedure, 0.435 g (1 mmol) of Tb (NO3)3. 5 H2O and 0.375 g (1 mmol) of Al (NO3)3. 9 H2O were dissolved in 10 ml of distilled water, separately. Then, 5 ml of the Mulberry or Capparis spinosa L. extractions was added to the above solution and the temperature of the solution was maintained at 60 OC under magnetic stirring for 30 min. Then, to obtain gel (viscous solution) induced by forming the polymeric network, the temperature of the solution was raised to 120 °C. Next, the formed gel was dried at 75 °C for 24 h in order to grow the polymeric network (aging step). Finally, the obtained powder was calcined at 900 °C for 5 h.
2.4 Photocatalytic studies
The photocatalytic performance of TbAlO3/Tb3Al5O12/Tb2O3 nanocomposite was evaluated by degradation of Erythrosine as an anionic dye and Malachite green as a cationic dye under UV irradiation. The photocatalytic tests were carried out under a UV lamp. The quartz vessel including the photocatalyst sample (0.05 g) and dye solution (10 ppm) was 40 cm away from the UV and light sources inside a dark box to prevent UV permeation. At the first, the mixture was aerated for 30 min to reach adsorption equilibrium. Then, the tests were conducted at 25 °C and the admixtures were subjected to lamp sources. Then, the absorption of solutions was recorded during the test time (10–90 min) by the device of a UV–vis spectrometer.
3 Results and discussion
Nanomaterial properties can be remarkably affected by two parameters: size and morphology. So, the synthesis of nanomaterials with different sizes and morphologies is receiving a great deal of attention in order to change the properties of nanomaterials. Because of the massive structures of capping agents and surfactants, they can be used to control the properties of these materials. Components with massive structures in natural reagents can alter the morphology of nanomaterials as well as their purity.
3.1 SEM images
The effect of the used natural reactants on the morphology of the products was studied and the SEM images of samples 1 and 2 were given in Fig. 1 (a, b) and (c, d), respectively. As shown in this figure, the particles produced using Mulberry extraction are smaller than the sample synthesized by Capparis spinosa L.. This phenomenon can be justified through the effect of ingredient amounts in the used natural reagents. The more amounts of polysaccharides, vitamins, flavonoids, and antioxidants in Mulberry (Lee et al., 2018) rather than Capparis spinosa L. (its bioactive component is Rutin) provide the conditions for the rapid progress of the reaction, so that the polymeric network developed and the nucleation step proceeded from the growth step. Therefore, the smaller particles with more homogeneity were obtained.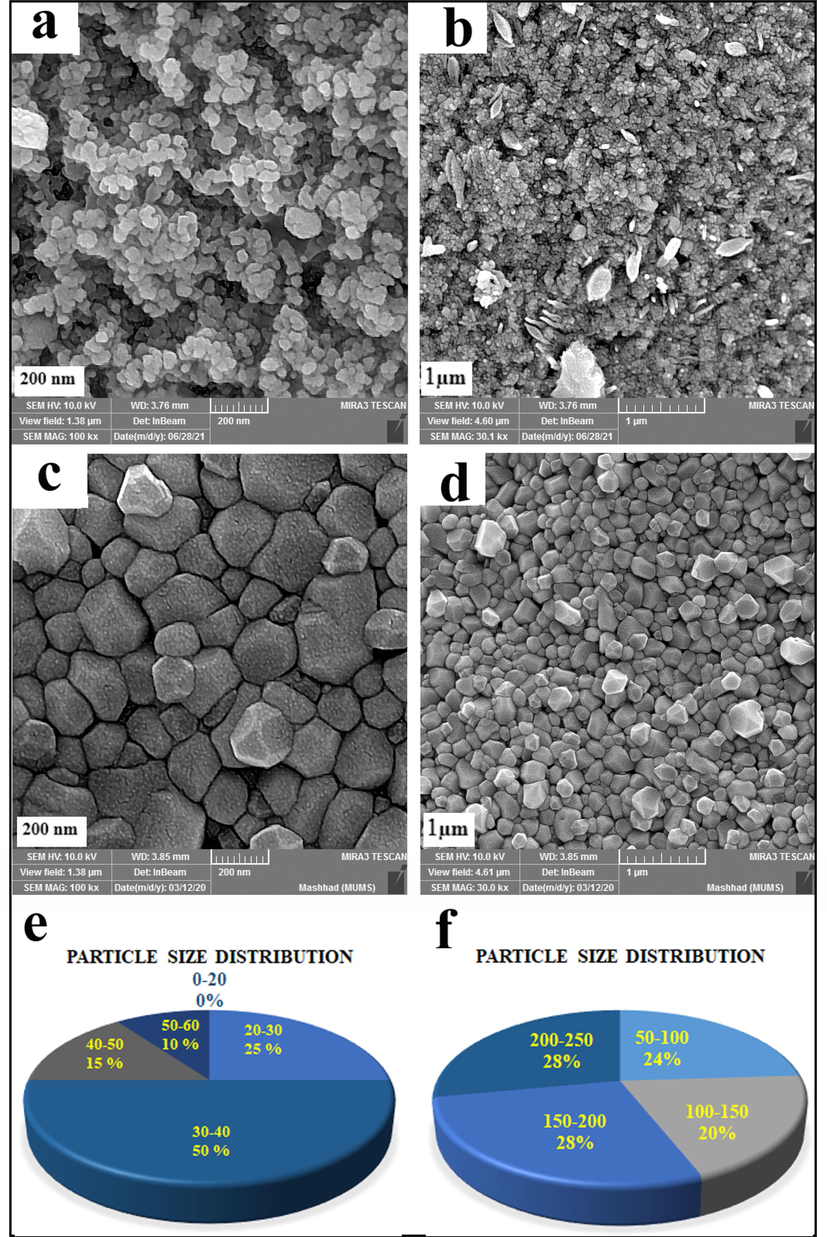
SEM images of samples (a, b): 1, (c, d): 2, pie diagram of particle size distribution of samples (e) 1 and (f) 2.
As reported in the previous works, sugars can play three roles at the same time as a capping agent, fuel, and reductant in the sol–gel method (Mandizadeh et al. 2015). The distribution particle size histograms of these samples were drawn using Digimizer software. As shown in Fig. 1e and f, the size variety of nanoparticles in sample 2 is more than in sample 1. The high amount of bioactive components in Mulberry that was used as a reagent for the synthesis of sample 1 increased the reaction speed, so the homogeneity of products increases by restriction of the growth process. Consequently, Mulberry was considered an ideal natural reagent.
3.2 XRD patterns
To investigate the effect of the used natural reagent on the purity of samples, XRD patterns of samples 1 and 2 are displayed in Fig. 2a and b, respectively. Although, diffraction lines of both patterns were assigned to TbAlO3 (JCPDS = 01–088-0154; Orthorhombic), and Tb3Al5O12 (JCPDS = 01–076-0111, Cubic), there were vast differences between constituent percent of these samples. Peaks in sample 1 are wider and in sample 2 are more intense. Maybe, it was rooted in presence of different effective components in Mulberry in comparison with Capparis spinosa L., which controlled the growth step and decreased particle size. In other words, the wider peaks, the smaller particles. As shown, the 2nd-component nanocomposite contains two ferroelectric compounds resulted in the calcination of gel at T = 900 OC.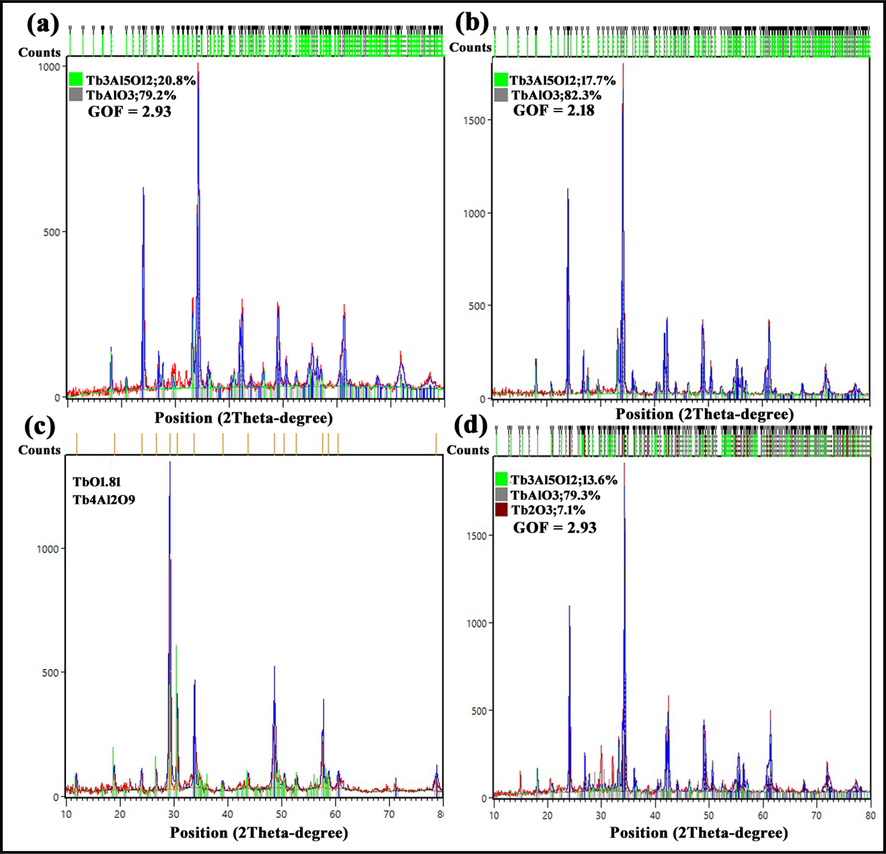
XRD patterns of samples (a) 1, (b) 2, (c) 3, and (d) 4.
As reported, the nanocomposite formed in this work was prepared by sol–gel method. Since calcination is one of the most important steps of this method, it can affect the purity of the products and their size. So, the calcination temperature was considered as a parameter to achieve a nanocomposite with acceptable purity. XRD patterns of samples calcined at Tcalc. = 800 °C (sample 3), and 1000 °C (sample 4) are shown in Fig. 2c and d, respectively. In Fig. 2c, diffraction lines of the pattern were accordance with two compounds TbO1.81 (JCPDS card no. 01–075-0275, Cubic) Tb4Al2O9 with JCPDS card no. 00–044-0221, Monoclinic). Hence, this temperature was unpleasant to prepare TbAlO3 as a main product. According to that be seen, T = 800OC couldn’t provide the conditions for synthesis of TAP and TAG.
The simultaneous presence of three compounds TbAlO3 (JCPDS card no. 01–088-0154, Orthorhombic), Tb3Al5O12 (JCPDS card no. 01–076-0111, Cubic) and Tb2O3 (JCPDS card no. 01–074-2131, Monoclinic) are just shown in Fig. 2d. This figure confirmed that T calcination > 900 °C is appropriate for the successful synthesis of three-component nanocomposite (samples 4). There is recognizable relationship between calcination temperature and intensity of diffraction lines, the more intense peaks are, the higher calcination temperature is. The crystallite size of sample 4 was calculated by Debby-Scherer equation (Eq. (1)) as below:
in this equation, λ (nm) X-ray wavelength, K is a dimensionless shape factor (0.9), β is the line broadening at half the maximum intensity (FWHM), and θ is the Bragg angle. The amounts of crystallites for every constituent were estimated by Debby-Scherer using Highscore plus software. These amounts may be summarized as: 44.5, 49.6 and 43.4 nm for Tb(AlO3), Tb3Al5O12 and Tb2O3, respectively.
As it has just been written, same as the other ferroelectric compounds TAP and TAG have high energy gap so they couldn’t use for photocatalysis processes. That is why, the existence a semiconductor with an acceptable band gap (with appropriate valence and conduction band energies) may help to develop their application. As seemed, Tb2O3 as the third phase has been formed when the gel was calcined at T = 1000 °C. In other words, formation of a three-component nanocomposite could provide this opportunity to benefit from it as a heterojunction photocatalyst. I mean, band gaps of ferroelectric compounds were decreased by charge carrier transfers in this sample. Finally, sample 4 was chosen as desired product and characterized by various analyses.
3.3 EDS spectrum
The EDS analysis is used to prove the chemical purity of products. EDS spectrum of sample 4 is illustrated in Fig. 3a. The presence of the peaks related to Tb, Al, and O elements is a reason for the synthesis of this nanocomposite.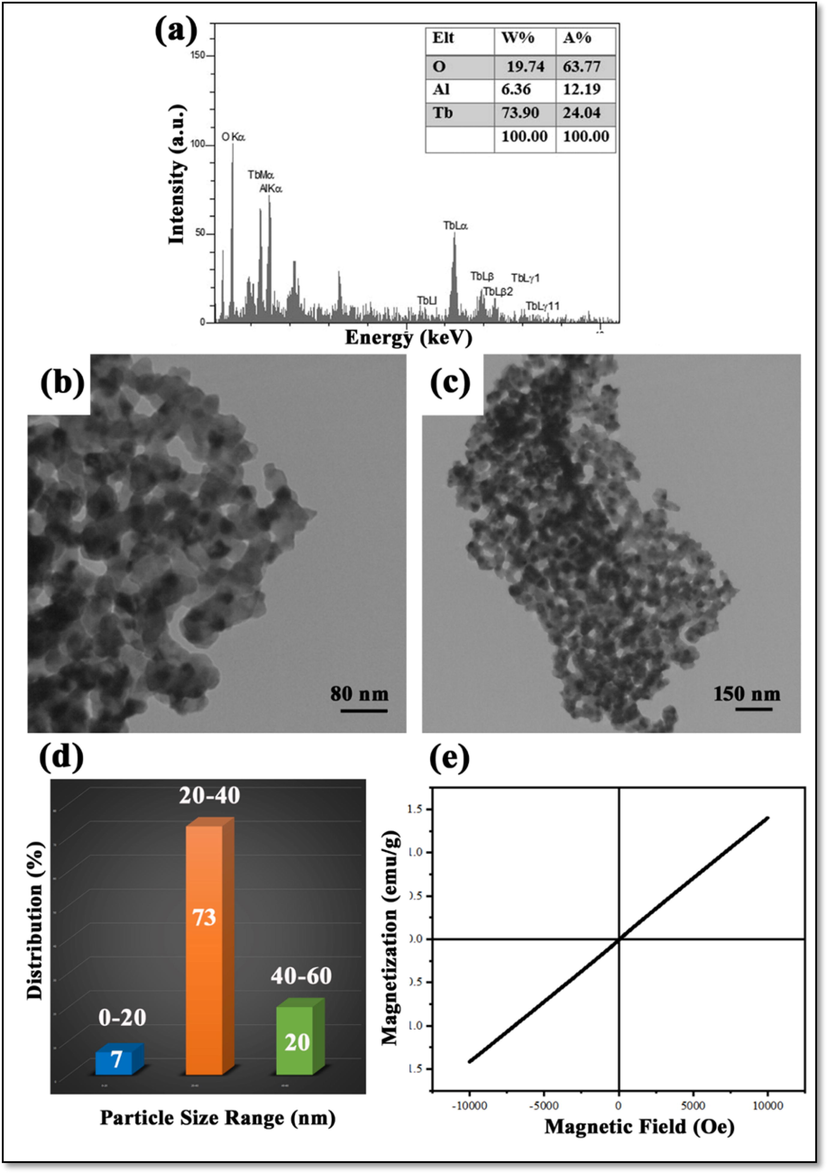
(a) EDS spectrum, (b, c) TEM image, (d) Particle size distribution histogram and (e) M−H hysteresis loop of sample 4.
3.4 TEM image
TEM images of sample 4 are shown in Fig. 3b and c. Fine particles with mean sizes of about 20 and 40 nm are observable in these images. The contrast shown in this figure is evidence for successful synthesis of nanocomposite, it shows the presence of multiple phases, simultaneously.
In Fig. 3d, the Pie chart shows particle size distribution that drawn using Digimizer software for 15 particles. According to this analysis the minimum size of particles in this figure is estimated about 18.92 nm and maximum size of particles is about 63 nm. Although size of all particles were not measured, it tried to measure different kinds of many particles with various sizes. The mean size of particles was reported about 34 nm.
3.5 VSM analysis
The M−H hysteresis loop resulting from VSM is used to measure the magnetic properties. Recognition of this property can help to develop the applications of materials. In Fig. 3e, the hysteresis loop of sample 4 that was measured at room temperature is observable. This loop represents the paramagnetic property of this nanocomposite. A magnetic field converts this nanocomposite into a magnetic material, and when the magnetic field is removed this property is lost. It sounds that the presence of TB3Al5O12 and Tb2O3 and interaction between them constituent affected the magnetic property of TbAlO3 (with antiferromagnetic property) (Cashion and Wells 1998)) and emerged a paramagnetic property in this nanocomposite.
3.6 BET analysis
Fig. 4a shows the nitrogen adsorption–desorption isotherm of sample 4. According to IUPAC classification, it was categorized as a type III isotherm. This type shows the interaction of adsorbent-adsorbate is weak and the adsorbed molecules are clustered around the surface of a nonporous or macroporous solid. On the other side, the shape of the hysteresis loop presents useful information about the pore. The hysteresis loop shape of this sample is H3, this loop is a characteristic of materials that have slite-shaped pores. There isn’t any limitation of adsorption in high relative pressure, as seen for the plate-like particle aggregation. Shape of the desorption curve in this hysteresis is induced by what is called the tensile strength effect (ALOthman 2012). Details are shown in Table 2.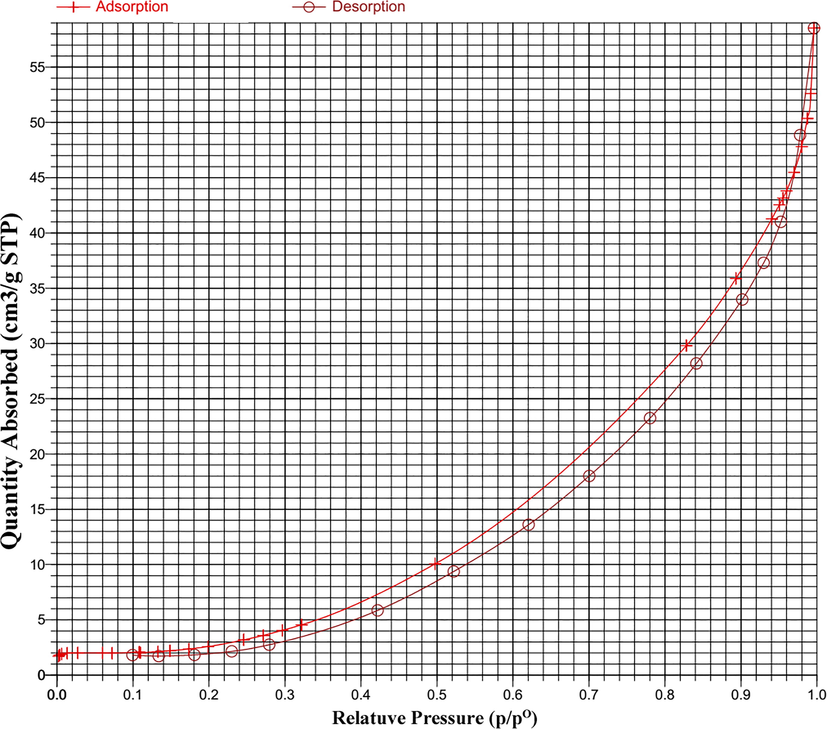
N2 adsorption/desorption isotherm of sample 4.
BET area (m2.g−1)
Total pore volume (cm3.g−1)
Average pore diameter (nm)
13.84
0.066 (p/p0 = 0.95)
19.67
3.7 Photoluminescence spectrum
As said, luminescence is an inherent characteristic of Tb+3, so the PL spectrum of sample 4 was given in Fig. 5. The emission spectrum showed that excitation wavelength was obtained at a range of 330–360 nm, it is related to transferring the electrons according to that written in this figure. The results were according to the results reported in other works (Zorenko and Gorbenko 2009, Umamaheswari et al., 2012).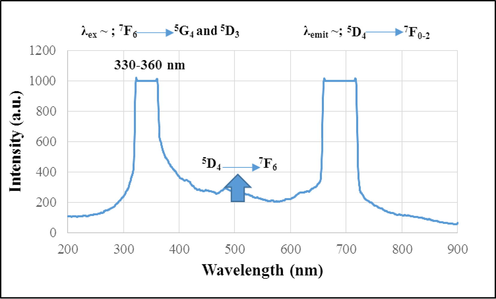
Photoluminescence spectrum of sample 4.
3.8 Optical studies
Photocatalysis process takes place when a semiconductor is exposed to radiation and produces e--h + pairs (charge carriers), so they play the main role in this procedure. Increasing the active surface along with delaying the charge carrier recombination can improve the photocatalytic yield. So, measurement of band gap is one of the techniques to estimate the optical range of photocatalyst. The common method for measuring this parameter is using the Tauc equation (Tauc 1968), which is as follows:
where A is a constant, n is the power factor of the transition mode, which is dependent upon the nature of the material (it can be 0.5 for direct transition and 2 for indirect transition), hυ and Eg are representatives of photon energy, and band gap, respectively. Furthermore, the optical band gap is obtained by extrapolating the linear portion of the (Ahυ)n curve versus hυ to zero (Mahdiani et al., 2018, Refat et al., 2022).
In Fig. 6a, DRS spectrum of this nanocomposite is presented. Two absorption peaks observed at 276 nm and 436 nm can be assigned to charge transfer 7F6 to 5D4 (Huang et al., 2020) and O-2 to Al (Prashanth et al., 2015), in turn.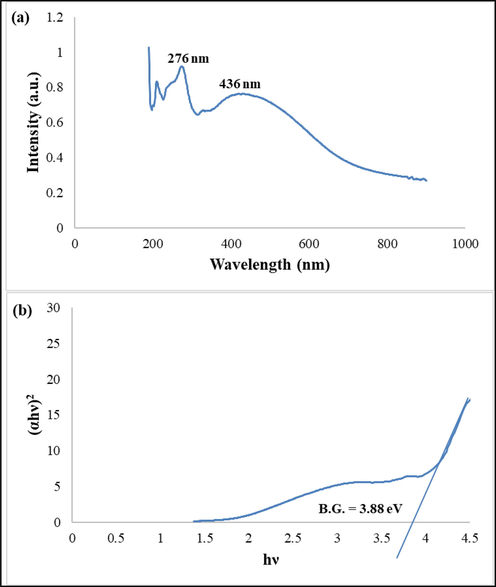
(a) DRS spectrum and the (b) curve (αhν)2 versus hν in order to calculate band gap of sample 4 by Tauc equation.
According to the curves of (αhυ) 1/n versus hυ that are presented in Fig. 6b band gap of the as-prepared nanocomposite was estimated at about 3.88 eV. This result is in accordance with what was predicted in Scheme 1.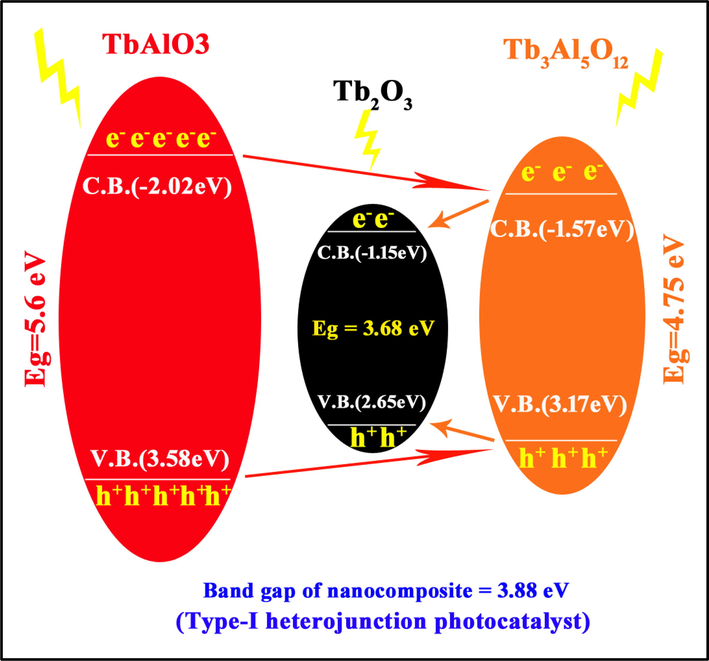
Configuration of type-I heterojunction photocatalyst (sample 4).
3.9 Investigation of photocatalytic activity
Dye degradation is considered as a manner to study the photocatalytic performance of nanomaterials. Herein, two dyes including Malachite Green (MG) and Erythrosine were used as representatives of organic pollutants that in presence of the as-prepared nanocomposite under UV irradiation were degraded. The curves of absorption differences of dyes versus time are shown in Fig. 7, it showed that photocatalyst after exposing the irradiation can decrease dye amount. The degradation percent of Malachite green was more than Erythrosine, under the same condition (pH = 7, photocatalyst amount = 0.05 g, and 90 min UV irradiation). So, the other photocatalytic studies were carried out with Malachite green as a cationic dye.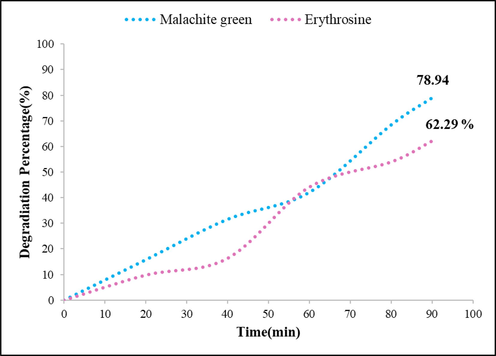
Investigation of photocatalytic activity of TbAlO3/Tb3Al5O12 nanocomposite through degradation of dyes under UV irradiation for 90 min.
3.9.1 Recycling experiment
Since catalysts are one of the most important parts of industries so, recycling them is so important. This work investigated the performance of the as-prepared nanocomposite after 5 recycling. This process may be summarized as follows: dye solution containing photocatalyst was centrifuged and after rinsing twice, the photocatalyst was collected and used for the next photocatalytic reactions. It means the photocatalyst was reused 5 times. The recycling ability of photocatalyst is confirmed by a slight drop in the degradation percent of dye as shown in the histogram drawn in Fig. 8.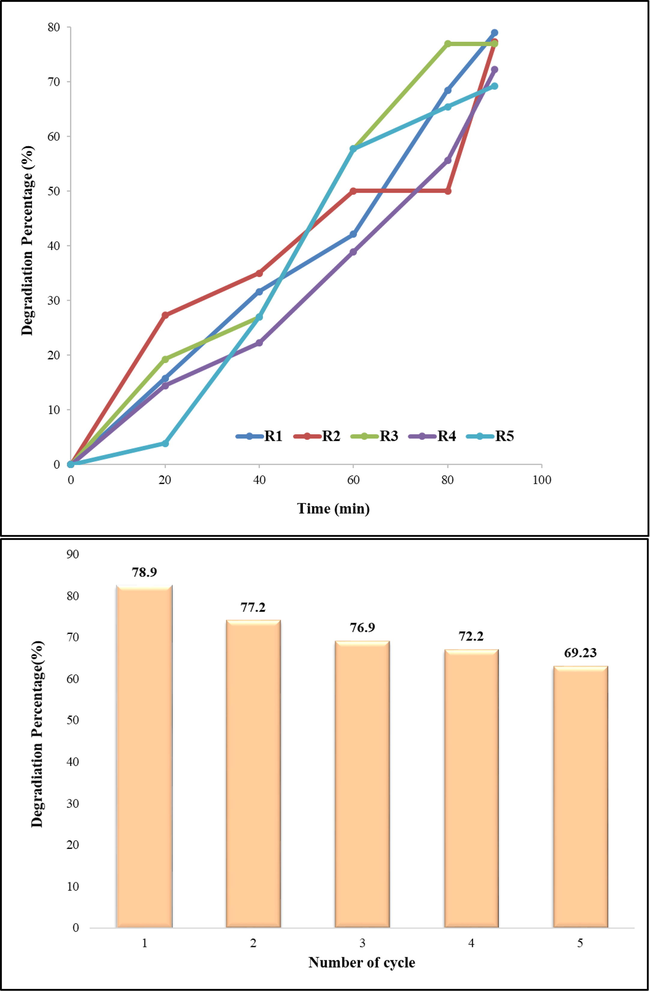
Recycling experiments; reusing of photocatalyst after 5 cycles.
3.9.2 Optimization of photocatalytic performance
To achieve the highest yield, the effective parameters on photocatalytic activity were changed such as pH of solution and amount of photocatalyst. Curves of the optimized conditions are displayed in Fig. 9. According to the curves, the maximum degradation percent obtained when pH = 9 and the photocatalyst amount was 0.07 g. As shown in the curve related to the photocatalyst amount, increasing photocatalyst amount increases degradation amount to a specific amount, after that the trend is reversed. Though increasing the amount of photocatalyst increases the number of active sites which has a positive effect, but beyond a certain amount decreases the photocatalytic yield due to turbidity of solution that decrease the recorded absorption amount, so photocatalytic yield is incorrectly reported. On the other sides, pH can impress the absorption amount through changing the dye structure and increasing the dye absorption on surface of photocatalyst that induced by electrostatic interaction between cationic dye and semiconductor that has an amphoteric behavior (Ahmad et al., 2020).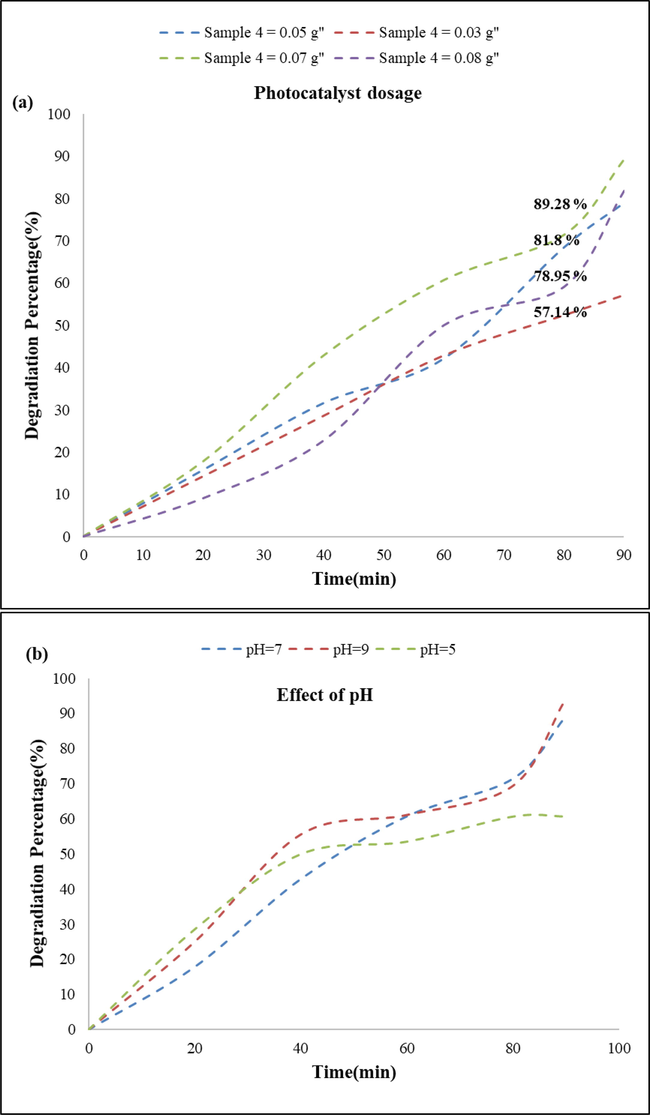
Optimization of dye degradation through (a) changing the photocatalyst amount and (b) pH of dye solution.
3.9.3 Scavenger experiments
As known, degradation of organic pollutants during the photocatalysis process is started by photo-generated charge carriers which are considered as initiator agents of chemical reactions. By considering the diverse chemical reactions reported for this process, hydroxyl radicals, holes, and superoxide anion radical (°O2-) are three promoter agents (Dara et al., 2021, Salavati-Niasari et al., 2004, Salavati-Niasari et al., 2005, Salavati-Niasari et al., 2009). Importance of their roles in different conditions can be different, so scavenger experiments for investigation of the related mechanism are carried out in presence of benzoic acid, EDTA (Ethylene diamine tetraacetic acid), and 1, 4- benzoquinone as suppressors. This curves of these experiments are shown in Fig. 10, the maximum drop was assigned to presence of benzoic acid and minimum slump was shown when EDTA was added to the system. Hence, hydroxide radical was considered as the most active agent of photocatalytic reactions in this work.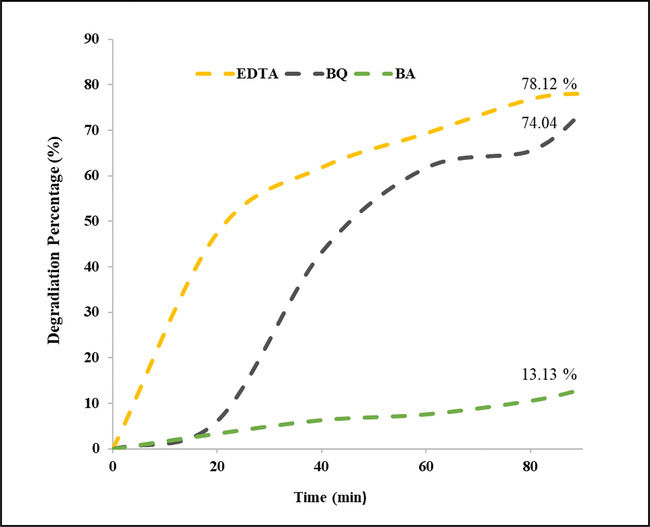
Scavenger experiments for detection of the most active promoter agent.
The photocatalytic reactions can be written as follows:
3.9.4 Mechanism of photocatalytic reactions
Because of interacting electronic levels in the multi-component heterojunction photocatalysts, they show a different performance in comparison to every component. How this interaction defines type of photocatalytic configuration. The energy level of conduction (C.B.) and valence (V.B.) bands can be calculated by this equation
(Valian et al., 2022):
where X, Ee, and Eg are indicators of mean electronegativity of the compound that is calculated based on Mulliken method, the free electron energy on the hydrogen scale which is considered 4.5 eV, and band gap that can be estimated using Tauc equation, respectively.
Since this nanocomposite was synthesized in-situ, so calculation of band gap of every component in this work in order to use in equations (15 and 16) isn’t possible. So, these calculations were carried out based on the amounts obtained in the other works, the way band gap of TAP and TAG (Persson 2014) were reported as 5.6 eV and 4.75 eV, in turn. In continue, Band gap of this nanocomposite was calculated at about 3.9 eV, that is in accordance with that reported as Type-1 heterojunction configuration. Considering scheme 1, which shows energy levels of components and how electron-hole transfers between these levels, it was found that the as-prepared nanocomposite is a Type-I heterojunction.
After irradiation and formation of e--h + pairs in every constituent of the as-prepared nanocomposite, electrons and holes from C.B.TAP (-2.02 eV) and V.B.TAP (3.58 eV) have been transferred to C.B.TAG (-1.575 eV) and V.B.TAG (3.175 eV) and after, charge carriers have followed from C.B.TAG and V.B.TAG to C.B.Tb2O3 (-1.2 eV) and V.B. Tb2O3 (2.6 eV). On other words, electrons and holes are gathered on C.B. and V.B. of the compound with smaller band gap (Tb2O3) and the difference of transition rate of these charge carriers can improve photocatalytic efficiency and increase reactions that are carried out on the surface of photocatalysts (Valian et al., 2022). Moreover, defects on the conjunction surfaces can be play an imperative role for trapping charge carriers and delaying e--h+ recombination.
3.9.5 Kinetics studies
To study the rate of reaction and its effective parameters, kinetics studies are carried out. Different models were studied and it was found that the Malachite green degradation reaction follows the zero-order kinetics. Since the kinetics equation of the zero-order reaction is written as follows:
Equation (4) can be written as a line equation: y = mx + b, with y = [A], b = [A]0, and k is slope of this curve (Gaya 2014).
So, the curve of [A] versus time (t) was drawn in Fig. 11 and the R-squared value on the chart was obtained at about 0.983.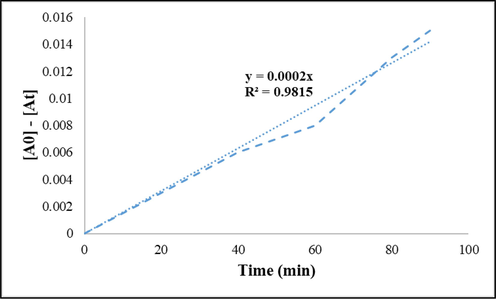
Kinetics studies on the Malachite green degradation.
4 Conclusions
In summary, TbAlO3/Tb3Al5O12/Tb2O3 nanocomposite was synthesized by natural reactants and it was utilized to use as a photocatalyst for degradation of organic pollutants. So, it can be said that this work has a green approach, the thing that it can be summarized in no using of chemical reagents and removing the organic pollution through photocatalytic activity. Since the presence of bioactive components in natural compounds can play different roles as capping agent and reductant during the chemical reactions, they can progress the reactions as auto-combustion sol–gel reaction. It means TbAlO3/Tb3Al5O12/Tb2O3 nanocomposite was prepared by the auto-combustion sol–gel method using Mulberry and Capparis spinosa L.. The polymeric network develops more quickly due to the existence of more bioactive components in Mulberry in comparison with Capparis spinosa L.. Accordingly, the nucleation overtakes the growth step and are produced smaller particles. Moreover, optical properties of this nanocomposite showed that energy level position of each component affect charge carriers transfers to a great extent. That is why the band gap of nanocomposite was estimated about 3.9 eV. In other words, these interactions impressed photocatalytic activities based on charge carrier transfers, so the as-prepared nanocomposite was categorized in Type-I heterojunction photocatalyst. This configuration improved photoatalytic activities of TAG and TAP that have large band gaps and increased the efficiency by delaying electron-hole recombination through transferring electron and holes with different rates. Finally, TbAlO3/Tb3Al5O12/Tb2O3 nanocomposite as a UV-active photocatalyst could degrade cationic and anionic dyes. Photocatalysis parameters were optimized by changing the pH of dye solution and photocatalyst amount. The results of photocatalytic experiments were summarized as follows:
-
The existence of Tb2O3 as a semiconductor helped to develop the as-prepared nanocomposite in order to use for photocatalytic performance.
-
The performance of this photocatalyst was justified based on Type-I heterojunction configuration.
-
Flowing charge carriers from TAP to TAG and then Tb2O3 may result in decreasing band gap.
-
Calcination of the gel at T = 1000 OC provided an opportunity to prepare this three-component nanocomposite.
-
The maximum percent of degradation was 94.4 which was related to Malachite green, pH = 9, and nanocomposite amount = 0.07 g.
-
The photocatalytic reaction follows the zero-order kinetics.
-
The most active promoter agent was hydroxyl radical.
-
Degradation percent of cationic dye was anionic dye using this nanocomposite.
Conflict of interest
The authors declare that there are no conflicts of interest regarding the publication of this manuscript.
CRediT authorship contribution statement
Mahin Baladi: Investigation, Formal analysis, Methodology, Writing – original draft, Software. Faezeh Soofivand: Software, Formal analysis, Methodology, Writing – review & editing, Software. Safaa H. Ganduh: Data curation, Visualization, Software. Layth S. Jasim: Writing – review & editing, Data curation, Software. Makarim A. Mahdi: Writing – review & editing, Data curation, Software. Masoud Salavati-Niasari: Formal analysis, Methodology, Writing – review & editing, Writing – original draft, Conceptualization, Methodology, Supervision, Project administration, Investigation, Data curation, Validation, Resources, Visualization, Funding acquisition, Software.
Acknowledgments
The authors are grateful to the council of Iran National Science Foundation (INSF, 97017837) and the University of Kashan for supporting this work by Grant No (159271/MB5).
References
- Abdtawfeeq, T. H., Farhan, Z. A., Al-Majdi, K., Jawad, M. A., Zabibah, R. S., Riadi, Y., Hadrawi, S. K., AL-Alwany, A., and Shams, M. A. 2022. Ultrasound-Assisted and One-Pot Synthesis of New Fe3O4/Mo-MOF Magnetic Nano Polymer as a Strong Antimicrobial Agent and Efficient Nanocatalyst in the Multicomponent Synthesis of Novel Pyrano [2, 3-d] pyrimidines Derivatives. Journal of Inorganic and Organometallic Polymers and Materials, 1-12. DOI: 10.1007/s10904-022-02514-7.
- Pollutant emissions, renewable energy consumption and economic growth: An empirical review from 2015–2019. Journal of Environmental Treatment Techniques.. 2020;8:323-335.
- [Google Scholar]
- Arrhythmia related to hypertensive left ventricular hypertrophy in Iraqi patients: frequency and outcome. J. Med. Life. 2022;15(9):1115.
- [CrossRef] [Google Scholar]
- Cobalt aluminate/carbon nanocomposite via an auto-combustion method: an efficient photocatalyst for photocatalytic degradation of organic dyes from aqueous media. Int. J. Environ. Anal. Chem. 2021:1-21.
- [Google Scholar]
- ALOthman, Z. A., 2012. A review: fundamental aspects of silicate mesoporous materials. Materials. 5, 2874-2902.
- The rare earth elements: fundamentals and applications. John Wiley & Sons; 2013.
- Historical aspects of microsurgical treatment of brain aneurysms. History of Medicine. 2021;7(2):179-188.
- [CrossRef] [Google Scholar]
- Magnetic interactions in DyAlO3 and TbAlO3. J. Magn. Magn. Mater.. 1998;177:781-782.
- [Google Scholar]
- Green sol–gel auto combustion synthesis and characterization of double perovskite Tb 2 ZnMnO 6 nanoparticles and a brief study of photocatalytic activity. RSC Adv.. 2021;11:8228-8238.
- [Google Scholar]
- Gaya, U. I., 2014. Kinetic concepts of heterogeneous photocatalysis. Heterogeneous Photocatalysis Using Inorganic Semiconductor Solids, Springer: 43-71.
- “Effect of Isotiocyanate Therapy On Trophoblast Cell Culture Hyperglycemia Atmosphere In Apoptosis, Caspase-3, NO, VEGF. History of Medicine. 2022;8(1):62-67.
- [CrossRef] [Google Scholar]
- Electronic and optical properties of rare earth oxides: Ab initio calculation. World J. Condens. Matter Phys.. 2015;5:78.
- [Google Scholar]
- Fabrication and characterization of Tb3Al5O12 magneto-optical ceramics by solid-state reactive sintering. Opt. Mater.. 2020;102:109795
- [Google Scholar]
- Beneficial effects of bioactive compounds in mulberry fruits against cisplatin-induced nephrotoxicity. Int. J. Mol. Sci.. 2018;19:1117.
- [Google Scholar]
- An overview: origins and development of green chemistry. Found. Chem.. 2010;12:55-68.
- [Google Scholar]
- High efficiency of Ag0 decorated Cu2MoO4 nanoparticles for heterogeneous photocatalytic activation, bactericidal system, and detection of glucose from blood sample. J. Photochem. Photobiol. B Biol.. 2022;236:112571
- [CrossRef] [Google Scholar]
- Green synthesis and characterization of Tb-Fe-O-Cu ceramic nanocomposite and its application in simultaneous electrochemical sensing of zinc, cadmium and lead. Arab. J. Chem.. 2022;15:103988
- [Google Scholar]
- Environmental chemistry. CRC Press; 2017.
- Sol–gel auto combustion synthesis of BaFe12O19 nanoceramics by using carbohydrate sugars as a novel reducing agent. Adv. Powder Technol.. 2015;26:1348-1354.
- [Google Scholar]
- Effect of g-C3N4 amount on green synthesized GdFeO3/g-C3N4 nanocomposites as promising compounds for solid-state hydrogen storage. Int. J. Hydrogen Energy 2022
- [Google Scholar]
- Chemical composition and biological activity of Capparis spinosa L. from Lipari Island. S. Afr. J. Bot.. 2019;120:135-140.
- [Google Scholar]
- MgO nanostructure via a sol-gel combustion synthesis method using different fuels: an efficient nano-adsorbent for the removal of some anionic textile dyes. J. Mol. Liq.. 2017;225:730-740.
- [Google Scholar]
- Persson, K., 2014. Materials Data on Tb3Al5O12 (SG:230) by Materials Project. m. project. United state, @misc{osti_1190647.
- Synthesis, characterizations, antibacterial and photoluminescence studies of solution combustion-derived α-Al2O3 nanoparticles. J. Asian Ceram. Soc.. 2015;3:345-351.
- [Google Scholar]
- A controllable one-pot hydrothermal synthesis of spherical cobalt ferrite nanoparticles: synthesis, characterization, and optical properties. RSC Adv.. 2022;12:25081-25095.
- [Google Scholar]
- Band gap reduction in ferroelectric BaTiO3 through heterovalent Cu-Te co-doping for visible-light photocatalysis. Front. Chem.. 2021;9:682979
- [Google Scholar]
- Synthesis and characterization of host (nanodimensional pores of zeolite-Y)–guest [unsaturated 16-membered octaaza–macrocycle manganese (II), cobalt (II), nickel (II), copper. Chem. Lett.. 2005;34(10):1444-1445.
- [CrossRef] [Google Scholar]
- Alumina-supported FeCl3, MnCl2, CoCl2, NiCl2, CuCl2, and ZnCl2 as catalysts for the benzylation of benzene by benzyl chloride. J. Mol. Catal. A Chem.. 2004;209(1–2):209-214.
- [CrossRef] [Google Scholar]
- Synthesis and characterization of ZnO nanocrystals from thermolysis of new precursor. Chem. Eng. J.. 2009;146(3):498-502.
- [CrossRef] [Google Scholar]
- Optical properties and electronic structure of amorphous Ge and Si. Mater. Res. Bull.. 1968;3:37-46.
- [Google Scholar]
- Photoluminescence and decay behavior of Tb3+ ions in sodium fluoro-borate glasses for display devices. J. Lumin.. 2012;132:1166-1170.
- [Google Scholar]
- Facile synthesis of SrTiO3/CoAlMnO4 nanocomposite: A rechargeable heterojunction photocatalyst with superior hydrogen storage capability. Int. J. Hydrogen Energy. 2022;47:31624-31637.
- [Google Scholar]
- Luminescence of Tb3Al5O12 phosphors co-doped with Ce3+/Gd3+ for white light-emitting diodes. Beilstein J. Nanotechnol.. 2019;10:1237-1242.
- [Google Scholar]
- Polymeric nanocomposite materials: preparation and characterization of star-shaped PbS nanocrystals and their influence on the thermal stability of acrylonitrile–butadiene. Polyhedron. 2011;30(6):1055-1060.
- [CrossRef] [Google Scholar]
- Energy transfer to Ce3+ ions in Tb3Al5O12: Ce single crystalline films. Radiat. Meas.. 2007;42:648-651.
- [Google Scholar]
- Luminescence and Tb3+–Ce3+–Eu3+ ion energy transfer in single-crystalline films of Tb3Al5O12: Ce. Eu garnet. Journal of luminescence.. 2008;128:652-660.
- [Google Scholar]
- Growth and luminescence properties of single-crystalline films of RAlO3 (R= Lu, Lu-Y, Y, Tb) perovskite. Phys. Solid State. 2009;51:1800-1808.
- [Google Scholar]


