

Translate this page into:
In-vitro hemolytic activity and free radical scavenging by sol-gel synthesized Fe3O4 stabilized ZrO2 nanoparticles
⁎Corresponding author. saira.cssp@pu.edu.pk (Saira Riaz)
-
Received: ,
Accepted: ,
This article was originally published by Elsevier and was migrated to Scientific Scholar after the change of Publisher.
Peer review under responsibility of King Saud University.
Abstract
Abstract
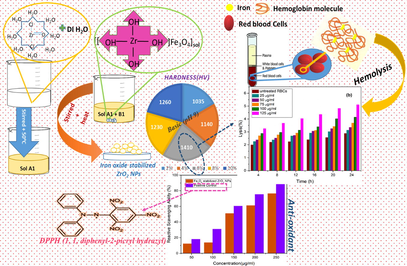
Sol-gel approach was used to synthesize Fe3O4 stabilized zirconia nanoparticles. XRD results showed mixed phases (i.e. monoclinic and tetragonal) for all wt% using acidic (pH 2) value while pure tetragonal phase of zirconia was observed with 6 wt% basic (pH 9) iron oxide. Maximum value of dielectric constant and minimum value of tangent loss was observed for 6 wt% basic iron oxide stabilized zirconia nanoparticles. Maximum value of hardness along with high fracture toughness was observed for basic 6% Fe3O4 stabilized zirconia. Optimized nanoparticles exhibited very weak hemolytic activity. Optimized nanoparticles showed maximum scavenging value (∼76) for antioxidant activity.
Abstract
Zirconia ceramics have attained much consideration owing to the amazing mechanical strength and white color. These properties provide an opportunity for the use in biomedical applications. In the present study, an application oriented sol-gel route was adapted for synthesis of zirconia nanoparticles. ZrOCl2·8H2O was used as a precursor, iron oxide (Fe3O4) nanoparticles (pH 2 & pH 9) as a stabilizer and de-ionized water was used as a solvent. Sol-gel synthesized iron oxide stabilized zirconia nanoparticles were prepared by varying concentrations of iron oxide nanoparticles in the range of 2–10 wt%. X-ray diffraction results showed mixed phases at all wt% with acidic pH value, while pure tetragonal phase of zirconia was observed for stabilization with 6 wt% basic iron oxide. Maximum value of dielectric constant (∼80 at log f = 4) and minimum value of tangent loss (∼0.66 at log f = 4) were observed for zirconia stabilized with basic 6 wt% iron oxide. Maximum value of hardness (1410 ± 10 HV) along with high fracture toughness were observed with optimized stabilization. Very weak hemolytic activity and maximum scavenging (∼76) antioxidant activity was observed under optimized conditions. Thus, it can be suggested that optimized nanoparticles, i.e. tetragonal zirconia stabilized with 6 wt% of basic Fe3O4, can be further useful for therapeutical and pharmaceutical applications.
Keywords
Hemolytic
Anti-oxidant
Sol-Gel
Fe3O4
ZrO2
Nanoparticles

1 Introduction
Metal oxide nanomaterials show not only amazing mechanical properties, low inherent toxicity, thermal properties, effective corrosion resistance, they also exhibit excellent biocompatibility (Oh et al., 2013; Johnston et al., 2010). Zirconium oxide (ZrO2) is one of the most efficiently used material to address the orthopedic and dental issues due to its high mechanical strength and fracture toughness along with chemical stability for tetragonally stabilized structural phase (Li et al., 2013; Bukhari et al., 2018). There are three phases of zirconia such as tetragonal zirconia (t-ZrO2), cubic zirconia (c-ZrO2), and monoclinic zirconia (m-ZrO2) (Li et al., 2013). These phases exhibit various temperature ranges to show their thermodynamic stability. Monoclinic phase is thermodynamically stable up to 1100 °C, metastable phase (tetragonal) shows stability in the range of 1100–2370 °C while cubic phase becomes stable at temperature more than the upper limit of tetragonal phase (Bukhari et al., 2018; Van der Put, 2013). Amongst all the phases of zirconia, tetragonal phase is good at mechanical properties but thermodynamic stability of the above said phase is big deal for researchers. There are various technical ways which can be adapted to stabilize the tetragonal phase. Relatively low and high temperature techniques have been used for tetragonal stability. High temperatures affect the samples immensely. In low temperature methods, size of the grain plays a vital role in phase stability and mechanical characteristics as well (Batool et al., in press; Krivtsov et al., 2013).
Silva et al. (2011) reported that ambient conditions are not supportive for stability of zirconia tetragonality. Stable tetragonal was observed with annealing at low temperature using Ce4+ ions. Few of the metal oxides, i.e. CaO, Y2O3 and CeO2, are reported to be used as room temperature zirconia stabilizer and also these metal oxides can improve its properties as well (Rodaev et al., 2019; Gautam et al., 2016). The key point behind the stabilization is charge imbalance (Lvov et al., 2003). Yttria is a very familiar and popular stabilizer up to now. Due to limited span of decay time its use is not good for cancer treatment and various therapeutical & pharmaceutical applications. Iron oxide is a suitable candidate to overcome the demerits of yttria. It is already reported that iron oxide is biocompatible and can yield the room temperature stabilized tetragonal zirconia (Bashir et al., 2015). Iron oxide based stabilized zirconia can be synthesized by ball milling, co-precipitation and sol–gel, etc. Sol-gel method is adapted in this work because of its various merits. It is energy saving method and properties of the material can be optimized by varying sol composition, pH and deposition time. It is an application oriented method to optimize the structure and particle/grain size (Bukhari et al., 2018; Batool et al., in press; Bashir et al., 2015).
Li et al. (2012) synthesized submicrometer-sized tetragonal zirconia spheres using carbon-assisted selective pulsed laser heating in liquid medium at room temperature. The raw zirconia particles showed monoclinic structure after milling with carbon even after 1100 °C annealing. However, the tetragonal structure was observed when certain energy level (e.g. 330 mJ/pulse cm2) was applied. Gupta et al. (1977) reported the formation of partially stabilized zirconia (PSZ) with low yttria content. Tetragonal phase, with high strength, was observed to be stable at higher temperature (∼1450 °C) after experiencing stress-induced phase transformation. Heshmatpour and Aghakhanpour (2011) prepared zirconia nanoparticles using glucose and fructose as organic additives. Zirconium n-propoxide was used as zirconium salt. Calcination temperature was varied as 300 °C, 500 °C and 700 °C for 3 h in furnace with static air atmosphere. XRD results showed both phases (tetragonal and monoclinic) with smaller crystallite size (10 nm−30 nm). Organic additives stabilized the tetragonal phase at calcination temperature of 700 °C with reduction in particle size. These organic additives prevented the phase transition and acted as capping agent. Borrell et al. (2013) prepared 3 mol% Y2O3-stabilized tetragonal zirconia using conventional and non-conventional sintering techniques. Average grain size for microwave (MW) sintered samples was in the range of 76–216 nm whereas for conventionally sintered (CS) samples it was about 270 nm. Materials prepared using MW and CS techniques exhibited Vickers hardness values 16.0 GPa and 13.4 GPa, respectively. Parera (1992) prepared acidic zirconia by using zirconium oxychloride salt. Ammonium hydroxide helped in precipitation formation. As prepared & hydrated ZrO2.n·H2O (n = 3.5–4.0) was dried and percolated at 383 K with sulphuric acid solution. Further heat treatment at 673 K and 893 K resulted in the amorphous and tetragonal phases of zirconia, respectively. Son et al. (2001) prepared zirconia by using various amounts of zirconium sulphate precursor. Stabilization of zirconia was observed after calcination at 500 °C with 10 wt% precursor content. Siddiqui et al. (2012) used sol–gel to prepare zirconia nanoparticles. Two salts i.e. ZrOCl2·8H2O and Zr(SO4)2·H2O) were used during synthesis, and calcination temperature was kept at 600 °C for 5 h. Sodium lauryl sulphate was used as a surfactant. Mixed phases of zirconia (tetragonal and monoclinic) were observed after calcination using both salts (Siddiqui et al., 2012). You et al. (2012) reported the amorphous behavior of sol–gel synthesized zirconia thin films at 600 °C. Wang et al. (2016) prepared zirconia nanoparticles using vapor phase hydrolysis process using different temperatures such as 400 °C, 500 °C and 600 °C. Mixed cubic and tetragonal phases of ZrO2 were observed under all conditions. Average diameter was calculated in the range of 40–30 nm. In vitro cytotoxicity evaluation along with hemolytic activity of ZrO2 NPs showed no cytotoxicity and negligible hemolytic response. Balaji et al. (2017) prepared zirconia NPs using eucalyptus globulus extract via green method and evaluated antioxidant & anticancer activity on human colon (HCT-116) and human lung (A-549) carcinoma cell lines. Zirconium oxychloride (ZrOCl2·8H2O) was used as precursor. Black colored precipitates were dried at 80 °C and annealed at 600 °C for 3 h to obtain crystalline zirconia nanoparticles (NPs). XRD pattern confirmed the formation of tetragonal phase with average crystallite size ∼ 9.6 nm. ZrO2 NPs showed less toxicity for HCT-116 cell lines and exhibited high scavenging inhibition of up to 85.6%.
In this research work, stabilization of zirconia nanoparticles (NPs) was achieved with variation in iron oxide content (i.e. 2–10%) in both acidic (pH 2) and basic (pH 9) media using cost effective sol–gel approach. Structural and dielectric properties of nanoparticles have been correlated with the variation in nature of the medium along with the content of iron oxide. Moreover, mechanical properties, hemolytic activity and antioxidant activity of optimized nanoparticles were also investigated.
2 Experimental work
Sol-gel method was used for the synthesis of acidic and basic iron oxide stabilized zirconia nanoparticles (NPs). 0.1 M stock solution was prepared by mixing salt of zirconium (ZrOCl2·8H2O) in deionized water. Stirring of mixed product was performed at 50 °C resulting in transparent sol named as A1. Pre-synthesized iron oxide, with acidic (pH 2) and basic (pH 9) pH, was used for stabilization and named as B1 and B2, respectively. Details of iron oxide synthesis have been reported earlier (Bashir et al., 2014, 2015) . Acidic iron oxide ‘B1′ with different weight percentages (2–10 wt% with interval of 2 wt%) was mixed in A1. Similarly, basic ‘B2′ iron oxide with different weight percentages (2–10 wt% with interval of 2 wt%) was mixed into sol A1. Iron oxide stabilized zirconia sols were further heated to get acidic and basic iron oxide stabilized zirconia nanoparticles.
3 Characterization techniques
Nanoparticles were characterized using X-Ray Diffractometer (XRD) Bruker D8 Advance with CuKα (1.5406 Å) radiations. Wayne Kerr (6500B) precision impedance analyzer was used for dielectric measurements. Shimadzu (HMV-2) Vickers micro indenter was used for hardness measurements. Hydraulic press was used for the formation of pellets. Dried powder was pressed into the circular shaped die (diameter = 10 mm) by applying pressure of 1.5 T for 90 s. Then press was released in one step and sample was taken out for measurements. Shimadzu IR Tracer −100 Fourier Transform Infra-red (FTIR) spectroscopy was used to analyze the vibrational modes. Hemolytic activity was performed on human blood. DPPH (1, 1, diphenyl-2-picryl hydrazyl) assay was utilized for analyzing antioxidant activity of Fe3O4 stabilized zirconia.
4 Results and discussions
4.1 Structural analysis
Fig. 1(a) shows XRD patterns of acidic iron oxide stabilized zirconia nanoparticles (NPs); iron content was varied from 2 to 10 wt%. Acidic iron oxide stabilized zirconia nanoparticles showed mixed phases such as monoclinic (m) and tetragonal (t) at all concentrations. Diffraction planes (0 1 1), (1 1 1) and (11
) at approximately 23.8°, 31.6° and 40.8° angles (2θo), respectively, belonged to monoclinic phase of zirconia. These planes showed good matching with JCPDS card no. 13–307. The diffraction planes (1 1 2), (2 0 2), (3 0 0), (1 1 3), (2 3 1), (4 0 0) and (3 3 0) at 43.1°, 49.2°, 52.9°, 58.5°, 68.7°, 73.6° and 78.2°, respectively represented the tetragonal phase and matched with JCPDS card no. 17–923. It has been reported that acidic nature of sol may lead to mixed structural phases because of the availability of excess of hydrogen cations (McGill et al., 2009).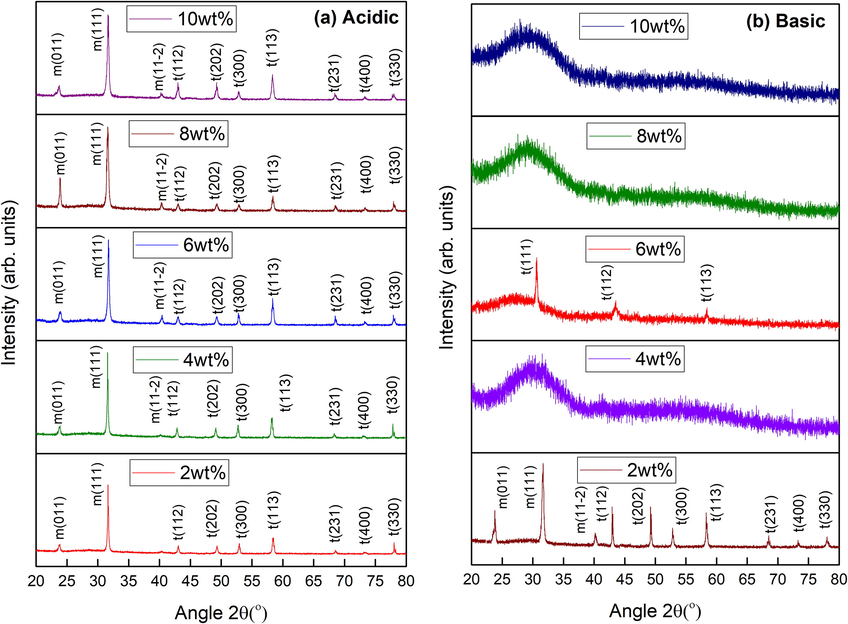
XRD results of (a) acidic and (b) basic Fe3O4 stabilized zirconia with different concentrations.
Fig. 1(b) shows the XRD pattern for basic iron oxide stabilized (2–10 wt%) zirconia nanoparticles (NPs). Mixed zirconia phases (m-ZrO2 and t-ZrO2) were seen by the addition of 2 wt% of basic iron oxide. Whereas, iron oxide contents of 4, 8 and 10 wt% lead to amorphous behavior along with a clear hump. These humps indicate the metastable phase (MSP) of tetragonal, with high strength, as reported earlier (Batool et al., in press). Presence of vacancies in zirconia lattice can lead to formation of metastable zirconia state with smaller crystallite size (Gorban et al., 2015). Mechanisms responsible for metastable state include variation in K.E. of molecules (Chin, 2013), lattice defects (Jose et al., 2010), vacancies (Liu et al., 2003; Dwivedi et al., 2011) and presence of amorphous content (Celzard and Mareche, 2000; Riaz et al., 2015). These mechanisms can be controlled by various factors, such as, pH of the sol, speciation process and precursor / solvent used during synthesis. Gorban et al. (2015) reported metastable phase of zirconia under fluoride & yttrium influence. Tyagi et al. (2006) reported metastable phase of tetragonal zirconia, using sol–gel method, at 400 °C. Batool et al. (in press) reported metastable zirconia phase under as-synthesized conditions that transformed to pure tetragonal phase after aging at room temperature. In the present study tetragonal phase of zirconia, along with metastable content, was observed at 6 wt% of basic iron oxide. The planes (1 1 1), (1 1 2) and (1 1 3) at 30.6°, 43.1° and 58.3° angles (2θo) matched with the JCPDS card no. 17–923. A clear and complete transition from monoclinic to tetragonal zirconia phase was observed in basic iron oxide having content of 6 wt%. This transition reveals the stabilization of zirconia. Further, this transition might have happened because of the excess hydroxyl ions at 6 wt% basic Fe3O4 content. Hydroxyl ions are responsible for the strong interactions at lower values of energy causing volumetric changes (Mishra et al., 2003) that may result in tetragonal rather than monoclinic phase. Chevalier’s model revealed that removal of hydroxyl ions can be a reason for reduced unit cell volume (Chevalier et al., 2009). The key factors that may affect the crystal can be energy of the grain boundary, energy and diffusion mechanism of the surface atoms (Imran et al., 2019). Garvie proposed that zirconium oxide’s phases may depend upon the size of the crystallite. It was also reported that stable tetragonal phase of zirconia was observed in crystals having size below 30 nm (Garvie, 1965).
Crystallite size was calculated using Williamson-Hall plot (Eq. (1)) (Riaz and Naseem, 2007; Slimani et al., 2019):
Where, 2ωf is taken in radians, K shows shape factor, λ is wavelength, e (=Δd/d) indicates microstrain formed in materials, D shows crystallite size and θ is Bragg angle.
Dislocation density was calculated using Eq. (2) (Cullity, 1956).
Where D denotes crystallite size.
Garvie Nicholson (G-N) method was employed to evaluate the tetragonal to monoclinic ratio content using formulae given in Eqs. (3)–(5) (Garvie and Nicholson, 1972).
Im & It represent peak intensity of monoclinic & tetragonal phase, respectively.
Variation in crystallite size, dislocation density and ratio of tetragonal to monoclinic of Fe3O4 stabilized ZrO2 nanoparticles is shown in Table 1. Relatively higher values of crystallite size were observed in case of acidic iron oxide concentrations used. Variation in crystallite size, i.e. 29 – 26 nm, was observed because of the varied tetragonal to monoclinic content for the samples prepared under acidic conditions [Table 1]. Crystallite size of ∼ 26 nm was observed for the sample with 2 wt% iron oxide content under basic condition. Whereas, smaller crystallite size (∼20 nm) was observed for basic nanoparticles with iron oxide content of 6 wt%. This reduced value was observed because of the restructuring process leading to a phase transition from mixed (tetragonal-monoclinic) phases to phase pure tetragonal zirconia for 6 wt% iron content as shown in Fig. 1. Further, it has been reported previously that addition of iron oxide during synthesis under basic condition can lead to a smaller crystallite size with stabilized structure (Bashir et al., 2014).
pH
Iron oxide content (wt %)
Crystallite size (nm)
Dislocation density (lines/ m2 ×1015)
Tetragonal : Monoclinic Content (t:m)
Acidic
2
29.5
1.15
12:88
4
25.9
1.49
35:65
6
26.3
1.45
39:61
8
24.8
1.63
32:68
10
26.4
1.43
41:59
Basic
2
26.28
1.45
51:49
4
Amorphous (MSP)
Amorphous
Amorphous
6
20.01
2.49
100:0
8
Amorphous (MSP)
Amorphous
Amorphous
10
Amorphous (MSP)
Amorphous
Amorphous
4.2 Dielectric analysis
Dielectric investigations need to be carried out for any oxide nanomaterial before application in a particular field including biomedical. Dielectric constant [Fig. 2(a-b)] and tangent loss [Fig. 3(a-b)] calculations were carried out using Eqs. (6) and (7), respectively (Poole, 2004).
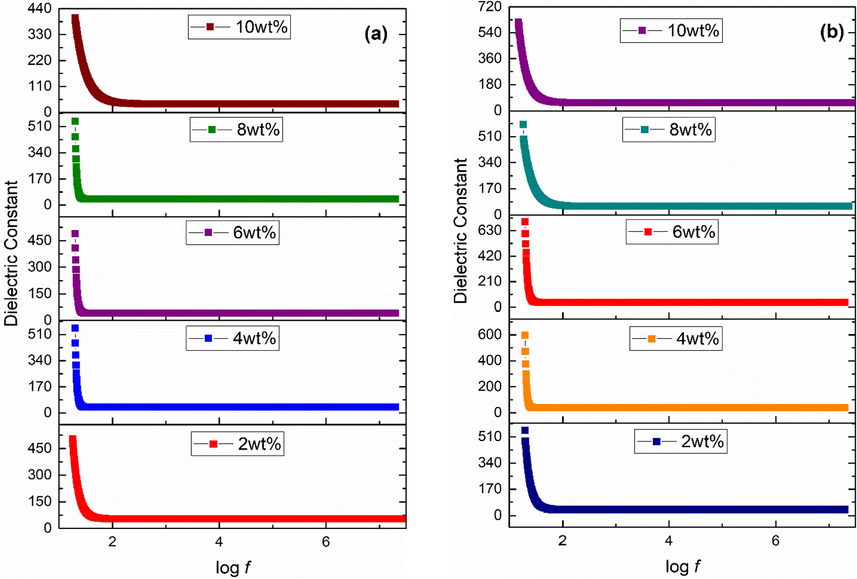
Dielectric constant of (a) acidic (b) basic Fe3O4 stabilized ZrO2 nanoparticles.
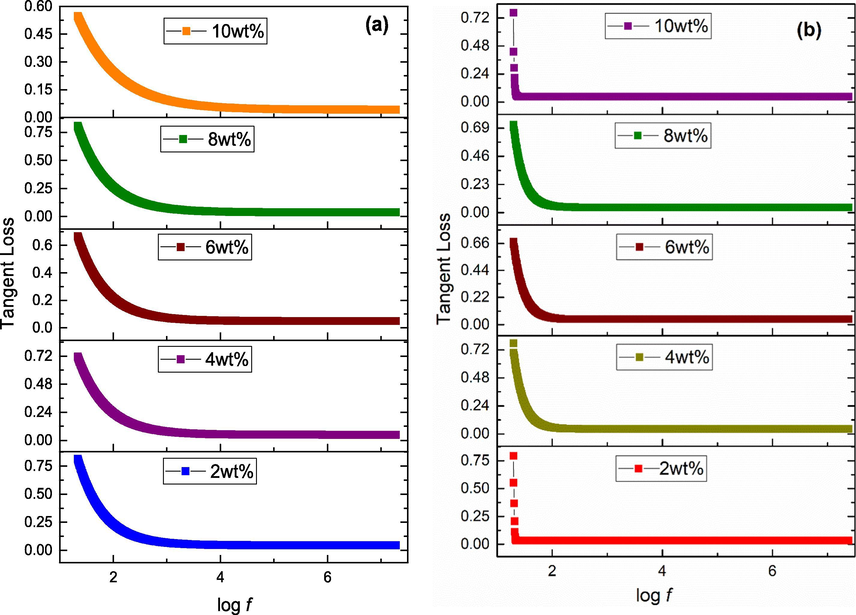
Tangent loss of (a) acidic (b) basic Fe3O4 stabilized ZrO2 nanoparticles.
Where,
C, d, , A, f and ρ are capacitance, thickness of specimen, free space permittivity, area, frequency & resistivity, respectively.
In order to measure the dielectric properties, iron oxide stabilized zirconia powder was converted into pellets having diameter of 10 mm. Figs. 2(a-b) and 3(a-b) show variation of dielectric constant and tangent loss, respectively, for samples in frequency range (i.e. 20 Hz − 20 MHz). Dielectric constant and tangent loss usually show two types of dispersion trend with applied frequency (Koops, 1951). One of them is normal dispersion and second is anomalous dispersion trend. Normal dispersion trend was observed in the present study. Value of dielectric constant is high at low frequency region and then decreases as frequency increases, and finally becomes constant at high frequency region. This type of dispersion is according to Maxwell-Wagner type of interfacial polarization and related with Koop's phenomenological theory (Koops, 1951). Grains have low electrical resistance while grain boundaries have high resistance. Maxwell-Wagner interfacial polarization appears in grain boundaries due to charge accumulation in high resistive boundaries. In low frequency region, grain boundaries (poorly conductive) are effective due to their interior morphological defects while in high frequency region, grains (highly conductive) are effective (Halder et al., 2019). Thus, decreased behavior of dielectric in high frequency region is attributed to interior grains as hopping of charge carriers do not follow external field reversal even for very short time (Kotnala et al., 2012). Moreover, at high frequency region, interfacial polarization weakens, and dielectric constant values become nearly constant. High dielectric constant (∼80) at log f = 4 for 6 wt% basic Fe3O4 stabilized zirconia can be correlated with pure tetragonal phase of zirconia [Fig. 1(b)]. The values obtained are favorable for therapeutical applications.
Fig. 4 (a-b) shows conductivity behavior of the acidic and basic Fe3O4 stabilized zirconia nanoparticles. Its trend can be divided into two regions. Conductivity showed constant response at lower frequency (log f < 7.3) values named as d.c. like conductivity. Free charge carriers present in dielectric medium cause this type of conductivity. When frequency becomes higher (log f > 7.3) then conductivity alters its behavior and shows variations with frequency. This type of conductivity is named as a.c. conductivity; attributed to bound charges present in the material. These bound charges start hopping across potential wells. At higher frequencies, hopping process is synchronized and an increasing trend in conductivity is observed. Values of a.c. conductivity are calculated using Eq. (8) (Poole, 2004).
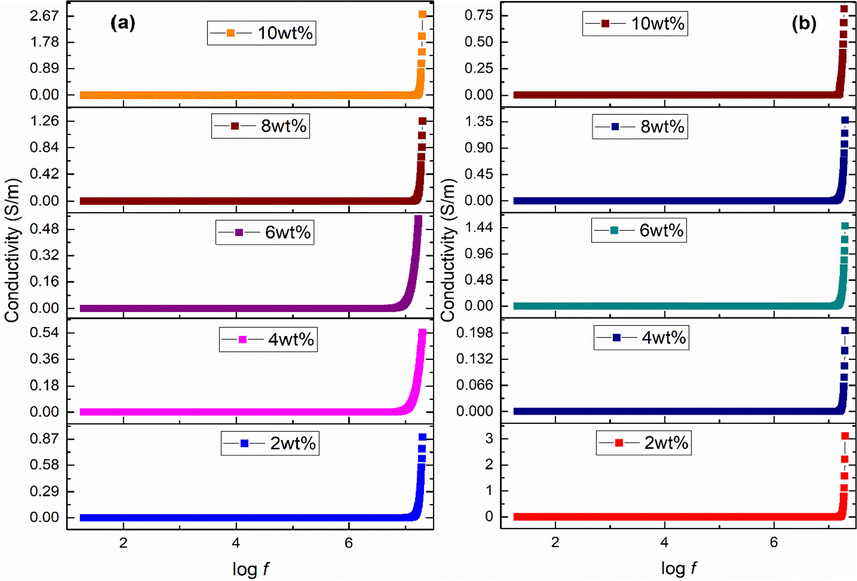
Conductivity of (a) acidic (b) basic Fe3O4 stabilized ZrO2 nanoparticles.
It is observed that values of conductivity increased with increase in acidic iron oxide content. It is minimum (0.87 S/m) at 2 wt% and maximum (2.67 S/m) at 10 wt%. Values of a.c. conductivity became smaller i.e. 0.22, 1.39 and 0.9 S/m with amorphous zirconia for 4, 8 and 10 wt% of basic iron oxide content. Conductivity of 3.2 and 1.8 S/m was observed for 2 wt% (mixed phases) and 6 wt% (pure tetragonal phase) of basic iron oxide content.
Presence of grains and grain boundaries play vital role in the study of dielectric materials. Impact of grains and grain boundaries can be understood with the help of Cole-Cole plot [Fig. 5(a-b)] that can be obtained by drawing real part of impedance along horizontal (x-axis) line and imaginary part of impedance along vertical (y-axis) line. Usually an ideal Cole-Cole is comprised of three semicircles. These can be distinguished by their frequency ranges. Semicircles lying at high, mid and low frequencies represent the opposition offered due to grains, grain boundaries and interfaces, respectively (Prasad et al., 2012). In the present work, only one semicircle was found that is an indication of presence of high values of grain boundaries resistance as reported in literature (Mazen and Abu-Elsaad, 2016).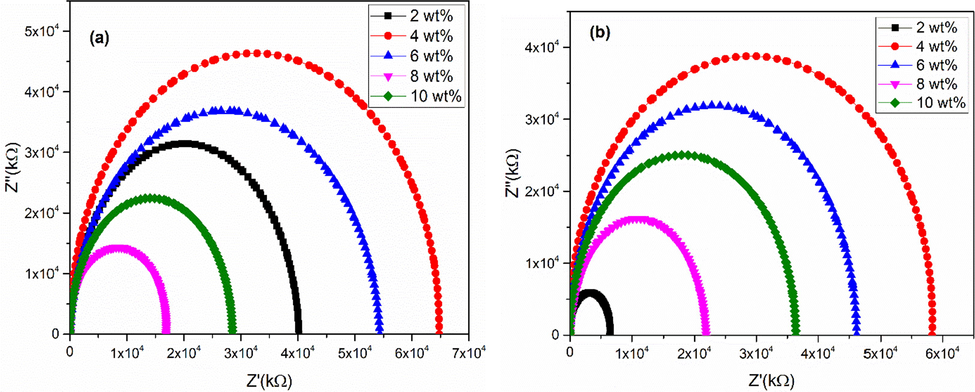
Cole-Cole plots of (a) acidic and (b) basic Fe3O4 stabilized ZrO2 nanoparticles.
4.3 FTIR analysis
Fig. 6 exhibits FTIR spectra for 2, 4, 6, 8 and 10 wt% of Fe3O4 stabilized zirconia in acidic [Fig. 6(a)] & basic [Fig. 6(b)] media. In acidic media, for all variations (2–10 wt%), bands of both monoclinic and tetragonal phases are present. Vibrations at 470 cm−1 and 668 cm−1 corresponded to monoclinic, whereas vibration of tetragonal was observed at 510 cm−1 and can be related with XRD analysis [Fig. 1(a)]. In basic media, both monoclinic (470 cm−1 and 670 cm−1) and tetragonal (510 cm−1) bands appeared for 2 wt% of iron oxide content. Whereas, strong band observed at 510 cm−1 for basic nanoparticles, with rest of the concentrations, was related with pure tetragonal phase of zirconia that is consistent with XRD results. Bands of monoclinic and tetragonal matched with the values reported in literature (Bollino et al., 2017; Răileanu et al., 2015). Furthermore, both acidic & basic media have bands in 1300–1500 cm−1 region which are due to C = C (Lopez et al., 2007). Small bands at 1695 cm−1 and 1697 cm−1 are related to C-H bending vibration (Sidhu et al., 2015). Also, band at 2357 cm−1 is related to CO2 trapped during oxides formation (Kasimayan et al., 2020).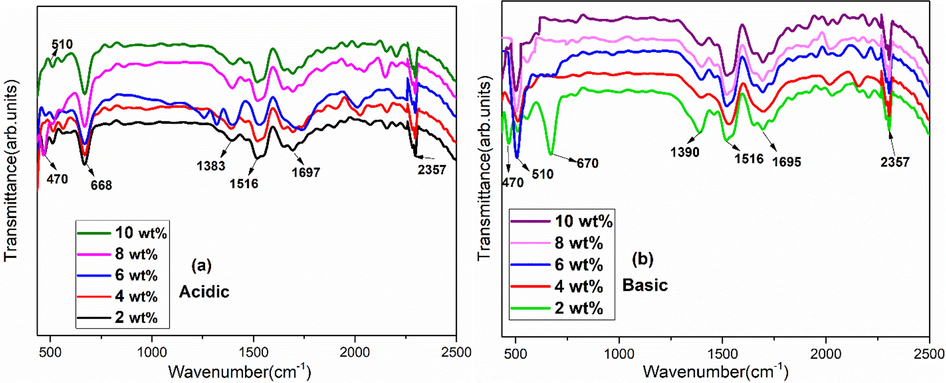
FTIR of Fe3O4 stabilized zirconia in (a) acidic and (b) basic media for various concentrations.
4.4 Mechanical properties
Table 2 reveals the behavior of hardness for acidic and basic Fe3O4 stabilized zirconia with different concentrations. Hardness is an ability of the material to resist the indent mark on surface of the material. In polycrystalline powders hardness exhibits usually inverse relation with grain size. In this work, load of 4.9 N was applied for 15 s (as per ASTM C-1327–99) to engrave the indent. Maximum value of hardness (1410 ± 10 HV) and fracture toughness was observed for zirconia stabilized with 6 wt% iron oxide. This value was observed for pure tetragonal phase as shown in XRD data [Fig. 1(b)]. Thus, basic 6 wt% stabilized zirconia nanoparticles were further used for hemolysis and antioxidant activity. *4.9N, **15 s.
Iron oxide concentration (%)
Acidic/basic
Hardness Vickers (HV) at constant load* and time**
Fracture toughness (MPa m−1/2)
Zirconia phase
2
Acidic
740 ± 3.7
18.83 ± 0.09
Monoclinic-tetragonal
4
Acidic
930 ± 4.65
18.87 ± 0.09
Monoclinic-tetragonal
6
Acidic
960 ± 4.8
19.13 ± 0.09
Monoclinic-tetragonal
8
Acidic
1030 ± 5.15
19.72 ± 0.09
Monoclinic-tetragonal
10
Acidic
1120 ± 5.6
19.93 ± 0.09
Monoclinic-tetragonal
2
Basic
1035 ± 5.175
19.24 ± 0.09
Monoclinic-tetragonal
4
Basic
1140 ± 5.7
20.74 ± 0.10
Amorphous (MSP)
6
Basic
1410 ± 7.05
22.93 ± 0.11
Tetragonal
8
Basic
1230 ± 6.15
20.85 ± 0.10
Amorphous (MSP)
10
Basic
1260 ± 6.3
20.97 ± 0.10
Amorphous (MSP)
4.5 Hemolysis activity
In hemolysis process, rupturing of red blood cells (RBCs) membrane leads to release of hemoglobin into the plasma. Thus, it is very crucial to study the effect of nanoparticles during hemolysis process. For hemolytic activity, human blood samples (ethically approved) were collected from blood bank and stored in vacutainer tubes with coating of EDTA (Ethylenediaminetetraacetic acid) to avoid coagulation. These samples were centrifuged at 2000 rpm for 20 min, and upper yellowish liquid i.e. plasma was discarded according to safety rules. Remaining blood cells were washed with phosphate buffer solution (pH 7.4), various times. After washing step, red blood cells (RBCs) were resuspended with phosphate buffered saline solution (PBS). RBCs suspension was treated with different Fe3O4 stabilized zirconia concentrations. For hemolysis assay, stock solution was prepared with concentration twenty times the highest final concentration to be tested (10 μL of sample with 190 μL diluted RBCs) (Mukhopadhyay et al., 2019; Neun et al., 2018; Singh et al., 2020). The concentration was selected based on the plasma concentration at the intended therapeutic dose. This concentration is termed as theoretical plasma concentration. This whole procedure is based on ASTM E2524-08 standard (ASTM E2524–08, 2013).
Appropriate amount of stock solution was poured into the 96-well plates (V-bottom) to achieve final concentrations of 25 μg/ml, 50 μg/ml, 75 μg/ml, 100 μg/ml and 125 μg/ml. Blood volume constitutes ∼ 8% of body weight, e.g. 70 kg human has ∼ 5.6 L of blood. Therefore, the concentration for in-vitro analysis of samples was based on the ratio of dose per blood volume, thus the maximum concentration of 125 µg/ml was obtained (Dobrovolskaia and McNeil, 2013). For optimization and comparative purposes, each sample was taken in duplicate wells. For positive (+ve) control 10 μL of doxorubicin (DOX), with 10 mg potency, was added into RBCs and incubated. RBCs treated with 10 μL of phosphate buffer solution (PBS) were considered as negative (−ve) control (Kotnala et al., 2012) (Rajapriya et al., 2020). Plates were incubated at 37 °C for 1 h and then centrifuged at 5000 rpm for 5 min. Using a multichannel pipet, 100 μL of supernatant was transferred from each well into a clear, flat bottomed 96-well plate. Absorbance readings were observed for supernatants as reported previously (Singh et al., 2020). Equation (9) was used to find out the percentage of hemolysis using absorbance values recorded at 540 nm.
Here As, A+ and Ao represent absorbance of RBCs treated with nanoparticles, absorbance of positive control and absorbance of negative control, respectively.
Results obtained after performing hemolytic activity showed that hemolysis activity was concentration dependent. Maximum hemolysis (∼5.11%) was achieved by using highest concentration i.e. 125 μg/ml as shown in Fig. 7(a-b). While less than 5% of hemolytic activity was observed for all lower concentrations which is safe to be used according to previous studies (Vinotha et al., 2019; Abinaya et al., 2018). Results based on percentage of hemolysis activity showed that low concentration of nanoparticles was non-toxic and biocompatible. Without assessment of hemolysis activity, use of synthesized nanoparticles could be dangerous with uncontrolled conditions.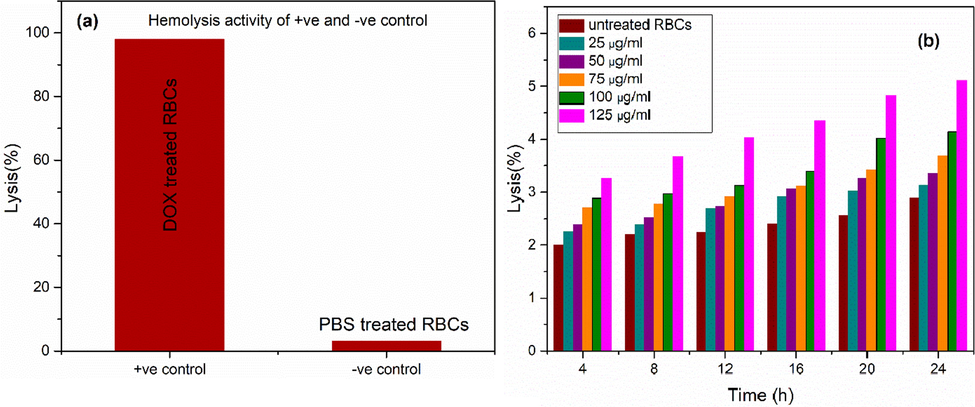
Hemolysis activity of (a) positive ‘+ve’ and negative ‘−ve’ control, (b) untreated RBCs and optimized sample at various concentrations.
4.6 Antioxidant activity
Increased demand for antioxidants, in past few years, was observed due to their ability to control diseases and improve human health. Compound that prevents cells from damage of reactive oxygen species (ROS) is termed as an antioxidant. ROS contain free radicals that are reactive molecules. These ROS can cause many diseases and lead to cell damage. Therefore, there is need to scavenge the toxic free radicals and thereby prevent the cells from oxidative damage. Thus, in the present study, the antioxidant activity was carried out using DPPH (1, 1, Diphenyl-2-picryl hydrazyl) assay to investigate the percentage of scavenging capacity (Grune et al., 2001). Various concentrations (50 µg/ml, 100 µg/ml, 150 µg/ml, 200 µg/ml, 250 µg/ml) of optimized Fe3O4 stabilized ZrO2 NPs were mixed in methanol. 1 ml of DPPH solution was added into 3 ml methanol solution in all concentrations. These solutions were kept in incubator at 37 °C under dark conditions. Regulation of free radical-scavenging process was confirmed by color changes from intense purple to yellow. Decoloration was observed as DPPH neutralized on gaining Hydrogen (H) atom from the antioxidant material (Oueslati et al., 2018). Further, this decoloration activity of DPPH showed the antioxidant ability (i.e. damage of ROS) of optimized Fe3O4 stabilized zirconia. Absorbance peak of control sample, measured by UV–visible spectrophotometer, was observed at ∼ 517 nm. The percentage of radical scavenging ability (RSA) was measured using Eq. (10).
Where, Acontrol is the absorbance of DPPH without sample and Asample is the absorbance of DPPH with sample.
Result of radical scavenging ability of Fe3O4 stabilized zirconia nanoparticles in comparison with positive control are shown in Fig. 8. Radical scavenging ability or inhibition of ROS increased with increasing concentration of Fe3O4 stabilized zirconia nanoparticles. It is observed that optimized Fe3O4 stabilized zirconia nanoparticles demonstrated ∼ 76% scavenging inhibition capability. Higher antioxidant activity is because of the effective transferring of electron density of oxygen atom (present in ZrO2) towards odd electrons positioned at nitrogen atom (present in DPPH) (Balaji et al., 2017). Addition of iron oxide in zirconia (as a stabilizer) helped in effective electron transfer, thus, enhanced antioxidant activity of Fe3O4 stabilized zirconia nanoparticles was observed.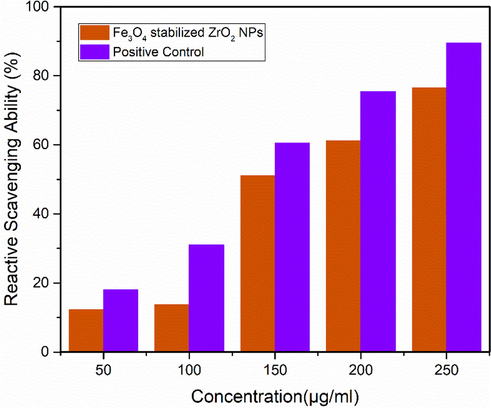
Comparison study of antioxidant activity of optimized sample of Fe3O4 stabilized zirconia and positive control.
5 Conclusions
Acidic (pH 2) and basic (pH 9) Fe3O4 stabilized zirconia nanoparticles were synthesized by sol–gel method. Content of acidic and basic Fe3O4, used as stabilizer, was varied in the range of 2–10 wt%. XRD results showed that Fe3O4 stabilized zirconia nanoparticles exhibited mixed phases for all concentrations of acidic media. Whereas, Fe3O4 stabilized zirconia with basic content of 6 wt% showed pure tetragonal phase. Maximum value of dielectric constant (∼80 at log f = 4) and minimum value of tangent loss was observed for zirconia stabilized with 6 wt% basic iron oxide. Maximum value of hardness (1410 ± 10 HV) along with high fracture toughness was observed under optimized conditions. Optimized nanoparticles exhibited very small hemolysis tendency and maximum scavenging value (∼76) for antioxidant activity.
Acknowledgement
Authors of serial 1 are thankful to Higher Education Commission (HEC) for research grant provided to the COE in Solid State Physics. Authors are thankful to Ghurki trust teaching hospital for providing bio ethically approved blood samples and procedures.
Declaration of Competing Interest
The authors declare that they have no known competing financial interests that could have appeared to influence the work reported in this paper.
References:
- Bacterial exopolysaccharide (EPS)-coated ZnO nanoparticles showed high antibiofilm activity and larvicidal toxicity against malaria and Zika virus vectors. J. Trace Elem. Med Biol.. 2018;45:93-103.
- [Google Scholar]
- ASTM E2524-08, 2013. Standard test method for analysis of hemolytic properties of nanoparticles. ASTM Int, West Conshohocken, PA.
- Nano-zirconia–evaluation of its antioxidant and anticancer activity. J. Photochem. Photobiol., B. 2017;170:125-133.
- [Google Scholar]
- Magnetic Properties of Fe3O4 Stabilized Zirconia. IEEE Trans. Magn.. 2014;50(8):1-4.
- [Google Scholar]
- Fe3O4 stabilized zirconia: structural, mechanical and optical properties. J. Sol-Gel Sci. Technol.. 2015;74(2):281-289.
- [Google Scholar]
- Microwave Assisted Sol-Gel Synthesis of Bioactive Zirconia Nanoparticles – Correlation of Strength and Structure. J. Mech. Behav. Biomed. Mater. 2020104012
- [CrossRef] [Google Scholar]
- Zirconia/hydroxyapatite composites synthesized via Sol-Gel: Influence of hydroxyapatite content and heating on their biological properties. Materials. 2017;10(7):757.
- [Google Scholar]
- Microwave sintering of zirconia materials: mechanical and microstructural properties. Int. J. Appl. Ceram. Technol.. 2013;10(2):313-320.
- [Google Scholar]
- Honey mediated microwave assisted sol–gel synthesis of stabilized zirconia nanofibers. J. Sol-Gel Sci. Technol.. 2018;87(3):554-567.
- [Google Scholar]
- Applications of the sol–gel process using well-tested recipes. J. Chem. Edu.. 2000;79:854-859.
- [Google Scholar]
- The tetragonal-monoclinic transformation in zirconia: lessons learned and future trends. J. Am. Ceram. Soc.. 2009;92(9):1901-1920.
- [Google Scholar]
- The phase transformation and crystallization kinetics of (1–x) Li2O–xNa2O–Al2O3–4SiO2 glasses. Thermochimica.. 2013;567:93-99.
- [Google Scholar]
- Elements of X-ray Diffraction. Addison-Wesley Publishing; 1956.
- Understanding the correlation between in vitro and in vivo immunotoxicity tests for nanomedicines. J. Control. Release. 2013;172(2):456-466.
- [Google Scholar]
- Microwave assisted sol–gel synthesis of tetragonal zirconia nanoparticles. J. Alloys. Compd.. 2011;509:6848-6851.
- [Google Scholar]
- The occurrence of metastable tetragonal zirconia as a crystallite size effect. J. Phys. Chem.. 1965;69(4):1238-1243.
- [Google Scholar]
- Zirconia based dental ceramics: Structure, mechanical properties, biocompoatibility and applications. Dalton Transactions. 2016;45:19194-19215.
- [CrossRef] [Google Scholar]
- Formation of metastable tetragonal zirconia nanoparticles: Competitive influence of the dopants and surface state. J. Solid. State. Chem.. 2015;232:249-255.
- [Google Scholar]
- Age-related changes in protein oxidation and proteolysis in mammalian cells. J. Gerontol. Ser. A: Biol. Sci. Med. Sci.. 2001;56(11):B459-B467.
- [Google Scholar]
- Stabilization of tetragonal phase in polycrystalline zirconia. J. Mater. Sci.. 1977;12(12):2421-2426.
- [Google Scholar]
- Structural, dielectric and electrical characteristics of lead-free electro-ceramic: Bi (Ni2/3Ta1/3)O3. Eng. Sci. Technol., Int. J.. 2019;22(1):376-384.
- [Google Scholar]
- Synthesis and characterization of nanocrystalline zirconia powder by simple sol–gel method with glucose and fructose as organic additives. Powder Technol.. 2011;205(1–3):193-200.
- [Google Scholar]
- Microwave assisted synthesis and antimicrobial activity of Fe3O4-doped ZrO2 nanoparticles. Ceram. Int.. 2019;45(8):10106-10113.
- [Google Scholar]
- Bioavailability of nanoscale metal oxides TiO2, CeO2, and ZnO to fish. Environ. Sci. Technol.. 2010;44(3):1144-1151.
- [Google Scholar]
- Oxide surface modification: synthesis and characterization of zirconia-coated alumina. J. Colloid. Interface. Sci.. 2010;343:256-262.
- [Google Scholar]
- In-situ DRIFT investigation of photocatalytic reduction and oxidation properties of SiO2@α-Fe2O3 core-shell decorated RGO nanocomposite. Sci. Rep.. 2020;10(1):1-13.
- [Google Scholar]
- Koops, C.G., 1951. On the dispersion of resistivity and dielectric constant of some semiconductors at audiofrequencies. Phys. Rev., 83(1), 121; Al-Hilli, M.F. (2016). Characteristics of AC. Conductivity and Dielectric Behavior of Cu0. 5Ti0.5HoxFe2-xO4 Ferrites. Iraqi J. Sci., vol. 57, 3C, pp. 2245-2251.
- Study of dielectric and ac impedance properties of citrate-gel synthesized Li0.35Zn0.3Fe2.35O4 ferrite. J. Sol-Gel Sci. Technol.. 2012;64(1):149-155.
- [Google Scholar]
- Properties and segregation stability of the composite silica-zirconia xerogels prepared via “acidic” and “basic” precipitation routes. J. Non-Cryst. Solids. 2013;362:95-100.
- [Google Scholar]
- Effect of reaction temperature on crystallization of nanocrystalline zirconia synthesized by microwave-hydrothermal process. J. Alloy. Compd.. 2013;561:23-27.
- [Google Scholar]
- Tetragonal zirconia spheres fabricated by carbon-assisted selective laser heating in a liquid medium. Nanotechnology. 2012;23(11):115602
- [Google Scholar]
- Preliminary synthesis and characterization of mesoporous nanocrystalline zirconia. J. Nat. Gas. Chem.. 2003;12:161-166.
- [Google Scholar]
- Esterification and transesterification on tungstated zirconia: Effect of calcination temperature. J. Catal.. 2007;247(1):43-50.
- [Google Scholar]
- Progress on yttria-stabilized zirconia sensors for hydrothermal pH measurements. Chem. Geol.. 2003;198(3–4):141-162.
- [Google Scholar]
- AC impedance studies on Li0.5+0.5x GexFe2.5−1.5xO4 system. Appl. Phys. A. 2016;122(1):26.
- [Google Scholar]
- Magnetically responsive nanoparticles for drug delivery applications using low magnetic field strengths. IEEE Trans. Nanobiosci.. 2009;8(1):33-42.
- [Google Scholar]
- Mishra, M.K., Tyagi, B., Jasra, R.V., 2003. Effect of synthetic parameters on structural, textural, and catalytic properties of nanocrystalline sulfated zirconia prepared by sol− gel technique. Industr. Eng. Chem. Res., 42(23), 5727-5736; Ahmad, R., Riaz, S., Khaleeq-ur-Rehman, M., Naseem, S., 2016. Effect of pH on structural and dielectric properties of zirconia nanocrystallites. In: World Congress on Advances in Civil, Environmental and Materials Research (ACEM’16), Korea.
- Synthesis and compatibility evaluation of versatile mesoporous silica nanoparticles with red blood cells: an overview. RSC Adv.. 2019;9(61):35566-35578.
- [Google Scholar]
- Updated method for in vitro analysis of nanoparticle hemolytic properties. In: Characterization of Nanoparticles Intended for Drug Delivery (91–102). New York, NY: Humana Press; 2018.
- [Google Scholar]
- Effect of transition metal dopants on mechanical properties and biocompatibility of zirconia ceramics. J. Nanosci. Nanotechnol.. 2013;13(6):4252-4255.
- [Google Scholar]
- Catalytic, antioxidant and anticancer activities of gold nanoparticles synthesized by kaempferol glucoside from Lotus leguminosae. Arabian J. Chem.. 2018;13(1):3112-3122.
- [Google Scholar]
- Promotion of zirconia acidity by addition of sulfate ion. Catal. Today. 1992;15(3–4):481-490.
- [Google Scholar]
- Encyclopedic dictionary of condensed matter physics. Academic Press; 2004.
- Prasad, N.V., Prasad, G., Kumar, G.S., Karmakar, S., Gupta, S.M., 2012. Electrical relaxation studies on lanthanum and vanadium modified Bi4Ti3O12. Ferroelectrics, 437(1), 88-102; Tahir, M., Riaz, S., Ahmad, N., Khan, U., Atiq, S., Iqbal, M.J., Naseem, S., 2019. Anomalous dielectric behavior and correlation of barrier hopping mechanism with ferroelectricity in solvent assisted phase pure bismuth iron oxide nanoparticles. Mater. Res. Bull., 119, 110543.
- Sol-gel zirconia-based nanopowders with potential applications for sensors. Ceram. Int.. 2015;41(3):4381-4390.
- [Google Scholar]
- Synthesis and Characterization of Zinc Oxide Nanoparticles Using Cynara scolymus Leaves: Enhanced Hemolytic, Antimicrobial, Antiproliferative, and Photocatalytic Activity. J. Cluster Sci.. 2020;31:791-801.
- [Google Scholar]
- Synthesis of stabilized zirconia hollow nanoparticles: sugar as a template. J. Sol-Gel. Sci. Technol.. 2015;74:275-280.
- [Google Scholar]
- Effect of reaction temperature and time on the structural properties of Cu(In, Ga)Se2 thin films deposited by sequential elemental layer technique. J. Mater. Sci. Technol.-shenyang. 2007;23(4):499.
- [Google Scholar]
- Microstructure and Phase Composition of Yttria-Stabilized Zirconia Nanofibers Prepared by High-Temperature Calcination of Electrospun Zirconium Acetylacetonate/Yttrium Nitrate/Polyacrylonitrile Fibers. Fibers. 2019;7(10):82.
- [Google Scholar]
- Effects of precursor on the morphology and size of ZrO2 nanoparticles, synthesized by sol-gel method in non-aqueous medium. Mater. Res.. 2012;15(6):986-989.
- [Google Scholar]
- Photoluminescence quenching of Zirconia nanoparticle by surface modification. Appl. Surf. Sci.. 2015;334:216-221.
- [Google Scholar]
- Diesel/biodiesel soot oxidation with CeO2 and CeO2-ZrO2-modified cordierites: a facile way of accounting for their catalytic ability in fuel combustion processes. Quim. Nova. 2011;34(5):759-763.
- [Google Scholar]
- Singh, N., Sahoo, S.K., Kumar, R., 2020. Hemolysis tendency of anticancer nanoparticles changes with type of blood group antigen: An insight into blood nanoparticle interactions. Mater. Sci. Eng.: C, 109, 110645, 1-10.
- Hemolysis tendency of anticancer nanoparticles changes with type of blood group antigen: An insight into blood nanoparticle interactions. Mater. Sci. Eng., C. 2020;109(110645):1-10.
- [Google Scholar]
- Slimani, Y., Almessiere, M.A., Hannachi, E., Baykal, A., Manikandan, A., Mumtaz, M., Azzouz, F.B., 2019. Influence of WO3 nanowires on structural, morphological and flux pinning ability of YBa2Cu3Oy superconductor. Ceram. Int., 45(2), 2621-2628; Klug, H.P., Alexander, L.E. X-ray diffraction procedures for polycrystalline and amorphous materials, Wiley and Sons, New York, 1974.
- Characterization of zirconium sulfate supported on zirconia and activity for acid catalysis. Bull. Korean Chem. Soc.. 2001;22(12):1309-1315.
- [Google Scholar]
- Synthesis of nanocrystalline zirconia using sol− gel and precipitation techniques. Ind. Eng. Chem. Res.. 2006;45:8643-8650.
- [Google Scholar]
- Van der Put, P. J. (2013). The inorganic chemistry of materials: How to make things out of elements. Springer Science & Business Media; Stuart, S. (2013). Zirconia: MMR. Elsevier.
- Synthesis of ZnO nanoparticles using insulin-rich leaf extract: Anti-diabetic, antibiofilm and anti-oxidant properties. J. Photochem. Photobiol., B. 2019;197:111541
- [Google Scholar]
- Good biocompatibility and sintering properties of zirconia nanoparticles synthesized via vapor-phase hydrolysis. Sci. Rep.. 2016;6(1):1-9.
- [Google Scholar]
- Facile preparation of sol–gel-derived ultrathin and high-dielectric zirconia films for capacitor devices. Appl. Surf. Sci.. 2012;258(24):10084-10088.
- [Google Scholar]


