

Translate this page into:
Influence of magnetite on the leaching of chalcopyrite in sulfuric acid
⁎Corresponding author. yangwei@xauat.edu.cn (Wei Yang)
-
Received: ,
Accepted: ,
This article was originally published by Elsevier and was migrated to Scientific Scholar after the change of Publisher.
Peer review under responsibility of King Saud University.
Abstract
Magnetite is one of the common associated minerals of chalcopyrite. However, so far, no studies have elucidated the effect of magnetite on the dissolution behaviors of chalcopyrite. In this paper, the impact of magnetite on the dissolution of chalcopyrite in sulfuric acid was investigated by leaching experiments, electrochemical measurements, XRD, Raman, and FTIR techniques. Results show that the presence of magnetite significantly enhances the dissolution of chalcopyrite. Different additions of magnetite in the leaching system of chalcopyrite contribute to remarkable differences in the redox potentials. When 0.5 g of magnetite was added, the redox potential was maintained in the range of 650–700 mV (vs. SHE) where chalcopyrite was reduced to chalcocite and then oxidized to Cu2+. But for magnetite additions of 1 g and 2 g, the redox potential exceeded the appropriate range for chalcocite formation, so the dissolution of chalcopyrite was dominated by the direct oxidation by Fe3+. Electrochemical measurements verified the existence of the galvanic interaction between magnetite and chalcopyrite, but its effect is much less than that of iron ions on chalcopyrite dissolution. The study suggests that copper extraction of chalcopyrite can be improved by the addition of proper amount of magnetite.
Keywords
Chalcopyrite
Magnetite
Enhanced leaching
Redox potential
Electrochemical measurements

1 Introduction
Chalcopyrite (CuFeS2), which represents approximately 70% of known copper reserves, is regarded as the most abundant and refractory primary copper ore in the world (Panda et al., 2012). With the global focus on the problems of carbon peak and carbon neutrality (Zhang et al., 2022), traditional pyrometallurgical processes will no longer be persistently researched and applied to extracting valuable metal from these copper sulfides. Compared with the traditional pyrometallurgy process, hydrometallurgy has such advantages as a simple process and low energy consumption. Over the years, a lot of researches have been conducted on the hydrometallurgy of chalcopyrite (Adamou et al., 2019; P. Baláž et al., 2005; Tian et al., 2021; Zhao et al., 2017). Due to the relatively high crystal lattice energy, chalcopyrite exhibits slow dissolution kinetics in hydrometallurgy. There have been extensive studies on efficient methods for extracting copper from chalcopyrite, including bioleaching (Gu et al., 2013; Panda et al.,2015), metal ions catalysis (Al-Harahsheh et al., 2008; Lu and Dreisinger, 2013; Qin et al., 2013; Vilcáez et al., 2009), adding surfactants (Zhang et al., 2018) and galvanic interaction (Kowalczuk et al., 2018; Koleini et al., 2011; Nazari et al., 2012a, 2012b,2012c).
Galvanic interaction is the effect caused by the contact of different semiconductor or conductor minerals with dissimilar rest potentials, in which the minerals with higher rest potential are reduced as cathode, while the minerals with lower rest potential are oxidized as anode. Nazari et al. (2011) found that pyrite significantly enhances the dissolution of chalcopyrite, which was because the rest potential of pyrite was usually higher than that of chalcopyrite, and chalcopyrite acted as the anode, thus accelerating the oxidative dissolution of chalcopyrite. Bornite (Cu5FeS4) also significantly enhances the dissolution of chalcopyrite (Wang et al., 2016). The galvanic effect between chalcopyrite and bornite, however, enhanced the reduction of chalcopyrite to secondary copper-iron species. During the leaching process, the redox potential remains in a certain range (370–450 mV vs. Ag/AgCl) for a long period. Furthermore, Zhao et al. (2017) proposed that pyrite promoted the sulfate leaching of chalcopyrite by maintaining the redox potential in an appropriate range. It can be seen that redox potential plays a non-negligible role in dissolution of chalcopyrite, even in the presence of galvanic interaction.
Magnetite (Fe3O4), one of the most commonly associated minerals of chalcopyrite, has excellent electrical conductivity due to the fact that electrons can rapidly transfer between the two oxidation states of Fe2+ and Fe3+ (electron delocalization) (Makvandi et al.,2015). At present, little attention has been paid to the influence of magnetite on the dissolution of chalcopyrite. Saavedra et al. (2018) found that the rest potential of magnetite (0.495 V (vs. SHE)) was higher than that of chalcopyrite (0.445 V (vs. SHE)) in an acidic medium, and confirmed the galvanic interaction between chalcopyrite and magnetite where chalcopyrite was oxidized as the anode and magnetite was protected as cathode. The dissolved copper ions in the electrolyte for the chalcopyrite-magnetite electrode was twice more than that for the chalcopyrite electrode. Actually, the real leaching system is very complex since the leaching process involves the generation and transformation of intermediate products, and the effect of dissolved iron ions on the leaching kinetics of chalcopyrite cannot be ignored. Therefore, in order to elaborate the role of magnetite in chalcopyrite dissolution, leaching of different mass ratios of chalcopyrite and magnetite and electrochemical tests were carried out in sulfuric acid. Meanwhile, the galvanic interaction between minerals and the effect of Fe3+ and Fe2+ concentrations on the electrochemical behavior of chalcopyrite were also discussed. This study would provide some new insights into the improvement of chalcopyrite leaching.
2 Materials and methods
2.1 Minerals
Chalcopyrite and magnetite samples used in the experiments were obtained from Daye, Hubei province, China. The mineral samples were firstly hand-selected to remove the impurities and then crushed with a high-speed crusher and dry-screened to 38–74 μm for leaching experiments. XRD patterns of the samples are shown in Fig. 1, and the chemical elemental analysis showed that the chalcopyrite samples contained 34.24% Cu, 33.27% Fe, 30.86% S, and the magnetite samples contained 36.23% Fe2+, 34.35% Fe3+, 25.42% O. The purity of the minerals was more than 90% and thus could be used as pure minerals.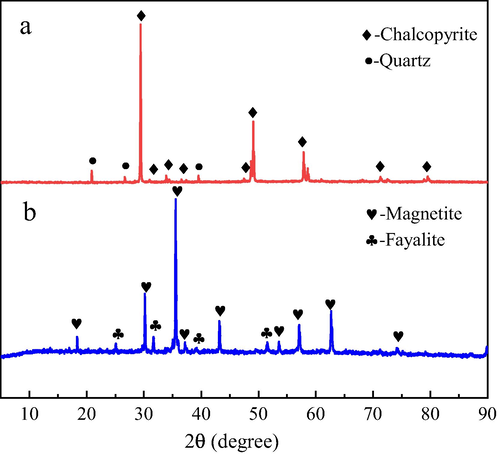
XRD patterns of chalcopyrite (a) and magnetite (b) samples.
2.2 Leaching experiments
Leaching experiments were carried out in 250 mL Erlenmeyer flasks with 100 mL of sterilized sulfuric acid prepared from 100 mL sterilized distilled water and then adjusted to pH = 1.6 with 20% diluted sulfuric acid. The solution pH was not readjusted during the experiment. 1 g chalcopyrite (C) and different masses of magnetite (M) were added to the flasks respectively (the mass ratio of magnetite to chalcopyrite was represented as M/C). All flasks were placed in an air-bath rotary shaker with a constant temperature of 35 ℃, and the rotating speed was set at 170 r/min. pH and redox potential were monitored periodically. The concentrations of the copper ions, total iron, and ferrous ions in the leaching solution were measured by UV–VIS spectrophotometer. Sampling loss and evaporation loss were replenished with sterile sulfuric acid at pH = 1.6. To ensure the credibility of the results, all the leaching tests were performed in triplicate parallels.
2.3 Electrochemical measurements
The working electrode was a carbon paste electroactive electrode (CPEE) prepared by mixing 2.1 g of mineral (0.038 mm), 0.6 g of graphite, and 0.3 g of paraffin (Wang et al., 2016). The solid paraffin was heated and dissolved in a 50 mL beaker, and then graphite and mineral samples were added to the beaker. The mixture was stirred evenly and ground in an agate mortar, and then was poured into a cylindrical chrome steel mold and compressed into a cylinder with a diameter of 15 mm and a height of 3 mm by a pelleter for 10 min at a pressure of 500 kg/cm2. The well-compacted cylinder was used as the working electrode. Before each electrochemical test, the working surface of the electrode was polished with 600#, 1000#, and 2000# silicon carbide paper successively, and rinsed with distilled water and anhydrous ethanol.
All tests were conducted in a conventional three-electrode system consisting of a working electrode, a graphite rod (counter electrode), and a saturated calomel electrode (reference electrode), and were performed on a Zahner Zennium E potentiostat (Germany) coupled to a computer. Sulfuric acid at pH = 1.6 were used as electrolytes. All potentials reported in this work were relative to the standard hydrogen electrode (SHE). Open circuit potential (OCP) measurements were performed with the freshly prepared chalcopyrite and magnetite electrodes for 600 s. Galvanic current between chalcopyrite and magnetite was measured by a Zero Resistance Ammeter (ZRA) (Deng et al., 2022). Chalcopyrite was connected to the working electrode, while magnetite was connected to the auxiliary/reference electrode. The potential between chalcopyrite and magnetite was set to 0 V, and at this time the potentiostat was functioned as a ZRA. The galvanic current was measured for 300 s. Cyclic voltammetry (CV) was carried out with the freshly prepared chalcopyrite electrodes at a sweep rate of 20 mV/s. The scanning range of voltage was OCP~990 mV~-890 mV~OCP.
2.4 Leached residues analysis
Leached residues were characterized by Raman, XRD, and FTIR techniques. Raman spectra were measured in the range between 1200 cm−1 and 100 cm−1 with a step width of 0.1 cm−1 on a HORIBA Scientific LabRAM HR Evolution Raman microscope, at an excitation wavelength of 633 nm. A very low laser power of 1 mW was used to protect the samples from damage. The laser spot of the Raman microscope was 2 μm in diameter. XRD patterns were obtained with a Bruker AXS D8 Advance Diffractometer with Cu Kα radiation. FTIR spectra were recorded by a Thermo Scientific Nicolet iS20 spectrometer in the transmittance mode (wavenumber range: 400–4000 cm−1).
3 Results and discussion
3.1 Leaching experiments
The leaching tests were carried out for 27 days, and the changes in copper extraction, total iron concentration, solution pH, and redox potential during the leaching of different mass ratios of chalcopyrite and magnetite are presented in Fig. 2. As shown in Fig. 2(a), no matter how much magnetite was added in the leaching system, the dissolution of chalcopyrite was promoted to a certain degree. The highest copper extraction of 8.03% was obtained in the presence of 0.5 g of magnetite. When the magnetite addition was more than 0.5 g, the copper extraction decreased and then had an increase with further addition of magnetite. Fig. 2(b) indicated that in the absence of magnetite, the total iron concentration was the lowest among the four mass ratios, which coincided with the lowest copper extraction in Fig. 2(a). As for the pure magnetite leaching system, the total iron concentration was rather high in the early stage, but then had a slow decrease with time, which might be related to the formation of some ferric precipitates. The M/C ratios of 1 and 2 exhibited a similar trend to the magnetite leaching system, but for the ratio of 0.5, the total iron concentration showed a slow rise in the whole leaching process. As shown in Fig. 2(c), when M/C was higher than 1, the pH increased in the first 3 days and then had a sharp decrease, while at the ratio of 0.5, the pH value increased continuously and reached to a plateau after 12 days.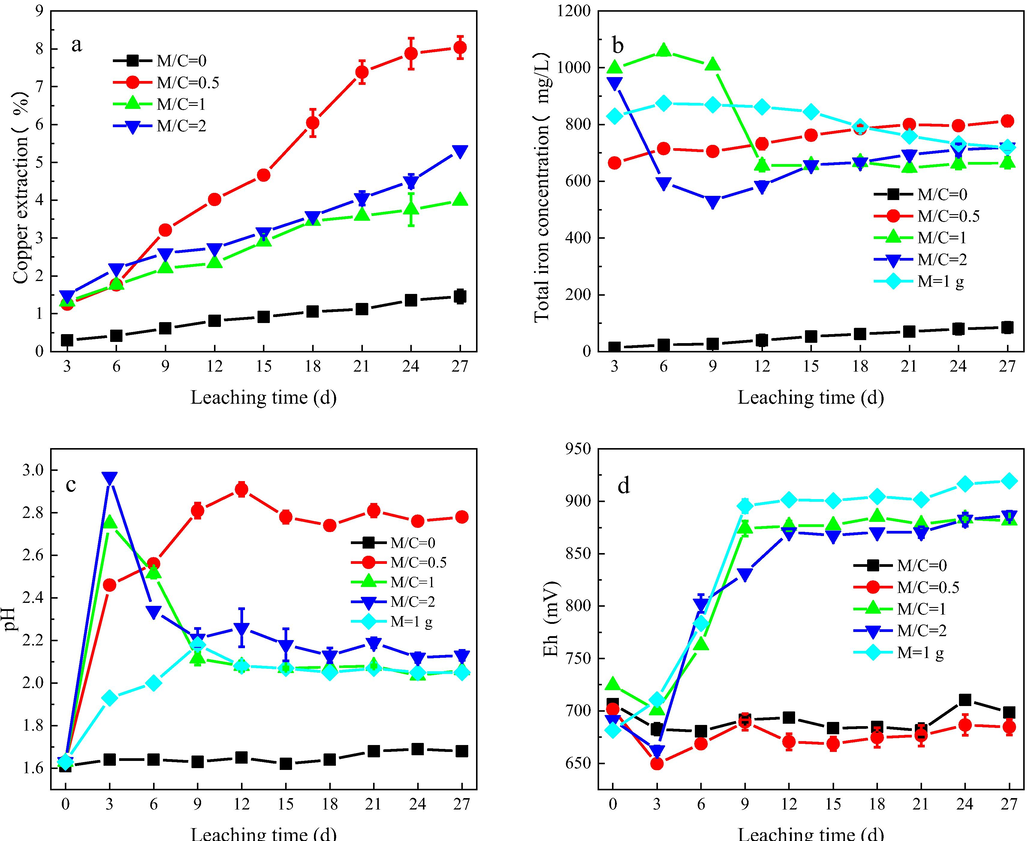
Variation of copper extraction (a), total iron concentration (b), pH (c), and redox potential (d) during chalcopyrite leaching in the presence of different masses of magnetite.
Redox potential plays a key role in the dissolution of chalcopyrite. As presented in Fig. 2(d), the redox potential in the absence of magnetite was maintained at 650–700 mV all the leaching time, which was well consistent with the pH variation. While adding 0.5 g magnetite, the redox potential did not show any obvious change and kept at the range of 650–700 mV. When more than 0.5 g magnetite was added, an evident difference was observed. After a slight decrease, the redox potential had sharply increased and finally stabilized at 850–900 mV. The redox potential in the leaching solution is related to c(Fe3+) / c(Fe2+) (Yang et al., 2018). Fig. 3 displays the change of c(Fe3+) and c(Fe2+). It can be seen that in the presence of magnetite, the initial c(Fe2+) was larger than 600 mg/L, indicating that there were a small number of soluble ferrous ions on the surface of magnetite. As the leaching proceeds, c(Fe2+) had a decline whereas c(Fe3+) had an increase, suggesting the oxidation of ferrous ions to ferric ions. When more than 0.5 g of magnetite was added, most ferrous ions were oxidized to ferric ions, raising the redox potential of the system to a higher value. As for the mass ratio of 0.5, less ferrous ions were oxidized, so the redox potential was maintained in a lower range. Due to different degrees of ferrous oxidation, the three systems with the addition of magnetite differed in their redox potentials.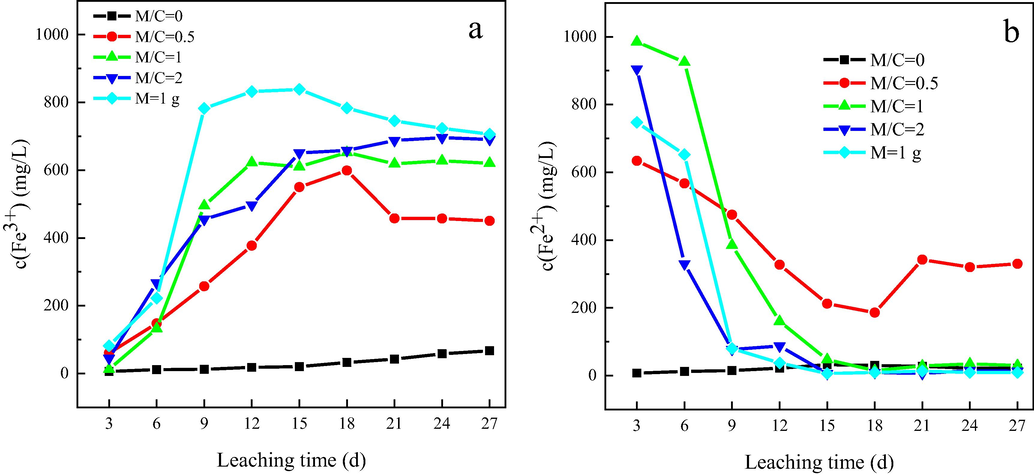
Variation of c(Fe3+) (a) and c(Fe2+) (b) with time during chalcopyrite leaching in the presence of different masses of magnetite.
As reported in a previous study, when the redox potential is in the range of 620–790 mV, chalcopyrite is reduced to chalcocite (Cu2S), which is more liable to be oxidized to Cu2+, as shown in Eqs. (1, 2, 3) (Zhao et al., 2019). It is apparent that the redox potential with no addition of magnetite was in this range, but because the concentrations of Cu2+ and Fe2+ in the solution were rather low, the reduction of chalcopyrite to chalcocite (Eq. (1)) was difficult, thus contributing to the low copper extraction. For mass ratios of 1 and 2, most Fe2+ ions were oxidized to Fe3+ ions, so the redox potential was far beyond the range of 620–790 mV, which was not conducive to the reduction of chalcopyrite to chalcocite. In that case, chalcopyrite was directly oxidized by the high concentration of Fe3+ (Eq. (4)).
3.2 Leached residues analysis
3.2.1 XRD analysis
In Fig. 4, the XRD results were shown of chalcopyrite and magnetite residues after leaching for 27 days. It can be seen from the Fig. 4 that no other chemical phases were observed in the four residues as compared with pristine mineral samples. But it does not mean that there are no solid products formed in the leaching process of chalcopyrite and magnetite. That might be due to the poor crystallization and low content, so they were not detected in the residues.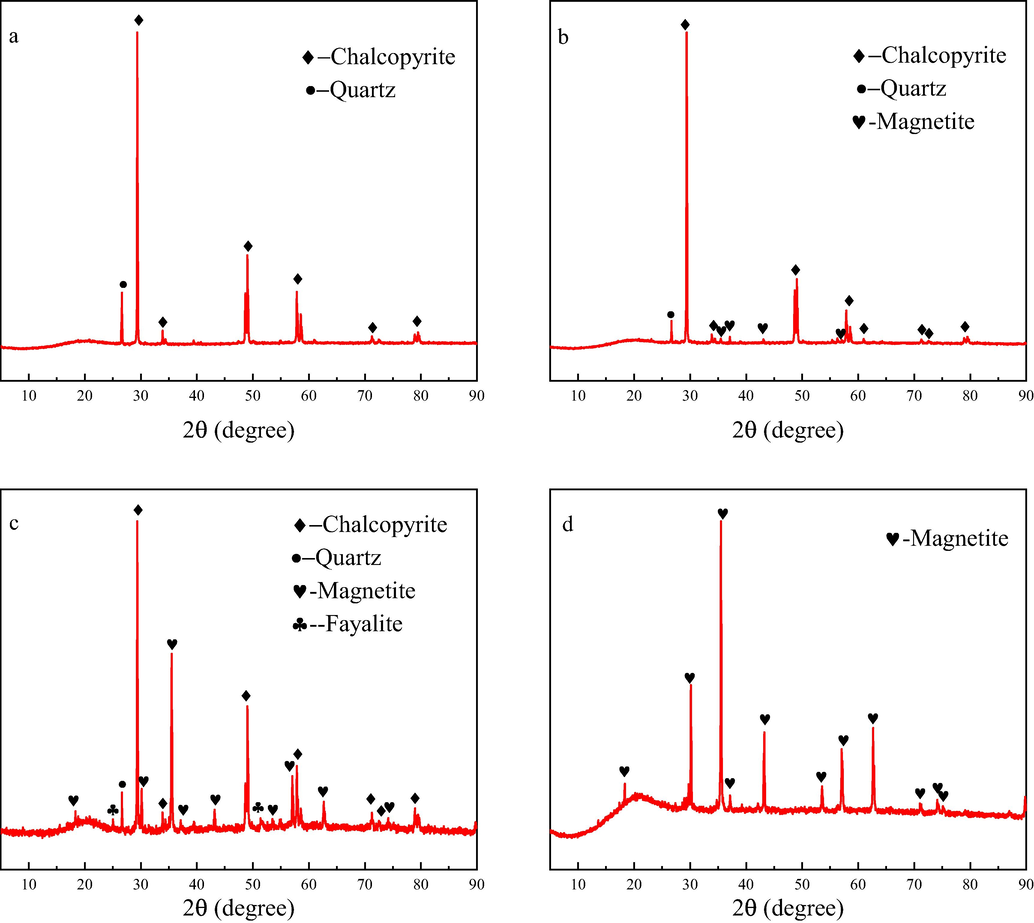
XRD patterns of residues after leaching for 27 days. (a) M/C = 0, (b) M/C = 0.5, (c) M/C = 2, (d) M = 1 g.
3.2.2 Raman analysis
Fig. 5 displays the Raman spectra of the residues after the leaching of 27 days. When no magnetite was added to the chalcopyrite leaching system, three peaks were detected at 290, 320 and 365 cm−1. As for the mass ratio of 0.5, three peaks at 290, 319 and 350 cm−1 were found in the residue. As reported in earlier studies, the main band at 290 cm−1 and the weak bands at 320, 350 and 365 cm−1 are assigned to chalcopyrite (Majuste et al., 2012; Yang et al., 2018). While with the adding 2 g magnetite, another two peaks at 221 and 430 cm−1 were observed in the spectra of the residue. The peak at 221 cm−1 was the lattice vibration of jarosite, and another peak at 430 cm−1 was identified as v2 (SO42-) in jarosite (Chio et al., 2010; Parker et al., 2008).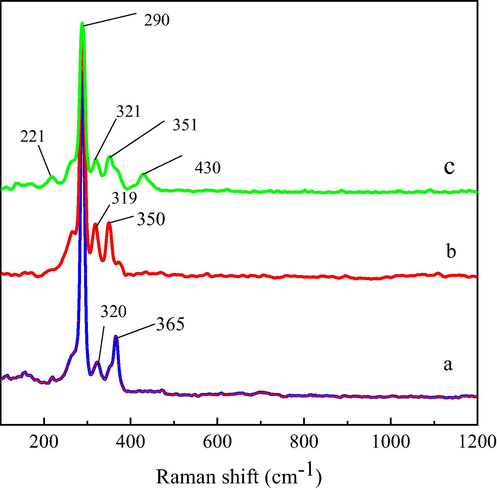
Raman patterns of residues after leaching for 27 days. (a) M/C = 0, (b) M/C = 0.5, (c) M/C = 2.
3.2.3 FTIR analysis
As shown in Fig. 2(b), with the rise of M/C ratio, different tendencies in the total iron concentration were observed, and when the mass ratios were set higher than 1, the total iron concentration had a drop after leaching for a period, showing a similar trend with the magnetite leaching system. Therefore, the FTIR spectra of the magnetite was also tested before and after the leaching, and the results are presented in Fig. 6. The absorption peaks in the spectrum of the original magnetite samples appeared at 949.35, 873.94, 827.69, 570.46 and 472.35 cm−1. The peak at 472.35 cm−1 was related to the bending vibration of the Si-O-Si bond, and the peaks around 949.35, 873.94 and 827.69 cm−1 were characteristic peaks of fayalite crystals (Wang et al., 2022). The bands at 570.46 and 513 cm−1 were ascribed to stretching vibrations of Fe3+–O2- in FeO6 octahedra (magnetite) (Smith et al., 2006). In the spectrum of the residue, besides the three peaks of magnetite and Si-O-Si, three new peaks at 1185.38, 1086.19 and 1005.12 cm−1 were detected. The peak at 1005.12 cm−1 corresponded to the deformation of OH, and the peaks at 1185.38 and 1086.19 cm−1 were derived from the v3 vibration of SO42- (Baron and Palmer, 1996; Gao et al., 2019).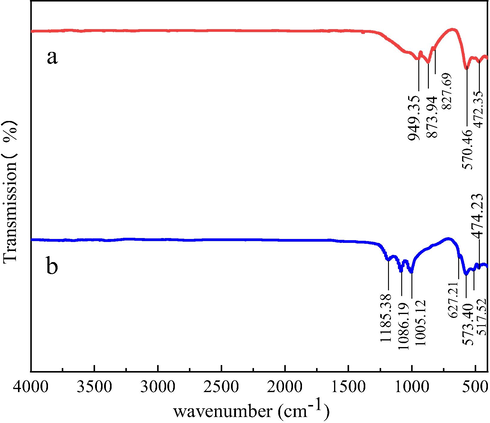
FTIR spectra of pristine magnetite samples (a) and magnetite leaching residue (b) after leaching for 27 days.
3.2.4 Discussion about the formation of ferric precipitates and chalcocite
As seen in Fig. 5, the vibrations of jarosite lattice and SO42- were detected in the residue when the mass ratio was 2. Additionally, SO42- and OH– for jarosite-group compounds were also observed in the FTIR spectrum of magnetite leaching residue (Fig. 6). It is reported that before the formation of jarosite, Fe3+ would firstly form precursors, e.g. [Fe (H2O)5 (OH)]2+ or [Fe (H2O)5(SO4)]+ (Sasaki et al., 1995; Sasaki and Konno, 2000), and then monovalent cations (M+) such as Na+, K+ and NH4+, and sulfate ions incorporate in the precursors, contributing to the formation of jarosite-group phases. In the present leaching experiments, no monovalent cations (M+) were introduced to form jarosite-group compounds, and the precursors were not well crystallized, so the diffraction peaks of jarosite-group compounds did not appear in XRD patterns of the residues. Combining with the decreases in the total iron concentration and pH, it is deduced that the precursors to jarosite-group phases generated when the magnetite addition was larger than 1 g.
As mentioned above, when the mass ratio was 0.5, chalcopyrite was initially reduced to chalcocite and then oxidized to Cu2+. But as shown in Fig. 4 and Fig. 5, the occurrence of chalcocite was not detected by XRD and Raman techniques, which might be due to the fact that chalcocite, as an intermediate product, had been totally oxidized to Cu2+. Another reason might be its rather low content relative to the overall residue.
3.3 Electrochemical measurements
Fig. 7(a&b) presents the influence of iron ions on the OCP values of chalcopyrite and magnetite and their galvanic current. The concentrations of iron ions were the same as that in the real leaching solution under the stable state of each system. In the sulfuric acid, the OCP of magnetite was rather higher than that of chalcopyrite, indicating that magnetite would react as the cathode while chalcopyrite would oxidize as the anode, leading to a positive current from chalcopyrite to magnetite and the increase of chalcopyrite oxidation. After adding iron ions, the OCP of chalcopyrite was rather higher than that of magnetite, contributing to a negative current from magnetite to chalcopyrite and the increase of magnetite oxidation. Based on the tests above, it is notable that the galvanic interaction between chalcopyrite and magnetite hinders the oxidation of chalcopyrite in the presence of iron ions. But as shown in Fig. 2, the addition of magnetite promoted the leaching of chalcopyrite, and Fe2+ and Fe3+ were produced in the leaching process. It is speculated that the influence of iron ions released from magnetite on the dissolution of chalcopyrite oxidation was much more significant than their galvanic interaction.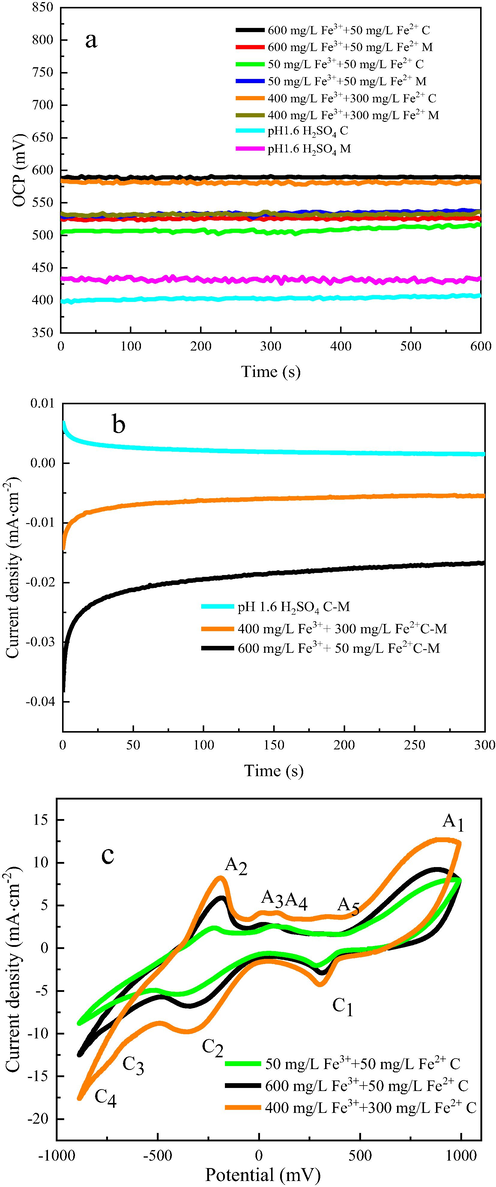
Open circuit potential (a), galvanic current density (b), cyclic voltammograms (c) of chalcopyrite (C), magnetite (M) and chalcopyrite-magnetite (C-M) electrodes in different electrolytes
Fig. 7(c) shows the cyclic voltammograms of chalcopyrite in the sulfuric acid containing different concentrations of Fe3+ and Fe2+ ions. 5 anodic oxidation peaks A1, A2, A3, A4, A5 and 4 cathodic reduction peaks C1, C2, C3, C4 can be found. Detailed reactions are as follows.
A1 (Liang et al., 2011): CuFeS2 → 2S0 + Cu2++ Fe3+ + 5e-. CuFeS2 + 8H2O → Cu2++ Fe3+ +2SO42- + 16H+ + 17e- CuS + 4H2O → Cu2++ SO42- +8H+ + 8e- 2S0 + 2H2O + 3O2 → 4H+ +2SO42-
C1 (Elsherief, 2002): Cu2++ CuS + 2e- → Cu2S. Cu2++ S0 + 2e- → CuS CuFeS2 + 3Cu2+ +4e- → 2Cu2S + Fe2+
C2 (Wang et al., 2016):9 CuFeS2 + 4H+ + 2e- → Cu9Fe9S16 + 2H2S + Fe2+. 5CuFeS2 + 12H+ + 4e- → Cu5FeS4 + 6H2S + 4Fe2+
C3 (Elsherief, 2002): 2Cu5FeS4 + 6H+ + 2e- → 5Cu2S + 3H2S + 2Fe2+. 2CuFeS2 + 6H+ + 2e- → Cu2S + 3H2S + 2Fe2+
C4 (Liang et al., 2011): CuFeS2 + 4H+ + 2e- →Cu0 + 2H2S + Fe2+. Cu2S + 2H+ + 2e- → 2Cu0 + H2S
A2 (Liang et al., 2011): 2Cu0 + H2S → Cu2S + 2H++ 2e-.
A3, A4 (Rohwerder et al., 2003): H2S → S22- → Sn2- → S0.
A5 (Wang et al., 2016): Cu2S → Cu1.92S + 0.08 Cu2+ + 0.16e-. Cu1.92S → Cu1.6S + 0.32Cu2+ + 0.64e- Cu1.6S → Cu1.92S + 0.6 Cu2+ + 1.2e-
It is apparent that the addition of Fe3+ and Fe2+ has an obvious impact on the degree of the redox reactions on chalcopyrite. Among the three systems, the current densities of the reaction peaks on the chalcopyrite electrode in presence of 50 mg/L Fe3+ +50 mg/L Fe2+ is the smallest, while that in the presence of 400 mg/L Fe3+ +300 mg/L Fe2+ is the largest, implying that the dissolution of chalcopyrite is associated not only with c(Fe3+)/c(Fe2+) but also with c(Fe3+), c(Fe2+).
4 Conclusions
This study confirms that the presence of magnetite promoted the dissolution of chalcopyrite to a certain degree. When the M/C ratio was 0.5, the redox potential was maintained in the range of 650–700 mV in which chalcopyrite was reduced to chalcocite and then oxidized to Cu2+, resulting in the highest copper extraction among all the four ratios. With no addition of magnetite, the redox potential was maintained in the same range, but the copper extraction is much lower than that for the M/C ratio higher than 1, in which the redox potential exceeded the appropriate range of 620–790 mV for the reduction of chalcopyrite. That was mainly related to the high iron concentrations caused by the addition of magnetite. This study suggests that the redox potential does not play a dominant role in copper extraction, and iron ions affect the redox potential and the leaching kinetics of chalcopyrite. Sufficient iron ions and appropriate c(Fe3+)/c(Fe2+) can not only reduce the formation of jarosite phase, but also significantly improve the leaching of chalcopyrite.
CRediT authorship contribution statement
Sha Deng: Conceptualization, Writing – review & editing, Validation, Resources. Jiaxin Yang: Investigation, Data curation, Writing – original draft. Yaping Wang: Writing – review & editing. Tao Long: Investigation. Wei Yang: Conceptualization, Resources, Funding acquisition, Project administration, Supervision.
Acknowledgments
The authors are grateful for the financial support from the Natural Science Basic Research Program of Shaanxi, China (No. 2020JQ-666) and the National Natural Science Foundation of China (Nos. 52004198, 52174261).
Declaration of Competing Interest
The authors declare that they have no known competing financial interests or personal relationships that could have appeared to influence the work reported in this paper.
References
- Bio-hydrometallurgy dynamics of copper sulfide-minerals probed by micro-FTIR mapping and Raman microspectroscopy. Miner. Eng.. 2019;132:39-47.
- [CrossRef] [Google Scholar]
- Ferric chloride leaching of chalcopyrite: synergetic effect of CuCl2. Hydrometall.. 2008;91(1–4):89-97.
- [CrossRef] [Google Scholar]
- Mechanochemistry in hydrometallurgy of sulphide minerals. Hydrometall.. 2005;77(1–2):9-17.
- [CrossRef] [Google Scholar]
- Raman spectroscopic investigation on Jarosite-Yavapaiite stability. Spectrochim. Acta A Mol. Biomol. Spectrosc.. 2010;75(1):162-171.
- [CrossRef] [Google Scholar]
- Galvanic effect of magnetite on electrochemical oxidation of arsenopyrite in acidic culture medium. Trans. Nonferrous Met. Soc. Chin.. 2022;32(11):3744-3752.
- [CrossRef] [Google Scholar]
- The influence of cathodic reduction, Fe2+ and Cu2+ ions on the electrochemical dissolution of chalcopyrite in acidic solution. Miner. Eng.. 2002;15:215-223.
- [CrossRef] [Google Scholar]
- Reductive dissolution of jarosite by a sulfate reducing bacterial community: secondary mineralization and microflora development. Sci. Total Environ.. 2019;690:1100-1109.
- [CrossRef] [Google Scholar]
- The stepwise dissolution of chalcopyrite bioleached by Leptospirillum ferriphilum. Electrochim. Acta. 2013;103:50-57.
- [CrossRef] [Google Scholar]
- Acidic sulphate leaching of chalcopyrite concentrates in presence of pyrite. Miner. Eng.. 2011;24(5):381-386.
- [CrossRef] [Google Scholar]
- Galvanic leaching of seafloor massive sulphides using MnO2 in H2SO4-NaCl media. Minerals. 2018;8(6)
- [CrossRef] [Google Scholar]
- Characterization of the thermo-reduction process of chalcopyrite at 65℃by cyclic voltammetry and XANES spectroscopy. Hydrometall.. 2011;107:13-21.
- [CrossRef] [Google Scholar]
- Copper leaching from chalcopyrite concentrate in Cu (II)/Fe (III) chloride system. Miner. Eng.. 2013;45:185-190.
- [CrossRef] [Google Scholar]
- Electrochemical dissolution of chalcopyrite: detection of bornite by synchrotron small angle X-ray diffraction and its correlation with the hindered dissolution process. Hydrometall.. 2012;111–112:114-123.
- [CrossRef] [Google Scholar]
- The surface texture and morphology of magnetite from the Izok Lake volcanogenic massive sulfide deposit and local glacial sediments, Nunavut, Canada: application to mineral exploration. J. Geochem. Explor.. 2015;150:84-103.
- [CrossRef] [Google Scholar]
- Enhancing the kinetics of chalcopyrite leaching in the Galvanox™ process. Hydrometall.. 2011;105(3–4):251-258.
- [CrossRef] [Google Scholar]
- The mechanism of chalcopyrite leaching in the presence of silver-enhanced pyrite in the Galvanox™ process. Hydrometall.. 2012;113–114:122-130.
- [CrossRef] [Google Scholar]
- The role of galena associated with silver-enhanced pyrite in the kinetics of chalcopyrite leaching during the Galvanox™ process. Hydrometall.. 2012;111–112:35-45.
- [CrossRef] [Google Scholar]
- The role of silver-enhanced pyrite in enhancing the electrical conductivity of sulfur product layer during chalcopyrite leaching in the Galvanox™ process. Hydrometall.. 2012;113–114:177-184.
- [CrossRef] [Google Scholar]
- Insights into heap bioleaching of low grade chalcopyrite ores — a pilot scale study. Hydrometall.. 2012;125–126:157-165.
- [CrossRef] [Google Scholar]
- Current scenario of chalcopyrite bioleaching: a review on the recent advances to its heap-leach technology. Bioresour. Technol.. 2015;196:694-706.
- [CrossRef] [Google Scholar]
- Raman investigation of chalcopyrite oxidation. Colloids Surf. A Physicochem. Eng. Asp.. 2008;318(1–3):160-168.
- [CrossRef] [Google Scholar]
- Effect of Fe2+ and Cu2+ ions on the electrochemical behavior of massive chalcopyrite in bioleaching system. Adv. Mat. Res.. 2013;825:472-476.
- [CrossRef] [Google Scholar]
- Bioleaching review part A. Appl. Microbiol. Biotechnol.. 2003;63:239-248.
- [CrossRef] [Google Scholar]
- Understanding galvanic interactions between chalcopyrite and magnetite in acid medium to improve copper (Bio)Leaching. Electrochim. Acta. 2018;265:569-576.
- [CrossRef] [Google Scholar]
- Morphology of jarosite-group compounds precipitated form biologically and chemically oxidized Fe ions. Can. Mineral.. 2000;38:45-56.
- [Google Scholar]
- Characterization of argentojarosite formed from biologically oxidized Fe3+ ions. Can. Mineral.. 1995;33:1311-1319.
- [Google Scholar]
- Dissolution of jarosite [KFe3(SO4)2(OH)6] at pH 2 and 8: Insights from batch experiments and computational modelling. Geochim. Cosmochim. Acta. 2006;70(3):608-621.
- [CrossRef] [Google Scholar]
- Effects of redox potential on chalcopyrite leaching: an overview. Miner. Eng.. 2021;172:107135
- [CrossRef] [Google Scholar]
- Effect of pH reduction and ferric ion addition on the leaching of chalcopyrite at thermophilic temperatures. Hydrometall.. 2009;96(1–2):62-71.
- [CrossRef] [Google Scholar]
- Cooperative effect of chalcopyrite and bornite interactions during bioleaching by mixed moderately thermophilic culture. Miner. Eng.. 2016;95:116-123.
- [CrossRef] [Google Scholar]
- Interaction mechanism between arsenate and fayalite-type copper slag at high temperatures. Trans. Nonferrous Met. Soc. Chin.. 2022;32(2):709-720.
- [CrossRef] [Google Scholar]
- Leaching of chalcopyrite: an emphasis on effect of copper and iron ions. J. Cent. South Univ.. 2018;25(10):2380-2386.
- [CrossRef] [Google Scholar]
- Enhancing the Leaching of Chalcopyrite Using Acidithiobacillus ferrooxidans under the Induction of Surfactant Triton X-100. Minerals. 2018;9(1)
- [CrossRef] [Google Scholar]
- Life cycle assessment of pollutants and emission reduction strategies based on the energy structure of the nonferrous metal industry in China. Energy. 2022;261
- [CrossRef] [Google Scholar]
- Comparison of bioleaching and dissolution process of p-type and n-type chalcopyrite. Miner. Eng.. 2017;109:153-161.
- [CrossRef] [Google Scholar]
- The dissolution and passivation mechanism of chalcopyrite in bioleaching: an overview. Miner. Eng.. 2019;136:140-154.
- [CrossRef] [Google Scholar]


