

Translate this page into:
Insights into adsorption theory of phenol removal using a circulating fluidized bed system
⁎Corresponding author. gsnirmala@vit.ac.in (Nirmala Gnanasundaram)
-
Received: ,
Accepted: ,
This article was originally published by Elsevier and was migrated to Scientific Scholar after the change of Publisher.
Peer review under responsibility of King Saud University.
Abstract
Phenol is one of the most dangerous industrial pollutants in water sources due to its toxic effects on humans and animals. The adsorption process using activated carbon is one of the applicable methods that can be used to remove phenol traces and it is found to be the most efficient due to its various advantages. The present study investigates phenol adsorption using activated carbon which was hand coated onto glass beads. Various calculations were conducted with the data obtained from batch and column adsorption. Kinetic model analysis indicated that the system was best suited for pseudo-second-order kinetics. Thermodynamic parameters such as a change in enthalpy, change in entropy, and change in Gibbs free energy were evaluated, and it can be inferred from the results that this adsorption is endothermic and non-spontaneous for batch study. Physisorption can be inferred from low values of change in enthalpy and change in Gibbs free energy. From the two diffusion models, it was concluded that there is more than one rate-limiting step. The Temkin isotherm model, among the various isotherm models studied, was found to have the best fit with an R2 value of 0.987. The energy value (E) estimated using the Dubinin–Radushkevich isotherm model also proved that the system is physisorption in nature. The column study kinetic calculations indicated that for the column experiment, the process followed was the second-order kinetic model and the thermodynamic report concluded the process to be spontaneous and feasible. MATLAB coding was done for the entire calculations involved in the project, which can be utilized for future applications.
Keywords
Adsorption
Phenol
Kinetics
Thermodynamics
Diffusion models
MATLAB

1 Introduction
Pollution caused due to industrial wastewater still remains one of the major challenges due to its huge negative impact on the ecosystem. Phenol is one of the most toxic components present and is produced in many industries such as oil refining, petrochemicals, pharmaceuticals, plastics, resin manufacturing paint, pulp, and wood products. Phenol is also one of the important industrial pollutants when it comes to the toxic effects it has on animals and humans (Said et al., 2021) Low-concentration phenol exposure can lead to diseases such as skin denaturation, and long-term exposure can result in various diseases like paralysis, metabolic instability, tissue degradation and so on (Chen et al., 2016; Hameed & Rahman, 2008). Therefore, the amount of phenol concentration present in various drinking water sources due to pollution and industrial discharge are an alarming priority and environmental protection authorities have established regulations regarding the amount of phenol concentration in water resources, mainly drinking water resources (Nirmala et al., 2019). Hence much research is being conducted on new and existing technologies to increase the efficiency of removing traces of phenol (Sureshkumar et al., 2020). Various techniques like advanced oxidation, biological treatments, membrane separation, and ion exchange adsorption have been developed and are employed to maintain the phenol concentration in industrial wastewater within the required safe limits (Abbassian et al., 2014; Nirmala et al., 2019). Adsorption is an efficient method to remove the desired pollutant due to many reasons, including ease of scalability and feasibility. Adsorption is also efficient in removing the inorganic chemicals that pollute the system (Kareem and Mohammed, 2020). The adsorption operation can be carried out in two modes, namely batch method and column mode. Of various types of column adsorption, the fluidized bed type is seen to be more widely used than the fixed bed or continuous bed type reactors. Fluidized beds are found to be efficient in treating industrial wastewater for the removal of various substances like starch and also in treating high-strength wastewater (Sakhile et al., 2022). This can be due to the various advantages that include improved heat and mass transfer and the ability to handle large volumes of feed (Patel et al., 2006). Operational flexibility, better solid hold-up, increased liquid–solid contact, and higher throughputs have been seen in circulating fluidized beds, and hence research is being conducted on its usage for various industries (Zhu et al., 2000). This project deals with studying the mechanism and kinetics involved in the adsorption of phenol for batch mode and continuous modes using a liquid–solid circulating fluidized bed reactor (Sureshkumar et al., 2020).
Due to the larger surface area and availability, activated carbon is the most effective adsorbent for industrial effluent treatment, and they have been used to remove various contaminants from industrial effluents in recent years (Iqbal & Ashiq, 2007)(Sakhile et al., 2022). Therefore among the various technologies available to remove traces of toxic substances, organic components, and color, adsorption by means of activated carbon remains to be one of the most efficient technologies available. (Anjum et al., 2019) The kinetic study and mechanism of diffusion should be explored in advance so that a better understanding of adsorption taking place can be established (Wang et al., 1997).
Al-Ghouti & Da'ana, 2020, and Mohammad A. Al-Ghouti et al. (2020) discuss the various isotherm models, their parameter calculations, and their applicability. The author suggests that understanding equilibrium data is important for analyzing the various mechanisms involved and the interaction between the adsorbate and adsorbent at constant temperatures. (Wu et al. 2009) Feng-Chin Wu et al. (2009) analyzed the kinetics for adsorption by Weber and Morris’s intraparticle diffusion model. Calculations for initial adsorption factors were carried out and classified into various zones with respective initial adsorption behavior. Ri values for various systems were studied. (Viegas et al., 2014) Rui M. C. Viegas et al. (2014) applied Boyd's model, the homogeneous surface diffusion model (HSDM) to microcystins. The controlling step was established with Bi and Boyd’s criteria. Intraparticle diffusion is considered the rate-limiting step when above the biot limit, which depends on the carbon. Smaller carbons were found to have lower limits.
The phenol adsorption system used in our study is a continuous reactor with adsorption and desorption taking place simultaneously, which is a novel approach for a continuous mode of operation and its suitability for phenolic removal treatment in a single unit. Moreover, the adsorbent in the study (i.e., activated carbon) was hand coated onto glass beads. The main objective of this study is to understand the nature of the adsorption process taking place in this novel approach. Current research is done to comprehend diffusion mechanisms by studying the Boyd Diffusion model and Webber-Morris model. The kinetic models are analyzed to understand the rate-controlling step. Thermodynamic constants are investigated to understand the viability of phenol adsorption on activated carbon-covered glass beads, and isotherm studies are also conducted to comprehend the type of the adsorption process. Detail parametric studies are not yet studied due to experimental limitations and challenges. On the other hand, the application of MATLAB coding facilitates further studies, and inferences made from the obtained results are discussed.
The mechanisms related to the LSCFB bioreactor system generally require a significant number of experiments; therefore, these obstacles are overcome using predictive modeling, which is an elegant and efficient method to investigate any complex system. Hence Calculations involved in this project were coded using MATLAB to facilitate further studies, and inferences made from the obtained results are discussed.
2 Materials and methodology
2.1 Materials
Various chemicals utilized for these experiments were of AR grade. The adsorbent was activated carbon which was coated on glass beads using epoxy resin. The adsorbent was a glass bead of a dimension 1.76 mm diameter with a density of 2700 kg/m3. Araldite or Epoxy Resin was used as an adhesive for achieving the coating. The glass beads and MNA hardener was mixed in a 1:1 ratio by weight. The activated carbon and epoxy resin was hand coated on the glass beads to ensure proper coating on each bead.SEM and FTIR studies were conducted to analyze the activated-carbon glass bead samples (Sureshkumar et al., 2020).
2.2 Methodology
The preparation, characterization, and experimentation with the adsorbents have been mentioned in our previous study of the phenol removal from wastewater using a circulating fluidized bed (Nandhini Sureshkumar et al. (2020)). The experimentation that was mentioned includes batch studies and column studies. In batch study experiments, four adsorbent dosages of 1 g, 1.5 g, 2 g, and 2.5 g were coated onto the glass beads with the adhesive and kept inside the incubator at 75 RPM and 30 °C. A sample of 10 mL was taken for multiple time intervals of 15,30,45,60,120, and 180 mins for different adsorbent dosages. pH meter was used to determine the pH at various time intervals, and adsorbent loadings and absorbance values were measured using UV–Vis Spectrophotometer. The studies were also conducted for the four adsorbent dosages for temperatures 303 K, 313 K, 323 K, and 333 K. For the column experiment, an initial concentration of 1000 ppm was used, and the adsorbent was maintained at 35% of the riser height. The primary feed was operated at 1100 L/h, and the secondary feed was at 750 L/h. For calculations and analysis, 10 mL solutions were taken at a 5 min interval after proper mixing from the column. The data obtained was used for the estimation of kinetic nature and thermodynamic behavior (Sureshkumar et al., 2020).
3 Results and discussions
3.1 Kinetics
The kinetic analysis of the adsorption process is important as it can be utilized to analyze the efficiency of adsorption, controlling mechanism, and equilibrium time. Adsorption kinetics are generally understood by Pseudo-first-order and Pseudo-second-order models (Kang et al., 2013) (Zheng et al., 2021).
Kinetic analysis was conducted by studying the change in concentration with a change in time. Batch studies with an initial concentration of 1000 ppm for various adsorbent loadings of 1 g, 1.5 g, 2 g, and 2.5 g were conducted at 303 K. Samples of the solution were taken at definite time gaps. The samples were used to analyze the concentration and adsorption capacity. The time and qt values were calculated and used to understand the adsorption kinetic models. The pseudo-first-order kinetic model (linear form) is represented in Eq. (1).
Here k1 is Pseudo-first-order rate constant (min−1). The slope of the graph between time and ln (qe – qt) gives the rate constant, and the intercept of the graph gives the adsorption capacity (qe,cal) (Anjum et al., 2019).
The pseudo-second-order kinetics generally estimates the kinetic constants in the entire adsorption range (Nirmala et al., 2019). The pseudo-second-order model is calculated based on Eq. (2), which uses a plot between t and t/qt
Here k2 is the pseudo-second-order rate constant (mg/g min). The slope gives the adsorption capacity(qe), and rate constant k2 is found using intercept and qe values (Nirmala et al., 2019) Pseudo-first-order and pseudo-second-order plots at 303 K for various adsorption loadings are presented in Fig. 1 and the various parameters estimated are depicted in Table 1 (Nirmala et al., 2019).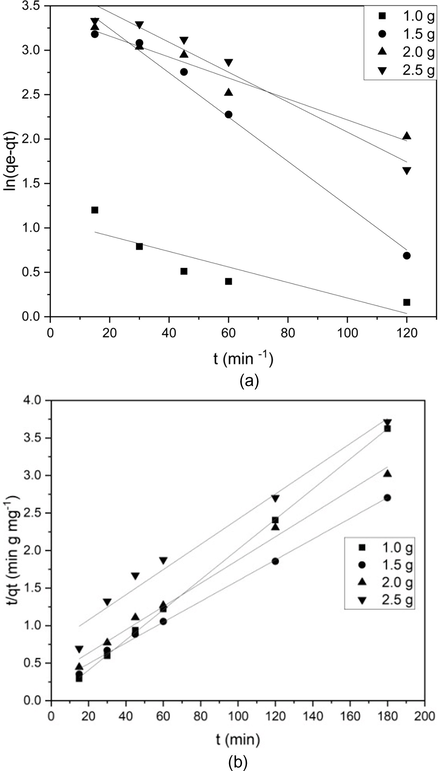
Kinetic study for batch study for various adsorbent loading. (a) Pseudo- first order (b) Pseudo-second order.
Adsorbent loading (g)
1
1.5
2
2.5
Pseudo first order
k1 (min−1)
0.008
0.024
0.011
0.0189
qe,cal (mg/g)
2.953
42.22
29.814
44.089
R2
0.784
0.984
0.958
0.979
Pseudo second order
k2 (g/mg min)
0.106
0.027
0.0263
0.019
qe,call (mg/g)
52.631
76.92
66.66
59.61
R2
0.999
0.997
0.990
0.974
For the pseudo-first-order kinetic model, R2 was found in the range of 0.784 and 0.984, whereas for pseudo-second-order kinetics, the R2 values are all above 0.974 (closer to unity). Therefore it indicates that the adsorption of phenol on activated carbon follows a pseudo-second-order kinetic model or can be better described by it (Kang et al., 2013). Calculated (qe,cal) and the experimental adsorption capacity for the pseudo-second-order model was very close; hence the phenol adsorption on activated carbon follows the pseudo-second-order kinetic model (Nirmala et al., 2019).
3.2 Thermodynamics
Thermodynamic parameters for this adsorption process were calculated and analyzed. Batch studies were carried out for adsorbent loadings 1 g, 1.5 g, 2 g, and 2.5 g at different temperatures of 303 to 333 K with a constant initial concentration of 1000 ppm. For this study, Van’t Hoff equation (Eqs. (3) and (4)) was used to find out the change in standard enthalpy (ΔHo), standard entropy (ΔSo), and standard Gibbs free energy (ΔGo).
Here R is the universal gas constant (8.314 J/mol K), T is the absolute temperature, and Ko is the equilibrium constant calculated by qe/Ce. A graph was plotted between ln K vs. 1/T (Fig. 2), and the ΔHo and ΔSo values were found from the slope and intercept, respectively. Table 4 shows the calculated values of ΔHo and ΔSo (Kang et al., 2013).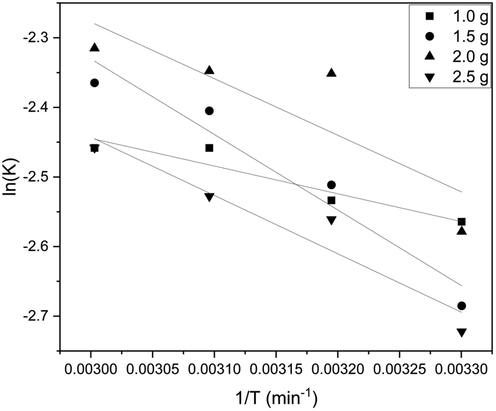
Thermodynamic graph for batch studies.
A positive value of ΔGo in our study indicates that the adsorption is non-spontaneous. Table 2 and Table 3 summarizes ΔGo for different adsorbent loading at constant temperature and for different temperature for a constant adsorbent loading, respectively, from which the adsorption was found to be relatively more favorable at room temperature with higher adsorbent loading. The positive value of ΔHo confirms the endothermic nature, and the low range of both ΔHo and ΔGo (<20 kJ/mol) concludes that physisorption takes place. Increased randomness at the solid–liquid interface can also be inferred due to positive ΔSo value (ALI FIL et al., 2014)(Mohammed et al., 2022). A positive ΔSo value indicates an increased affinity towards the phenol molecule (Li et al., 2022).
Adsorbent loading (g)
ΔG (J/mol)
1.0
6465.912
1.5
4061.244
2.0
3104.988
2.5
3416.748
Temperature
30 °C
40 °C
50 °C
60 °C
ΔG (J/mol)
6459.82
6593.184
6601.451
6805.83
Adsorbent loading (g)
Slope
ΔH (J/mol)
Intercept
ΔS = (J/mol K)
R2
1.0
−398.6
3313.9604
−1.248
−10.375872
0.897
1.5
−1085
9020.69
0.924
7.682136
0.941
2.0
−813
6759.282
0.161
1.338554
0.735
2.5
−838.5
6971.289
0.073
0.606922
0.920
3.3 Diffusion models and mass transfer studies
3.3.1 Webber-Morris
The Weber–Morris model states that when the plot of qt vs. t1/2 is a straight line that passes through the origin, the sole rate-determining process is the intraparticle diffusion mechanism. The graph is multi-linear and has an intercept value hence indicating more than one step is present in the process (Kang et al., 2013). This can be concluded as external surface or rapid adsorption followed by gradual adsorption due to intraparticle diffusion.
The equation used for the model is:
Fig. 3 shows the graph of qt vs. t1/2. Here kp is the intraparticle diffusion rate constant, which is determined by the slope, and C is the intercept (Lv et al., 2021). Various literature has shown that intercept value is directly proportional to the boundary layer effect, and boundary layer thickness retards the intraparticle diffusion (Wu et al., 2009). Table 6 shows the kp values for different adsorbent loadings along with their intercept values. From Table 6 and Fig. 3, it can be observed that the intercept value is not zero for all the adsorption loading, and this indicates that adsorption was not completely dependent on interparticle diffusion (Lv et al., 2021).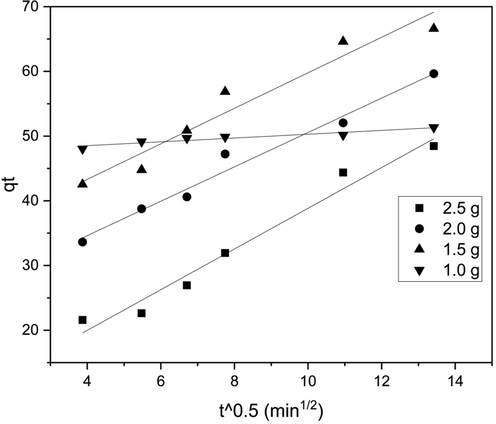
Weber-Morris Diffusion model for batch study.
To understand the initial adsorption behavior, equations from Feng-Chin Wu et al. (Wu et al., 2009) were used. The equations are:
Where Ri is the initial adsorption factor, tref corresponds to the longest time in the process, and qref is the amount adsorbed by the adsorbent at time t = tref.
Table 5 shows various zone and respective initial adsorption behavior, and Table 7 displays the Ri values and respective zones for different adsorbent loadings. Substituting the Ri value in Eq. (6) at an initial point for adsorbent loading of 1 g, the q/qref value was found to be 0.9467, which means initial adsorption has reached 94.67 % and is later proceeded by the intraparticle diffusion mechanism. Similarly, the q/qref values at the initial point are calculated and displayed in Table 7. It can be concluded that as adsorbent loading increased, the process was found to be controlled more by the intraparticle diffusion mechanism than initial adsorption, which can also be seen from the decrease in intercept value with an increase in adsorbent loading (Wu et al., 2009).
Ri
Initial Adsorption Behavior
Zone
Ri = 1
No initial adsorption
0
1 > Ri > 0.9
Weakly initial adsorption
1
0.9 > Ri > 0.5
Intermediately initial adsorption
2
0.5 > Ri > 0.1
Strongly initial adsorption
3
Ri < 0.1
Approaching completely initial adsorption
4
Adsorbent Loading (g)
1.0
1.5
2.0
2.5
R2
0.902
0.942
0.977
0.971
Intercept
47.34
32.34
24
7.403
kp(mg/g min1/2)
0.204
2.744
2.655
3.144
Adsorbent Loading (g)
Ri
Zone
q/qref at initial point
1
0.053297
4
0.9467
1.5
0.55272
2
0.4472
2
0.59712
2
0.4029
2.5
0.8706
1
0.1293
3.3.2 Boyd model
Mathematical representation specified by Boyd et al. was used in an attempt to recognize the rate-limiting step, and our intra-particle diffusion study shows that more than one process is involved. The dimensionless constant Btis calculated by the formula
Here F is the fraction of solute adsorbed, which is calculated by qt/qe. The Bt values were plotted with respect to time (Fig. 4), and the effective diffusion coefficient (Di) was calculated by,
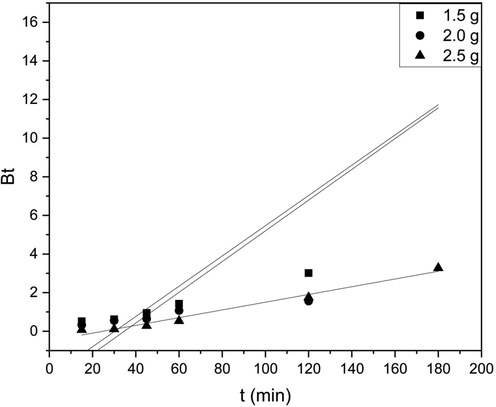
Boyd Diffusion model for batch study.
Where B is the slope of the graph and r is the radius of the adsorbent particle.
Correspondingly, when the chart is linear and has no intercept, then film diffusion is considered rate limiting, whereas if the graph is linear but has a y-intercept, external mass transfer controls the overall rate. In this study, the plots for numerous adsorbent loadings showed a non-linear relationship, and no line segments passed through the origin. Thus, both linear and non-linear natures can be seen. Film diffusion and/or particle diffusion seem to be governing the sorption rate, as it was observed that none passed through the origin. The correlation coefficients for linearity (R2) for different adsorbent loadings were also found.
The Di (effective diffusion coefficient) values for various adsorbent loadings have been given in Table 8. Pore and film diffusion can be distinguished using Di values. A process can be identified to obey film diffusion if Di is within 10-6 to 10-8 cm2/s1 and pore diffusion when Di is within 10-11 to 10-13 cm2/s1. The value for our experiment was found to be 10-3 times, therefore, in the range of pore diffusion (Viegas et al., 2014).
Adsorbent loading (g)
1.5
2.0
2.5
Di (cm2/s)
2.0959 x10⁻¹⁵
2.1389 x10⁻¹⁵
5.3742 x10⁻¹⁶
R2
0.812
0.735
0.979
3.3.3 Mass transfer coefficients
In adsorption systems where the transportation of the molecules to the solid phase boundary from the liquid phase is an important aspect, the liquid film diffusion model is used for calculating the mass transfer coefficient. This method, also known as the external diffusion model, presumes that the adsorbent surface concentration almost becomes zero (or negligible intraparticle resistance), and the intraparticle diffusion is not considered at the initial contact times. The equation used for calculation is derived based on the application of Ficken’s law (Girish & Murty, 2016).
c*= is the equilibrium concentration of the solute in the liquid at equilibrium,
co = initial concentration (mol solute A/volume)
c = is the concentration of the solute in the bulk liquid at time t (Gopinathan et al., 2016)
Graphs in Fig. 5 depict concentration vs. time for the given data for various adsorbent loading and Table 9 presents the calculated mass transfer coefficients.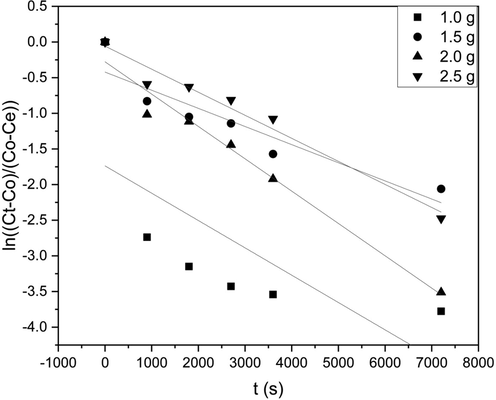
Mass Transfer studies for batch adsorption for various adsorbent loadings.
The observed trend was that the liquid phase mass transfer coefficient decreased as the adsorbent loading increased from 1.5 g to 2.5 g. From the Weber-Morris model analysis, it was concluded that as the adsorbent loading increased, the adsorption was more controlled by intraparticle diffusion than initial adsorption. Therefore, the mass transfer coefficient decreases with an increase in adsorbent loading, as observed in the data presented in Table 9. As the resistance is reciprocal of the mass transfer coefficient, we can also state that the resistance increased with an increase in adsorbent loading (Gopinathan et al., 2016).
Adsorbent Loading (g)
kLapL(sec-1)
R2
1.5 g
0.0005125
0.967
2.0 g
0.0003441
0.943
2.5 g
0.0003355
0.675
3.4 Isotherm studies
The isotherm studies are done for 2.5 g adsorbent loading with the initial concentration varying within a range of 670 ppm to 1300 ppm and the experiments were conducted at 303 K temperature.
3.4.1 Dubinin–Radushkevich isotherm
Dubinin–Radushkevich isotherm was initially utilized to analyze the effects of the porous configuration of adsorbents and was derived from the adsorption potential theory, which presumed that adsorption was based on micropore volume filling and on pore walls, there was no layer-by layer adsorption (Hu & Zhang, 2019). D–R isotherm is generally used in order to describe the mechanism of adsorption which has a Gaussian-type energy distribution in a heterogeneous surface and the model has also been successfully used to express the high solute activities as well, for the range of concentrations (Dada et al., 2012).
The model is developed on the presumption that the adsorbent size is comparable to the microporous size and the adsorption potential (ε) can be used to express the adsorption equilibrium relation (independent of temperature) between adsorbate-adsorbent combinations. The adsorption potential ε, which is essential for D-R isotherm and can be calculated by Eq. (12) (Piccin et al., 2011).
R = gas constant (8.314 J/mol K),
T = absolute temperature (K) and.
Ce = adsorbate equilibrium concentration (mg/L). The D-R isotherm can be shown by Eq. (13).
Kad = Dubinin–Radushkevich isotherm constant (mol2/kJ2).
qe = amount of adsorbate in the adsorbent at equilibrium (mg/g),
ε = Dubinin–Radushkevich isotherm constant and.
qs = theoretical isotherm saturation capacity (mg/g),
Plotting ln qe vs.ε2depicts a straight line having a slope of Kad and an intercept of ln(qs) (Piccin et al., 2011). This is usually utilized to differentiate the physisorption and chemisorption by using mean free energy, E per molecule of adsorbate and it is estimated from Eq. (14) (Dada et al., 2012).
From the plot in Fig. 6 of the Dubinin–Radushkevich isotherm, qs = 30.563 mg/g, the mean free energy, E = 7.96 kJ/mol, concluding that the adsorption is physisorption in nature (Dada et al., 2012).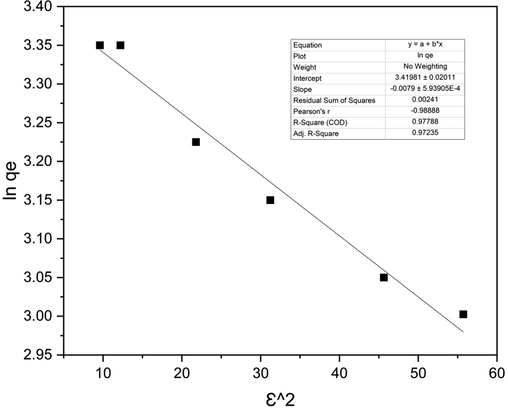
The Dubinin–Radushkevich isotherm model graph for 2.5 g adsorbent loading.
3.4.2 Temkin isotherm
Temkin isotherm model considers interactions among adsorbate and adsorbent and neglects the extremely small and large concentration values, therefore, assuming that heat of adsorption of all molecules reduces linearly and not logarithmically with an increase in the adsorbent surface (Piccin et al., 2011). Temkin isotherm is represented by Eq. (15) (Dada et al., 2012).
B = Constant related to the heat of sorption (J/mol)
bT = Temkin isotherm constant
T = Temperature at 298 K.
R = universal gas constant (8.314 J/mol/K)
AT = Temkin isotherm equilibrium binding constant (L/g)
AT value corresponds to the maximum binding energy.
According to the equation, adsorption is characterized by a consistent distribution of binding energies till a maximum binding energy and can be analyzed from the graph (Fig. 7) between qe and lnCe, and constants were calculated from the graph (Table 10). The calculated AT = 0.0221 L/g and B = 10.077 J/mol values suggest that the heat of sorption is in the range of a physical adsorption process.Fig. 8.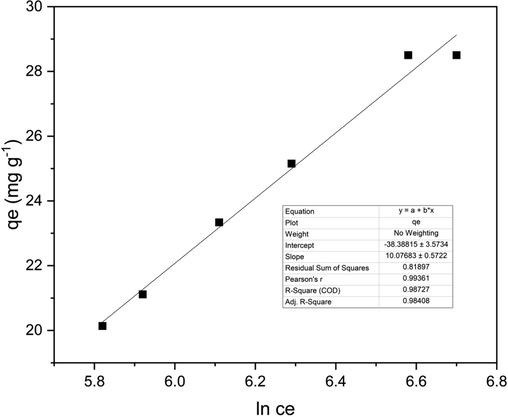
The Temkin isotherm model graph for 2.5 g adsorbent loading.
D-R Isotherm
qs (mg/g)
30.563
Kad
0.0079
E (kJ/mol)
7.96
R2
0.977
Temkin Isotherm
AT (L/g)
0.0221
B (J/mol)
10.077
bT (J/mol K)
249.993
R2
0.987
Halsey Isotherm
N
−2.421
Khe
0.2299
R2
0.982
Harkin Jura Isotherm
B
3.223
A (mg/g)
291.7
R2
0.959
Elovich Isotherm
qm
17.85
Ke
0.0106
R2
0.958

Halsey Isotherm graph for 2.5 g adsorbent loading.
3.4.3 Halsey isotherm
Halsey isotherm was studied on the equilibrium data for 2.5 g adsorbent loading using the linearized equation
The graph was plotted between lnqe vs. lnCe, and the slope and intercept were used to calculate Halsey’s isotherm constants nH and KH (Amin et al., 2015). Table 10 shows the values of Halsey’s constants. The R2 value of 0.982 shows that the equilibrium data fit properly for the data, and this model can be used for an explanation of the system. The heterogeneous nature of the adsorbent and multilayer adsorption was estimated from the analysis.
3.4.4 Harkin-Jura isotherm
Harkin-Jura Isotherm was studied on the equilibrium data for 2.5 g adsorbent loading using the equation.
Graph (Fig. 9) between logCe and 1/qe2 was plotted to find the H-J constants; Table 10 shows H-J constants calculated from the graph(Amin et al., 2015). The R2 was found to be 0.959, thus indicating it is a good fit and therefore supports multilayer adsorption onto adsorbent with heterogeneous pore distribution.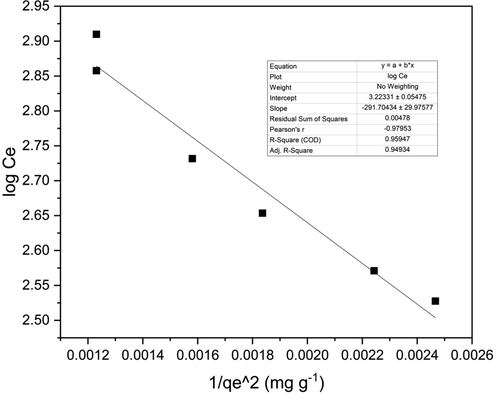
Harkin-Jura Isotherm graph for 2.5 g adsorbent loading.
3.4.5 Elovich isotherm
Elovich isotherm model is calculated for 2.5 g and is described by Eq. (19), which is derived from the presumption that as the adsorption sites increase, the adsorption also increases exponentially, therefore, suggesting a multilayer adsorption process (Farouq & Yousef, 2015)
qm = Elovich maximum adsorption capacity
Ke = Elovich constant
The Elovich isotherm is depicted by a straight line between ln(qe/Ce) versus qe, as presented in Fig. 10. Elovich constants are calculated from the graph (Table 10) (Riyanto & Prabalaras, 2019). For our experiment, the values were found to be qm = 17.85 and Ke = 0.0106. The R2 value was 0.958 showing a good fit of our data for the Elovich isotherm.Fig. 11.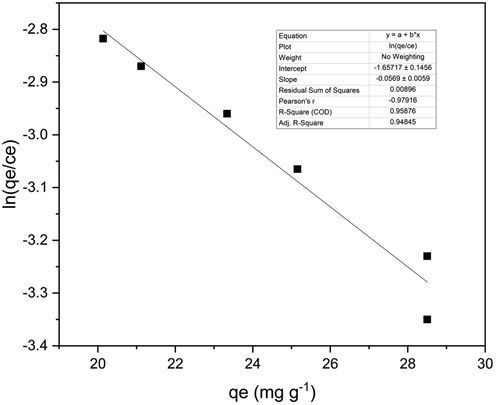
The Elovich isotherm graph for batch study 2.5 g adsorbent loading.
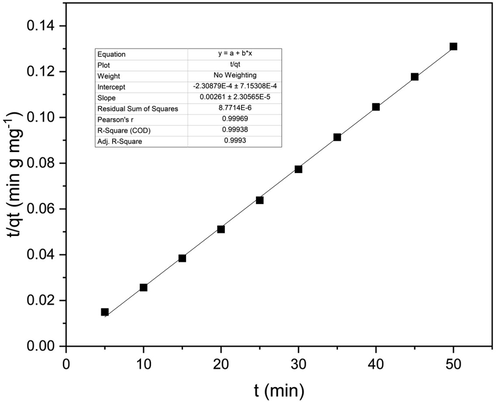
Pseudo – second order kinetic model graph for column study.
3.5 Column studies
3.5.1 Kinetics
Kinetic modeling for the column study was conducted using Eqs. (1) and (2) for the pseudo-first-order and pseudo-second-order, respectively. Calculations showed that column studies were not fitting for pseudo-first-order and the system was fitting for pseudo-second-order with an R2 value of 0.999. The rate constant k2 of the column study was 6.862 x10⁻³ (g/ mg min). Therefore the column study of the adsorption of phenol using activated carbon can be best described using pseudo-second-order kinetics.
3.5.2 Thermodynamics
The ΔG value estimated from thermodynamic Eq. (4) was − 5.3498 kJ/mol. The value corresponds to physisorption, and the negative value concludes the process to be spontaneous and hence adsorption is feasible (see Fig. 12 and 13).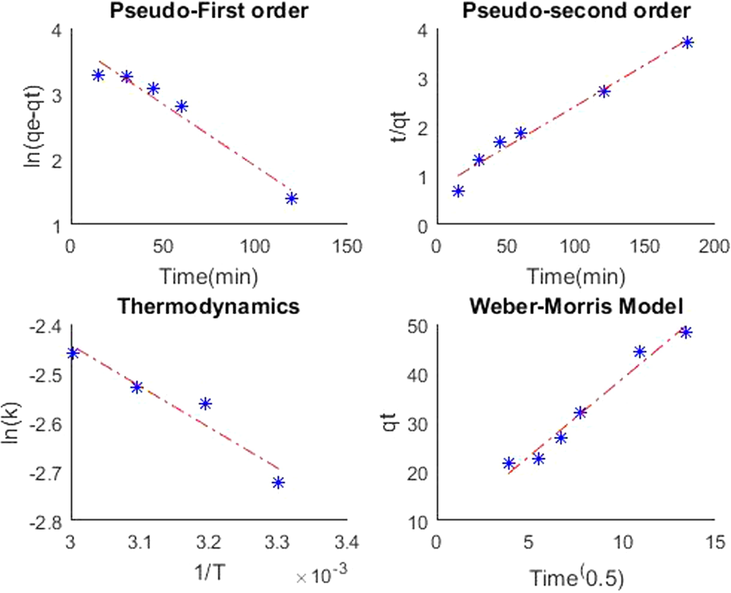
MATLAB output graph for kinetics, thermodynamics and Weber-Morris Model for 2.5 g adsorbent loading.
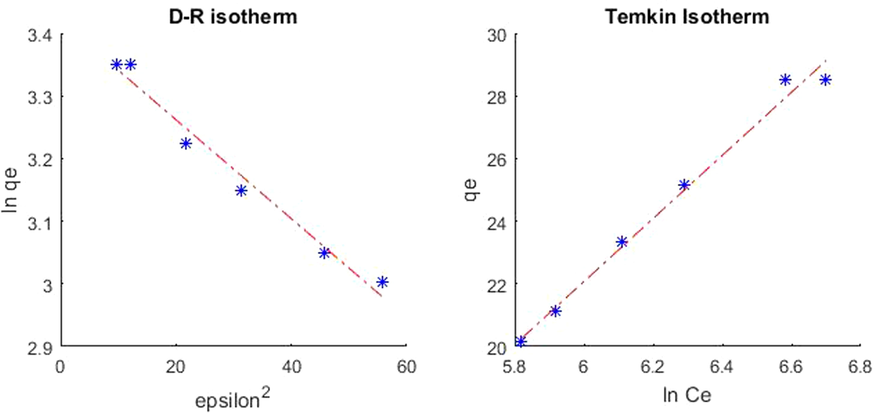
MATLAB output graph for isotherm models for adsorbent loading 2.5 g.
4 MATLAB coding
The calculations carried out in the paper were coded using MATLAB.
4.1 Kinetics Study, Thermodynamics, and diffusion model MATLAB Output
Kinetic Study
Enter the Ct values: [640.235,622.923,551.063,467.585,260.525,192.512]
Enter the time values: [15,30,45,60,120,180]
Enter the Co value: 1000
Enter the volume value (in Litres): 0.15
Enter the m value (in grams): 2.5
PSEUDO-FIRST ORDER KINETICS
The qe value is 44.089078 mg/g
The pseudo-first-order rate constant K1 is 0.018927 1/min
PSEUDO-SECOND ORDER KINETICS
The qe value is 59.611379 mg/g
The pseudo-second-order rate constant K2 is 0.019499 g/mg min
THERMODYNAMIC STUDY
Enter the temperature values (Kelvin): [303,313,323,333]
Enter the respective Ce values for each temperature: [477.198,437.198,429.058,412.058]
Enter the respective qe values for each temperature: [31.36812,33.76812,34.25652,35.27652]
The Gibbs-free energy at 303 Kelvin is 6857.455714 J/mol
The Gibbs-free energy at 313 Kelvin is 6664.103354 J/mol
The Gibbs-free energy at 323 Kelvin is 6787.981998 J/mol
The Gibbs-free energy at 333 Kelvin is 6804.977359 J/mol
The enthalpy of the system is 6971.832271 J/mol
The entropy of the system is 0.607725 J/molK
WEBER MORRIS MODEL
The kp value is 3.144597 mg/g min^1/2
The intercept is 7.402948
4.2 Isotherm models MATLAB output
ISOTHERM ANALYSIS
Enter the temperature value(in Kelvin): 303
Enter the Ce values: [336.97,372.41,450.34,539.15,720.54,812.4]
Enter the qe values: [20.1358,21.1153,23.336,25.1535,28.5027,28.5027]
D-R ISOTHERM
The Kad value is 0.007897 mol^2/kJ^2
The qs value is 30.563528 mg/g
The energy value is 7.956935 kJ/mol
TEMKIN ISOTHERM
The B value is 10.076832
The At value is 0.022158
The bT value is 249.993440
5 Comparison of adsorption performance
Efficiency and cost are key factors in deciding whether to use an adsorbent. For this reason, the activated carbon-coated glass beads examined in this study was compared with the previously reported adsorbents. Table 11 presents the comparison of the phenol adsorption capacities of various adsorbents. Based on the comparison, it is evident that the activated carbon-coated glass beads adsorbent was much more effective at adsorbing phenol than most of the reported adsorbents. Thus, the adsorbent investigated in this study can be used for a practical method of removing phenol from wastewater.
Adsorbent
Theoretical maximum adsorption capacity, Qm (mg/g)
References
Iron impregnated activated carbon
2
(Mihoc et al., 2014)
Acid modified bentonite
6.8
(Ahmadi and Igwegbe, 2018)
Borassus flabellifer fruit husk activated carbon
13.42
(Sathya Priya and Sureshkumar, 2020)
Chitosan modified with carbon nanotubes
162
(Alves et al., 2019)
Clarified sludge from basic oxygen furnace
1.05
(Mandal and Das, 2019)
High-silica zeolites
160 μmol/g
(Jiang et al., 2020)
Zinc oxide
12.42
(Dehmani et al., 2021)
Activated/KOH adsorbent from Enterolobium contortisiliquum
1.81
(Lima et al., 2022)
Activated-carbon-coated glass beads
17.12
This work
6 Conclusion
The study of the adsorption of phenol from wastewater onto activated carbon-coated glass beads was conducted in this study and the following conclusions are presented. The thermodynamic studies helped us to identify the nature of the adsorption process taking place. Unlike the results from Gopinathan et al. (2016), which were found to be spontaneous and exothermic for the removal of Orange G by adsorption using activated carbon, our results were found to be non-spontaneous and endothermic for batch studies and spontaneous for column studies. The system follows physisorption, which was indicated by the low values of enthalpy and Gibbs free energy, similar to the results obtained for batch studies by Kang et al. (2013). The Diffusion model analysis conducted indicates that there is more than one rate-controlling step, which can be concluded from the non-linear nature of the graph. The graph was found not to pass through the origin and the intercept value was seen to be decreasing with increasing adsorbent loading, suggesting that the boundary layer effect also decreases with an increase in adsorbent loadings. The effective diffusion rate indicated pore diffusion. The mass transfer coefficient decreased with an increase in adsorbent loading. From the kinetic study, it is concluded that the adsorption follows pseudo-second-order kinetics with all R2 values above 0.97 for various adsorbent loading. Majority of the references used concluded with a pseudo-second-order reaction kinetics for adsorption. The isotherm study conducted concludes that the adsorption is best fitting for the Temkin isotherm model with R2 = 0.987 compared to the other isotherm models. Moreover, the Temkin constants and the D-R isotherm energy value indicated physisorption. It is noteworthy that the mechanisms related to the LSCFB bioreactor system generally require a significant number of experiments which eventually depends on time, costs, and resources. One way to circumvent these obstacles is using predictive modeling, which is an elegant and efficient method to investigate any complex system. Hence calculations involved in this project were coded using MATLAB and inferences made from the obtained results are discussed to facilitate further studies and future modeling using ANN.
Acknowledgement
The authors are thankful to Vellore Institute of Technology, Vellore, for providing SEED money Grant FY 201718 along with facilities to complete this project.
Declaration of Competing Interest
The authors declare that they have no known competing financial interests or personal relationships that could have appeared to influence the work reported in this paper.
References
- Phenol Removal from Aqueous Solutions by a Novel Industrial Solvent. Chem. Eng. Commun.. 2014;202(3):408-413.
- [CrossRef] [Google Scholar]
- Adsorptive removal of phenol and aniline by modified bentonite: adsorption isotherm and kinetics study. Appl. Water Sci.. 2018;8:1-8.
- [Google Scholar]
- Guidelines for the use and interpretation of adsorption isotherm models: A review. J Hazard Mater. 2020;393:122383
- [CrossRef] [Google Scholar]
- An empirical model for adsorption thermodynamics of copper (II) from solutions onto illite clay-batch process design. J. Chil. Chem. Soc.. 2014;59(4):2686-2691.
- [Google Scholar]
- Adsorption of phenol onto chitosan hydrogel scaffold modified with carbon nanotubes. J. Environ. Chem. Eng.. 2019;7:103460
- [Google Scholar]
- Adsorptive Removal of Reactive Black 5 from Wastewater Using Bentonite Clay: Isotherms, Kinetics and Thermodynamics. Sustainability. 2015;7(11):15302-15318.
- [CrossRef] [Google Scholar]
- Investigation of green functionalization of multiwall carbon nanotubes and its application in adsorption of benzene, toluene & p-xylene from aqueous solution. J. Clean. Prod.. 2019;221:323-338.
- [CrossRef] [Google Scholar]
- Bisphenol Analogues Other Than BPA: Environmental Occurrence, Human Exposure, and Toxicity-A Review. Environ Sci Technol. 2016;50(11):5438-5453.
- [CrossRef] [Google Scholar]
- Langmuir, Freundlich, Temkin and Dubinin-Radushkevich isotherms studies of equilibrium sorption of Zn2+ unto phosphoric acid modified rice husk. IOSR Journal of Applied Chemistry. 2012;3(1):38-45.
- [Google Scholar]
- Phenol adsorption mechanism on the zinc oxide surface: Experimental, cluster DFT calculations, and molecular dynamics simulations. J. Mol. Liq.. 2021;324:114993
- [Google Scholar]
- Mass Transfer Studies on Adsorption of Phenol from Wastewater UsingLantana camara, Forest Waste. Int. J. Chem. Eng.. 2016;2016:1-11.
- [CrossRef] [Google Scholar]
- Adsorption Characteristics of Activated Carbon for the Reclamation of Colored Effluents Containing Orange G and New Solid-Liquid Phase Equilibrium Model. J. Chem. Eng. Data. 2016;62(1):558-567.
- [CrossRef] [Google Scholar]
- Application of Dubinin-Radushkevich isotherm model at the solid/solution interface: A theoretical analysis. J. Mol. Liq.. 2019;277:646-648.
- [CrossRef] [Google Scholar]
- Adsorption of dyes from aqueous solutions on activated charcoal. J Hazard Mater. 2007;139(1):57-66.
- [CrossRef] [Google Scholar]
- Adsorption of triclosan, trichlorophenol and phenol by high-silica zeolites: Adsorption efficiencies and mechanisms. Sep. Purif. Technol.. 2020;235:116152
- [Google Scholar]
- Adsorption isotherm, kinetic and thermodynamic studies of activated carbon prepared fromGarcinia mangostanashell. Asia Pac. J. Chem. Eng.. 2013;8(6):811-818.
- [CrossRef] [Google Scholar]
- Removal of tetracycline from wastewater using circulating fluidized bed. Iraqi Journal of Chemical and Petroleum Engineering. 2020;21:29-37.
- [Google Scholar]
- Adsorption performance and optimization by response surface methodology on tetracycline using Fe-doped ZIF-8-loaded multi-walled carbon nanotubes. Environ. Sci. Pollut. Res. 2022:1-14.
- [Google Scholar]
- Alternative activated/KOH adsorbent for phenol adsorption: experimental, industrial case study and mass transfer interpretation. Environ. Sci. Pollut. Res.. 2022;29:77698-77710.
- [Google Scholar]
- Hydrodynamics and adsorption performance of liquid–solid fluidized bed with granular activated carbon for removal of copper ions from wastewater. J. Clean. Prod.. 2021;328:129627
- [Google Scholar]
- Phenol adsorption from wastewater using clarified sludge from basic oxygen furnace. J. Environ. Chem. Eng.. 2019;7:103259
- [Google Scholar]
- Adsorption of phenol and p-chlorophenol from aqueous solutions by magnetic nanopowder. Water Sci. Technol.. 2014;69:385-391.
- [Google Scholar]
- Removal of amoxicillin from aqueous solution in batch and circulated fluidized bed system using zinc oxide nanoparticles: hydrodynamic and mass transfer studies. Environ. Nanotechnol. Monit. Manage.. 2022;17:100648
- [Google Scholar]
- Adsorptive removal of phenol using banyan root activated carbon. Chem. Eng. Commun.. 2019;208(6):831-842.
- [CrossRef] [Google Scholar]
- Simultaneous carbon, nitrogen and phosphorous removal from municipal wastewater in a circulating fluidized bed bioreactor. Chemosphere. 2006;65(7):1103-1112.
- [Google Scholar]
- Adsorption isotherms and thermochemical data of FD&C Red n 40 binding by chitosan. Braz. J. Chem. Eng.. 2011;28(2):295-304.
- [Google Scholar]
- A Review of Technologies for the Phenolic Compounds Recovery and Phenol Removal from Wastewater. Process Saf. Environ. Prot. 2021
- [Google Scholar]
- Removal of Major Pollutants from Petroleum Wastewater by Adsorption with Activated Carbon Derived from Date Seed in an Inverse Fluidized Bed. Arab. J. Sci. Eng. 2022:1-13.
- [Google Scholar]
- Synthesis of Borassus flabellifer fruit husk activated carbon filter for phenol removal from wastewater. Int. J. Environ. Sci. Technol.. 2020;17:829-842.
- [Google Scholar]
- Continuous Phenol Removal Using a Liquid-Solid Circulating Fluidized Bed. Energies. 2020;13(15)
- [CrossRef] [Google Scholar]
- How do the HSDM and Boyd’s model compare for estimating intraparticle diffusion coefficients in adsorption processes. Adsorption. 2014;20(5–6):737-746.
- [CrossRef] [Google Scholar]
- Adsorption of phenols onto granular activated carbon in a liquid–solid fluidized bed. Journal of Chemical Technology & Biotechnology: International Research in Process, Environmental AND Clean Technology. 1997;68(2):187-194.
- [Google Scholar]
- Initial behavior of intraparticle diffusion model used in the description of adsorption kinetics. Chem. Eng. J.. 2009;153(1–3):1-8.
- [CrossRef] [Google Scholar]
- Robust removal of phenolic compounds from coal pyrolysis wastewater using anoxic carbon-based fluidized bed reactor. J. Clean. Prod.. 2021;280:124451
- [CrossRef] [Google Scholar]
- (Gas-) liquid-solid circulating fluidized beds and their potential applications to bioreactor engineering. Can. J. Chem. Eng.. 2000;78(1):82-94.
- [Google Scholar]


