

Translate this page into:
Intake of toxic metals through dietary eggs consumption and its potential health risk assessment on the peoples of the capital city Dhaka, Bangladesh
⁎Corresponding authors. dulon.roy@zool.jnu.ac.bd (Dulon Roy), dulonroy@gmail.com (Dulon Roy), jahanms@yahoo.com (Md. Shajahan)
-
Received: ,
Accepted: ,
This article was originally published by Elsevier and was migrated to Scientific Scholar after the change of Publisher.
Peer review under responsibility of King Saud University.
Abstract
Around the world, hen meat and eggs are very widely consumed in dishes like curries, processed cuisine, and fast food. The ingestion of contaminated eggs poses a biochemical risk from the perspective of food safety due to the presence of heavy metal and trace element residues in hen eggs. The purpose of this study was to examine the concentrations of heavy metals in eggs from commercial chicken farms from capital city and hens from local area in order to identify the most significant heavy metal concentration in hen eggs. The concentrations of Cd, Cr, Cu, Pb, Mn, Ni, Fe, Zn, Co and As in samples of hen eggs collected from different locations were measured in the present study and concentrations of these selective metals were found to be between < 0.001, 0.01–0.89, 0.81–0.015, 0.81–58.8, 0.32–1.9, 0.05–1.03, 0.04–0.38, 10.6–104.02, 2.41–48.46, 0.04–0.5 mg/kg-fw and BDL respectively. The findings showed that Cu, Pb, Fe and Zn had levels over the dietary food's maximum permissible limit (MPL). Multivariate statistical studies showed that human activity was the main contributor to the presence of heavy metals in the sampled diets. Estimated daily intake (EDI), target hazard quotient (THQ) of individual heavy metals, and carcinogenic risk (CR) for lifetime exposure were used to evaluate the risks to human health associated with dietary intake of these metals through consumption of hen eggs. Provisional tolerable daily intake values (PTDI) for Pb, Cu, Zn, and Fe were higher, indicating that these metals might be harmful to human health if consumed in eggs by both children and adults. The evaluated foodstuffs can be consumed with low or less risk of exposure to heavy metals because the computed values of THQ and CR were below their respective allowed thresholds.
Keywords
Bioaccumulation
Heavy metal
Egg
Food safety

1 Introduction
In recent decades, food safety is a serious public concern worldwide, because most of the cases animal origin food is contaminated by the heavy metals and trace elements. As heavy metals are non-biodegradable, toxic, persistent, as well as having the capability to accumulate in ecosystems and enter human bodies through the food chain, they have attracted scientific attention because of the serious risks that they pose to both human health and the environment (Roy et al. 2022; Xin et al. 2015). Contaminants have already been divided into several categories in chemistry, notably hazardous (arsenic, cadmium, lead, mercury, chromium, nickel, etc.), maybe essential (vanadium), and essential (copper, zinc, iron, manganese, selenium, and cobalt) metals (Makedonski et al. 2017; Jaishankar et al. 2014). Especially heavy metals can have both advantageous and detrimental effects on the human body in accordance with their nature, quantity, and level of exposure; therefore, their existence demands study (Shaheen et al. 2016). Additionally, prolonged exposure to these metals has been linked to a number of harmful effects on human bodies, such as mutagenic and teratogenic effects, bone diseases, cardiovascular disease, infertility, neurotoxicity, kidney issues, depression, hypertension, mental disorders, gastrointestinal cancer, gastric ulcers, psychological disorders, sideroblastic anemia, numerous liver issues, and loss of taste, smell, and appetite etc. Global environmental pollution with heavy metals has increased sharply in recent years due to rapid industrialization, deforestation, and dumping of trace metal containing waste in residential areas etc. which has led to increased anxiety about metal contamination of food, particularly in feed or feed additives in poultry food products (Briffa et al. 2020; Ullah et al. 2021).
Poultry subsector is an essential component of Bangladesh's agricultural system and has provided about 6 million people with support services as well as direct and indirect employment opportunities. This poultry sub-sector has proven to be a lucrative economic endeavor, demonstrating its significance for the whole economy. The sector is expanding quickly and contributes 14% of the value of all livestock production. We learn that 37% of Bangladesh's total meat production comes from just poultry. Of the nation's entire supply of animal protein, poultry accounts for roughly 22–27% (Hamid et al. 2017). Hen’s eggs is the most important foods for human because of their high nutritional value, heavier source of protein, essential trace elements, minerals, vitamins, low cost and easy preparation (Rubio et al. 2017; Giri and Singh 2017). Hen eggs are an inexpensive source of high-quality nutrients and play a significant part in the daily diets of people all over the world (Fakayode and Olu-Owolabi 2003). Additionally, eggs are a reliable marker of environmental pollution (Esposito et al. 2016). There may be a variety of causes contributing to the increased concentration of different metals in poultry products, including feed, water, litter, housing equipment, and the environment in which the they live (Codling et al. 2008). Heavy metals can accumulate inside eggs (Burger et al. 2009). The concentration of potentially toxic elements (PTEs) in eggs is an indication of fear, despite the fact that eggs might contain a high concentration of PTEs that originate from water and food (Farahani et al., 2015). According to a recent study on egg intake in adults, eating one egg per day can reduce stroke risk by 12% (Huhtamaki 2019).
There are few studies carried out on hen egg based on the determining metal contamination of poultry eggs and the adverse effect of their consumption on human and organisms (Korish and Attia 2020; Hashemi et al. 2019; Islam et al. 2015; Shaheen et al. 2016). Furthermore, given the range of chicken and eggs available in the capital city, there is very little information on the heavy metal concentration in hen eggs. Particularly, there is no such kind of article that focuses on the comparison of contamination level of toxic metal between poultry eggs and household/domestic eggs. Consequently, this work aims (i) to attain a narrative data on potentially toxic elements (PTEs) contamination of the eggs collected from backyards grown hens (domestic/ household) and few famous markets of Dhaka, the 6th-most densely populated city in the world and largest city of Bangladesh. (ii) to determine the levels of Pb, Cd, Cu, Mn, Ni, Cr, Fe, Co, Zn and As in egg mixture (yolk with albumen), yolk and albumen separately and to know their possible sources. (iii) to evaluate the risk of carcinogenic and non-carcinogenic effects due to the consumption of poultry products. Besides, the intention of the present investigation was to use Atomic Absorption Spectrometer (AAS) to analyze metal concentration on the yolk, albumen and yolk with albumen of eggs from various housing systems (Ullah et al. 2021, Ahmed et al. 2017). Some of the scientists used ICP-MS in high sensitivity mode for chemical analysis of metals in egg (Aliu et al. 2021, Hashemi et al. 2019).
2 Materials and methods
2.1 Study area and sampling
In this study, 72 eggs of poultry chicken were collected from six wholesale markets of Dhaka city (Fig. 1). 12 egg was collected from different shop of every wholesale market. The egg supply to the local level of Dhaka city people are conducted from these markets. Therefore, sample from these markets represent the overall scenario of egg of Dhaka city. Name of these markets are Mohakhali, Mohammodpur, Savar, Mirpur-1, Jatrabari and Karwan Bazar. Samples were collected from 12 July 2020 to 17 July 2020. 12 eggs of free range hen were collected from Madaripur during August 5 to August 10 of 2020.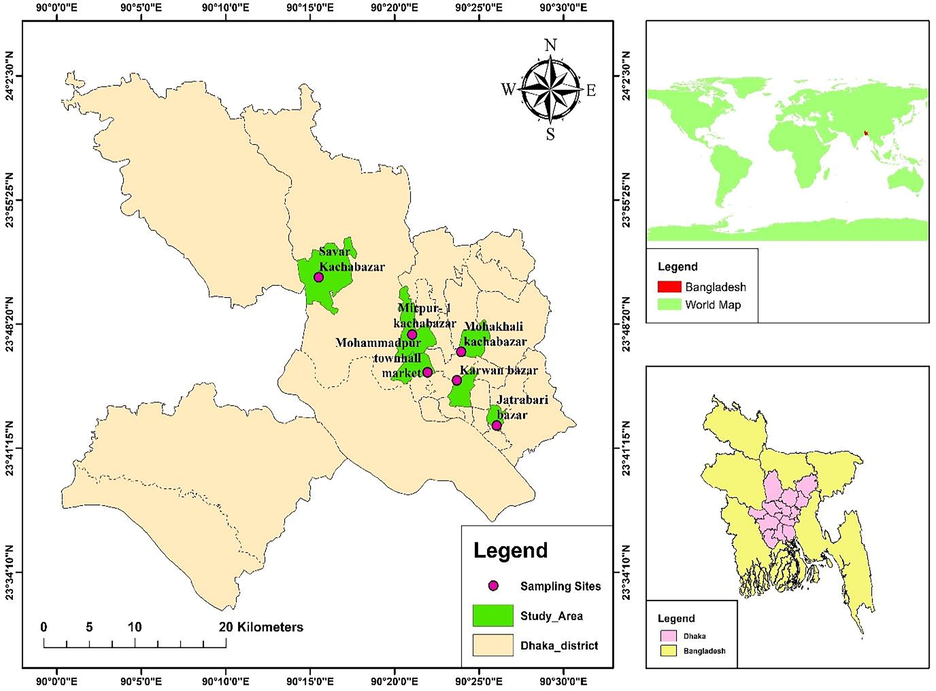
Sampling locations.
All egg samples were comprised of 7 egg boxes with 12 eggs in each box. After labelling, they were transferred to the laboratory and stored in the refrigerator at 4 °C until drying to constant mass for analysis. In the process of sample transfer and storage, we ensured that the samples did not make contact with metal instruments in order to avoid cross-contamination.
2.2 Sample preparation
For sample analyses, each egg was washed with de-ionized water and rinsed spoon was used to break each egg separately. After this, egg yolk and albumen or white part of egg were separated via plastic bottle, and then placed them into beaker separately. All the samples were oven-dried in an oven at 80 °C until constant weight. To ensure complete moisture removal weight of dried egg sample was taken several times until constant weight was attained. Dried samples were powdered using a pestle and mortar. There was about 76.37% moister contain for homogenized (yolk + albumen) egg samples, for yolk 88.49% and for albumin 53.42%.
2.3 Sample digestion
Samples were prepared by nitric acid digestion which is established by Zheljazkov and Nielson (1996) as this method is more effective than the other digestion methods. One gram of sample was placed in a 250 ml digestion tube and 10 ml of concentrated HNO3 was added. The sample was heated for 45 min at 90 °C, and then the temperature was increased to 150 °C at which the sample was boiled for at least 8 h until a clear solution was obtained. Concentrated HNO3 was added to the sample (5 ml was added at least three times) and digestion occurred until the volume was reduced to about 1 ml. The interior walls of the tube were washed down with a little distilled water and the tube was swirled throughout the digestion to keep the wall clean and prevent the loss of the sample. After cooling, 5 ml of 1% HNO3 was added to the sample. The solution was filtered with Whatman No. 42 filter paper and < 0.45 μm Millipore filter paper. It was then transferred quantitatively to a 25 ml volumetric flask by adding distilled water.
2.4 Instrumental analysis
The collected egg samples were analyzed for chemical elements viz., Cr, Fe, Mn, Co, Cu, Zn, Pb, Cd and As using Atomic Absorption Spectrometer (AAS, Model: Spectra AA 240FS, Varian, Australia) at the Institute of National Analytical Research and Service (INARS), Bangladesh Council of Scientific and Industrial Research (BCSIR), Dhaka, Bangladesh. Samples were prepared by Ashing method following Ullah et al. 2021 and Roy et al. 2021 ) with little modifications. In brief, 5 g of samples were made ash in a Muffle furnace at 600 °C followed by acid treatment (2:1 conc. HNO3 and HClO4). Final volume of the samples solution was made up to 100 ml and then stored them at −4°C until analysis in the laboratory. A blank sample was also prepared for quality control. The analysis of all samples for chemical elements were carried out following our previous works (Ahsan et al. 2019, Roy et al. 2021, Roy et al. 2022) and the quality control to produce reliable data were almost same as before (Ahsan et al. 2019, Roy et al. 2022). During analysis, accuracy and precision were verified by using Certified Reference Materials (CRM) from Fluka Analytical, Sigma-Aldrich and spike recovery for all elements were 90–110% as calculated by following an equation reported earlier (Ahsan et al. 2019).
2.5 Quality control
The samples were prepared and analyzed using a standard quality assurance/quality control (QA/QC) system to ensure proper and accurate research findings. Before use, deionized water was used to clean the apparatus and sample containers, and disinfection was done with 100 percent acetone (CH3)2CO. The spectrAA program on a computer given by the manufacturer automated and handled the apparatus maintenance, data gathering, and interpretation. The spectrophotometer readings were normalized for each element. Repeat analysis (RSD < 5%) also was used to verify the analysis accuracy and precision (Ahsan et al. 2018). Limit of detection (LOD) for metal analysis shown in Table 1.
Metals
Cd
Cr
Cu
Pb
Mn
Ni
Fe
Zn
Co
As
Detection limit
0.001
0.005
0.1
0.005
0.05
0.025
0.1
0.05
0.025
0.002
PTDIa (mgkg1day−1)
0.00066
0.003
0.5
0.0035
0.14
0.005
0.8
1.0
0.5
0.0003
2.6 Estimation of health risk
2.6.1 Estimated daily intake of heavy metals
Metal concentrations in samples, daily consumption, and body weight were used to calculate the estimated daily intake (EDI). The following formula was used to calculate the estimated daily intakes (EDIs) of heavy metals from egg consumption (Shaheen et al. 2016).
Where, FIR stands for food ingestion rate (g/person/day), MC stands for mean metal content in food samples (mg/kg), and BW stands for body weight of consumer. According to the “Report of the household income and expenditure survey 2016,” an individual of 60 kg body weight consumes 17.33 g of chicken meat and 13.58 g of egg on average (BBS, 2018).
2.6.2 Target hazard quotient (THQ)
To estimate the human health risk from consuming metal contaminated eggs, the methodology for estimation of target hazard offers an indication of the risk level due to pollutant exposure, this method was available in USEPA Region III risk-based concentration table is used to determine the target hazard quotient (THQ) (USEPA 2000). The following formula was used to calculate THQ:
× 10-3
Where EF stands for exposure frequency (ranging from 365 days per year for persons who eat eggs many times a week to 52 days per year for people who eat eggs only once a week). FIR is for food ingestion rate (egg: 37.2 g/person/day) and ED stands for exposure duration (70 years), which is equivalent to a lifetime. RfD is the oral reference dose (mg/kg-bw/day), and MC is the mean metal concentration (mg/kg-fw) in egg content (USEPA, 2000); BW is the average body weight (64 kg, the reference weights for the age categories were taken from numerous local studies in Malaysia (Lim et al., 2000), and TA is the averaging exposure duration for non-carcinogens (365 days/year × number of exposure years, assuming 70 years). If the HQ value is greater than one, it indicates that the metal poses a risk.
The term “reference dose” refers to a level of exposure to which a consumer can be exposed for an extended length of time without being harmed. The RfDs 0.0035 mg/kg-bw/day for Pb, 0.00083 mg/kg-bw/day for Cd, 0.0083 mg/kg-bw/day for Cr, 0.003 mg/kg-bw/day for As and 0.00057 mg/kg-bw/day for Hg are suggested by the Joint FAO/WHO Expert Committee on Food Additives (JECFA) (Zheng et al., 2020). The RfDs for Cu, Mn, Fe, Zn and Ni are 0.04 mg/kg-bw/day, 0.183 mg/kg-bw/day, 0.667 mg/kg-bw/day, 0.667 mg/kg-bw/day, and 0.91 mg/kg-bw/day respectively, according to the Chinese Nutrition Society (CNS) guidelines (Zheng et al. 2020).
2.6.3 Hazard index
The hazard index (HI) is a calculation of total THQs from numerous hazardous metals or pollutants. It is defined as the summation of the hazard quotients as follows (USEPA 2011): HI = THQ (Cd) + THQ (Cr) + THQ (Cu) + THQ (Pb) + THQ (Mn) + THQ (Ni) + THQ (Fe) + THQ (Zn) + THQ (Co)
Where, HI stands for the hazard index and THQ denotes the target hazard quotient for the consumption of specific elements designated in bracket.
2.6.4 Cancer risk (CR)
A carcinogen's carcinogenic risk (CR) indicates the incremental likelihood of a consumer developing cancer over the period of their lifetime exposure to that carcinogen. The following formula was used to calculate the cancer risk from Pb, Cd, and Cr exposure over a lifetime (USEPA 1989, 2006).
CR = (EF × ED × FIR × MC × CSFo) ∕ (BW × TA) × 10-3.
Where, CSFo is the carcinogenic slope factor of 0.0085 (mg/kg/day)-1 for Pb, 6.3 (mg/kg/day)-1 for Cd, 0.5 (mg/kg/day)-1 for Cr, and 1.5 (mg/kg/day)-1 for inorganic As set by USEPA (USEPA 1989; Zheng et al. 2020).
Generally, CR values<1.0E 06 are considered moderate, those greater than 1.0E 04 are rated undesirable, and those between 1.0E 06 and 1.0E 04 are considered as acceptable (USEPA 1989, 2010).
2.7 Statistical analysis
To determine means and standard deviations (SD), all analytical values from the Laboratory Information Management System (LIMS) were exported to Microsoft Office Excel 2013 version 15.0. Statistical analysis was carried out with the aid of the statistical tool SPSS 20 (SPSS, USA). At substantial values of p < 0.05, principal component analysis and one-way ANOVA were performed. The relationship among the metals was determined using Pearson's product–moment correlation matrix. The most popular tools for identifying similarity and dissimilarity among the metal concentrations at the research sites were principal component analysis (PCA).
3 Result and discussion
3.1 Metal concentration in eggs
The descriptive analysis of metal concentrations for Cr, Mn, Fe, Ni, Cu, Zn, As, Cd, Co, and Pb is presented in Table 2. In total, trace elements of Cu, Pb, Mn, Ni, Fe and Zn were found in 100% of the examined egg samples, followed by Co (62.5%), Cr (37.5%), while Cd and As are in <0.001 in all egg samples. Further, heavy metal concentrations in all egg (yolk and albumen) samples followed the order: Fe > Zn > Cu > Pb > Mn > Co > Ni > Cr > Cd > As. Among all metals, the essential metals were most abundant in the egg content of all commercial laying hens. In this study, Fe and Zn had the highest average concentration and contribution (85.23% of the total metal concentration) in all the egg samples as iron and zinc are primarily provided by egg yolk (Réhault-Godbert et al. 2019). In this study, heavy metal concentrations in egg samples were also compared with the recommended permissible levels of the heavy metals in foodstuffs set by the Joint FAO/WHO Expert Committee on Food Additives (Hashemi et al. 2019; Aendo et al. 2019; Clemens and Ma 2016), the Codex Alimentarius Commission 2013 (Deng et al. 2007), China national food safety standard (EC 2006; EPA 2005), and the European Commission (Kamalzadeh et al. 2009). LC-Local hen, MK- Mohakhali Bazar, MD- Mohammadpur, SV- Savar, MP- Mirpur-1, JB- Jatrabari, KR-Karwan Bazar, w- albumen and y-yolk.
Sample ID
Total egg/yolk/albumen (g)
Toxic metal concentration (mg/kg)
Cd
Cr
Cu
Pb
Mn
Ni
Fe
Zn
Co
As
LC
Total egg
< 0.001
< 0.005
23.2
0.37
0.45
0.41
51.64
31.35
0.5
BDL
MK
Total egg
< 0.001
< 0.005
24.9
0.29
0.76
0.29
58.57
34.12
BDL
BDL
MD
Total egg
< 0.001
< 0.005
0.81
0.51
0.94
0.04
60.88
39.26
BDL
BDL
SV
Total egg
< 0.001
< 0.005
1.57
1.9
0.51
0.12
63.04
36.25
0.04
BDL
MP
Total egg
< 0.001
< 0.005
2.24
0.5
0.55
0.16
62.22
38.93
0.37
BDL
JB
Total egg
< 0.001
0.01
0.88
1.58
0.89
0.19
64.59
36.88
BDL
BDL
KR-w
Albumen
< 0.001
0.89
0.82
0.79
0.05
0.38
10.59
2.41
0.24
BDL
KR-y
Yolk
< 0.001
< 0.005
58.8
0.32
1.03
0.21
104.02
48.46
0.27
BDL
MPL
0.1a
1.0b
10c
0.1a
6.5d
–
17.6e
20c
–
0.1a
Fig. 2 and Table 2 show the findings about the levels of studied toxic metals in all egg components (albumen, yolk, and whole egg) collected from various markets and home range. The mean Cd levels found in the tested egg samples in this experiment were <0.001 and didn’t exceed the maximum permissible limit (0.1 mg/kg) declared by FAO/WHO (2002). Ullah et al (2021) found the Cd concentration in egg (layer, local and organic) and ranged from 0.01 to 0.015 which is almost similar with the present study. The mean Cd concentrations in the eggs that were actually measured were likewise lower than those that were reported by Shaheen et al. 2016 and Islam et al. 2015. Cadmium contamination of environment and food chain is usually due to the abuse of Cd in industry of batteries, pigments and stabilizers. Mean concentration of Cr ranged from 0.01 to 0.89 mg/kg which didn’t exceed the maximum permissible limit. Ullah et al (2021) found the Cr concentration in egg (layer, local and organic) and ranged from 0.025 to 0.06 mg/kg which is comparable with the present findings. The tannery industry may have contributed to the Cr pollution in the foodstuff (Roy et al. 2022).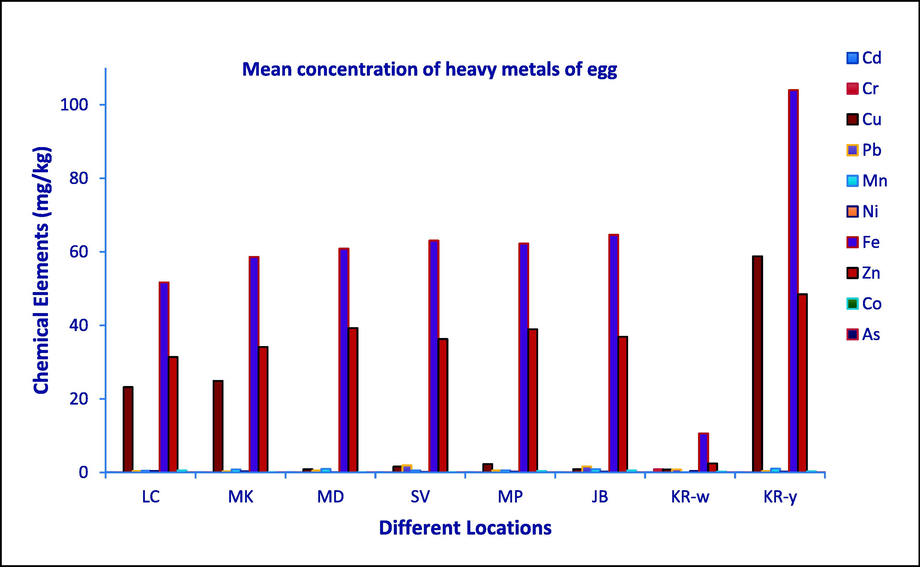
Graphical representation of mean concentration of heavy metals in egg samples collected from different locations.
Cu concentration in the total egg in present study recorded maximum (24.9 mg/kg) collected from Mohakhali market. On the other hand, Cu concentration maximum found in the yolk of the egg. Cu concentration exceeded the MPL in studied egg sample collected from all the markets except Mohammadpur and Jatrabari. The acquired results in all the samples exceeded the United States Department of Agriculture which established a threshold of 0.72 mg/kg for Cu residues in eggs (USDA 2011) as hens are sometimes provided with a control diet to maximize the concentration of Cu that affects the cholesterol content of the egg yolk (Pekel and Alp 2011). Molluscs and crustacean shell are sometimes mixed with poultry feed and these may contributed to the high Cu content in eggs (Taiwo Adekanmi 2022). Environmentally contaminated food, processed food, and soil that has been mineralized by crops can all allows copper (Cu) to enter the food chain (Mahesar et al. 2010). The Cu concentration in the present study is higher than that reported by Ahmed et al. 2017 who listed a Cu concentration of 0.57 ± 0.04 mg/kg in table eggs. In balady, commercial and organic eggs Cu residues (mg/kg) recorded in the examined samples were 11.47 ± 0.66, 4.17 ± 0.42 and 6.15 ± 0.51 respectively (Saad Eldin and Raslan 2018).
Lead concentrations (0.2–1.8 mg/kg) in the all the studied sample including yolk and albumen were higher than FAO/WHO recommendations in this study (0.1 mg/kg) (JECFA 2005). Mean concentration of Pb for all total egg (albumen + yolk) sample was 0.78 ± 0.62 mgkg−1, which also cross the acceptable limit of Pb. Maximum concentration (1.9 mgkg−1) of Pb was found for the egg sample of SV (saver bazar), this happens more frequently when lead-contaminated, water, food, objects or soil are consumed by hen (Cowie and Gartrell 2019). In this study we also found that, albumen of egg sample contain large amount of Pb then egg yolk. Pb contamination in the foodstuffs was significant, as evidenced by the elevated Pb concentrations in almost all of the investigated samples. However, the results from this study regarding Pb concentrations were higher than those obtained by Abduljaleel and Othman 2011 (0.42 mgkg−1), Hashish et al. 2012 (0.3 mgkg−1), Islam et al. 2015 (0.24 mgkg−1) and Shaheen et al. 2016 (0.28 mg kg−1). Overly high Pb levels in foodstuff may also be caused by trash fish that are converted into animal or poultry feed (Kundu et al. 2017; Roy et al. 2022) and due to feed additives, Pb may be present in the egg sample. Additionally, lead is discovered in the tissues of animals and birds that ate tainted vegetables and grains (Ahmed et al. 2017). In humans, excessive lead in meals can seriously harm the brain, kidneys, nervous system, and red blood cells both in children and adults (Wani et al. 2015).
Each of the examined egg samples had mean Mn values that were below the MPL for Mn. But the Mn levels in eggs were much higher in the current investigation than those mentioned by Hashish et al. 2012 and Ullah et al. 2021. Use of rice bran as a poultry feed may be the source of Mn in studied egg samples. Sometimes, clams and mussels are also manufactured with poultry feed which also contributes Mn to foodstuffs (Ansari et al. 2004; USDA 2019).
Nickel (Ni) concentrations recorded in this study was 0.04 to 0.41 mg/kg (Table 2). In commercial eggs, Ni concentration was 0.61 ± 0.74, while it was 0.29 ± 0.05 in organic eggs, according to Saad Eldin and Raslan (2018) which is comparable with the present study. Regarding MPL of nickel, there are no reports. Nickel is a common trace element that can be found in soil, water, air, and the biosphere. In living things, primarily in plants, nickel is also present. It has no impact on the quality of hen eggs because it is highly resistant to damage by air and water (Sharma 2013). However, dietary exposure to nickel compounds is associated with an increased risk of human dermatitis and cancer (Cempel and Nikel 2006).
The concentrations of Fe in all the studied samples were high. It was also investigated the yolk of egg contain more Fe than albumen. According to the USDA, eggs have an average Fe content of 17.6 ppm (USDA 2011). The Fe content of chicken eggs in the current study was higher than that reported by Ullah et al (2021), while it remained nearly comparable to that reported by Hashish et al (2012). The fact that the hens were fed simulated organic feed may be the cause of the high Fe level in eggs. To improve the shell color of eggs and maximize their marketability, iron is usually supplied as a supplement in rations (AL-Ashmawy 2013; Park et al. 2004). Moreover, small prawn which mostly contains a lot of iron, is sometimes fed to chickens.
The results of this investigation show that studied eggs had much higher Zn concentration than MPL (20 mg/kg) established FAO/WHO (JECFA 2005) and maximum concentration of Zn found in the eggs collected from Mirpur markets (Table 2). Both organic and inorganic forms of zinc (Zn) are widely utilized as feed additives. Although organic sources of Zn are more readily absorbed than inorganic ones, inorganic Zn is still very inexpensive (Li et al. 2019). And sometimes smaller concentrations of organic Zn could be added to feed and supplied to hens to maintain production and the quality of eggs (Yu et al. 2020). The Zn concentration of the eggs used in this investigation was higher than that stated by Saad Eldin and Raslan (2018) and Ullah et al (2021). The concentration of Co recorded was 0.5, 0.04, 0.37 and 0.24 mg/kg in the egg samples collected from local chicken, Savar Market, Mirpur Market and from Karwan Bazar (Table 2). On the other hand, egg samples collected from the rest of the markets had BDL of Co concentration. As there is no MPL for Co, so we didn’t categorize the egg samples. All mammals, including humans, require modest amounts of Co since it is an essential nutrient. Cobalamine, a vital part of vitamin B12, is the necessary form of cobalt. In contrast, persistent oral administration of high doses of Co can lead to goiters and excessive consumption of Co can lead to erythropoiesis (Aendo et al. 2018). All investigated egg samples that complied with the allowable limits could not be found to contain arsenic (As) (Table 2).
3.2 Correlation matrix (CM) and principal component analysis (PCA)
By computing a summary index, the Pearson correlation coefficient is a tool that may be used to assess the degree of linear relationship between the pairs of variables (Skrbic' and Onjia 2007). The results of the evaluation and presentation of the metal to metal correlation data in terms of Pearson product moment correlation coefficients that were significant at 99% and 95% confidence levels are shown in Table 3. Correlation Matrix (CM) determined the degree of association among the chemical elements viz., Cr, Fe, Mn, Co, Cu, Zn, Pb, Cd and As. A strong positive significant correlation was obtained between Zn and Fe
), Zn and Mn
and Fe and Mn
while a strong negative significant correlation was obtained between Zn and Cr
), Fe and Cr
, and Mn and Cr
. A strong positive insignificant correlation was obtained between Cu and Fe
), As and Co
Fe and As
and As and Zn
while a strong negative insignificant correlation was obtained between Zn and Ni
), Ni and Mn
, and Pb and Cu
. The rest of the remaining correlations were obtained either moderate or weak insignificant correlation.
Cd
Cr
Cu
Pb
Mn
Ni
Fe
Zn
Co
As
Component
PC 1
PC 2
PC 3
PC 4
Cd
1.00
0.34
−0.20
0.19
0.89**
Cr
−0.03
0.981.00
−0.87**
0.03
−0.06
0.37
Cu
0.15
0.73−0.26
0.541.00
0.50
0.66
−0.37
0.22
Pb
0.23
0.580.006
0.99−0.53
0.181.00
−0.04
−0.58
0.71*
0.03
Mn
0.45
0.27−0.75*
0.0340.43
0.29−0.12
0.781.00
0.90**
−0.13
−0.22
0.20
Ni
−0.30
0.480.49
0.220.25
0.55−0.32
0.44−0.59
0.121.00
−0.58
0.75*
−0.01
0.06
Fe
0.30
0.47−0.78*
0.0230.65
0.081−0.095
0.820.85**
0.007−0.48
0.231.00
0.97**
0.13
−0.04
0.03
Zn
0.19
0.65−0.93*
0.00090.43
0.28−0.067
0.870.87**
0.006−0.60
0.120.94**
0.00051.00
0.98**
−0.01
−0.01
−0.17
Co
0.13
0.76−0.013
0.990.06
0.89−0.006
0.99−0.11
0.790.43
0.290.005
0.99−0.025
0.951.00
0.00
0.62
0.66
0.15
As
0.056
0.90−0.48
0.230.26
0.540.27
0.510.13
0.75−0.058
0.890.53
0.170.5
0.200.58
0.131.00
0.50
0.37
0.70
−0.20
Eigenvalue
4.44
1.92
1.65
1.11
% Total Variance
49.00
21.00
18.00
12.00
Cumulative %
49.00
70.00
88.00
100.00
For factor loadings in each metal, the principal component analysis (PCA) utilizing varimax-normalized rotation was therefore performed. The most significant use of the PCA is the reduction of a large number of variables into a new set of smaller variables based on their interdependence (Manzoor et al. 2006). In principal component analysis (PCA), a set of correlated variables is transformed to a relatively smaller number of linear combinations of them which is obtained by multiplying the original correlated variables with the eigenvalues. These new variables are called principal components (PCs). To understand the structure of the underlying parameters, a scree plot (Fig. 3) was used to determine the significant number of PCs. The results showed that four eigen values greater than 1 explained more than 91% of the total variance (Fig. 3). Table 3 displays the calculated factor loadings, the cumulative variance percentage, and the percentages of total variation explained by each factor. The first factor showed the highest loadings for Zn, Fe, Mn and Cr, explained more than 49.00% of the total variance, so they were mainly derived from common sources. The second factor accounted for about 21.00% of the total variance which showed the highest loadings of Ni, Cu and Co, indicating that they originated from the same origins. The third significant factor with a variance of (18.00%) showed the highest loadings for Pb, and As and the last significant factor with a variance of (12.00%) showed the highest loadings for Cd with its sources differing from the other materials. The correlations among the heavy metals were clear due to Fig. 3′s (inset) three-dimensional display of the PCA loadings. Based on the first four PCs, the relationships between the heavy metals were in good agreement with the correlation study (Table 3).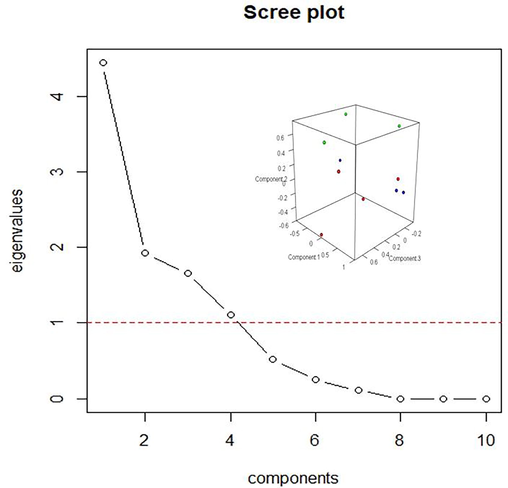
PCA of heavy metals by scree plot of the characteristics roots (Eigen values) and insert shows the three-dimensional plot of the PCA loadings demonstrating the relationships among the heavy metals.
3.3 Comparison of trace metals in different samples in different locations
The highest mean Cr concentration was found in KR-W location following the descending order of JB location = KR-Y location > LC location = MD location = MK location = MP location = SV location egg (Fig. 4). The concentration of Cr in KR-W location and the rest of the remaining locations were statistically significantly different at 0.05 level. The mean concentrations of Cd in the selected samples were found as 0.00015 mg/kg. The highest mean Cu concentration was found in KR-Y location following the descending order of MK location > LC location > MP location > SV location > JB location > MD location > KR-W location egg. Statistically significant difference of concentration of Cu at 0.05 level were found KR-Y and the rest of the remaining locations. The highest mean Pb concentration was discovered in SV location following the descending order of JB location > KR-W location > MD location > MP location > LC location > KR-Y location > MK location egg. In descending order, MD location, JB location, MK location, MP location, SV location, LC location, and KR-W location eggs were followed by the KR-Y site, which had the highest mean Mn concentration. The highest mean Ni concentration was discovered in LC location following the descending order of KR-W location > MK location > KR-Y location > JB location > MP location > SV location > MD location egg. In descending order, JB location, SV location, MP location, MD location, MK location, LC location, and KR-W location eggs were followed by the KR-Y site, which had the highest mean Fe concentration. The highest mean Zn concentration was discovered in KR-Y location following the descending order of MD location > MP location > JB location > SV location > MK location > LC location > KR-W location egg. The highest mean Co concentration was discovered as 0.07 in LC location and JB location following the descending order of MP location > KR-Y location > KR-W location > SV location > MK location = MD location egg.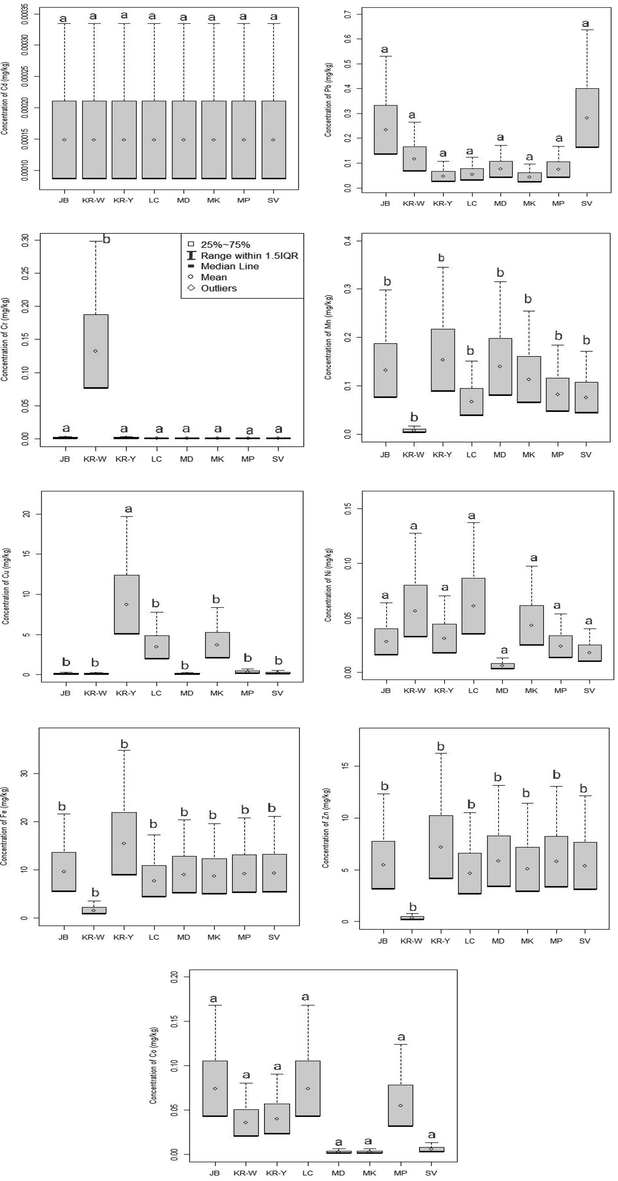
Box-whisker representation indicating the distribution of heavy metals in poultry egg collected from six wholesale markets of Dhaka city. Letters a & b indicate statistically significantly different at 0.05 level (Tukey’s HSD test,
).
3.4 Health risk assessment
3.4.1 Estimated daily intake (EDI)
The estimated daily dietary intake of each metal from the ingestion of hen eggs was presented in Table 4 as a preliminary attempt to assess the risk to human health. The daily intake of important elements in small quantity like Mn, Fe, Cu, Co and Zn, as well as non-essential elements like As, Cd, Cr, Pb, and Ni was estimated and compared to the respective maximum tolerated daily intake (MTDI) of each heavy metal recommended by the Joint FAO/WHO Expert Committee on Food Additive (JECFA) for Pb, Cd, Cr, Ni, Co, As and Cu and the China National Standards (CNS) for Mn, Fe, and Zn (Zheng et al. 2020). In the designation of estimated daily intake of heavy metals, children had the highest consumption level of EDI for all the heavy metals in hen eggs (Table 4 and Fig. 5). In addition, provisional tolerable daily intake values (PTDI) exceeded those for Pb, Cu, Zn and Fe which indicates these metals would have an adverse effect on human health through egg consumption by children and adults. Children were at higher health risk due to contaminated hen egg consumption and the risk was higher than for adults at 3.9, 3.8, 3.7, and 3.9 times for Pb, Cd, Co and Cr, respectively. This means that the health risk was accompanied with the intake of heavy metal defilement in hen eggs.
Heavy metals
LC
MK
MD
SV
MP
JB
KR-W
KR-Y
Child
adult
Child
adult
Child
adult
Child
adult
Child
adult
Child
adult
Child
adult
Child
adult
Cd
0.00034
8.66E-05
0.000335
8.66E-05
0.000335
8.66E-05
0.000335
8.66E-05
0.000335
8.66E-05
0.000335
8.66E-05
0.000335
8.66E-05
0.000335
8.66E-05
Cr
0.00168
0.000433
0.001677
0.000433
0.001677
0.000433
0.001677
0.000433
0.001677
0.000433
0.003353
0.000866
0.298447
0.077049
0.003353
0.000866
Cu
7.77973
2.008457
8.3498
2.155629
0.285033
0.073586
0.526473
0.135917
0.751147
0.19392
0.295093
0.076183
0.274973
0.070989
19.7176
5.0904
Pb
0.12407
0.032031
0.097247
0.025106
0.17102
0.044151
0.637133
0.164486
0.167667
0.043286
0.529827
0.136783
0.264913
0.068391
0.107307
0.027703
Mn
0.1509
0.038957
0.254853
0.065794
0.315213
0.081377
0.17102
0.044151
0.184433
0.047614
0.298447
0.077049
0.016767
0.004329
0.345393
0.089169
Ni
0.13749
0.035494
0.097247
0.025106
0.013413
0.003463
0.04024
0.010389
0.053653
0.013851
0.063713
0.016449
0.127427
0.032897
0.07042
0.01818
Fe
17.3166
4.470549
19.64047
5.070489
20.41509
5.270469
21.13941
5.457463
20.86444
5.386474
21.65918
5.591649
3.55118
0.916791
34.88137
9.00516
Zn
10.5127
2.714014
11.44157
2.953817
13.16519
3.398794
12.15583
3.138214
13.05453
3.370226
12.36709
3.192754
0.808153
0.208637
16.25025
4.195251
Co
0.16767
0.043286
0.013413
0.003463
0.124073
0.032031
0.167667
0.043286
0.08048
0.020777
0.09054
0.023374
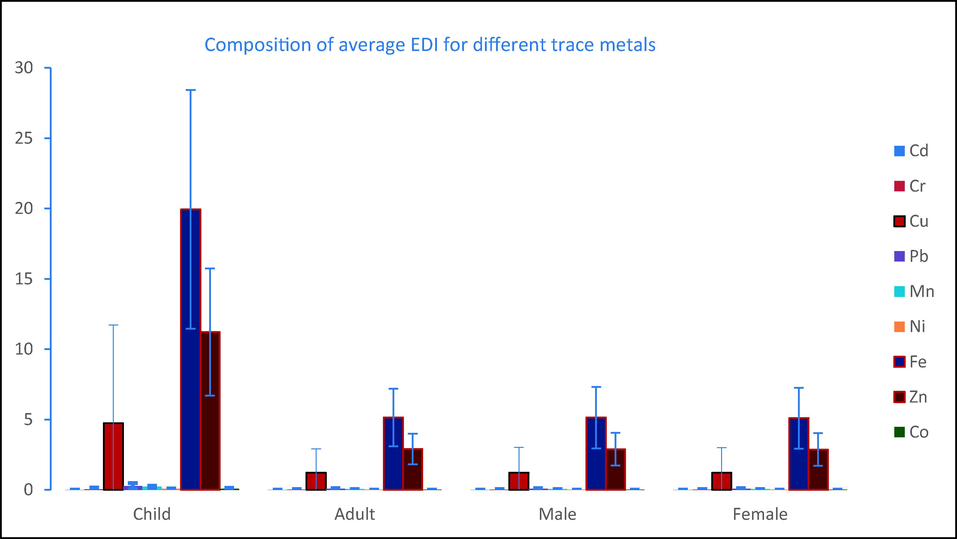
Graphical representation of EDI of different trace metals in studied egg samples.
According to JECFA (2003), provisional tolerable daily intake (PTDI) for Pb was 0.0035 mg kg−1day−1 (Table 1). In this study, average consumption level of EDI of Pb for children was found 0.29 mgkg-1day−1, which is the 80.62 times greater than PTDI value; for the adult, male and female 20.81, 20.78 and 20.60 times higher. Children are believed to uptake 40% of lead from eggs (Khan et al. 2016). The cardiovascular system is impacted by Pb exposure at 0.003 mg kg−1day−1, which also causes a 2 mmHg (0.3 kPa) increase in systolic blood pressure. Additionally, neurodevelopmental consequences will be seen in children exposed to Pb at values of 0.002 mg kg−1day−1 (Aendo et al. 2018). Cu exposure in humans at dosages between 0.01–0.03 mg kg-1 may result in unpleasant gastrointestinal symptoms such nausea, vomiting, abdominal discomfort, and diarrhea as the gastrointestinal tract is the area of the body that is most sensitive to Cu poisoning (Gotteland et al. 2001, Aendo et al. 2018). Animals including human that consume too much Fe experience cardiac arrest, respiratory failure, convulsions, stupor, and depression (Aendo et al. 2018a). Sideroblastic anemia and loss of taste, smell, and appetite are caused by excessive levels of zinc (Zn) in the diet (Gupta 2017). Frequently consuming toxic substances in hazardous amounts through food like egg may affect a variety of biological and metabolic functions in people, particularly in infants and kids (Jaishankar et al. 2014). As a result, it was thought that combining the projected level of metal contamination in foodstuffs with the corresponding rate of food consumption could be a useful tool for assessing the benefits and risks (Ullah et al. 2021).
3.4.2 Target hazard quotient
Table 5 shows THQ values for selected heavy metals in fish species. THQ has an acceptable value of 1 according to the USEPA (2011). There will be no negative health effects if the number is less than one. If the value is greater than 1 (one), the egg is known to be toxic to eat. All of the samples of egg had a target hazard quotient of <1 (Table 5). The highest mean THQ was determined for Cu for children (0.49294) and adults (0.12726) because of the eating of hen eggs; however, the lowest value for both category samples was determined for Ni (9.58E-05) for children and (2.47E-05) for adults, respectively (Table 5). By adding the health hazards of the nine examined heavy metals, the mean cumulative health risks were calculated and classified as HI. For the ingestion of hen eggs by a children and an adult, the mean maximum values of HI were found to be 0.632715 and 0.163345, respectively. The threshold value 1 was not exceeded by either the THQ or HI values (Table 5 and Fig. 6). The results demonstrated that the consumers would not be exposed to any significant possible health concerns over the course of their whole lifetimes.
Heavy metals
LC
MK
MD
SV
MP
JB
KR-W
KR-Y
Child
adult
Child
adult
Child
adult
Child
adult
Child
adult
Child
adult
Child
adult
Child
adult
Cd
0.00034
8.66E-05
0.000335
8.66E-05
0.000335
8.66E-05
0.000335
8.66E-05
0.000335
8.66E-05
0.000335
8.66E-05
0.000335
8.66E-05
0.000335
8.66E-05
Cr
0.00056
0.000144
0.000559
0.000144
0.000559
0.000144
0.000559
0.000144
0.000559
0.000144
0.001118
0.000289
0.099482
0.025683
0.001118
0.000289
Cu
0.19449
0.050211
0.208745
0.053891
0.007126
0.00184
0.013162
0.003398
0.018779
0.004848
0.007377
0.001905
0.006874
0.001775
0.49294
0.12726
Pb
0.03102
0.008008
0.024312
0.006276
0.042755
0.011038
0.159283
0.041121
0.041917
0.010821
0.132457
0.034196
0.066228
0.017098
0.026827
0.006926
Mn
0.00108
0.000278
0.00182
0.00047
0.002252
0.000581
0.001222
0.000315
0.001317
0.00034
0.002132
0.00055
0.00012
3.09E-05
0.002467
0.000637
Ni
0.00098
0.000254
0.000695
0.000179
9.58E-05
2.47E-05
0.000287
7.42E-05
0.000383
9.89E-05
0.000455
0.000117
0.00091
0.000235
0.000503
0.00013
Fe
0.02474
0.006386
0.028058
0.007244
0.029164
0.007529
0.030199
0.007796
0.029806
0.007695
0.030942
0.007988
0.005073
0.00131
0.049831
0.012865
Zn
0.03504
0.009047
0.038139
0.009846
0.043884
0.011329
0.040519
0.010461
0.043515
0.011234
0.041224
0.010643
0.002694
0.000695
0.054168
0.013984
Co
0.00838
0.002164
0.000671
0.000173
0.006204
0.001602
0.008383
0.002164
0.004024
0.001039
0.004527
0.001169
HI
0.29663
0.076579
0.302662
0.078137
0.126171
0.032573
0.246238
0.06357
0.142815
0.03687
0.224423
0.057938
0.185741
0.047952
0.632715
0.163345
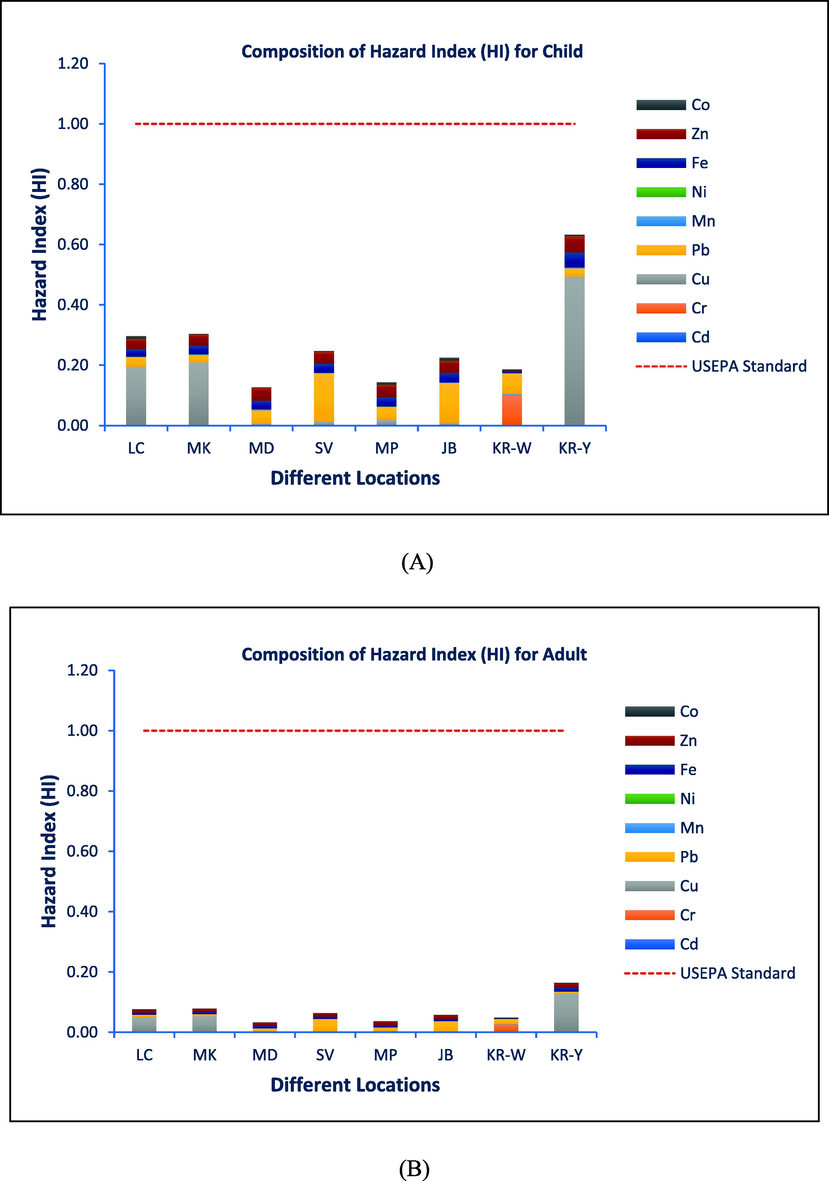
Composition of HI in studied samples from different locations A. Child, B. Adult.
3.4.3 Cancer risk (CR)
Because of the fact that these contaminants may induce both non-carcinogenic and carcinogenic risk depending on their exposure level, the carcinogenic risks (CRs) resulting from dietary consumption of Cd, Cr, and Pb were estimated. The CRs of Cd, Cr and Pb for children and adults resulting from ingestion of hen eggs were determined and outlined in Table 6. The highest mean CR values of Cd, Cr, and Pb associated with chicken egg ingestion for children were estimated to be 1.27E-04, 1.49E-01, and 0.005415633, respectively, whereas those for adults were 3.29E-05, 3.85E-02, and 0.001398, respectively. Typically, CR values below 1.0E-06 are evaluated negligible and above 1.0E-04 are evaluated as ineligible, whereas those between 1.0E and 06 and 1.0E-04 are rated as tolerable (USEPA 1989, 2010). The carcinogenic risk of Cd, Cr, and Pb from consuming hen eggs was negligible to within required tolerances in the current investigation. Therefore, the findings suggested that there was little chance of exposure to Cd, Cr, or Pb carcinogens from ingesting hen eggs.
CSF
Cd
Cr
Pb
3.80E-01
5.00E-01
8.50E-03
Child
Adult
Child
Adult
Child
Adult
LC
1.27E-04
3.29E-05
8.38E-04
2.16E-04
0.001054623
0.000272
MK
1.27E-04
3.29E-05
8.38E-04
2.16E-04
0.000826597
0.000213
MD
1.27E-04
3.29E-05
8.38E-04
2.16E-04
0.00145367
0.000375
SV
1.27E-04
3.29E-05
8.38E-04
2.16E-04
0.005415633
0.001398
MP
1.27E-04
3.29E-05
8.38E-04
2.16E-04
0.001425167
0.000368
JB
1.27E-04
3.29E-05
1.68E-03
4.33E-04
0.004503527
0.001163
KR-W
1.27E-04
3.29E-05
1.49E-01
3.85E-02
0.002251763
0.000581
KR-Y
1.27E-04
3.29E-05
1.68E-03
4.33E-04
0.000912107
0.000235
4 Conclusion
The results of the current investigation have revealed discrepancies in the trace element composition of hen egg samples from free-range hens and those from poultry farms. In comparison to eggs from free-range hens, farm hen eggs have higher levels of the studied hazardous elements Cr, Cu, Pb, Mn, Fe and Zn. This might be caused by use of chemicals like pesticides, tannery wastage, untreated residential sewage and the operations of mills and factories contaminating the food composition used as hen feed. The concentration of Ni and Co in free-range hen eggs is higher than it is in poultry hen eggs. This is due to the free range hens taking food from the soil directly. On the other hand, egg yolk had much higher levels of Cu, Mn, Fe and Zn than albumen. Consumers of tainted hen eggs may have long-term health problems due to the mean levels of Cu, Pb, Fe and Zn contamination in hen eggs being much higher than the standard limit. However, at the current concentration levels, most of the metals have been not been found to be potentially carcinogenic to human health but it has been determined that all of these metals may be harmful to human health collectively. To ensure the safety of hen eggs produced for consumer use, more research on heavy metal contamination in hen organs and eggs should be conducted. Last but not least, the data gathered in this study provided significant tools for upcoming ecotoxicological inquiries and biosafety, in addition to assisting recognized organizations or decision-makers in implementing regulations and standards for commercial hen egg production.
Declaration of Competing Interest
The authors declare that they have no known competing financial interests or personal relationships that could have appeared to influence the work reported in this paper.
References
- Metals concentrations in eggs of domestic avian and estimation of health risk from eggs consumption. J. Biol. Sci.. 2011;11:448-453.
- [CrossRef] [Google Scholar]
- Comparison of 470 zinc, lead, cadmium, cobalt, manganese, iron, chromium and copper in duck eggs from 471 three duck farm systems in Central and Western, Thailand. Ecotoxicol. Environ. Saf.. 2018;161:691-698.
- [Google Scholar]
- (2018a). health risk contamination of heavy metals in yolk and albumen of duck eggs collected in central and western Thailand. Biol. Trace Elem. Res.. 2018;184:501-507.
- [CrossRef] [Google Scholar]
- Carcinogenic and non-carcinogenic risk assessment of heavy metals contamination in duck eggs and meat as a warning scenario in Thailand. Sci. Total Environ.. 2019;689:215-222.
- [CrossRef] [Google Scholar]
- Analysis of major heavy metals in the available fish species of the Dhaleshwari River, Tangail, Bangladesh. Int. J. Fish. Aquat. Stud.. 2018;6(4):349-354.
- [CrossRef] [Google Scholar]
- Chemical and physicochemical characterization of effluents from the tanning and textile industries in Bangladesh with multivariate statistical approach. Environ. Monit. Assess.. 2019;191:575.
- [CrossRef] [Google Scholar]
- AL-Ashmawy, M. A. M. (2013). Trace elements residues in the table eggs rolling in the Mansoura City markets Egypt. International Food Research Journal, 20(4), 1783-1787.
- Comparative study of heavy metal concentration in eggs originating from industrial poultry farms and free-range hens in Kosovo. J. Food Qual.. 2021;2021:7.
- [CrossRef] [Google Scholar]
- Essential trace metal (Zinc, Manganese, Copper and Iron) levels in plants of medicinal importance. J. Biol. Sci.. 2004;4(2):95-99.
- [Google Scholar]
- BBS (Bangladesh Bureau of Statistics) (2018). Yearbook of Agricultural Statistics-2017, Dhaka.
- Heavy metal pollution in the environment and their toxicological effects on humans. Heliyon. 2020;6(9):e04691.
- [Google Scholar]
- Mercury and other metals in eggs and feathers of glaucous-winged gulls (Larus glaucescens) in the Aleutians. Environ. Monit. Assess.. 2009;152(1–4):179-194.
- [CrossRef] [Google Scholar]
- Nickel: a review of its sources and environmental toxicology. Pol. J. Environ. Stud.. 2006;15(3):375-382.
- [Google Scholar]
- Toxic heavy metal and metalloid accumulation in crop plants and foods. Annu. Rev. Plant Biol.. 2016;67:489-512.
- [CrossRef] [Google Scholar]
- Effects of broiler litter management practices on phosphorus, copper, zinc, manganese and arsenic concentrations in Maryland Coastal Plain Soils. Commun. Soil Sci. Plant Anal.. 2008;39(7):1193-1205.
- [CrossRef] [Google Scholar]
- Lead concentrations in the blood and eggs of backyard laying hens. N. Z. Vet. J.. 2019;67(2):86-92.
- [CrossRef] [Google Scholar]
- Trace metal concentration in Great Tit (Parus major) and Greenfinch (Carduelis sinica) at the Western Mountains of Beijing, China. Environ. Pollut.. 2007;148(2):620-626.
- [CrossRef] [Google Scholar]
- EC (2006). Commission of the European Communities, Commission regulation (EC) no 1881/2006 of 19 December 2006: setting maximum levels for certain contaminants in foodstuffs. Off. J. Eur. Union Legislation 364. http://eur-lex.europa.eu/legal-uri=CELEX.
- EPA (2005) Guidelines for Carcinogen Risk Assessment. EPA/630/P-03/001F. US Environmental Protection Agency, (Vol. 3–25). US Environmental Protection Agency, Washington, DC, United States of America. http://www.epa.gov/raf/publications/pdfs.
- EPAU (2016) Integrated risk information system. Https://http://www.epa.gov/iris/ U.S. Environmental Protection Agency, Washington, USA (accessed 15.06.23).
- Trace elements in free-range hen eggs in the Campania region (Italy) analyzed by inductively coupled plasma mass spectrometry (ICP-MS) Environ. Monit. Assess.. 2016;188(6):326.
- [CrossRef] [Google Scholar]
- Trace metal content and estimated daily human intake from chicken eggs in Ibadan, Nigeria. Arch. Environ. Health: Int. J.. 2003;58:245-251.
- [CrossRef] [Google Scholar]
- FAO/WHO (2002). Codex Alimentarius—general standards for contaminants and toxins in food. Schedule 1 Maximum and Guideline levels for contaminants and toxins in food. In: Joint FAO/WHO Food Standards Programme, Codex Committee. Rotterdam, Reference CX/FAC 02/16.
- Determination of heavy metals in albumen of hen eggs from the Markazi Province (Iran) using ICP-OES technique. Toxin. Rev.. 2015;34:96-100.
- [Google Scholar]
- Heavy metals in eggs and chicken and the associated human health risk assessment in the mining areas of Singhbhum copper belt, India. Arch. Environ. Occup. Health. 2017;74:161-170.
- [CrossRef] [Google Scholar]
- Effect of acute copper exposure on gastrointestinal permeability in healthy volunteers. Dig. Dis. Sci.. 2001;46:1909-1914.
- [CrossRef] [Google Scholar]
- Gupta, A. (2017). Role of Zinc, Copper and Selenium in Nutritional Anemia. Nutritional Anemia in Preschool Children, 185–199. Doi: 10.1007/978-981-10-5178-4_10
- Status of poultry industry in Bangladesh and the role of private sector for its development. Asian J. Poult. Sci.. 2017;11:1-13.
- [CrossRef] [Google Scholar]
- Health risk assessment for human exposure to trace metals and arsenic via consumption of hen egg collected from largest poultry industry in Iran. Biol. Trace Elem. Res.. 2019;188:485-493.
- [CrossRef] [Google Scholar]
- Mineral and heavy metals content in eggs of local hens at different geographic areas in Egypt. Global Veter.. 2012;8(3):298-304.
- [Google Scholar]
- Huhtamaki. (2019). The world of eggs. https://www.huhtamaki.com /globalassets /global/highlights/trends/huhtamaki_focus_report_the_world_of_eggs.pdf. , 1-13.
- Determination of heavy metals in fish and vegetables in Bangladesh and health implications. Hum. Ecol. Risk Assess. Int. J.. 2015;21(4):986-1006.
- [CrossRef] [Google Scholar]
- Toxicity, mechanism and health effects of some heavy metals. Interdiscip. Toxicol.. 2014;7(2):60-72.
- [CrossRef] [Google Scholar]
- JECFA (2003). Summary and Conclusions of the 61st Meeting of the Joint FAO/WHO Expert Committee on Food Additives (JECFA), JECFA/61/SC, Rome, Italy.
- JECFA (2005). Codex general standard for contaminants and toxins in food and feeds. In: 64th meeting of the Joint FAO/WHO Expert Committee on Food Additives (JECFA), JECFA/64/CAC/RCP 49-2001.
- Kamalzadeh, A., Rajabbaigy, M., Moslehi, H., Torkashvand, R. (2009). Poultry production systems in Iran. Book of Proceedings, 2nd Mediterranean Summit of WPSA 4:189–195
- Concentrations of heavy metals and minerals in poultry eggs and meat produced in Khyber Pakhtunkhwa, Pakistan. Meat Sci. Vet. Public Health. 2016;1(1):4-10.
- [Google Scholar]
- Korish, M. A. and Attia, Y. A. (2020). Evaluation of Heavy Metal Content in Feed, Litter, Meat, Meat Products, Liver, and Table Eggs of Chickens. Animals: an open access journal from MDPI, 10(4), 727. Doi: 10.3390/ani10040727
- Metal contamination of commercial fish feed and quality aspects of farmed tilapia (Oreochromis niloticus) in Bangladesh. Biores. Commun.-(BRC). 2017;3(1):345-353.
- [Google Scholar]
- Effects of dietary Zn-methionine supplementation on the laying performance, egg quality, antioxidant capacity, and serum parameters of laying hens. Poult. Sci.. 2019;98:923-931.
- [Google Scholar]
- Mahesar, S. A., Sherazi, S. T. H., Niaz, A., Bhanger, M. I., uddin, S., and Rauf, A. (2010). Simultaneous assessment of zinc, cadmium, lead and copper in poultry feeds by differential pulse anodic stripping voltammetry. Food and Chemical Toxicology, 48(8-9), 2357–2360. Doi: 10.1016/j.fct.2010.05.071
- Determination of heavy metals in selected black sea fish species. Food Control. 2017;72(B):313-318.
- [CrossRef] [Google Scholar]
- Multivariate analysis of trace metals in textile effluents in relation to soil and groundwater. J. Hazard. Mater.. 2006;137(1):31-37.
- [CrossRef] [Google Scholar]
- Production of iron enriched eggs of laying hens. AsianAust. J. Anim. Sci.. 2004;17(12):1725-1728.
- [Google Scholar]
- Effects of different dietary copper sources on laying hen performance and egg yolk cholesterol. J. Appl. Poult. Res.. 2011;20(4):506-513.
- [CrossRef] [Google Scholar]
- The golden egg: Nutritional value, bioactivities, and emerging benefits for human health. Nutrients. 2019;11(3):684.
- [CrossRef] [Google Scholar]
- Comprehensive analysis of toxic metals and their sources accumulated by cultured Oreochromis niloticus in Pagla Sewage Treatment Plant, Narayanganj, Dhaka, Bangladesh. Arab. J. Geosci.. 2021;14:1556.
- [CrossRef] [Google Scholar]
- Bioaccumulation of heavy metal in urban pond reared Oreochromis niloticus, water, sediment, and handmade feed in Bangladesh and human health risk implications. Arab. J. Geosci.. 2022;15:959.
- [CrossRef] [Google Scholar]
- Dietary intake of metals from fresh cage-reared hens' eggs in Tenerife, Canary Islands. J. Food Qual.. 2017;2017
- [CrossRef] [Google Scholar]
- Sˇkrbic, B., Onjia, A. (2007). Multivariate analyses of microelement contents in wheat cultivated in Serbia (2002). Food Control, 18, 338–345. Doi: 10.1016/j.foodcont.2005.10.017
- Residues of some toxic heavy metals and trace elements in chicken eggs. Zagazig Vet. J.. 2018;46(1):8-16.
- [CrossRef] [Google Scholar]
- Health risk assessment of trace elements via dietary intake of ‘non-piscine protein source’ foodstuffs (meat, milk and egg) in Bangladesh. Environ. Sci. Pollut. Res.. 2016;23:7794-7806.
- [CrossRef] [Google Scholar]
- Health hazards of toxic and essential heavy metals from the poultry waste on human and aquatic organisms. IntechOpen 2022
- [CrossRef] [Google Scholar]
- Concentration, source identification, and potential human health risk assessment of heavy metals in chicken meat and egg in Bangladesh. Environ. Sci. Pollut. Res.. 2021;29:22031-22042.
- [CrossRef] [Google Scholar]
- United States Environmental Protection Agency (USEPA). Washington, D.C. (1989). Risk Assessment Guidance for Superfund Volume I Human Health Evaluation Manual: Part A.https://www.epa.gov/sites/production/files/2015-09/documents/rags_a.pdf 20450.
- USDA (U.S. Department of Agriculture, Agricultural Research Service). (2011). USDA National Nutrient Database for Standard Reference, Release 24. Nutrient Data Laboratory Home Page. Downloaded from http://www.ars.usda.gov/ba/bhnrc/ndl.
- USDA (U.S. Department of Agriculture, Agricultural Research Service) (2019). Food Data Central external link disclaimer.
- USEPA (2000). Supplementary guidance for conducting health risk assessment of chemical mixtures, in: Risk Assess. Forum Tech. Panel [EPA/630/R-00/002], United States Environmental Protection Agency, Washington, DC.
- USEPA. (2006). United States, environmental protection agency, integrated risk information system. Available at: http://www.epa.gov/iris/substS
- USEPA (2010). Risk-based concentration table. http://www.epa.gov/ reg3hwmd/risk/human/index.htm.
- USEPA (2011). USEPA regional screening level (RSL) summary table: November 2011.
- WHO (1998). Environmental health criteria IPCS. International Program of Chemical Society.
- Species sensitivity analysis of heavy metals to freshwater organisms. Ecotoxicol. (London, England). 2015;24(7–8):1621-1631.
- [CrossRef] [Google Scholar]
- Effect of the level and source of supplementary dietary zinc on egg production, quality, and zinc content and on serum antioxidant parameters and zinc concentration in laying hens. Poult. Sci.. 2020;99(11):6233-6238.
- [CrossRef] [Google Scholar]
- Effect of heavy metals on peppermint and cornmint. Plant Soil. 1996;178:59-66.
- [CrossRef] [Google Scholar]
- Exposure risk assessment of nine metal elements in Chongqing hotpot seasoning. RSC Adv.. 2020;10:1971-1980.
- [CrossRef] [Google Scholar]
- Concentrations of trace elements in hen eggs in Poland. Bromatologia-i-Chemia-Toksykologiczna. 1996;29(1):55-57.
- [Google Scholar]


