Translate this page into:
Integrated approach on UPLC-QTOF/MS based active plasma component and metabolomics analysis of Gan Mai Da Zao decoction on the treatment of Alzheimer's disease in rats plasma and urine
⁎Corresponding author. cmubbwei@126.com (Binbin Wei)
-
Received: ,
Accepted: ,
This article was originally published by Elsevier and was migrated to Scientific Scholar after the change of Publisher.
Abstract
Alzheimer's disease is the most common form of dementia and affects human health. In this study, a classic prescription of Chinese Medicine Gan-Mai-Da-Zao decoction was used for treating Alzheimer's disease for the first time. Hence, firstly components of Gan-Mai-Da-Zao decoction in plasma were screened using UPLC-QTOF/MS. Then the MWM, HE and Metabolomics methods were used to examine the effect of Gan-Mai-Da-Zao decoction on Alzheimer's disease rats. The results showed 9 active components in ESI+ and 3 active components in ESI− of Gan-Mai-Da-Zao decoction in blood were identified, and Gan-Mai-Da-Zao decoction improved the learning and memory ability and pathological damage in Alzheimer's disease rats. 57 plasma metabolites and 21 urine metabolites were returned to normal in Alzheimer's disease model group after Gan-Mai-Da-Zao decoction treatment. 2-hydroxyestradiol, biotin, 4,6-dihydroxyquinoline, morphine-6-glucuronide, riboflavin can clearly distinguish between Gan-Mai-Da-Zao decoction-treated group and Alzheimer's disease model group involving steroid hormone biosynthesis, biotin metabolism, tryptophan metabolism, drug metabolism - cytochrome P450, and riboflavin metabolism pathway, which were the main pathways of Gan-Mai-Da-Zao decoction treatment on Alzheimer's disease. This study may bring a deeper understanding of the Alzheimer's disease-associated metabolic profile and the therapeutic mechanism of Gan-Mai-Da-Zao decoction on Alzheimer's disease.
Keywords
Metabolomics
4,6-Dihydroxyquinoline
Steroid
Riboflavin
Biotin
UPLC-QTOF/MS

1 Introduction
According to statistics from the World Health Organization, there are approximately 50 million people with dementia in the world, with 10 million new cases every year. Alzheimer's disease (AD) is the most common form of dementia and may account for 60–70% of dementia cases. The main pathological processes of AD are the diffuse extracellular deposition of β-amyloid protein (Aβ) to form neuroinflammatory plaques, and the aggregated hyperphosphorylated tau protein forms the tangles of nerve fibers in the neurites (Duyckaerts et al., 2009). AD is embodied in memory, thinking, behavior, and daily activity ability, which have physical, psychological, social, and economic impacts on the patients themselves, their caregivers, their families, and the whole society (Jia et al., 2020). Currently, there is lack of diagnosis methods that can be used for the early stages of AD or treatment methods that can slow down the progression of the disease and relieve clinical symptoms. Biomarker evidence may increase the certainty of the pathophysiological process of AD (McKhann et al., 2011).
Traditional Chinese medicine has been widely used in the treatment of cognitive disorders including AD (Pei et al., 2020). Gan-Mai-Da-Zao decoction (GMDZ decoction) contained Glycyrrhiza uralensis Fisch. (licorice), Triticum aestivum L. (wheat) and Zizphus jujube Mill. (jujube), which was first described in ‘Jin Gui Yao Lve’ (Han Dynasty) widely using for the treatment of various central nervous system diseases (Kim et al., 2017). Studies have showed that GMDZ decoction can participate in anti-anxiety effects through GABA and 5-HT systems (Chen et al., 2019); and exert a rapid antidepressant effect by inhibiting the NMDA/NO/cGMP signal transduction pathway (Zhang et al., 2020). These pathways are also closely related to the pathogenesis of AD (Lalut et al., 2017; Martín-Belmonte et al., 2020; Wang and Reddy, 2017). However, there is almost no relevant research on GMDZ decoction in the treatment of AD by affecting the above ways.
As an important part of systems biology, metabolomics plays an important role in personalized healthcare, the discovery of disease diagnostic markers and new drug targets (Nicholson and Lindon, 2008). AD is related to metabolic disorders in the body (Han, 2016). Studies have showed that sphingomyelin and ether-containing phosphatidylcholine have changed in the preclinical stage of AD, while acylcarnitine and some branched-chain amino acids have changed in the development stage of AD (Toledo et al., 2017; Polis and Samson, 2020). The cholinergic system, energy metabolism, amino acid and lipid pathways may be involved in the development of Alzheimer’s disease (Peña-Bautista et al., 2019).
In this study, we study the classic prescription Gan-Mai-Da-Zao decoction in ‘Jin Gui Yao Lve’ for the treatment on AD for the first time. Here, the active components of GMDZ decoction were screened, the behavioral experiments and H&E staining were used to confirm the successful modeling of AD, and the therapeutic effect of GMDZ decoction on AD rats. Metabolomic (plasma and urine) profiles was analyzed to explore the pharmacological mechanism by using UPLC-QTOF/MS. Furthermore, this study may explore a novel insight into the pathogenesis of AD, and clarify the therapeutic effects of GMDZ decoction.
2 Material and methods
2.1 Chemical reagents
Methanol, formic acid and acetonitrile were purchased from Merck AG (Germany, UPLC-QTOF/MS grade). The water used throughout the experiment was purchased from Watsons. D- (+) Galactose was purchased from Beijing Soleibao Technology Co., Ltd. (China). Aβ25-35 and the antibody were purchased from Beijing Bioss Biological Technology Co., Ltd. (China).
2.2 Preparation of GMDZ decoction
Gan-Mai-Da-Zao decoction contained Glycyrrhiza uralensis Fisch. (licorice), Triticum aestivum L. (wheat) and Zizphus jujube Mill. (jujube). The raw herbs of Gan-Mai-Da-Zao decoction, obtained from Tongrentang Pharmacy, were authenticated by Prof. Zhang, a professor of Pharmacognosy at China Medical University. Gan-Mai-Da-Zao decoction extract (Kim et al., 2017; Huang et al., 2017) is a mixture of licorice, wheat, and jujube in a ratio of 3:5:10 (w/w/w). Then the mixture was crushed and immersed in distilled water for 1 h (extract: water, w/v, 1:8), heated, and boiled for 2 h. The filtered residue was boiled again in boiling water for 2 h (residue: water, w/v, 1:6), and the twice water extracts were combined and concentrated to 1 g/mL (that is, each 1 mL of liquid contains 1 g of original medicinal materials). Store the decoction in a refrigerator at 4 °C for later use.
2.3 Animals and experimental design
Adult male Wistar rats (180–200 g) were bred in the experimental animal center of China Medical University. The rats were kept under controlled environmental conditions one week before the experiment, and water and food were provided freely. All the rats fasted with free access to water for 12 h before the experiment. All animal experiments were carried out following the Guideline for Animal Experimentation of China Medical University([CMU2019257]), and the protocol was approved by the Animal Ethics Committee of the institution. The scheme of the experiment is shown in Fig. 1.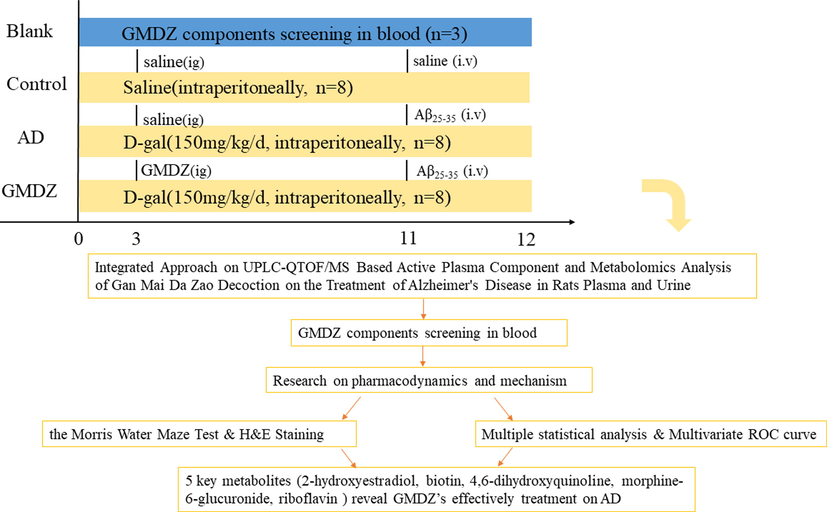
The scheme of the study.
GMDZ decoction components screening experiment in blood: three blank rats were given GMDZ (6.3 g/kg/d, intragastric administration), and after 30 mins blood obtained from eye was placed in EP tube with EDTA for analysis.
Metabolomics experiment: twenty-four rats were randomly divided into three groups (n = 8): control, AD model group (AD), and Gan-Mai-Da-Zao decoction-treated group (GMDZ). The rats in the AD group and the GMDZ group were intraperitoneally injected with D-Galactose (D-gal) (150 mg/kg/day) every day, while the rats in the control group were given normal saline of the same volume for 10 weeks. At the 11th week, according to the stereotactic map of the brain, 10 µg Aβ25-35 was injected into each bilateral hippocampus of AD and GMDZ rats. The anteroposterior coordinates were –3.6, posterolateral, ±1.9, dorsoventral, 1.9 mm, and the same volume of saline were injected into the brain of control rats in the same way. The Gan-Mai-Da-Zao decoction intervention started from the 3rd week until the 12th week. According to human clinical amount (0.9 g/kg/d, 60 kg), rat equivalent dose is about 7 times the clinical amount of human clinical amount, it is about 6.3 g / kg / d.
2.4 The Morris Water Maze test
One week after the Aβ25-35 injection, the Morris Water Maze (MWM) test was conducted to evaluate the spatial learning and memory abilities of all rats. The device is a circular pool (150 cm in diameter) divided into four equal quadrants. The target quadrant is located in the first quadrant with a platform (8 cm in diameter) located 1 cm below the water surface (water temperature 23 ± 0.5 °C) in the center of the first quadrant. The test includes directional navigation experiments and space exploration experiments. The directional navigation experiment is used to evaluate the learning ability of rats, and lasts for 5 days, allowing each rat to explore continuously for 60 s, and the starting position of each experiment (4 trials per day) is in a different quadrant. If failed to find the platform within 60 s, the rat was guided to the platform and allowed to stay on the platform for 10 s. Then the average escape latency of each rat was calculated. On the 6th day, the platform was removed, and the probe trial was performed within 60 s. Each rat was put into the pool from the same point, and the frequency of each rat passing through the location of the platform was recorded.
2.5 H&E staining & Western Blotting
H&E Staining: Then the rats were sacrificed, brain tissues were isolated, embedded in paraffin and sectioned continuously (4 µm). After HE staining and neutral gum sealing, the results were observed under microscope.
Western Blotting: Brain samples were collected and homogenized in radioimmunoprecipitation assay (RIPA) lysis buffer with freshly added proteinase inhibitors. After centrifugation (12000 rpm, 15 min), the protein concentration was determined using a bicinchoninic acid (BCA) protein quantitation kit. Electrophoretic separation of 60 µg of protein per well was conducted using 12.5% SDS-PAGE, followed by transfer onto a PVDF membrane. The membrane was blocked with 8% nonfat milk at room temperature for 1.5 h. The membranes were then incubated with primary antibodies (Amyloid-β 1: 1000) at 4 °C overnight. After washing with TBST, the membranes were incubated with HRP-conjugated affinipuregoat anti-rabbit IgG or HRP-conjugated affinipuregoat-anti mouse IgG for 1 h at room temperature. Visualization of the blots was conducted by gel Imaging using, a chemiluminescence detection kit.
2.6 UPLC-QTOF/MS-based analysis
Sample Preparation: For plasma, the blood samples with EDTA were centrifuged at 4000 rpm for 15 min at 4 °C to obtain plasma. A total of 200 µL of plasma and 600 µL of cold methanol were vortexed for 2 min, placed at −20 °C for 20 min, and then centrifuged at 13,000 rpm at 4 °C for 15 min to collect the supernatant which was blown under uitrogen. The above residue was redissolved with 200 µL 50% methanol, vortexed for 2 min, and then centrifuged again. The supernatant was used for UPLC-QTOF/MS analysis. Pre-treatment method for component screening of plasma samples was the same as that in metabolomics section. For urine, the samples were centrifuged at 12000 rpm for 20 min at 4 °C, then 200 µL of cold methanol were added into 200 µL sample and the mixture were vortexed for the 60 s, placed at −20 °C for 20 min, then centrifuged at 12000 rpm at 4 °C for 15 min. Finally, the supernatant was filtered through a 0.22 µm membrane and the filtrate was submitted to UPLC-QTOF/MS analysis.
UPLC-QTOF/MS conditions: The GMDZ decoction components screening experiment in blood and the metabolomic plasma and urine samples were both monitored in positive and negative modes to identify the components. The metabolic profiling was analyzed using Waters ACQUITY UPLC H-Class/Xevo in line with a Waters Xevo G2 Q-TOF mass spectrometer (Waters Corporation, Milford, MA, USA). ACQUITY HSS T3 column (2.1 × 100 mm, 1.8 um, Waters) was used for sample separation through reversed-phase chromatography at a flow rate of 0.40 mL min− (Duyckaerts et al., 2009). For screening, the mobile phase consisted of acetonitrile (A) and water containing 0.1% (v/v) formic acid (B) in positive mode and acetonitrile (A) and water (B) in negative mode in a gradient elution of 5% A at 0–2.0 min, 5–55% A at 2.0–20.0 min, 55–85% A at 20.0–23.0 min, 85–95% A at 23.0–28.0 min, 95% A at 28.0–33.0 min, 95–5% A at 33.0–34.0 min, 5% A at 34.0–37.0 min. For metabolomics, the mobile phase of acetonitrile (A) and water containing 0.1% (v/v) formic acid (B) in positive mode and acetonitrile (A) and water (B) in negative mode were used for plasma analyst in a gradient elution of 5% A at 0–2 min, 5%-95% A at 2–18 min, 95% A at18–21 min,5% A 21–23 min. The mobile phase of acetonitrile (A) and water containing 0.1% (v/v) formic acid (B) in positive mode and acetonitrile (A) and water (B) in negative mode were used for urinary analyst in a gradient elution of 5% A at 0–2 min, 5%-20% A at 2–3 min, 20%-30% A at 3–7 min,30–60 %A at 7–10 min, 60–95 %A at 10–13 min, 95% A 13–16 min, 5% A 16–19 min. The sample injection volume was 3 µL. The column temperature was 40 °C and the sample temperature was 4 °C.
Xevo G2-XS Q-TOF mass spectrometer was used to collect mass spectral data at a rate of two scans per second over a mass to charge (m/z) range of 100–1200 Da. High-purity nitrogen (N2) was used as nebulizing gas, and ultra-high pure helium (He) was employed as collision gas. Source parameters were set as follows: desolvation temperature, 500 °C; cone gas flow, 50 L. h −1; desolvation gas flow, 700 L. h −1; capillary voltage, 2.0 kV for plasma samples and 2.5 kV for urine samples; sampling cone voltage, 45.0 V; source offset, 80 V and low collision energy of 6 eV and high collision energy of 10–40 eV. MS data were acquired in continuum mode. Leu-enkephalin (200 pg/µL) was used as a lock mass reference (m/z 556.2771in positive mode, m/z 554.2615 in negative mode) with the Lock Spray interface to ensure mass accuracy and reproducibility.
The Quality Control (QC) in the manuscript is to ensure the instrument's stability and the integrity of data collection. At the beginning of the sequence, we ran ten QC samples to equilibrate the system. The preparation method of QC is as follows: 21 µL were took out from 24 samples in three groups, mixed well, and proceed with the remaining samples. During the analysis, QC samples were run at regular intervals operation to further detect the stability of the system.
2.7 Data processing
GMDZ decoction components screening experiment in blood: MassLynx 4.1 mass spectrometry workstation and UNIFI analysis software were used to complete data collection and analysis in positive and negative ion modes. Then we searched the literature, the TCMSP database and the SCIFinder database to find the chemical components in Gan-Mai-Da-Zao decoction, saved the.mol file and imported it into the UNIFI analysis software as a self-built database. A screening analysis method for the determination of Gan-Mai-Da-Zao decoction was established. The parameters were as follows: mass error 5 mDa; response value >1000; low-energy channel intensity threshold 20; high-energy channel intensity threshold 100; retention time error 0.1 min. According to the precise mass, the matching degree of fragment ions, and the relative retention time, the chemical composition of Gan-Mai-Da-Zao decoction was determined.
All the raw data of metabolomics were converted to Progenesis QI V 2.3 software (Waters, Milford, MA, USA) for data processing. The converted files were calculated for generation of alignment, peak picking, deconvolution, filter data, identifying compounds, exporting to EZinfo 3.0 for compound statistics, correlation analysis, and compound validation. Metabolic features with a QC relative standard deviation (RSD) < 30% were included in the subsequent analysis. Human Metabolome databases (https://www.hmdb.ca/) SDF database were selected for metabolite identification. The identified data were exported to EZinfo 3.0 software for principal component analysis (PCA). Orthogonal partial least square-discriminant analysis (OPLS-DA) modes were established to determine global metabolic changes between two groups. OPLS-DA mode was assessed by the intersections of R2 and Q2 in the displacement test, which provided information for the interpretability and predictability and avoided overfitting. The combining condition (VIP > 1 and p values < 0.05) from the OPLS-DA analysis was carried out to select distinct variables as altered metabolites. Other parameter settings were designated as default for data processing automatically.
2.8 Multivariate ROC curve exploration and pathway analysis
The altered metabolite data were imported into MetaboAnalyst 5.0 (https://www.metaboanalyst.ca), which is a web-based tool for the visualization of metabolomics. The pathway analysis was to explore the therapeutic mechanisms regarding GMDZ decoction treatment. The impact value threshold calculated from the pathway topology analysis was set to 0.10, and a raw p-value < 0.05 was regarded as significant. The multivariate exploratory ROC curve analysis aimed to evaluate the performance of biomarker created through automated important feature identification. The multivariate algorithm based on support vector machine (SVM) was used for ROC curve analysis. ROC curves were generated by Monte-Carlo cross-validation (MCCV) using balanced subsampling.
3 Results
3.1 Active components in GMDZ decoction were screened in blood
In order to understand the potential active components in GMDZ decoction, we screened the components of GMDZ decoction in plasma to provide a substance foundation for its effect. 9 components in ESI+and 3 components in ESI− meeting the condition (Mass error < 5 ppm) were identified in Fig. 2a, b, c showed the classification and percentage of 12 components in GMDZ decoction, and these components were showed in Table 1.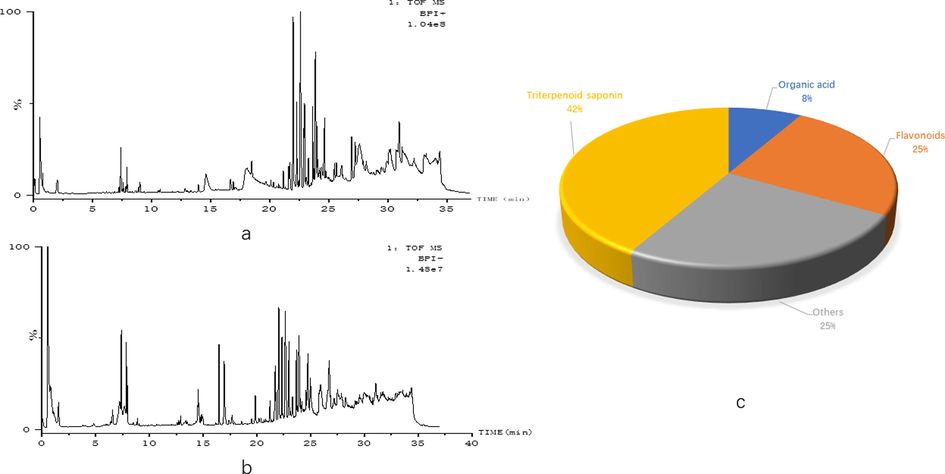
12 active components in GMDZ decoction were screened in Blood (a, BPI plot of GMDZ decoction screening in ESI+; B, BPI plot of GMDZ decoction screening in ESI−; c, the classification and percentage of 12 components in GMDZ decoction).
Name
Rt
Neutral Molecule (Da)
Observed m/z
Fragment
Class
1
Ferulic Acid
+H
6.77
194.0579
195.065
Organic acid
2
Gancaonin
+H
6.89
256.0736
257.0805
Flavonoids
3
Vomifoliol
+H
14.45
224.1412
225.1484
Others
4
glycyrrhizin
+H
15.16
822.4038
823.408
453.3368
Triterpenoid saponin
5
malkangunin
+H
16.22
432.2148
433.2208
384.1921
Others
6
liquoric acid
+H
20.08
484.3189
485.3265
119.0829
Triterpenoid saponin
7
18beta-glycyrrhetinic acid
+H
22.54
470.3396
471.3473
189.1635
Triterpenoid saponin
8
Jujubasaponin VI
+H
22.59
796.4609
797.4758
478.3295
Triterpenoid saponin
9
Zizyphus saponin II
+H
23.99
912.5083
913.5082
662.4045
Triterpenoid saponin
10
Glepidotin
—H
0.64
284.1049
283.0993
Flavonoids
11
Medicarpin
—H
0.61
270.0892
269.0835
Flavonoids
12
Odoratin
—H
23.35
266.1518
265.1453
Others
3.2 GMDZ decoction ameliorated learning and memory impairment of AD rats induced by Aβ 25-35
The MWM test was used to exam the effects of GMDZ decoction on the learning and memory ability of AD model rats. Representative images of the swim paths were shown in Fig. 3a, b, c, the AD rats failed to find a platform. As shown in Fig. 3d, the escape latency of each rat decreased with the increasing training time in the directional navigation experiment. Especially, the escape latency of GMDZ group was significantly lower than that of AD group. These results indicated that GMDZ decoction can alleviate the impairment of learning and memory induced by Aβ25-35. In the space exploration experiment, as shown in Fig. 3e, the GMDZ rats frequently appeared in the quadrant where the platform was located, while the AD rats moved irregularly in the periphery, and passed the platform less frequently than the GMDZ rats. In summary, GMDZ decoction significantly improved the spatial learning and memory impairment induced by Aβ25-35.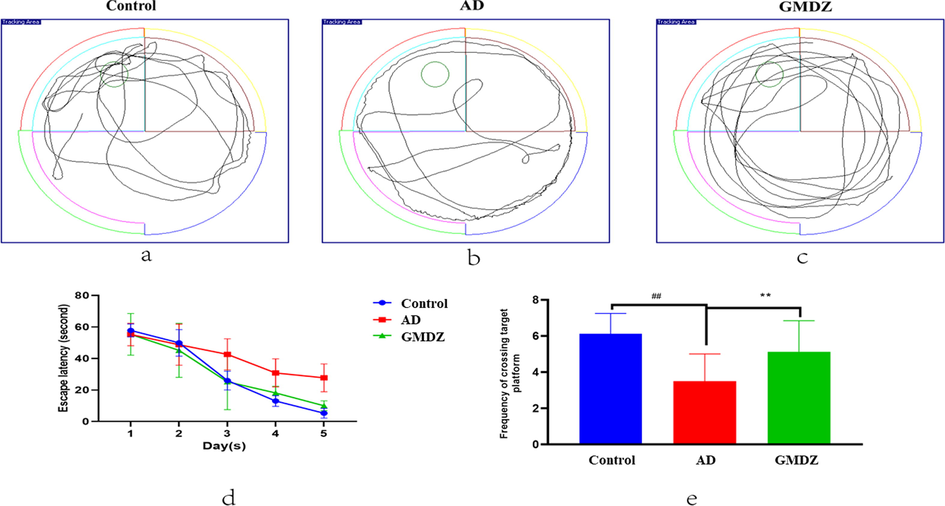
Effects of GMDZ decoction on Aβ25-35-induced memory impairments in the MWM test: (a), (b), (c) represented trajectory images of the swim path, and (d) represented escape latency needed to reach the hidden platform during the in the directional navigation experiment. (e) represented times spent in the target quadrant for analysis of spatial memory function. Data were expressed as the mean ± SD (n = 8 per group; escape latency was analyzed by repeated-measures analysis of variance (ANOVA); other data were analyzed by one-way ANOVA followed by least significant difference tests). ##represents p ≤ 0.01, AD vs control group. **represents p ≤ 0.01, GMDZ vs. AD group.
3.3 GMDZ decoction ameliorated pathological damage and deposition of Aβ
In AD group, the arrangement of nerve cells in hippocampal CA1 area was disordered and loose, the cell body atrophied, the cell membrane dissolved, the nucleus pyknosis and deep staining, and the normal nerve cells decreased significantly. After GMDZ decoction treatment, the above situation was obviously ameliorated (shown in the Figs. 4a, b, 3c. Western blot was used to detect the expression of Aβ to further illustrate Aβ deposition in the brain of rats. Fig. 4d, e showed that the Aβ deposited in the brains of the AD rats was close to normal after GMDZ administration.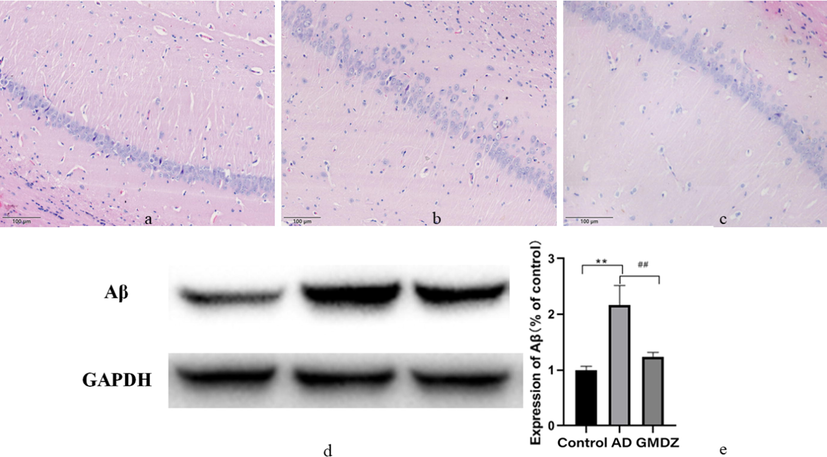
Gan Mai Da Zao decoction alleviated the pathological changes and the expression of Aβ in the hippocampus of in AD rats. (a, histopathology examination of control group; b, histopathology examination of AD group; c, histopathology examination of GMDZ group, d, the expression of Aβ in the hippocampus of rats; e, statistical result of Aβ expression level according to the grayscale value, ** indicated that the expression of Aβ is significantly increased compared to the control group, and P ≤ 0.01. ## represented a significant decrease in GMDZ group compared to the AD group, p ≤ 0.01; each group n = 8).
3.4 Metabolomics profile of urine and blood
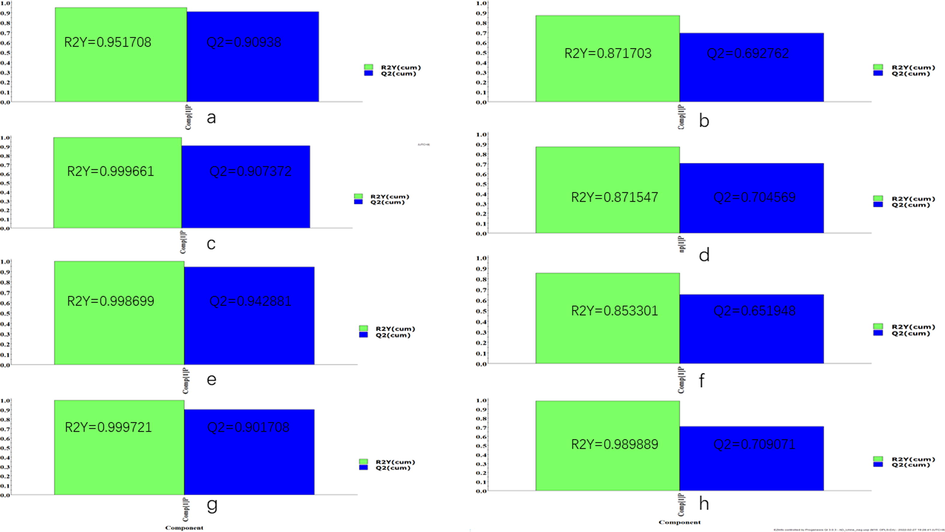
Unsupervised clustering PCA recognition model was used to evaluate the clustering trend of different groups. As shown in Fig. 5, the clustered QC samples suggested the repeatability of the acquisition method and the stability of the instrument. In the plasma and urine PCA score plots, the AD group was separated from the control group, which indicated that there were obvious metabolic differences in AD rats. In addition, an obvious trend of separation between the GMDZ group and the AD group was observed, indicating that a significant change in metabolism occurred after GMDZ decoction treatment. At the same time, OPLS-DA pattern recognition was applied to identify the overall metabolic differences between the two groups shown in Fig. S1, significant separations of the control group with AD group and AD group with GMDZ group were noted, which indicated that metabolic perturbation in plasma and urine samples remarkably occurred within different groups. In addition, both R2 and Q2 values in the OPLS-DA model were > 0.5, and the results show that the model has no over-fitting phenomenon and has a good predictive ability (Fig. S2).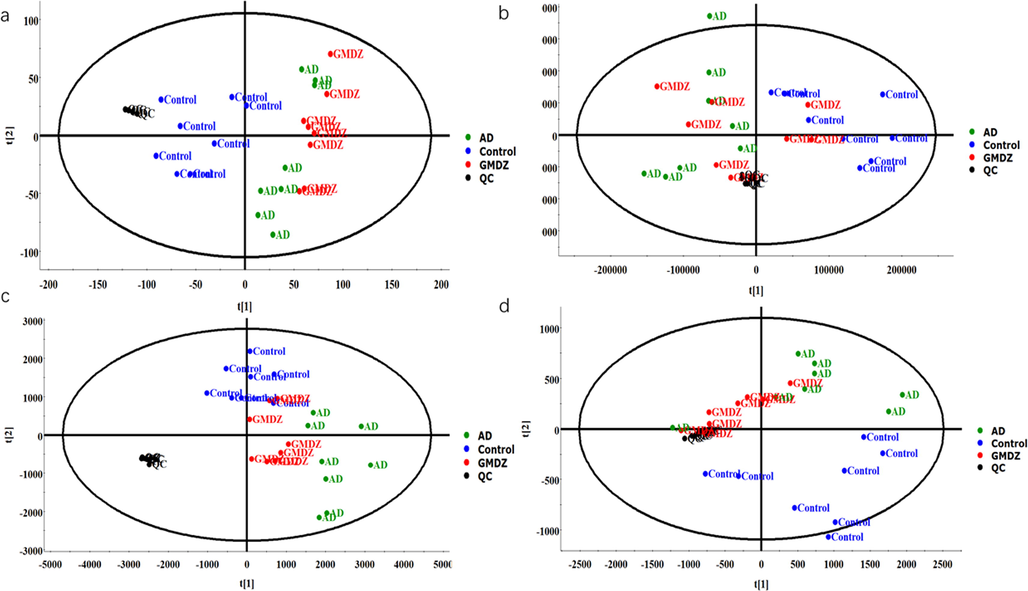
PCA score plots of plasma and urine metabolic profiles; the symbols marked in blue represent control group, black represents QC, green represents AD group, red represents GMDZ group(a, PCA plot of plasma in positive mode; b, PCA plot of plasma in negative mode; c, PCA plot of urine in positive mode; d, PCA plot of urine in negative mode).
Identification altered metabolites in AD and the mechanism of GMDZ decoction on AD: The compounds with VIP > 1.0 and p-value < 0.05 by t-test in OPLS-DA were screened as differential metabolites as shown in Fig. 6. By matching the raw MS data in the online HMDB database and using MetaboAnalyst 5.0 to analysis enriched pathway, totally 42 (ESI+) and 15 (ESI−) plasma common differential metabolites, and 16 (ESI+) and 5 (ESI−) common urine differential metabolites were identified involving lots of metabolic pathways shown in Fig. 7 and Table 2. As shown in Fig. 8, hierarchical clustering analysis (HCA) of the differential metabolite were displayed on the heat map. The results showed differential metabolites can distinguish the control group from the AD group, and the GMDZ group from the AD group.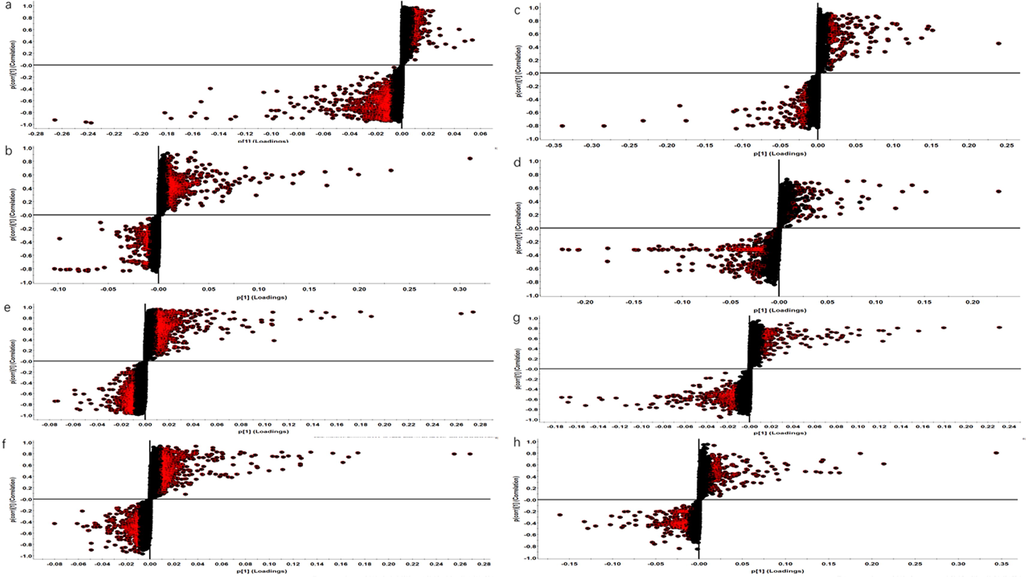
S-plot of different metabolites of plasma and urine in control, AD, GMDZ group (a. S-plot of plasma metabolites in AD from Model in ESI+; b. S-plot of plasma metabolites in GMDZ from AD in ESI+; c, S-plot of plasma metabolites in AD from Model in ESI−; d. S-plot of plasma metabolites in GMDZ from AD in ESI−; e. S-plot of urine metabolites in AD from Model in ESI+; f. S-plot of urine metabolites in GMDZ from AD in ESI+; g, S-plot of urine metabolites in AD from Model in ESI−; h. S-plot of urine metabolites in GMDZ from AD in ESI−).
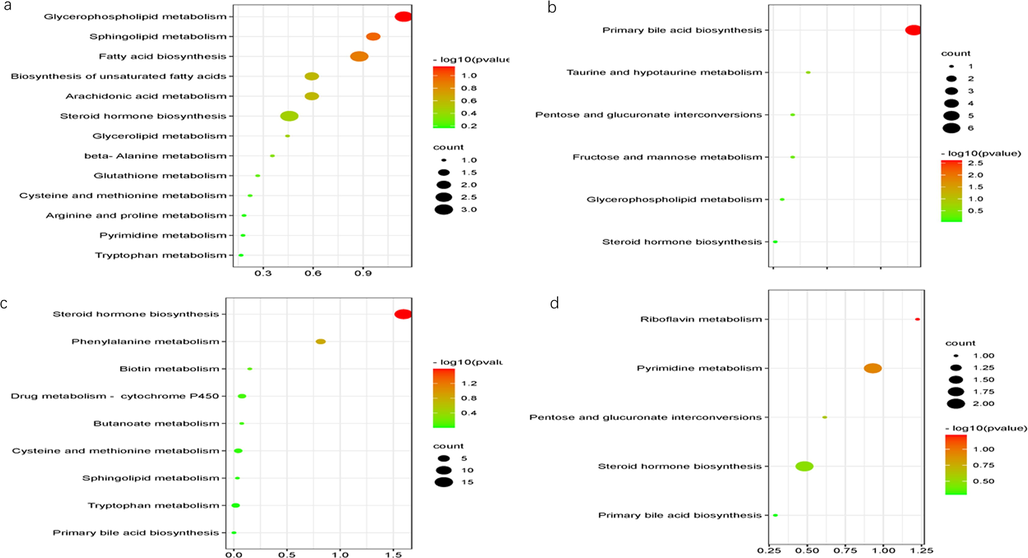
Enriched KEGG pathways in plasma and urine (a, enriched KEGG pathways in plasma in ESI+; b, enriched KEGG pathways in plasma in ESI−; c, enriched KEGG pathways in urine in ESI+; d, enriched KEGG pathways in urine in ESI−).
Compound ID
Pathway
Adducts
Formula
Description
m/z
Retention time (min)
Anova (p)
q Value
FC_BM
FC_GM
Plasma
HMDB0043800
Glycerolipid metabolism
M+NH4
C58H102O5
TG(15:0/22:6(4Z,7Z,10Z,13Z,16Z,19Z)/o-18:0)
896.8021
0.58
0.00
0.00
0.53
0.89
HMDB0055591
Glycerolipid metabolism
M+NH4
C63H104O6
TG(20:4(8Z,11Z,14Z,17Z)/20:1(11Z)/20:4(8Z,11Z,14Z,17Z))
974.8184
0.58
0.00
0.00
0.56
0.97
HMDB0008810
Glycerophospholipid metabolism
M+Na, M+K
C54H102NO8P
PC(24:1(15Z)/22:2(13Z,16Z))
962.7625
0.59
0.00
0.00
0.45
0.81
HMDB0000014
Pyrimidine metabolism
M+Na
C9H13N3O4
Deoxycytidine
250.081
0.70
0.00
0.00
0.50
0.97
HMDB0001190
Tryptophan metabolism
M+H
C10H9NO
Indoleacetaldehyde
160.0764
1.44
0.00
0.00
0.65
1.01
HMDB0000220
Fatty acid biosynthesis
M+NH4
C16H32O2
Palmitic acid
274.2755
10.70
0.00
0.00
0.48
1.07
HMDB0000277
Sphingolipid metabolism
M+H, M+Na
C18H38NO5P
Sphingosine 1-phosphate
380.2564
12.30
0.00
0.00
0.54
0.71
HMDB0010383
Glycerophospholipid metabolism
M+H, M+Na
C24H48NO7P
LysoPC(16:1(9Z))
494.3246
12.90
0.00
0.00
0.52
0.79
HMDB0010386
Glycerophospholipid metabolism
M+H, M+K
C26H50NO7P
LysoPC(18:2(9Z,12Z))
520.3401
13.18
0.00
0.00
0.65
0.65
HMDB0010395
Glycerophospholipid metabolism
M+H, M+Na, M+K
C28H50NO7P
LysoPC(20:4(5Z,8Z,11Z,14Z))
544.34
13.27
0.00
0.00
0.54
0.83
HMDB0011477
Glycerophospholipid metabolism
M+H, M+Na
C23H44NO7P
LysoPE(0:0/18:2(9Z,12Z))
478.2937
13.37
0.00
0.00
0.50
0.81
HMDB0062711
Glycerophospholipid metabolism
M+Na, M+K
C26H50NO7P
2-linoleoyl-sn-glycero-3-phosphocholine
542.3234
13.43
0.00
0.00
0.65
0.67
HMDB0010404
Glycerophospholipid metabolism
M+H, M+Na
C30H50NO7P
LysoPC(22:6(4Z,7Z,10Z,13Z,16Z,19Z))
568.341
13.46
0.00
0.00
0.60
0.65
HMDB0010396
Glycerophospholipid metabolism
M+H, M+Na
C28H50NO7P
LysoPC(20:4(8Z,11Z,14Z,17Z))
544.3407
13.48
0.00
0.00
0.73
0.92
HMDB0010382
Glycerophospholipid metabolism
M+H, M+K
C24H50NO7P
LysoPC(16:0)
496.3396
13.62
0.00
0.00
0.47
0.79
HMDB0010402
Glycerophospholipid metabolism
M+H, M+Na
C30H52NO7P
LysoPC(22:5(4Z,7Z,10Z,13Z,16Z))
570.3558
13.83
0.00
0.00
0.51
0.70
HMDB0001553
Cysteine and methionine metabolism
M+K
C5H8O3S
2-Oxo-4-methylthiobutanoic acid
186.9829
14.08
0.00
0.00
0.38
0.72
HMDB0010381
Glycerophospholipid metabolism
M+H, M+Na
C23H48NO7P
LysoPC(15:0)
482.3246
15.43
0.00
0.00
0.27
0.98
HMDB0010408
Glycerophospholipid metabolism
M+H
C26H52NO6P
LysoPC(P-18:1(9Z))
506.362
15.50
0.00
0.00
0.25
0.74
HMDB0010384
Glycerophospholipid metabolism
M+H, M+K, M+Na
C26H54NO7P
LysoPC(18:0)
524.372
15.50
0.00
0.00
0.50
0.89
HMDB0011148
Glycerophospholipid metabolism
M+H, M+Na
C28H56NO7P
PC(18:1(9Z)e/2:0)
550.3872
15.83
0.00
0.00
0.25
0.84
HMDB0011490
Glycerophospholipid metabolism
M+H
C27H56NO7P
LysoPE(0:0/22:0)
538.3877
16.08
0.00
0.00
0.24
0.87
HMDB0011520
Glycerophospholipid metabolism
M+H, M+Na
C27H56NO7P
LysoPE(22:0/0:0)
538.388
16.34
0.00
0.00
0.21
0.73
HMDB0060102
Arachidonic acid metabolism
M+H
C20H32O2
Arachidonate
305.248
17.59
0.00
0.00
0.51
1.01
HMDB0007880
Glycerophospholipid metabolism
M+H, M+NH4
C42H80NO8P
PC(14:0/20:2(11Z,14Z))
758.5697
17.76
0.00
0.00
0.66
0.90
HMDB0008729
Glycerophospholipid metabolism
M+H, M+Na
C48H82NO8P
PC(22:6(4Z,7Z,10Z,13Z,16Z,19Z)/18:1(9Z))
832.5853
17.76
0.00
0.00
0.38
0.80
HMDB0001256
beta-Alanine metabolism
M+K
C10H26N4
Spermine
241.1808
17.96
0.00
0.00
0.49
0.81
HMDB0009549
Glycerophospholipid metabolism
M+H
C42H80NO8P
PE(22:2(13Z,16Z)/15:0)
758.57
18.51
0.00
0.00
0.66
0.83
HMDB0004866
Sphingolipid metabolism
M+H, M+K
C42H79NO13
Lactosylceramide (d18:1/12:0)
806.5685
18.51
0.00
0.00
0.38
1.21
HMDB0009778
Glycerophospholipid metabolism
M+NH4
C41H79O13P
PI(16:0/16:0)
828.5534
18.51
0.00
0.00
0.37
1.70
HMDB0008789
Glycerophospholipid metabolism
M+Na
C46H88NO8P
PC(24:1(15Z)/14:1(9Z))
836.6178
18.51
0.00
0.00
0.47
0.62
HMDB0009585
Glycerophospholipid metabolism
M+H, M+NH4
C45H82NO8P
PE(22:4(7Z,10Z,13Z,16Z)/18:0)
813.6475
18.52
0.01
0.01
0.36
0.63
HMDB0008692
Glycerophospholipid metabolism
M+H, M+NH4
C46H82NO8P
PC(22:5(7Z,10Z,13Z,16Z,19Z)/16:0)
808.5843
18.79
0.00
0.00
0.34
0.70
HMDB0009749
Glycerophospholipid metabolism
M+H
C45H86NO8P
PE(24:1(15Z)/16:1(9Z))
800.611
18.80
0.01
0.00
0.23
0.43
HMDB0008618
Glycerophospholipid metabolism
M+H
C54H102NO8P
PC(22:2(13Z,16Z)/24:1(15Z))
924.7483
19.91
0.00
0.00
0.02
0.36
HMDB0011435
Glycerophospholipid metabolism
M+NH4, M+K
C37H70NO7P
PE(P-18:1(9Z)/14:1(9Z))
689.5288
20.72
0.00
0.00
0.15
0.40
HMDB0008909
Glycerophospholipid metabolism
M+Na
C42H80NO8P
PE(15:0/22:2(13Z,16Z))
780.5536
20.96
0.02
0.01
0.16
1.26
HMDB0000638
Fatty acid biosynthesis
M+NH4
C12H24O2
Dodecanoic acid
218.2121
7.48
0.00
0.00
0.43
0.98
HMDB0013438
Glycerophospholipid metabolism
M+Na
C50H98NO7P
PC(o-18:2(9Z,12Z)/24:0)
878.6981
8.83
0.00
0.00
0.65
0.43
HMDB0008795
Glycerophospholipid metabolism
M+H, M+NH4
C50H96NO8P
PC(24:1(15Z)/18:1(9Z))
887.6684
8.99
0.01
0.01
0.53
0.48
HMDB0001547
Steroid hormone biosynthesis
M+H
C21H30O4
Corticosterone
347.2229
9.04
0.01
0.01
0.41
1.64
HMDB0000806
Fatty acid biosynthesis
M+NH4
C14H28O2
Myristic acid
246.2435
9.23
0.00
0.00
0.42
1.00
HMDB0000432
Steroid hormone biosynthesis
M−H
C24H40O5
3a,7b,12a-Trihydroxy-5a-Cholanoic acid
407.28
10.18
0.01
0.01
1.96
2.50
HMDB0000399
Fructose and mannose metabolism
M−H2O−H, M−H
C24H40O6
3a,6b,7a,12a-Tetrahydroxy-5b-cholanoic acid
405.2648
10.82
0.00
0.01
3.78
2.50
HMDB0010379
Glycerophospholipid metabolism
M+FA-H
C22H46NO7P
LysoPC(14:0/0:0)
512.2996
12.41
0.02
0.04
0.63
1.01
HMDB0010397
Glycerophospholipid metabolism
M+FA-H
C28H48NO7P
LysoPC(20:5(5Z,8Z,11Z,14Z,17Z))
586.3152
12.74
0.34
0.18
0.66
2.15
HMDB0012496
Glycerophospholipid metabolism
M−H
C23H39O7P
1-Lyso-2-arachidonoyl-phosphatidate
457.2368
12.99
0.00
0.00
0.34
1.29
HMDB0010392
Glycerophospholipid metabolism
M+FA-H
C28H54NO7P
LysoPC(20:2(11Z,14Z))
592.3626
14.79
0.00
0.01
0.44
1.76
HMDB0012108
Glycerophospholipid metabolism
M−H
C25H52NO7P
LysoPC(17:0)
508.3408
15.50
0.00
0.00
0.61
1.27
HMDB0062195
Glycerophospholipid metabolism
M+FA-H
C26H54NO7P
2-acetyl-1-alkyl-sn-glycero-3-phosphocholine
568.3618
15.50
0.00
0.00
0.61
1.24
HMDB0010391
Glycerophospholipid metabolism
M+FA-H
C28H56NO7P
LysoPC(20:1(11Z))
594.3782
15.83
0.00
0.00
0.42
1.24
HMDB0002497
Primary bile acid biosynthesis
M−H2O−H
C26H43NO8S
Glycochenodeoxycholate-3-sulfate
510.2544
8.21
0.00
0.01
21.85
0.47
HMDB0000036
Taurine and hypotaurine metabolism
M−H, M+Na-2H
C26H45NO7S
Taurocholic acid
514.2844
8.69
0.05
0.06
3.12
0.42
HMDB0000138
Primary bile acid biosynthesis
M−H, M+Na-2H
C26H43NO6
Glycocholic acid
464.3019
8.88
0.08
0.08
3.36
0.92
HMDB0002596
Pentose and glucuronate interconversions
M−H, M+Na-2H
C30H48O10
Deoxycholic acid 3-glucuronide
567.3173
8.92
0.00
0.00
5.86
19.02
HMDB0000951
Primary bile acid biosynthesis
M−H
C26H45NO6S
Taurochenodesoxycholic acid
498.2895
9.53
0.01
0.01
2.13
1.66
HMDB0000619
Primary bile acid biosynthesis
M+Na-2H, M+FA-H, M−H
C24H40O5
Cholic acid
407.2802
9.76
0.00
0.00
5.08
3.25
urine
HMDB0001024
Cysteine and methionine metabolism
M+H
C3H5O7P
Phosphohydroxypyruvic acid
184.9857
11.66
0.00
0.00
1.72
0.69
HMDB0000338
Steroid hormone biosynthesis
M+Na
C18H24O3
2-Hydroxyestradiol
311.1598
3.06
0.00
0.00
0.81
1.42
HMDB0000205
Phenylalanine metabolism
M+H
C9H8O3
Phenylpyruvic acid
165.0552
3.95
0.00
0.00
1.97
0.86
HMDB0001032
Steroid hormone biosynthesis
M+NH4
C19H28O5S
Dehydroepiandrosterone sulfate
386.2019
4.19
0.00
0.00
0.78
0.64
HMDB0000714
Phenylalanine metabolism
M+H
C9H9NO3
Hippuric acid
180.0663
4.46
0.00
0.00
1.85
0.56
HMDB0006760
Steroid hormone biosynthesis
M+H
C21H32O5
11b,17a,21-Trihydroxypreg-nenolone
365.2323
4.51
0.00
0.00
0.36
2.09
HMDB0000030
Biotin metabolism
M+H
C10H16N2O3S
Biotin
245.0961
4.59
0.00
0.00
0.46
1.33
HMDB0004077
Tryptophan metabolism
M+H
C9H7NO2
4,6-Dihydroxyquinoline
162.0558
5.21
0.00
0.00
2.36
0.44
HMDB0000319
Steroid hormone biosynthesis
M+K
C21H30O5
18-Hydroxycorticosterone
401.1715
5.28
0.00
0.00
0.62
0.99
HMDB0041937
Drug metabolism - cytochrome P450
M+H
C23H27NO9
Morphine-6-glucuronide
462.1805
5.30
0.00
0.00
0.40
1.28
HMDB0000269
Sphingolipid metabolism
M+K
C18H39NO2
Sphinganine
340.2592
5.91
0.00
0.00
2.24
0.63
HMDB0006762
Steroid hormone biosynthesis
M+H
C21H32O4
17alpha,21-Dihydroxypregnenolone
349.2382
6.20
0.03
0.11
0.83
1.81
HMDB0001449
Steroid hormone biosynthesis
M+Na
C21H34O2
Allopregnanolone
341.2481
6.32
0.13
0.01
1.68
0.76
HMDB0001173
Cysteine and methionine metabolism
M+NH4
C11H15N5O3S
5′-Methylthioadenosine
315.1258
7.26
0.00
0.00
0.57
2.66
HMDB0000063
Steroid hormone biosynthesis
M+H
C21H30O5
Cortisol
363.2148
7.65
0.00
0.00
0.27
1.78
HMDB0002802
Steroid hormone biosynthesis
M+H
C21H28O5
Cortisone
361.2026
9.10
0.01
0.00
0.60
1.81
HMDB00296
Pyrimidine metabolism
M−H, M+Cl
C9H12N2O6
Uridine
243.061
0.90
0.01
0.00
1.63
0.62
HMDB01557
Riboflavin metabolism
M+FA-H
C15H16N4O6
Riboflavin reduced
393.1062
1.02
0.02
0.01
2.55
0.53
HMDB04483
Steroid hormone biosynthesis
M−H
C24H30O8
Estrone glucuronide
445.1887
5.18
0.00
0.00
0.10
33.14
HMDB32596
Primary bile acid biosynthesis
M−H
C26H43NO6
Sodium glycocholate
464.2995
6.21
0.00
0.00
0.00
325.71
HMDB10337
Pyrimidine metabolism
M−H2O−H
C25H34O8
6-Dehydrotestosterone glucuronide
443.2056
6.48
0.00
0.00
0.00
587.84
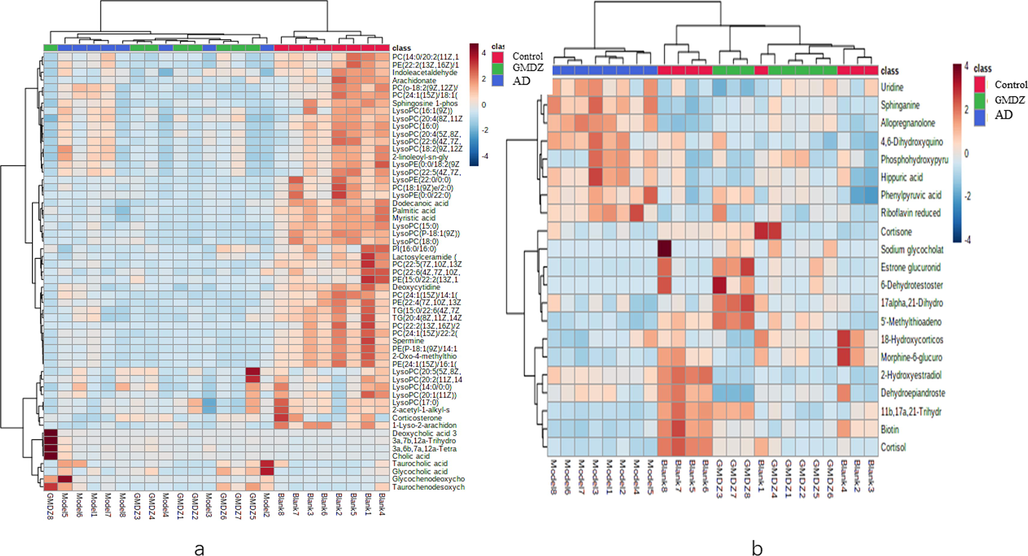
Heat maps of hierarchical clustering analysis (HCA) of the differential metabolite (a, heat map of plasma different metabolites; b, heat map of urine different metabolites).
Biomarkers identification based on receiver operator characteristic (ROC) curve: To further identify biomarkers and evaluate the therapeutic effect of GMDZ decoction, ROC curve analysis was conducted to construct a classification model, and the area under the curve (AUC) was used as an evaluation index. Fig. 9 shows the AUC curve of different quantities metabolites, it can be seen that 5 different metabolites in urine (2-hydroxyestradiol, biotin, 4,6-dihydroxyquinoline, morphine-6-glucuronide, riboflavin) can well distinguish GMDZ from AD groups, which are biomarkers of GMDZ decoction treatment on AD (see Fig. 10).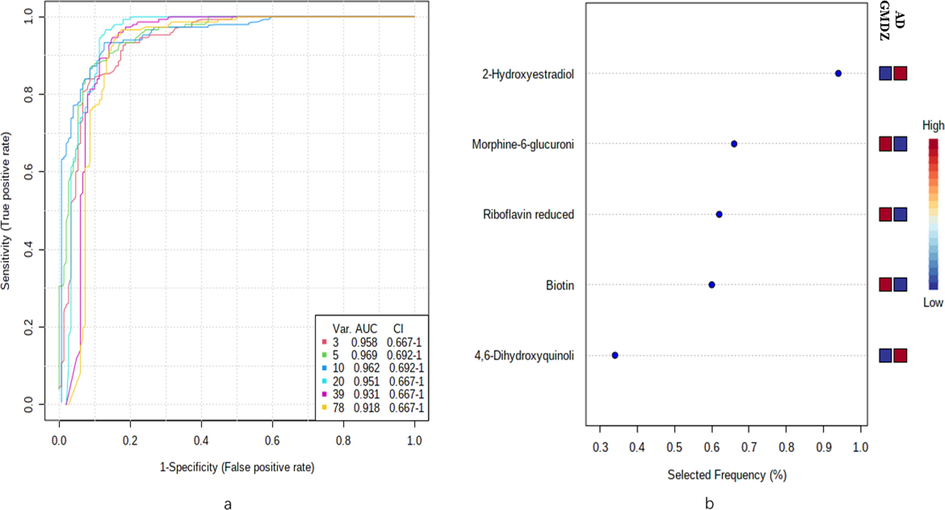
ROC curves plot of different metabolites. (a) represents ROC curve based on differential plasma metabolites and urine metabolites (b)represents the predictive accuracy of the top 5 biomarkers.
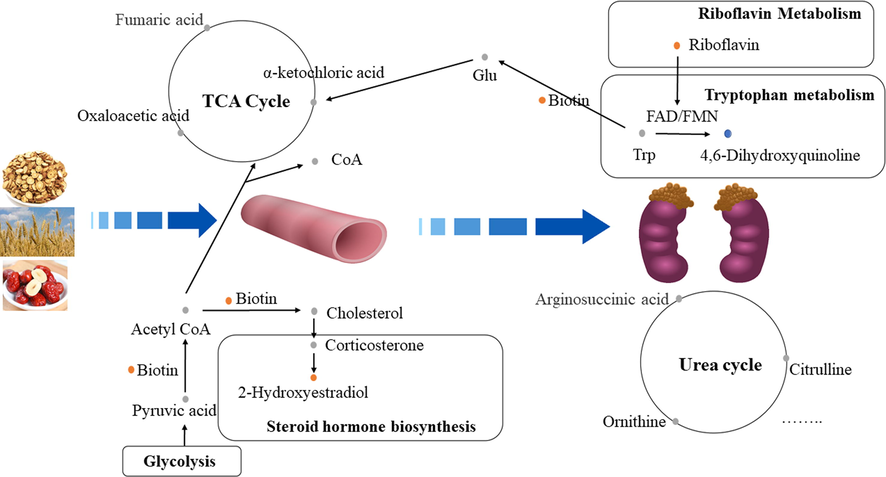
Active Plasma Components in GMDZ decoction improve AD rats with cognitive disorders and pathological damage by regulating blood and urine metabolism(the yellow dot represented up-regulated metabolite after GMDZ decoction administratio; the blue dot represented down-regulated metabolite after GMDZ decoction administration; the gray dot represents metabolite that has not been detected).
4 Discussion
Liquid-mass spectrometry has been widely used in components screening of traditional Chinese medicine and its compound prescriptions. The components screening of GMDZ decoction in the blood helps better understand the potential active components in the prescription and its mechanism. Studies have identified the main components of GMDZ decoction, including Flavonoids, Carotene, Triterpenoid saponin, Alkaloid, Steroid, Organic acid. In our study, a variety of Flavonoids, Triterpenoid saponin and Organic acid compound in blood were discovered, which laid the foundation for the GMDZ decoction’s role.
D-gal has been widely used to establish disease models with memory and cognitive impairments and aging-related defects (Chiroma et al., 2019; Liu et al., 2019). In our study, AD model was established by joint modeling method (intraperitoneal injection of D-gal and intraventricular injection of Aβ25-35). The MWM, HE straining and western blot results showed GMDZ decoction improved the learning and memory ability and history damage in AD rats.
The pathway map depicts the pathomechanism in AD rats and the therapeutic mechanism of GMDZ decoction for AD (shown in Fig. 9). In this study, there were metabolic abnormalities of amino acids, lipids and vitamins in plasma and urine of AD rats. However, urinary metabolism disorderly dominates, which may be due to discharge of disturbances under a steady-state regulatory mechanism in the body at the early disease. Urinary and feces are more early response to disease (Zhang et al., 2018). Among them, we found five metabolites (2-Hydroxyestradiol, Biotin, 4,6-Dihydroxyquinoline, Morphine-6-glucuronide, Riboflavin reduced) in urine, mainly involving steroid hormone biosynthesis, biotin metabolism, tryptophan metabolism, drug metabolism - cytochrome P450, and riboflavin metabolic pathways, indicating that GMDZ decoction may primarily play a role in regulating the above metabolism. The brain is an organ with large energy consumption, which is vulnerable to the interference of energy metabolism. AD is closely related to energy metabolism (Rijpma et al., 2018). Studies have shown that the down-regulation of energy metabolism in AD patients is a protective response of neurons to the microenvironment (Sun et al., 2012). Amino acids play an important role in energy metabolism. The level of amino acids can be used as a potential biomarker in patients with AD (Socha et al., 2020). Branched-chain amino acids (BCAAs), such as isoleucine, leucine, and valine, are essential amino acids and cannot be synthesized by the human body. The brain completes the absorption of BCAAs through a competitive transport carrier shared with tryptophan in the blood–brain barrier. Tryptophan is the precursor of serotonin and many other neutral amino acids. Long-term high levels of circulating BCAAs may lead to a decrease in the level of tryptophan in the brain and in the synthesis of serotonin and serotonergic signals in neurons. And we found 4,6-dihydroxyquinoline, which is one of the tryptophan metabolites, was downregulated in AD rats. These may further increase the risk of AD (Socha et al., 2020; Larsson and Markus, 2017; Choi et al., 2013).
Vitamin is critical to normal brain structure and functions, especially in pregnancy and infant, nutrients have laid a material foundation, and even affect brain function of the whole life cycle like sports, language and emotions (Prado and Dewey, 2014). Biotin promotes cGMP synthesis in the brain that would suppress amyloid-beta production within the brain by inhibiting expression of amyloid precursor protein and BACE1, these effects suggest that biotin might have the potential for the prevention and treatment of AD (McCarty and DiNicolantonio, 2017). In our study, the level of biotin in the AD group was down-regulated, while the level of biotin was significantly up-regulated after GMDZ decoction administration, GMDZ decoction may improve the biotin level in vivo to play a therapeutic role. Riboflavin is also an irreplaceable role in protecting nerves.
Lipids including sphingolipids, glycerophospholipids, and cholesterol play a vital role in many cell functions such as cell membrane formation, energy storage, and cell signaling (Wong et al., 2017). Disorders of lipid metabolism are related to neurological diseases and neurodegenerative diseases such as AD (Kao et al., 2020). In our study, abnormal metabolism of glycerolipids, sphingolipids, steroid and fatty acids was mainly involved. The changes of plasma phospholipids are related to the pathogenesis of AD and may be sensitive to the early neurodegeneration of preclinical AD (Mapstone et al., 2014; Whiley, 2014). We determined that lipid metabolism is related to the pathological process of AD and the therapeutic mechanism of GMDZ decoction. Specially, 2-Hydroxyestradiol is a steroid hormone secreted by ovarian, there are a variety of forms, such as estrone, estradiol (E2) and female 5ol (E3), estrogen need to function through combination with estrogen receptors. After women menopause, the Aβ gradually increases as the level of estradiol (E2) decreased. When the E2 treatment is given, the Aβ is significantly reduced. Studies have shown that due to the lack of E2, the amount of APP expression is significantly increased, and estrogen treatment can reduce the expression of APP in the cerebral cortex. At the same time, estradiol can play a nerve protective effect through the receptor dependent pathway to reduce the generation of β-amyloid.
In humans, morphine-6-glucuronide is involved in the morphine action pathway. Morphine-6-glucuronide is a primary metabolite. Primary metabolites are metabolically or physiologically essential metabolites. They are directly involved in organism’s growth, development or reproduction. Very few articles have been published on Morphine-6-glucuronide by now, and we will study further on this.
5 Conclusions
In summary, the active components in GMDZ decoction could effectively improve the learning and cognitive impairment and damaged hippocampus, significantly callbacks of key different metabolites of AD rats (Fig. 10). The main mechanism includes adjusting steroid hormone biosynthesis, biotin metabolism, tryptophan metabolism, drug metabolism - cytochrome P450, and riboflavin metabolism pathways. In the future, our group will continue to explore the role of GMDZ decoction on AD.
Acknowledgments
This work was supported by the National Science Foundation of China (No. 81703519) and Shenyang city Science and Technology Program (No: 21-108-9-12).
Declaration of Competing Interest
The authors declare that they have no known competing financial interests or personal relationships that could have appeared to influence the work reported in this paper.
References
- GABA and 5-HT Systems Are Involved in the Anxiolytic Effect of Gan-Mai-Da-Zao Decoction. Front. Neurosci.. 2019;12:1043.
- [CrossRef] [Google Scholar]
- Protective Effects of Centella asiatica on Cognitive Deficits Induced by D-gal/AlCl3 via Inhibition of Oxidative Stress and Attenuation of Acetylcholinesterase Level. Toxics. 2019;7(2):19.
- [CrossRef] [Google Scholar]
- Oral branched-chain amino acid supplements that reduce brain serotonin during exercise in rats also lower brain catecholamines. Amino Acids. 2013;45(5):1133-1142.
- [CrossRef] [Google Scholar]
- Classification and basic pathology of Alzheimer's disease. Acta neuropathologica. 2009;118(1):5-36.
- [CrossRef] [Google Scholar]
- Lipidomics for studying metabolism. Nature Rev. Endocrinol.. 2016;12(11):668-679.
- [CrossRef] [Google Scholar]
- Antidepressant-like effects of Gan-Mai-Dazao-Tang via monoamine regulatory pathways on forced swimming test in rats. J. Traditional Complement. Med.. 2017;8(1):53-59.
- [CrossRef] [Google Scholar]
- Dementia in China: epidemiology, clinical management, and research advances. The Lancet. Neurol.. 2020;19(1):81-92.
- [CrossRef] [Google Scholar]
- Effects of Herbal Medicine (Gan Mai Da Zao Decoction) on Several Types of Neuropsychiatric Disorders in an Animal Model: A Systematic Review: Herbal medicine for animal studies of neuropsychiatric diseases. J. Pharmacopunct.. 2017;20(1):5-9.
- [CrossRef] [Google Scholar]
- Modulating 5-HT4 and 5-HT6 receptors in Alzheimer's disease treatment. Future Medicinal Chem.. 2017;9(8):781-795.
- [CrossRef] [Google Scholar]
- Branched-chain amino acids and Alzheimer's disease: a Mendelian randomization analysis. Sci. Reports. 2017;7(1):13604.
- [CrossRef] [Google Scholar]
- Protective effect of walnut on d-galactose-induced aging mouse model. Food Sci. Nutrit.. 2019;7(3):969-976.
- [CrossRef] [Google Scholar]
- Plasma phospholipids identify antecedent memory impairment in older adults. Nature Med.. 2014;20(4):415-418.
- [CrossRef] [Google Scholar]
- Reduction in the neuronal surface of post and presynaptic GABAB receptors in the hippocampus in a mouse model of Alzheimer's disease. Brain Pathol. (Zurich, Switzerland). 2020;30(3):554-575.
- [CrossRef] [Google Scholar]
- Neuroprotective potential of high-dose biotin. Medical Hypotheses. 2017;109:145-149.
- [CrossRef] [Google Scholar]
- The diagnosis of dementia due to Alzheimer's disease: recommendations from the National Institute on Aging-Alzheimer's Association workgroups on diagnostic guidelines for Alzheimer's disease. Alzheimer's & Dementia: J. Alzheimer's Assoc.. 2011;7(3):263-269.
- [CrossRef] [Google Scholar]
- Traditional Chinese Medicine for Alzheimer's Disease and Other Cognitive Impairment: A Review. Am. J. Chinese Med.. 2020;48(3):487-511.
- [CrossRef] [Google Scholar]
- Plasma metabolomics in early Alzheimer's disease patients diagnosed with amyloid biomarker. J. Proteom.. 2019;200:144-152.
- [CrossRef] [Google Scholar]
- Role of the metabolism of branched-chain amino acids in the development of Alzheimer's disease and other metabolic disorders. Neural Regeneration Res.. 2020;15(8):1460-1470.
- [CrossRef] [Google Scholar]
- Nutrition and brain development in early life. Nutrition Rev.. 2014;72(4):267-284.
- [CrossRef] [Google Scholar]
- Altered brain high-energy phosphate metabolism in mild Alzheimer's disease: A 3-dimensional 31P MR spectroscopic imaging study. NeuroImage. Clin.. 2018;18:254-261.
- [CrossRef] [Google Scholar]
- Amino Acid Levels as Potential Biomarker of Elderly Patients with Dementia. Brain Sci.. 2020;10(12):914.
- [CrossRef] [Google Scholar]
- Down-regulation of energy metabolism in Alzheimer's disease is a protective response of neurons to the microenvironment. J. Alzheimer's Dis.: JAD. 2012;28(2):389-402.
- [CrossRef] [Google Scholar]
- Metabolic network failures in Alzheimer's disease: A biochemical road map. Alzheimer's & Dementia: J. Alzheimer's Assoc.. 2017;13(9):965-984.
- [CrossRef] [Google Scholar]
- Role of Glutamate and NMDA Receptors in Alzheimer's Disease. J. Alzheimer's Dis.: JAD. 2017;57(4):1041-1048.
- [CrossRef] [Google Scholar]
- Evidence of altered phosphatidylcholine metabolism in Alzheimer's disease. Neurobiol. Aging. 2014;35(2):271-278.
- [CrossRef] [Google Scholar]
- Dysregulation of lipids in Alzheimer's disease and their role as potential biomarkers. Alzheimer's Dementia: J. Alzheimer's Assoc.. 2017;13(7):810-827.
- [CrossRef] [Google Scholar]
- Yueju-Ganmaidazao Decoction confers rapid antidepressant-like effects and the involvement of suppression of NMDA/NO/cGMP signaling. J. Ethnopharmacol.. 2020;250:112380.
- [CrossRef] [Google Scholar]
- Early Candidate Urine Biomarkers for Detecting Alzheimer's Disease Before Amyloid-β Plaque Deposition in an APP (swe)/PSEN1dE9 Transgenic Mouse Model. J. Alzheimer's Dis.: JAD. 2018;66(2):613-637.
- [CrossRef] [Google Scholar]
Appendix A
Supplementary material
Supplementary data to this article can be found online at https://doi.org/10.1016/j.arabjc.2022.103879.
Appendix A
Supplementary material
The following are the Supplementary data to this article: