

Translate this page into:
Integration of ion-mobility high-resolution liquid chromatography/mass spectrometry-based untargeted metabolomics and desorption electrospray ionization-mass spectrometry imaging to unveil the ginsenosides variation induced by steaming for Panax ginseng, P. quinquefolius and P. notoginseng
⁎Corresponding authors at: National Key Laboratory of Chinese Medicine Modernization, State Key Laboratory of Component-based Chinese Medicine, Tianjin University of Traditional Chinese Medicine, 10 Poyanghu Road, Tianjin 301617, China. 17862987156@163.com (Hongda Wang), wzyang0504@tjutcm.edu.cn (Wenzhi Yang)
-
Received: ,
Accepted: ,
This article was originally published by Elsevier and was migrated to Scientific Scholar after the change of Publisher.
Abstract
Abstract
The raw and steamed products of ginseng exhibit different efficacy, and elucidation of the underlying chemical transformation is significant for their rational application and quality control. This work was designed to holistically depict the chemical variation of Panax ginseng (PG), P. quinquefolius (PQ), and P. notoginseng (PN) induced by the steaming, and to unveil the steaming-associated markers diagnostic for differentiating between the raw and processed products, following a three-step strategy: 1) systematic ginsenosides characterization by hybrid scan (namely HDDIDDA) available on the Vion™ ion mobility-quadrupole time-of-flight mass spectrometer coupled with reversed-phase ultra-high performance liquid chromatography; 2) holistic depiction of the chemical variation and discovery of potential markers by the pattern recognition untargeted metabolomics analysis; and 3) construction of steaming-induced transformation network combined with desorption electrospray ionization-mass spectrometry imaging (DESI-MSI). Consequently, 542 ginsenosides were characterized from the raw and processed PG/PQ/PN. Steaming at 1–10 h could cause significant chemical variation, and separately 26, 28, and 18 potential markers were found for the steaming of PG, PQ, and PN. Steaming-induced transformation network mainly involved hydration of the malonyl group, hydrolysis of the glycosyl moiety, and dehydration at C-20. DESI-MSI further revealed spatial distribution of marker saponins in the cork layer, phloem, and xylem, and primarily confirmed the hydrolysis reactions occurring to ginseng steaming. Conclusively, the established strategy is practical to unveil the holistic ginsenosides variation of ginseng induced by the processing, which is useful in the quality control of both the herbal medicines and foods.
Keywords
DESI-MSI
Ginseng
HDDIDDA
Medicinal and edible homologs
UHPLC/IM-QTOF-MS

- Ace
-
acetyl
- BPI
-
base-peak intensity
- CID
-
collision-induced dissociation
- DDA
-
data-dependent acquisition
- DESI‐MSI
-
desorption electrospray ionization-mass spectrometry imaging
- DIA
-
data-independent acquisition
- ESI
-
electrospray ionization
- Glc
-
glucose
- GlurA
-
glucuronic acid
- HDDDA
-
high-definition data-dependent acquisition
- HDMSE
-
high-definition MSE
- LC‐MS
-
liquid chromatography-mass spectrometry
- Mal
-
malonyl
- MDRCE
-
mass-dependent ramp collision energy
- MEH
-
medicinal and edible homologs
- OA
-
oleanolic acid
- OPLS-DA
-
orthogonal partial least-squares discriminant analysis
- OT
-
octillol
- PCA
-
principal component analysis
- PG
-
Panax ginseng
- PN
-
P. notoginseng
- PPD
-
protopanaxadiol
- PPT
-
protopanaxatriol
- PQ
-
P. quinquefolius
- RCE
-
ramp collision energy
- Rha
-
rhamnose
- RP
-
reversed-phase
- UHPLC/IM-QTOF-MS
-
ultra-high performance liquid chromatography/ion mobility-quadrupole time-of-flight mass spectrometry
- VIP
-
variable importance in projection
- Xyl
-
xylose
Abbreviations
1 Introduction
The concept of medicinal and edible homologs (MEH) originated from a traditional Chinese medicine book called Huang Di Nei Jing Su Wen, which represented a remarkable amalgamation of the food functions and medicinal effects (Gong et al., 2020). Due to their medicinal and nutritive values but with fewer adverse reactions, MEH plants have attracted the widespread attention, used as the herbal food products, dietary supplements, and functional foods (Deng et al., 2021; He et al., 2023; Zhang et al., 2021).
The MEH plants belonging to the Panax genus are renowned for their tonic effects. Aside from the widespread use in clinical preparations, the ginseng species also serve as the important source for a variety of functional foods, health products, and cosmetics (Li et al., 2023; Zhang et al., 2020). Among them, Panax ginseng (PG), P. quinquefolius (PQ), and P. notoginseng (PN), are three most popular Panax species widely consumed worldwide. PG and PN are mainly cultivated or produced in Asia, while PQ is mainly distributed in the North America. PQ has also been cultivated in Northeast China in the recent years. Abundant primary and secondary plant metabolites were identified in ginseng, such as the saponins (ginsenosides: the saponins isolated from the Panax genus), polysaccharides, amino acids, flavonoids, and organic acids/esters, etc (Li et al., 2022b; Liu et al., 2022; Shi et al., 2018). A collection of studies have demonstrated ginsenosides are the common chemical components for the ginseng varieties, which have pronounced effects in enhancing the immunity, antioxidation, anti-aging, anti-inflammation, anti-fatigue, and antitumor, etc. (Valdés-González et al., 2023; Zhou et al., 2022, 2024). Different ginseng varieties not only share the ginsenosides, but also possess the characteristic ginsenosides (chemical markers). Notoginsenoside R1 (noto-R1) is characteristic for PN, while 24(R)-pseudoginsenoside F11 is a characteristic marker for PQ; ginsenoside Rf is featured for PG, and also detectable in PN (Wang et al., 2023b; Zhang et al., 2023a). In the practice, ginseng is often processed by the steaming. Studies have shown that the drug materials of PG, PQ, and PN, can undergo a series of chemical reactions during the steaming process, resulting in variations in the medicinal properties, flavor, functions, and indications (Chen et al., 2023; Wang et al., 2023a). Using PG as a case, white ginseng refers to the dried materials after the harvesting, while red ginseng and black ginseng are the products made from fresh ginseng after the steaming for different time periods (Huang et al., 2023a). As documented, red ginseng and black ginseng have shown stronger anticancer activity than while ginseng (Park et al., 2022; Ye et al., 2023). In addition, the steamed PQ is a more effective immunomodulatory agent capable of preventing the immune system hypofunction, compared to the raw material (Zhang et al., 2023b). Ginsenosides Rg1, ‐Re, ‐Rb1, ‐Rd, and noto‐R1, are the primary bioactive components found in the root/rhizome of PN (Li et al., 2022a), which undergo the conversions into 20(S/R)‐ginsenosides Rg3, ‐Rh1, ‐Rk1, ‐Rg5, ‐Rk3, and ‐Rh4, suffering from the high-temperature steaming (Hou et al., 2021; Liu, 2012; Jo et al., 2014).
Quality research on ginseng varieties remains a hot topic in the fields of natural products research and analytical chemistry (Li et al., 2022b; Zhang et al., 2022). Notably, both in the pharmacopoeia and basic researches, ginsenosides are exclusively utilized as the chemical markers for authentication and the quality assessment (Kan et al., 2023; Wang et al., 2023b; Yao et al., 2021). Multiple detectors in hyphenation with liquid chromatography have been reported in ginsenosides analysis. Amongst them, the liquid chromatography-mass spectrometry (LC‐MS), due to its high sensitivity, high selectivity, and high applicability, has become the first choice in the material basis research, species identification, and quality evaluation of the Panax genus (Li et al., 2022b; Yang et al., 2020). Among them, application of the flexible MS scan methods can facilitate personalized analysis of the complex herbal metabolites, such as data-dependent acquisition (DDA; fast DDA (Geng et al., 2021)), data-independent acquisition (DIA; MSE (Li et al., 2021) and SWATH (Sebald et al., 2020)), and the other combined scan methods (Hu et al., 2024). Additionally, ion mobility-mass spectrometry (IM-MS) has been increasingly used in the analysis of herbal metabolites by feat of its ability to provide an additional dimension of separation that is orthogonal to the m/z resolution of MS. The IM-MS coupled with LC can thus provide four-dimensional structure information, including the tR, collision cross section (CCS), MS, and MS/MS data, which benefits the enhanced characterization of herbal metabolites (Wang et al., 2022; Wang et al., 2024). More importantly, the processing on the raw herbal materials can cause a series of chemical transformation, which are holistic and very complex. Metabolomics has been justified as a practical solution to depict the holistic transformation network and to discover the processing-related chemical markers that are useful for the quality control of herbal medicines (Chen et al., 2023; Li et al., 2020).
The desorption electrospray ionization-mass spectrometry imaging (DESI‐MSI) combined with metabolomics can provide an efficient method to visualize the changes and screen the markers of herbal medicines during the processing (Fan et al., 2022). The DESI can directly generate ions from the objects in the ambient environment by utilizing charged solvent spray and high-speed nebulizing gas jet (Morato and Cooks, 2023). The direct contact and interaction between the charged droplets and the sample surface after atomization result in the direct desorption and ionization of the analytes. With the assistance of the inert gas (typically nitrogen), the charged droplets ultimately form the gas-phase ions and are detected by the mass spectrometer detector. MSI can quickly visualize the spatial distribution of the metabolites in diverse plant tissues (Luo et al., 2024; Zhao et al., 2023). Therefore, the combination of LC-MS and MSI can render a powerful strategy in unveiling processing-induced chemical transformation and offering the location information of significantly altered metabolites.
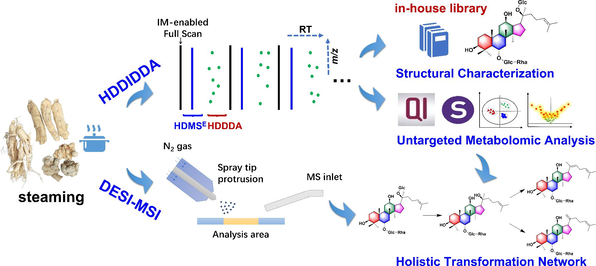
In order to elucidate the holistic ginsenosides variation of PG, PQ, and PN during the steaming and discover the processing-associated markers with the spatial distribution information, we presented an integral strategy illustrated in Fig. 1. Firstly, a UHPLC/IM-QTOF-MS approach by developing a hybrid scan method (HDMSE/MS-MS, namely HDDIDDA) was established to identify as many ginsenosides as possible from both the raw materials and steamed products for PG/PQ/PN. Especially, the “one-stop” intelligent data annotation workflow was achieved on the UNIFI system (Waters) by incorporating an in-house library of ginsenosides. Secondly, based on UHPLC/IM-QTOF-HDMSE and untargeted metabolomics, the ginsenosides changes occurring to PG, PQ and PN at different steaming time (2–10 h) were unveiled, with the significantly altered ones discovered. Thirdly, a DESI-MSI approach was established to study the spatial and temporal distribution of those ginsenoside markers disclosed by LC-MS. In particular, the transformation network of ginsenosides during the steaming was elaborated by comprehensively analyzing both the LC-MS and MSI data.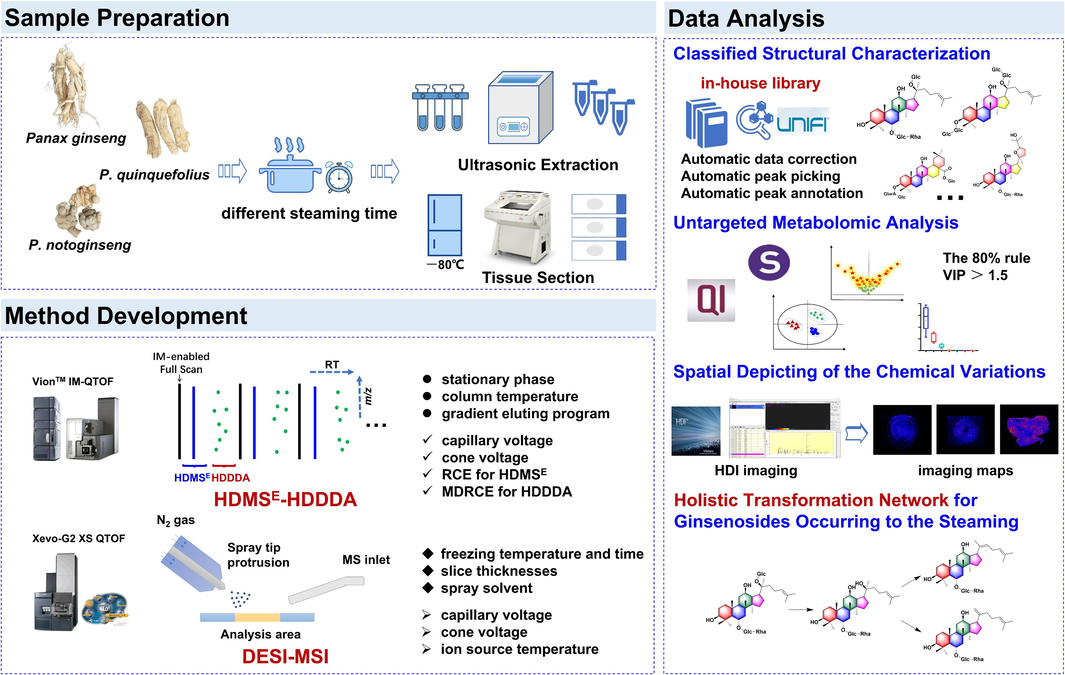
The overall technical roadmap of the ion-mobility high-resolution LC-MS-based untargeted metabolomics and DESI-MSI for depicting the steaming-induced ginsenosides variation simultaneously for three ginseng species (PG, PQ, and PN).
2 Materials and methods
2.1 Chemicals and reagents
A total of 62 ginsenosides (HPLC-UV purity: >95 %; chemical structures shown in Fig. S1, detailed information given in Table S1), purchased from Standard Biotech. Co., Ltd. (Shanghai, China), were used as the reference compounds. Acetonitrile, methanol, and formic acid (FA; Fisher, Fair lawn, NJ, USA) were of the LC-MS grade. Ultra-pure water was purified using a Milli-Q Integral 5 water purification system (Millipore, Bedford, MA, USA). Indium oxide-coated glass slides were purchased from Bruker Daltonics (Bremen, Germany). Crude drug materials of PG, PQ, and PN were purchased from Yucuitang Flagship Store (Tonghua, Jilin), Caowangshenye Flagship Store (Tonghua, Jilin), and Jiaxiangwei Flagship Store (Wenshan, Yunnan), in January 2021. All chemicals, reagents and samples analyzed in this work were deposited in the State Key Laboratory of Component-based Chinese Medicine (Tianjin, China).
2.2 Sample preparation
The samples analyzed in this work include the raw materials of PG, PQ, and PN (named as 0 h), and their processed products prepared at different time points (1 h, 2 h, 4 h, 6 h, 8 h, and 10 h). Detailed information regarding the steaming process is provided in the Supporting Information. The accurately weighed powder of each sample (50 mg) was dispersed in 10 mL of 70 % (v/v) methanol, and further extracted with the aid of ultrasound (400 W, 40 kHz, 40 °C) for 60 min. After being centrifuged at 3,219 × g (4,000 rpm) for 10 min, the supernatant was taken and further diluted to a constant volume with 70 % aqueous methanol in a 10-mL volumetric flask, as the stock solution (5 mg/mL). In addition, all test solutions were mixed in the equal volume (105 batches of samples) to prepare a QC sample, used to optimize the analytical condition and monitor the instrument stability. Additionally, for the multi-component characterization purpose, all the test solutions within the same ginseng species were separately mixed in the equal volumes, which were centrifuged at 11,481 × g (14,000 rpm) for 10 min to give the test solutions for PG, PQ, and PN.
2.3 UHPLC/IM-QTOF-MS
The LC-MS analysis was conducted on an ACQUITY UPLC I-Class/Vion IMS-QTOF system operating under UNIFI control (Waters, Milford, MA, USA). A CSH C18 column (2.1 × 100 mm, 1.8 µm) hyphenated with a VanGuard Pre-column (2.1 × 50 mm, 1.7 µm) maintained at 30 °C was used for the chromatographic separation. A binary mobile phase, containing 0.1 % FA in H2O (A) and CH3CN (B), was employed at a flow rate of 0.3 mL/min following an optimal gradient elution program: 0–2 min, 15–22 % (B); 2–4 min, 22 % (B); 4–9 min, 22–30 % (B); 9–10 min, 30–32 % (B); 10–22 min, 32 % (B); 22–25 min, 32–34 % (B); 25–39 min, 34–60 % (B); 39–41 min, 60–95 % (B); and 41–44 min, 95 % (B).
To enable the highly sensitive detection of ginsenosides in the negative ESI mode, the ion source parameters were as the follows: capillary voltage, −1.5 kV; cone voltage, −20 V; source temperature, 120°C; desolvation temperature, 500℃; desolvation gas flow (N2), 800 L/h; and cone gas flow (N2), 50 L/h. The hybrid scan approach HDDIDDA was composed by three different scan events (Wang et al., 2022). 1) Ion mobility-enabled full scan (MS1). The survey scan was performed with the TOF mass analyzer, scanning over a mass range of m/z 100–1500 at 0.3 s per scan under 6 eV of low energy. The default parameters were defined for the travelling wave ion mobility separation (Paglia et al., 2015). 2) Data-independent high-energy HDMSE scan (MS2). Ramp collision energy (RCE) was set at 40–60 eV and the scan time was 0.3 s. 3) Data-dependent HDDDA (MS2). Three most intense precursor ions (top 3) were set to automatically trigger the MS/MS acquisition when the intensity exceeded 1000 counts, which stopped no longer than 0.7 s (timeout). The mass scan range was m/z 100–1500 and scan rate at 0.2 s per scan. Mass-dependent ramp collision energy (MDRCE) was set at 30–70 eV in the low mass and 40–80 eV in the high mass. Calibration was conducted using an external reference (Lock Spray™) by constantly infusing a solution of leucine enkephalin (200 pg/mL; Sigma-Aldrich, St. Louis, MO, USA) at 10 µL/min. By inputting an in-house library of ginsenosides recording 573 known ginsenosides (Li et al., 2022b), the automatic data processing and annotation workflows separately for the HDDDA and HDMSE data were established by using the UNIFI™ 1.9.3.0 platform (Waters). Key parameters set in UNIFI, in general, were consistent with our previous report (Yang et al., 2022).
2.4 Multivariate statistical analysis
All the raw HDMSE data (ESI−) of 105 batches of ginseng samples were corrected by the UNIFI workflows, and then processed by Progenesis QI v2.1 (Waters). The adduct ions, including [M−H]−, [M−H+HCOOH]−, and [2M−H]−, were set to perform the peak correction, peak extraction, and peak annotation to generate a data matrix including the information of tR, m/z, CCS, and abundance for each metabolic feature. The data matrix was imported into the SIMCA-P v14.1 software (Umetrics, Umea, Sweden) for data modeling after the pre-processing. The unsupervised principal component analysis (PCA) and supervised orthogonal partial least-squares discriminant analysis (OPLS-DA) were used for the chemometrics analysis to depict the ginsenosides variation along with the extension of steaming time. The variable importance in projection (VIP) score, evaluating the importance of each variable in a classifier, was utilized to discover the potential differential components for PG, PQ, and PN induced by the steaming.
2.5 DESI-MSI
All tissue sections were prepared by the frozen section method, with the details given in Supporting Information. The processing parameters of cryo-sectioning were set as the follows: embedding agent, OCT (frozen for 15 min at −80°C); box temperature, −22°C; sample head temperature, −18°C; and section thickness, 40 μm (Jiang et al., 2023).
The MSI data in the negative ion mode were collected using the Waters Xevo-G2 XS QTOF platform equipped with a DESI source (Waters). The relevant parameters were set as follows: capillary voltage, −4.5 kV; cone voltage, −80 V; ion source temperature, 120°C; scanning range, m/z 300–1500; the X and Y pixel sizes, 150 μm; and scanning rate, 400 μm/s. High-definition imaging (HDI) (Version 1.6, Waters Corporation, Manchester, UK) software was applied to process the data of MSI, were processed by using the HDI software (Waters), with the following specific parameters: High-mass precision retention data (number of most intense peaks), 1000; Mass range, m/z 300–1500; m/z window, 0.02 Da; mass lock applied (enable Lock mass): −Ve: 554.2620; Lock mass tolerance, 0.25 amu; Min Signal Intensity, 500 counts (Jiang et al., 2023; Zhao et al., 2023). The identification of the molecules in MSI experiments was performed by comparing the m/z information of the targeted list added during the data processing.
3 Results and discussion
3.1 Optimization of key parameters of the UHPLC/IM-QTOF-MS approach for the multi-component characterization of PG/PQ/PN
Aiming to systematically clarify the chemical composition and explore the metabolome difference of PG, PQ, and PN before and after the steaming, an UHPLC/IM-QTOF-HDMSE/HDDDA dimension-enhanced multi-component characterization approach was established. For this purpose, key parameters of the chromatography (e.g., stationary phase, column temperature, and gradient elution program) and the Vion IM-QTOF (e.g., capillary voltage, cone voltage, RCE for HDMSE and MDRCE for HDDDA) were optimized by the single-factor experiments. Considering the high selectivity on ginsenosides, the reversed-phase (RP) columns were selected. Selection of the stationary phase was conducted by comparing the chromatographic columns of 10 reversed-phase matrices, which showed difference in the silica gel core (full porous or core–shell), bonding technology, and bonding groups (Table S2). By observing the general resolution, peak shape, and the number of ions detected in base peak intensity (BPI) chromatograms, the CSH C18 enabled more balanced separation of the peaks with better peak symmetry (Fig. S2). Furthermore, different column temperature settings can have an impact on the chromatographic separation. Here, 30°C (Fig. S3) was selected as the best column temperature considering the advantages in terms of the baseline, peak shape, and resolution.
To enhance the sensitivity in detecting ginsenosides, two key ion source parameters (capillary voltage and cone voltage) and the collision energy (RCE for HDMSE and MDRCE for HDDDA) were optimized by evaluating the peak areas of ten representative ginsenosides (Table S3). When capillary voltage was set at 1.5 kV, much higher precursor ion response was observed and the variation in the peak areas was stable for all the index components (Fig. S4A). Cone voltage can induce the occurrence of in-source cleavage (Wang et al., 2024). In this work, when the cone voltage was set to 20 V, the response of the index components was high, and the effect of in-source cleavage was not severe (Fig. S4B). For MDRCE in HDDDA, we finally selected MDRCE at 30–70 eV/40–80 eV by comparing the abundance of those secondary fragments produced at different levels. Under this condition, the fragments were intact with high response, which displayed relatively complete fragments information to aid in the structural identification (Fig. S5A). For RCE in HDMSE, different levels such as 20–40 eV, 30–50 eV, 40–60 eV, 60–80 eV, and 80–100 eV, were examined, and a ramp of 40–60 eV was finally set enabling the generation of rich fragments (Fig. S5B). A simple method validation for the UHPLC/IM-QTOF-MS was also conducted. The range of intra-day precision (RSD, in %) varied among 1.40–11.83 % (Table S4), while the inter-day precision was 4.61–13.36 % (Table S5). Repeatability determined through six copies of the QC samples showed a variation of 3.51–10.73 % (Table S6). These results could demonstrate the established approach was suitable for the qualitative characterization of the ginsenosides in PG, PQ, and PN.
Notably, based on the Waters Vion™ IM-QTOF mass spectrometer platform, the HDDIDDA hybrid scan approach integrates ion mobility separation of all precursors, and the alternating DIA and DDA (Wang et al., 2022). It thus provides one more dimension of structural information, showing the separation potential of isomers and co-eluted components, greatly improving the peak capacity, signal-to-noise ratio, and spectral clarity. The HDDIDDA strategy can not only improve the analysis efficiency, but also combine the advantages of these two scanning modes, that is, high coverage for DIA and high accuracy for DDA. In addition, the determined CCS can assist in the reliable identification due to the comparison with 48 reference compounds (Table S7), thus providing another dimension of evidence supporting the identification of ginsenosides from the samples of PG, PQ, and PN.
3.2 Ginsenosides identification in the raw and steamed products of PG, PQ and PN
As the characteristic and bioactive ingredients of ginseng, the ginsenosides can be roughly divided into the protopanaxadiol (PPD), protopanaxatriol (PPT), oleanolic acid (OA), octillol (OT), malonylated (Mal), C-17 side-chain varied, and other subtypes, according to the sapogenins and attached substituents. The ginsenosides in the raw materials and steamed products of PG, PQ, and PN, were systematically identified by integrating the UNIFI-facilitated automatic peak annotation, reference compounds comparison, and literature searching. And 164, 192, and 182 compounds were ultimately identified or tentatively characterized for PG (Table S8), PQ (Table S9), and PN (Table S10). Here, we illustrated the characterization of the PPD-type, PPT-type, and malonylated ginsenosides, as the typical cases.
Characterization of the PPD-type ginsenosides. We took the reference compound ginsenoside Rb1 (compound 62#, PQ, tR 13.18 min, C54H92O23) as an example to illustrate its main fragmentation features in the negative ESI mode. The [M−H]− and [M−H+HCOOH]− peaks were observed at m/z 1107.5944 and 1153.6002. Deprotonated precursors could continuously lose Glc (m/z 945.5421 [M−H−Glc]−), H2O (m/z 927.5299 [M−H−Glc−H2O]−), and 3 × Glc, to produce the PPD aglycone ion at m/z 459.3851 ([PPD−H]−). Similarly, in the case of an unknown ginsenoside (compound 117#, PQ, tR 25.17 min, C56H94O24), the deprotonated precursor and the FA-adduct precursor ion were observed at m/z 1149.6029 ([M−H]−) and 1195.6091 ([M−H+HCOOH]−), respectively. Its MS2 spectrum exhibited a series of fragments at m/z 1107.5928, 945.5360, 783.4901, 621.4485, and 459.3842, separately assigned as [M−H−Ace]−, [M−H−Ace−Glc]−, [M−H−Ace−2Glc]−, [M−H−Ace−3Glc]−, and [PPD−H]− (Fig. S6A). Accordingly, it was tentatively characterized as PPD-4Glc-Ace (Yang et al., 2020).
Characterization of the PPT-type ginsenosides. The collision-induced dissociation (CID)-MS2 behavior for the PPT-ginsenosides was extremely analogous to that of the PPD-type, but the difference was the generation of a sapogenin ion at m/z 475.37. Compound 21# (PQ, tR 6.71 min, m/z 945.5420 for [M−H]−, C48H82O18), consistent with ginsenoside Re, was used to illustrate the fragmentation behavior of the PPT-type neutral ginsenosides (Fig. S6B). For an unknown compound 37# (PQ, tR 9.55 min, C50H84O19), the [M−H]− peak at m/z 987.5600 and the [M−H+HCOOH]− peak at m/z 1033.5582 were observed. Its CID-MS2 spectrum displayed the product ions of m/z 945.5508, 783.4901, 637.4391, and 475.3790, which were assigned as [M−H−Ace]−, [M−H−Ace−Glc]−, [M−H−Ace−Glc−Rha]− and [PPT−H]−, respectively. Accordingly, we could characterize compound 37# as pseudoginsenoside Rs1 or isomer (PPT-2Glc-Rha-Ace, Fig. S6B).
Characterization of the malonylated ginsenosides. The neutral ginsenosides are easy to be acylated, and the polar substitution with the malonyl group generates the malonylginsenosides. Compound 70# (PQ, tR 14.82 min, C57H94O26, Fig. S6C) was identified as malonylginsenoside Rb1 because of the reference compound comparison. It displayed the [M−H]− precursor ion at m/z 1193.5923. The fragments at m/z 1107.5915 ([M−H−Mal]−) and 1089.5858 ([M−H−Mal−H2O]−) should result from the continuous elimination of Mal and H2O (Shi et al., 2018). Successive cleavages of 3 × Glc and 4 × Glc were observed generating the ions of m/z 621.4346 ([M−H−Mal−3Glc]−) and 459.3783 ([PPD−H]−). In addition, the secondary fragment of the PPD sapogenin was also detected at m/z 375.2960 ([PPD−H−C6H12]−) (Yang et al., 2020). Similarly, the unknown compound, compound 121# (PQ, tR 26.71 min, C51H84O21), was deduced to be malonylginsenoside Rd isomer (PPD-3Glc-Mal, Fig. S6C).
3.3 Morphological and ginsenosides variations for PG, PQ, and PN by the steaming
An untargeted metabolomic differential analysis, based on the UHPLC/IM-QTOF-HDMSE data, was constructed, and the chemical markers related to the steaming of PG, PQ, and PN, were preliminarily discovered and identified.
3.3.1 Preliminary analysis of the appearance and BPI
After being steamed at high temperature for a period of time, the morphology and color of the PG/PQ/PN samples significantly changed (Fig. 2A). As the steaming time prolonged, the moisture of the herb sharply decreased, and the samples shrinked due to the loss of water, rendering the steamed product smaller in size than the fresh sample. Moreover, as the extension of steaming time, the color gradually deepened from the light brown of the raw material to dark brown. According to the BPI chromatograms, remarkable ginsenosides variations were observed. The polar ginsenosides underwent a series of reactions, producing the less polar components in an increasing content (Fig. 2B).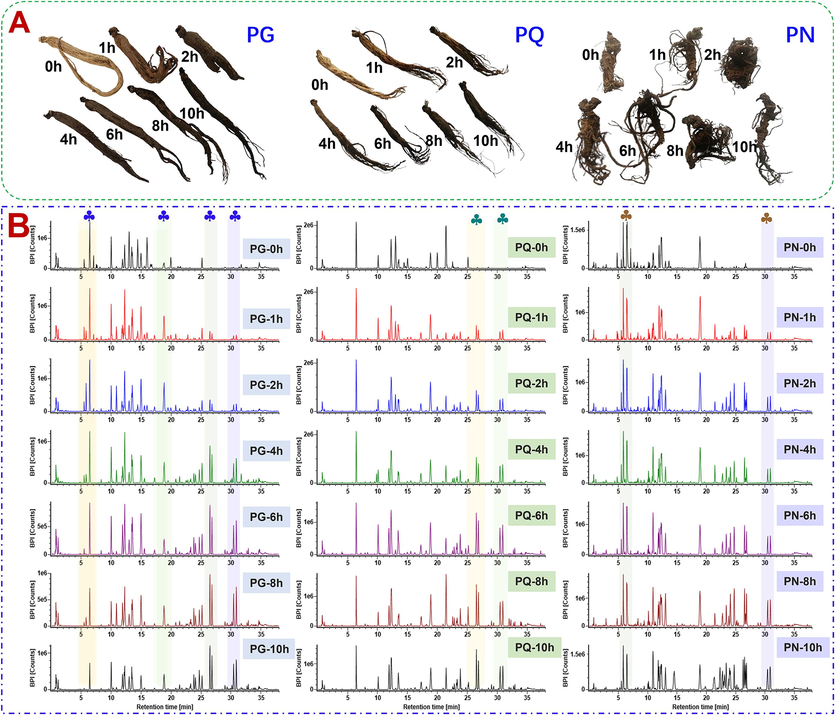
Preliminary difference analysis of the raw materials and steamed products of PG/PQ/PN on the appearance and the base peak chromatograms (BPCs). A-Changes in the sample morphology and color during the steaming of PG, PQ, and PN; B-BPCs of PG, PQ, PN at different steaming time.
3.3.2 Application of untargeted metabolomics to unveil the potential differential ginsenosides before and after the steaming for PG/PQ/PN
In the untargeted metabolomics analysis, we initially compared four data pre-treatment methods for screening the robust metabolic features. Method 1: “80 % rule” (remove the features that exceed 80 % of the null values for all sample batches; Bijlsma et al., 2006); Method 2: “30 % rule” (retain the features of peak area showing RSD less than 30 % in the QC sample); Method 3: further normalize the data after “80 % rule” processing; Method 4: 30 % rule processing based on Method 3. Consequently, the PCA score chart (Fig. 3A) demonstrated that the better clustering effect of the QC data gained by the Method 3 treatment. Generally, these samples were divided into three groups: the raw, steamed for 1 and 2 h, and steamed for 4/6/8/10 h (Fig. 3B). When the VIP cutoff was set at 1.5, separately 288, 307, and 325 differential ions were screened for PG, PQ, and PN, respectively. These ions could be assigned as 26 (Table S11), 28 (Table S12), and 18 (Table S13) ginsenosides (Fig. 3C).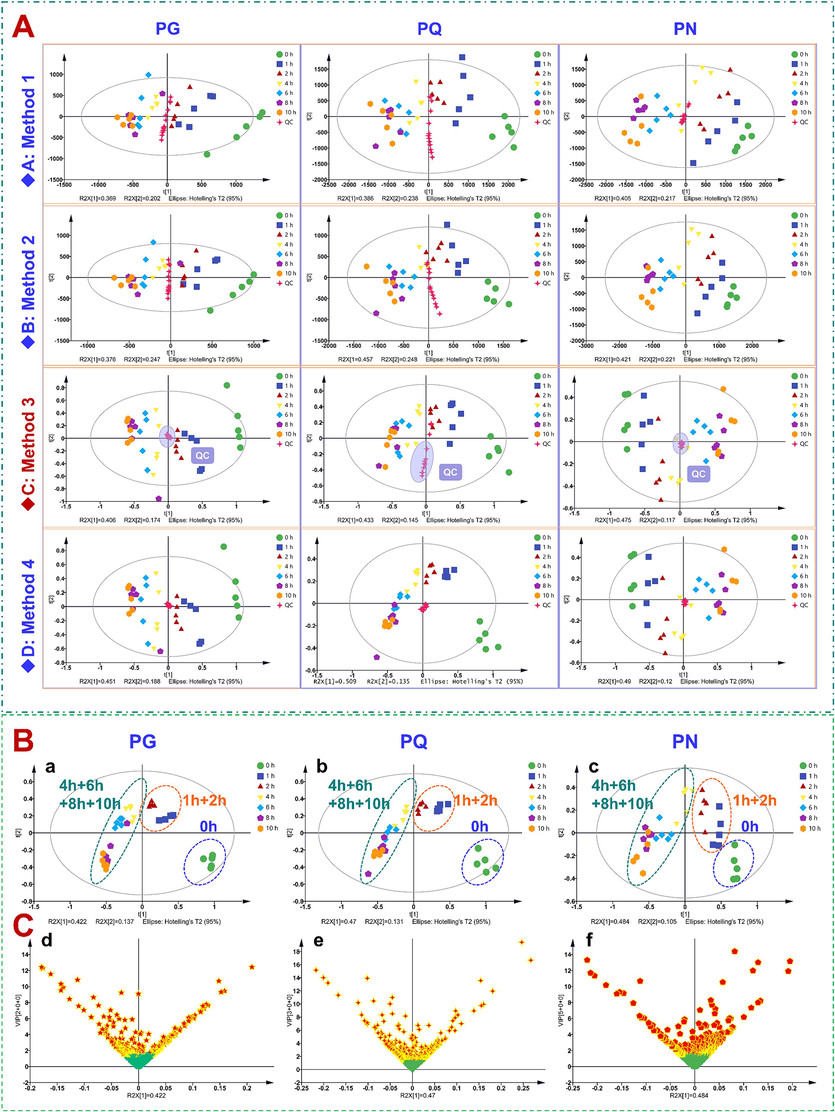
Multivariate statistical analysis of the raw materials and steamed products of PG, PQ, and PN. A-PCA score plot obtained by different data pre-treatment methods: Method 1, 80% rule without normalization; Method 2, 30% rule without normalization; Method 3, 80% rule after normalization; Method 4, 80% rule and 30% rule after normalization; B-OPLS-DA score plots for PG, PQ, and PN; C-VIP plots of PG, PQ, and PN based on the OPLS-DA classification model.
Characteristic components of PG with different steaming time. In the steaming process of PG samples, the contents of M1, M2 (Re), M4, M6 (m-Rb2), M16, M18, M19, and M21 (m-Rb1), showed the significant decrease trend, while the contents of M3, M10 (20(S)-ginsenoside Rh2), M12 (20(S)-ginsenoside Rh1), and M13 (20(R)-ginsenoside Rh2) clearly increased. It is worth noting that ginsenoside Rh2 has significant pharmacological activity, and the increase in Rh2 content after steaming provides evidence for the superior activity of red ginseng compared to the raw ginseng. Finally, m-Rb1, m-Rb2, 20(S)-Rh2, 20(S)-Rh1, and 20(R)-Rh2 were used as the markers for processing PG, while the unknown markers M16 (pseudoginsenoside Rs1 or isomer, C50H84O19, PPT-2Glc-Rha-Ace) and M19 (malonylginsenoside Rd isomer, C51H84O21, PPT-2Glc-Rha-Mal) deserves the further investigation to fully establish their structures (Fig. 4A and Fig. S7A).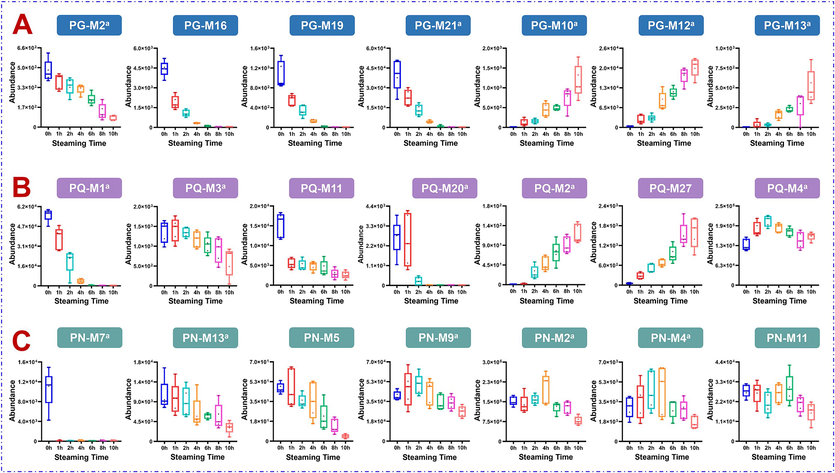
Box charts illustrating the content variation of some markers for PG (A), PQ (B), and PN (C) steamed at different time.
Characteristic components of PQ with different steaming time. While steaming PQ, the content of eight characteristic components decreased significantly: M1 (m-Rb1), M3 (Re), M6, M10, M11, M18, M20 (m-Rd), and M22. Meanwhile, and the contents of M2 (Rg5), M26, and M27, showed a remarkable increase trend. In addition, the content of M4 (Rb1) reached the highest when steaming for 2 h, and then showed a downward trend with the prolonging of the steaming time. The effective immunomodulatory and hypoglycemic effect of the steamed PQ may be related to these increased ginsenosides (Sun et al., 2012; Zhang et al., 2023b). By contrast, m-Rb1, Rb1, m-Rd, Rg5, and Re, can be the potential differential markers during the processing of PQ (Fig. 4B and Fig. S7B).
Characteristic components of PN with different steaming time. During the steaming process of PN, the contents of M5, M7 (20(S)-F1), M9 (noto-Fa), M10, and M13 (m-Rb1), decreased significantly, but M14 significantly increased. The overall contents of M1, M2 (Re), M3 (Rb1), M4 (noto-R4), and M6 (noto-Fd), showed a gradual increase followed by a decrease. Compared with the raw material, steamed PN exhibited stronger tonifying effects, which probably could be related to the increase in the content of these ginsenosides (Xiong et al., 2019). During the steaming process, the content of M11 showed a decreasing-increasing–decreasing variation trend. The 20(S)-ginsenoside F1, noto-Fa, m-Rb1, Rb1, Re, and noto-Fd, were finally identified as potential differential markers during the processing of PN (Fig. 4C and Fig. S7C).
3.4 Spatial depicting of the steaming-induced ginsenosides variations for PG, PQ, and PN by DESI-MSI
A DESI-MSI method was developed to globally analyze the ginsenosides of PG/PQ/PN steamed at different periods of time. The key parameters affecting the slice (e.g., freezing time, microtome body temperature, sample head temperature, and slice thickness) and detection (e.g., capillary voltage, cone voltage, and ion-source temperature), were optimized. By comparing different freezing temperature settings (−80℃ and−20℃) and time (1, 2, 5, 8, 10, 15, and 20 min), we could conclude freezing at −80℃ for 15 min was the optimal experimental condition (Tables S14). When setting the temperature of the microtome body and the sample head for the tissue section, the temperature of the sample head should be 2−4℃ higher than the temperature of the box. This temperature difference could help prevent the tissue from rolling up due to the high temperature of the box, ensuring that it can be properly attached to the slide. During the sectioning process, the chamber temperature was set at −22℃, and the sample head temperature was −18℃. We examined slice thicknesses (10–60 μm), a key factor affecting the image resolution and imaging effects. To obtain better integrity of the tissue structure and improve the quality of the spectrum, a slice thickness of 40 μm was considered as the most suitable (Fig. S8). The samples were processed with the optimized slicing condition to acquire the data of the PG/PQ/PN root/rhizome samples. The capillary voltage (−4.5 kV), cone voltage (−80 V) and ion source temperature (120℃) were optimized. The use of 95 % MeOH as the spray solvent gave good imaging effect.
The Fig. 5A shows the tissue diagrams of the PG, PQ, and PN sections. According to the imaging maps of raw materials for these three ginseng varieties, we could obtain the spatial distribution map of m-Rb1/m-Rb2/Rb3/Rg1/Rd/Re/Ro and other components or their isomers (Fig. 5B–D). In PQ, m-Rb1 and Rb1 were mainly distributed in the cork layer, while m-Rb2 in PG and PQ was concentrated in the cork layer, and Ro in the cork layer and xylem. It could thus be concluded that the types and contents of ginsenosides distributed in the cork layer, phloem, and xylem were relatively high, which may be related to the plant self-protection mechanism.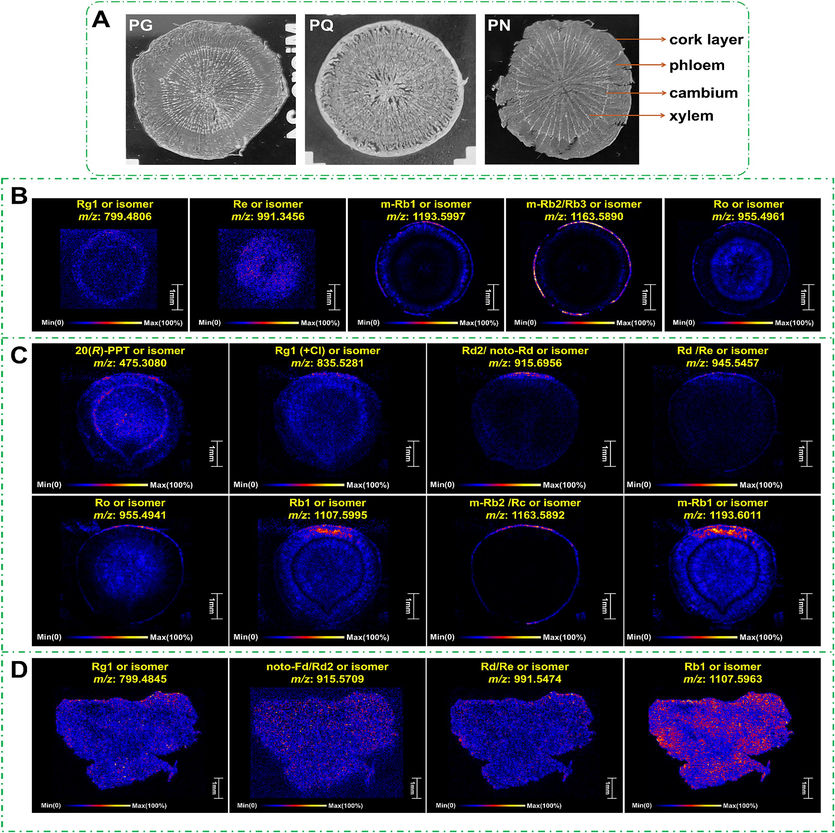
Slices and mass spectrometry images of the raw materials of PG/PQ/PN. A-Structure of the transverse section of PG, PQ, and PN; B/C/D-DESI-MSI images of the representative ginsenosides of PG/PQ/PN in the negative mode.
Additionally, the DESI-MSI method was used to detect the possibly transformed ginsenosides in the steamed products of PG, PQ, and PN, and to compare the difference in the spatial distribution of each component. In the section slice of raw PG (marked as 0 h), rich malonylginsenosides were observed (Fig. 6A). Especially, m-Rb1 was mainly distributed in the cork layer and phloem, and only a small amount in xylem. Ginsenoside Rg3 of low content was visualized with the distribution in the cortex, cork layer, phloem, cambium, and xylem. The content of ginsenoside Rk1/Rg5 was very low for PG when steaming for 2 h. Comparatively, the contents of Rb1, Rg3, and Rk1/Rg5 were increased in PG with steaming at 10 h (Fig. 6A). The OA-type ginsenoside Ro and zingibroside R1/chikusetsusaponin Ⅳa (as the isomers) in PQ exhibited a pattern of decreasing, then increasing, and then decreasing again with the prolonged steaming time. The content of calenduloside E was the highest in PQ when steaming for 2 h (Fig. 6B). Noto-R1 (PPT-type) in PN was distributed in the whole area of rhizome in the raw material, particularly in the cork layer. After steaming for 1 h, its content increased significantly. But when steaming for 8 h or even longer, noto-R1 was almost undetectable in the rhizome of PN. The contents of Rh1 and Rh4 were the highest in the steamed product of PN at 8 h, and distributed in the whole area. After steaming for 10 h, their contents then showed the decrease trend (Fig. 6C). It is noted that our conclusions on the ginsenosides variation reflected by MSI refer to all isomers, rather than a single ginsenoside that can be separated and detected by LC-MS.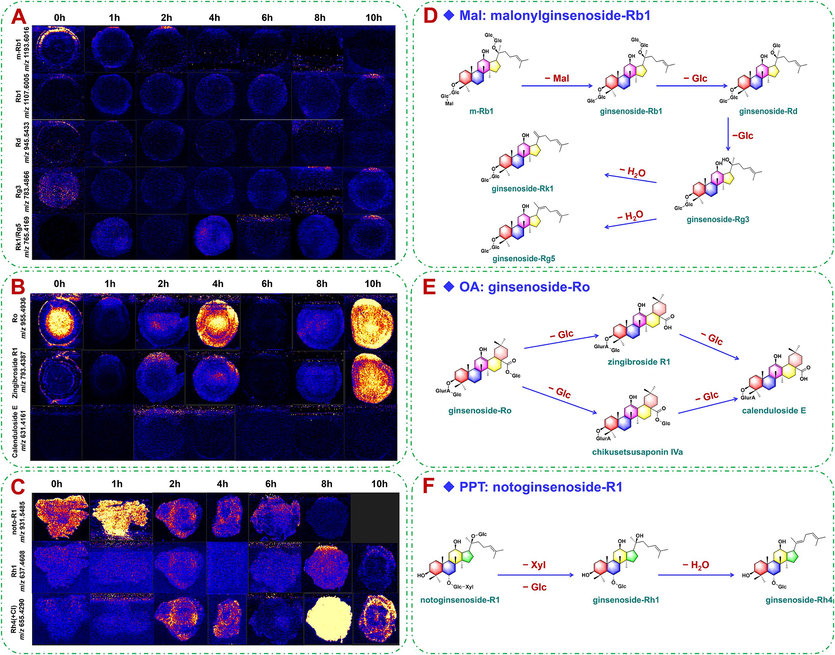
The spatiotemporal transformation networks of Mal, OA and PPT-type saponins and the corresponding MSI images of PG, PQ and PN at different steaming time. A-Imaging of malonylginsenoside Rb1 in PG with different steaming time; B-imaging of ginsenoside Ro in PQ with different steaming time; C-imaging of notoginsenoside R1 in PN with different steaming time (undetectable in the sample of steaming 10 h); D-spatiotemporal transformation network of malonylginsenoside Rb1 (malonylated) from PG; E-spatiotemporal transformation network of ginsenoside Ro (OA-type) from PQ; F-spatiotemporal transformation network of notoginsenoside R1 (PPT-type) from PN.
3.5 Holistic transformation network for ginsenosides occurring to the steaming of PG/PQ/PN
In the steaming process of PG, PQ, and PN, the contents of ginsenosides were affected by both the duration and temperature of steaming. Various patterns of degradation and transformation occurred, leading to the formation of rare ginsenosides (such as Rg3, Rh1, Rk1, Rg5, and Rk3; Fan et al., 2022; Xiong et al., 2019). These saponins have been demonstrated with significant therapeutic effects on the cardiovascular and cerebrovascular diseases, improving the immunity, anti-cancer (Choi et al., 2015), anti-asthmatic (Song et al., 2023), and anti-diabetic properties (Qu et al., 2023). According to the results of the difference analysis, the contents of Rb1 and Rd decreased significantly after the prolonged steaming, whereas the contents of the rare ginsenosides (such as Rg3) was increased. This phenomenon is speculated to be the transformation and formation of components, possibly due to the fact Rb1, Rd, and Rg3 have the same PPD-type parent nucleus. Their glycosidic bonds belong to the carboxyl-formaldehyde structures, which are sensitive to the conditions such as acid, alkali, or enzyme. Under high temperature, hydrolysis reactions occur. The acidic dammarane-type tetracyclic triterpenoid ginsenosides (PPD- and PPT-type) were prone to decarboxylation. Malonyl-substituted ginsenosides, such as m-Rb1, could lose their malonyl groups to generate the neutral PPD-type ginsenosides. The glucose group connected at the C-20 in Rb1 was hydrolyzed to obtain ginsenoside Rd, which was further hydrolyzed to ginsenoside Rg3. Continued dehydration of the sugar groups attached to Rg3 at the C-20 could generate ginsenosides Rg5 and Rk1 (Fig. 6D). The observed ginsenosides transformation in the steaming of PG was generally consistent with the findings reported in previous investigations, and ginsenosides Rg3, Rg5, and Rk1 were the anti-cancer ingredients in black ginseng (Huang et al., 2023b). Similarly, Rg1 (PPT-type) in PQ was hydrolyzed to generate Rh1, which was further dehydrated to generate Rh4/Rk3 (Fig. S9A). p-F11 and p-RT2 (OT-type) underwent the cleavage of the glucosyl moiety to obtain p-RT5 (Fig. S9B). Ginsenoside Ro (OA-type) was hydrolyzed to calenduloside E (Fig. 6E). For noto-R1 in PN, the glycosyl part was degraded by heating. The disaccharide group at the C-3 position was converted into a monosaccharide, and the glucose connected at C-20 could be lost. This resulted in the formation of ginsenoside Rh1, which was further dehydrated to generate Rh4 (Fig. 6F).
4 Conclusions
In this work, a variety of metabolomics characterization techniques (UHPLC/IM-QTOF-MS and DESI-MSI) were developed and applied to depict the chemical variation induced by the steaming for three reputable MEH plants from the same Panax genus (PG, PQ and PN). Separately 164/192/182 ginsenosides were characterized from the raw materials and steamed products of PG/PQ/PN. And 26/28/18 marker ginsenosides, mainly contributing to the chemical variation during the steaming, were unveiled for PG/PQ/PN, respectively. Moreover, ginsenosides were mainly distributed in the cork layer, phloem, and xylem of the root/rhizome parts. Potential transformation pathways for different sub-types of ginsenosides were depicted. By feat of untargeted metabolomics analysis and high-resolution MSI, holistic chemical variation and transformation network for PG/PQ/PN during the steaming were elaborated and visualized, which can thus bridge to the enhancement on the tonifying effects of ginseng due to steaming. These chemical markers reported in this work are definitely beneficial to discern between the raw and steamed products of ginseng, which thus promote the quality control, standardized production, and further development of ginseng products.
CRediT authorship contribution statement
Yadan Zou: Formal analysis, Writing – original draft. Mengxiang Ding: Formal analysis. Huimin Wang: Formal analysis, Investigation, Writing – original draft. Humin Xie: Investigation, Resources. Meiting Jiang: Investigation, Software. Yuying Zhao: Software. Xiaoyan Xu: Validation. Ying Hu: Investigation. Xiumei Gao: Funding acquisition, Supervision. Hongda Wang: Funding acquisition, Project administration, Writing – review & editing. Wenzhi Yang: Conceptualization, Funding acquisition, Methodology, Project administration, Writing – review & editing.
Acknowledgments
This work was supported by grants from the Science & Technology Program of Haihe Laboratory of Modern Chinese Medicine (22HHZYSS00012), National Natural Science Foundation of China (82374030), Tianjin Outstanding Youth Fund (23JCJQJC00030), Foundation of State Key Laboratory of Component-based Chinese Medicine (CBCM2023202), and Innovation Team and Talents Cultivation Program of National Administration of Traditional Chinese Medicine (ZYYCXTD-C-202009).
Declaration of competing interest
The authors declare that they have no known competing financial interests or personal relationships that could have appeared to influence the work reported in this paper.
References
- Large-scale human metabolomics studies: a strategy for data (pre-) processing and validation. Anal. Chem.. 2006;78:567-574.
- [CrossRef] [Google Scholar]
- Application of UPLC-triple TOF-MS/MS metabolomics strategy to reveal the dynamic changes of triterpenoid saponins during the decocting process of Asian ginseng and American ginseng. Food Chem.. 2023;424:136425
- [CrossRef] [Google Scholar]
- Improved anticancer effect of ginseng extract by microwave-assisted processing through the generation of ginsenosides Rg3, Rg5 and Rk1. J. Funct. Foods. 2015;14:613-622.
- [CrossRef] [Google Scholar]
- The different effects of Chinese Herb Solid Drink and lactulose on gut microbiota in rats with slow transit constipation induced by compound diphenoxylate. Food Res. Int.. 2021;143:110273
- [CrossRef] [Google Scholar]
- Mass spectrometry-based profiling and imaging strategy, a fit-for-purpose tool for unveiling the transformations of ginsenosides in Panax notoginseng during processing. Phytomedicine. 2022;103:154223
- [CrossRef] [Google Scholar]
- An integrated analytical approach based on enhanced fragment ions interrogation and modified Kendrick mass defect filter data mining for in-depth chemical profiling of glucosinolates by ultra-high-pressure liquid chromatography coupled with Orbitrap high resolution mass spectrometry. J. Chromatogr. A. 2021;1639:461903
- [CrossRef] [Google Scholar]
- Hypoglycemic effects of bioactive ingredients from medicine food homology and medicinal health food species used in China. Crit. Rev. Food Sci. Nutr.. 2020;60(14):2303-2326.
- [CrossRef] [Google Scholar]
- Quality assessment of commercial dried ginger (Zingiber officinale Roscoe) based on targeted and non-targeted chemical profiles and anti-inflammatory activity. Food Res. Int.. 2023;166:112589
- [CrossRef] [Google Scholar]
- Ginsenosides in Panax genus and their biosynthesis. Acta Pharm. Sin. B. 2021;11(7):1813-1834.
- [CrossRef] [Google Scholar]
- Unveiling the chemical components variation of Sishen formula induced by different prescription ratios by the advanced liquid chromatography/mass spectrometry approaches. Arab. J. Chem.. 2024;17:105512
- [CrossRef] [Google Scholar]
- Processing technologies, phytochemistry, bioactivities and applications of black ginseng-a novel manufactured ginseng product: A comprehensive review. Food Chem.. 2023;407:134714
- [CrossRef] [Google Scholar]
- Anti-prostate cancer components of black ginseng based on the “nine steaming and nine sun-drying” process. Process Biochem.. 2023;134:269-275.
- [CrossRef] [Google Scholar]
- Characterization of ginsenosides from Panax japonicus var. major (Zhu-Zi-Shen) based on ultra-high performance liquid chromatography/quadrupole time-of-flight mass spectrometry and desorption electrospray ionization-mass spectrometry imaging. Chinese Med.. 2023;18:115.
- [CrossRef] [Google Scholar]
- Preparation of ginsenosides Rg3, Rk1, and Rg5-selectively enriched ginsengs by a simple steaming process. Eur. Food Res. Technol.. 2014;240:251-256.
- [CrossRef] [Google Scholar]
- Identification of anti-inflammatory components in Panax ginseng of Sijunzi Decoction based on spectrum-effect relationship. Chin. Herb. Med.. 2023;15(1):123-131.
- [CrossRef] [Google Scholar]
- Advances and challenges in ginseng research from 2011 to 2020: the phytochemistry, quality control, metabolism, and biosynthesis. Nat. Prod. Rep.. 2022;39:875-909.
- [CrossRef] [Google Scholar]
- Enhanced conversion and extraction of ginsenoside Rg1 from Panax notoginseng using β-xylosidase mutants and an endoxylanase. Ind. Crops Prod.. 2022;187:115514
- [CrossRef] [Google Scholar]
- Integration of multicomponent characterization, untargeted metabolomics and mass spectrometry imaging to unveil the holistic chemical transformations and key markers associated with wine steaming of Ligustri Lucidi Fructus. J. Chromatogr. A. 2020;1624:461228
- [CrossRef] [Google Scholar]
- Ultra-high performance liquid chromatography/ion mobility time-of-flight mass spectrometry-based untargeted metabolomics combined with quantitative assay unveiled the metabolic difference among the root, leaf, and flower bud of Panax notoginseng. Arab. J. Chem.. 2021;14:103409
- [CrossRef] [Google Scholar]
- Total ginsenoside wild ginseng root improves spleen qi deficiency by regulating intestinal microbes and flora metabolites. Arab. J. Chem.. 2023;16:105232
- [CrossRef] [Google Scholar]
- Chemical insights into ginseng as a resource for natural antioxidants. Chem. Rev.. 2012;112:3329-3355.
- [CrossRef] [Google Scholar]
- Multi-level fingerprinting and cardiomyocyte protection evaluation for comparing polysaccharides from six Panax herbal medicines. Carbohydr. Polym.. 2022;277:118867
- [CrossRef] [Google Scholar]
- Spatial metabolomics method to reveal differential metabolomes in microregions of Panax quinquefolius roots by using ultra-performance liquid chromatography quadrupole/time of flight-mass spectrometry and desorption electrospray ionization mass spectrometry imaging. Food Chem.. 2024;435:137504
- [CrossRef] [Google Scholar]
- Desorption electrospray ionization mass spectrometry: 20 years. Acc. Chem. Res.. 2023;56(18):2526-2536.
- [CrossRef] [Google Scholar]
- Ion mobility-derived collision cross section as an additional measure for lipid fingerprinting and identification. Anal. Chem.. 2015;87(2):1137-1144.
- [CrossRef] [Google Scholar]
- Efficacy and safety evaluation of black ginseng (Panax ginseng C.A. Mey.) extract (CJ EnerG): broad spectrum cytotoxic activity in human cancer cell lines and 28-day repeated oral toxicity study in Sprague-Dawley rats. BMC Complementary Med. Ther.. 2022;22:1-13.
- [CrossRef] [Google Scholar]
- Ginsenoside Rk3 is a novel PI3K/AKT-targeting therapeutics agent that regulates autophagy and apoptosis in hepatocellular carcinoma. J. Pharm. Anal.. 2023;13(5):463-482.
- [CrossRef] [Google Scholar]
- Mapping taste-relevant food peptidomes by means of sequential window acquisition of all theoretical fragment ion-mass spectrometry. J. Agric. Food Chem.. 2020;68(38):10287-10298.
- [CrossRef] [Google Scholar]
- Direct screening of malonylginsenosides from nine Ginseng extracts by an untargeted profiling strategy incorporating in-source collision-induced dissociation, mass tag, and neutral loss scan on a hybrid linear ion-trap/Orbitrap mass spectrometer coupled to ultra-high performance liquid chromatography. J. Chromatogr. A. 2018;1571:213-222.
- [CrossRef] [Google Scholar]
- Black ginseng extract exerts potentially anti-asthmatic activity by inhibiting the protein kinase cθ-mediated IL-4/STAT6 signaling pathway. Int. J. Mol. Sci.. 2023;24(15):11970.
- [CrossRef] [Google Scholar]
- UPLC-Q-TOF-MS/MS analysis for steaming times-dependent profiling of steamed Panax quinquefolius and its ginsenosides transformations induced by repetitious steaming. J. Ginseng Res.. 2012;36(3):277-290.
- [CrossRef] [Google Scholar]
- Immunomodulatory, anti-inflammatory, and anti-cancer properties of ginseng: a pharmacological update. Molecules. 2023;28(9):3863.
- [CrossRef] [Google Scholar]
- Comparative analysis of physicochemical properties, ginsenosides content and α-amylase inhibitory effects in white ginseng and red ginseng. Food Sci. Hum. Wellness. 2023;12(1):14-27.
- [CrossRef] [Google Scholar]
- Pseudotargeted metabolomics approach enabling the classification-induced ginsenoside characterization and differentiation of ginseng and its compound formulation products. J. Agric. Food Chem.. 2023;71(3):1735-1747.
- [CrossRef] [Google Scholar]
- A novel hybrid scan approach enabling the ion-mobility separation and the alternate data-dependent and data-independent acquisitions (HDDIDDA): its combination with off-line two-dimensional liquid chromatography for comprehensively characterizing the multicomponents from compound Danshen Dripping Pill. Anal. Chim. Acta. 2022;1193:339320
- [CrossRef] [Google Scholar]
- Machine learning prediction for constructing a universal multidimensional information library of Panax saponins (ginsenosides) Food Chem.. 2024;439:138106
- [CrossRef] [Google Scholar]
- Chemical and bioactive comparison of Panax notoginseng root and rhizome in raw and steamed forms. J. Ginseng Res.. 2019;43(3):385-393.
- [CrossRef] [Google Scholar]
- A novel neutral loss/product ion scan-incorporated integral approach for the untargeted characterization and comparison of the carboxyl-free ginsenosides from Panax ginseng, Panax quinquefolius, and Panax notoginseng. J. Pharm. Biomed. Anal.. 2020;117:112813
- [CrossRef] [Google Scholar]
- Multicomponent characterization of the flower bud of Panax notoginseng and its metabolites in rat plasma by ultra-high performance liquid chromatography/ion mobility quadrupole time-of-flight mass spectrometry. Molecules. 2022;27:9049.
- [CrossRef] [Google Scholar]
- Characteristic malonyl ginsenosides from the leaves of Panax notoginseng as potential quality markers for adulteration detection. J. Agric. Food Chem.. 2021;69(16):4849-4857.
- [CrossRef] [Google Scholar]
- Saponins of ginseng products: a review of their transformation in processing. Front. Pharmacol.. 2023;14:1177819.
- [CrossRef] [Google Scholar]
- Untargeted metabolomics analysis revealed the difference of component and geographical indication markers of Panax notoginseng in different production areas. Foods. 2023;12(12):2377.
- [CrossRef] [Google Scholar]
- Rapid discrimination and prediction of ginsengs from three origins based on UHPLC-Q-TOF-MS combined with SVM. Molecules. 2022;27(13):4225.
- [CrossRef] [Google Scholar]
- American ginseng with different processing methods ameliorate immunosuppression induced by cyclophosphamide in mice via the MAPK signaling pathways. Front. Immunol.. 2023;14:1085456.
- [CrossRef] [Google Scholar]
- Highly selective monitoring of in-source fragmentation sapogenin product ions in positive mode enabling group-target ginsenosides profiling and simultaneous identification of seven Panax herbal medicines. J. Chromatogr. A. 2020;1618:460850
- [CrossRef] [Google Scholar]
- Prevention properties on cerebral ischemia reperfusion of medicine food homologous Dioscorea yam-derived diosgenin based on mediation of potential targets. Food Chem.. 2021;345:128672
- [CrossRef] [Google Scholar]
- Spatial distribution and characterization of the small-molecule metabolites and in situ hydrolyzed oligosaccharides in the rhizome of Glycyrrhiza uralensis by desorption electrospray ionization-mass spectrometry imaging and high-resolution liquid chromatography−mass spectrometry. J. Agric. Food Chem.. 2023;71:20372-20385.
- [CrossRef] [Google Scholar]
- Ginsenoside modified lipid-coated perfluorocarbon nanodroplets: a novel approach to reduce complement protein adsorption and prolong in vivo circulation. Acta Pharm. Sin. B. 2024;14(4):1845-1863.
- [CrossRef] [Google Scholar]
- Anti-fatigue effect from Ginseng Radix et Rhizoma: a suggestive and promising treatment for long COVID. Acupunct. Herb. Med.. 2022;2(2):69-77.
- [CrossRef] [Google Scholar]
Appendix A
Supplementary data
Supplementary data to this article can be found online at https://doi.org/10.1016/j.arabjc.2024.105781.
Appendix A
Supplementary data
The following are the Supplementary data to this article:Supplementary data 1
Supplementary data 1


