

Translate this page into:
Intensifying the performance of polymer suspensions to evaluate drag reduction using rotating disc apparatus
⁎Corresponding author. ashrafi@iust.ac.ir (Seyed Nezameddin Ashrafizadeh)
-
Received: ,
Accepted: ,
This article was originally published by Elsevier and was migrated to Scientific Scholar after the change of Publisher.
Abstract
A rotating disc in a close chamber was fabricated to evaluate the drag reduction (DR) performance of different polymer suspensions which estimates it with evaluating tension of crude oil on the disk before and after adding suspensions. The main issue is the link between the rheological and functional behaviors of polymers in crude oil. Polyisobutylene (PIB), styrene butadiene rubber (SBR), and polystyrene (PS) were used as polymers, and their performances were compared with a commercial drag reducer agent. The viscoelastic behavior of polymers and their viscosity in crude oil were found to significantly alter the drag reduction efficiency. Although having been increasingly studied the more the elasticity of the agent, the greater the drag reduction efficiency, it was concluded that the drag force does not change monotonically with the increase in the concentration of polymers (or induction of higher turbulence), and one should use an optimum concentration of polymers to gain the maximum drag reduction. Furthermore, increasing the temperature was found an easy way to slightly promote the drag reduction efficiency. In addition, it will be possible to predict the optimal concentration and temperature with rheological studies before conducting operational tests. The results of rheological evaluations clearly show the entanglement and relaxation behavior depends on the polymer concentration. Also the operational tests show, although, due to its short-chain molecules and high viscosity, the drag reduction by means of PS contained DR was less than 10 %, the sample containing 15.0 ppm of PIB and SBR could cause up to ∼ 40 % drag reduction at 40 °C and Re = 300,000 (considered as the beginning of the turbulent flow in rotating disk apparatus (RDA)). This record is comparable to that of the commercial sample.
Keywords
Drag reducing agents
Crude oil
Taylor-Couette
Rheology
Polymer suspension

1 Introduction
One of the technologies of interest in recent years is the technology of reducing the required energy for the transport of crude oil and its products. The energy supply and energy production are among the main concerns of human beings. On the other hand, limited resources have always led researchers to find optimal solutions for minimizing energy consumption (Birleanu et al., 2022). Estimation of the dissipation rate of turbulent kinetic energy would be a way to overcome high energy consumption (Wang et al., 2021). Also the other way to reduce the energy of transportation of liquids was the change in pipe diameter (Zhang et al., 2021) or emulsification of heavy crude oil in water (Ashrafizadeh and Kamran, 2010, Ashrafizadeh et al., 2012). Meanwhile, using additive to reduce the friction (drag) flow in crude oil pipelines, was found as a remedy for reducing the energy consumed by pumps. Taking advantage of polymers for drag reduction in pipelines was suggested by Tom studying the drag reduction of polymethyl methacrylate polymers inside mono chlorobenzene, about 100 years ago (Dos Santos et al., 2020).
Lumley (Lumley, 1969), studying the mechanism responsible for such a phenomenon, mentioned that the stretch of polymers, especially near the pipe wall, could raise the extensional viscosity of the turbulent flow and, as a result, dispel small vortices. While, Tabor and De-Genne (Tabor and De Gennes, 1986) reported that coiling and stretching properties of viscoelastic polymers could damp the kinematic energy of eddies and convert it to elastic energy. Despite several other proposed hypothesis, these two mechanisms have generally been used in most researches so far (Benzi, 2010, Pereira et al., 2017, Pereira et al., 2017, Pereira et al., 2017). According to the well-experienced hypotheses, the selected polymer should be highly elastic and have long chains. As a result, drag-reducing polymers often are highly flexible and have long-chain heavy molecules (Han et al., 2017). For instance, high molecular weight polyacrylamide, polyethylene oxide, and polyisobutylene are some of the most well-known drag-reducing agents in the industry (Hou et al., 2008). One of the effective aspects in lowering drag is said to be polymer degradation (Zhang et al., 2020, Zhang et al., 2021). In some cases modified associating polymers have been introduced as effective drag reducers with the ability to reform after degradation (Muratspahić et al., 2022).
In some researches, drag reduction has been studied in laboratory scale pipelines and theoretical model (Karami et al., 2018, Soares et al., 2020, Ayegba et al., 2021; Niazi et al., 2024). Nevertheless, since experimental study with long pipelines is very time-consuming and challenging, rotational apparatuses simulating the turbulent flow were used as an alternative (Nesyn et al., 2018). The dissipation of viscous energy can be easily calculated by simply measuring the torque on the disc in the rotational apparatus. This kind of geometry also acts as a model for hydrodynamic stability studies (Dutcher and Muller, 2009). Taylor-Couette system is a kind of rotational apparatus that makes an unstable flow either in a fluid between two co-axial cylinder (Lee et al., 2010, Rashed et al., 2016). Besides, rotating disk apparatus (RDA) examined as a model for drag reduction experiments. Using Taylor-Couette or RDA systems and establishing turbulent flows, one can investigate not only the relation between the geometry and the drag reduction, but also the effect of polymer additives on flow stability (Groisman and Steinberg, 1996). Numerous studies approved that the Taylor-Couette flow system is a convenient and cost-effective replacement for pipeline flow (Eskin, 2014, Bhambri, 2016, Dos Santos et al., 2020). Using such a system, Dai et al. (Dai et al., 2018) examined the impact of concentration of polymer, temperature, rotating speed of the disk, and duration of applying torque on the drag reduction ability of poly alpha olefins. Their results indicated the more the concentration of the polymer, the steeper the drag drop. It was also explained that the drag reducing characteristic of the polymers increases with the elongation of their molecules at higher temperature and increasing the rotating speed. In this case, elongation of polymers means opening of molecular coils.
Turbulent flow in pipelines is usually simulated by the instabilities in the Taylor-Couette or RDA systems. The starting zone of instabilities in Taylor-Couette and RDA flows has been investigated in a number of studies (Song et al., 2019, Cagney et al., 2020, Dos Santos et al., 2020). At elevated Reynolds numbers where vortices rise in the gap between the reservoir and the disc, instabilities start to occur. Any further increase in Reynolds number results in occurrence of additional frequencies, more complex unsteady flows, and entirely turbulent flows (Cagney et al., 2020).
To analyze the drag reduction efficiency of polymers, one should know their behavior when they are added to the crude oil. Accordingly, it is of vital importance to study the polymer structures and their rheological behavior (Hashlamoun et al., 2023). Elastic modulus , which is fundamentally Young’s modulus, represents the capability of the stored elastic deformation energy of polymer, while the viscous modulus represents the loss of energy during polymer deformation. Qing et al. (Qing et al., 2019) demonstrated that one can drastically lessen both the elastic and the viscous modulus over the entire range of frequencies by adding drag-reducing agents to crude oil. The decrease in the latter, leads to a fall in the resistance against the flow. This observation stems from the collapse of the colloidal asphalting network structures accumulated in the crude oil. Taborda et al. (Taborda et al., 2017) explain that the linear viscoelastic region can change in the presence of nanoparticles. In other words, nanoparticles may alter the internal structure of the solid-like crude oil, and convert it to a liquid-like material.
It should be also stated that in turbulent flows, the interaction between hydrodynamic forces and polymer chains may degrade the polymers; a phenomenon that may affect the drag reduction efficiency. Mechanical degradation of the polymers occurs when the polymer cannot withstand the hydrodynamic force exerted by the flow. This phenomenon has been considered as the most important reason for the decreased efficiency of polymer drag reducers. The slipping characteristic, preventing the polymers from getting completely stretched, preserves them against strong shears. As a result, shear intensity is of secondary importance in the mechanical decomposition of polymers (Odell et al., 1990). However, if a polymer chain is stressed before it is subjected to a shear flow, it will reach a fully stretched state more quickly, in which case the shear can lead to mechanical degradation (Hsieh et al., 2005). The drop in the efficiency of drag reduction process, due to polymers degradation, is reflected in the decrease of the viscosity (Dos Santos et al., 2020, Soares, 2020). The needed force for breaking the polymer chains, is different for different polymers. Furthermore, viscosity deviations indicate the elongation of polymer chains (Nghe et al., 2010). Paterson and Abernathy (Paterson and Abernathy, 1970) examined the effects of viscosity, molecular weight, and temperature on polymer degradation. They investigated intrinsic viscosity, which is directly related to molecular weight for PEO solutions. Although they were not the first, they did a complete study. Recently, Santos et al. (Dos Santos et al., 2020) studied the alteration of viscosity and drag efficiency in both the Taylor-Couette flow system as well as a pipeline. They observed that, in rotational systems, polymers don’t suffer from biodegradation which is very common in pipelines. They reported that, although conducting experiment in the rotational system is much easier, some shortcomings, such as the small Reynolds number of the flow, call its results into question.
In the present work, we examine the impact of high molecular weight polyisobutylene, styrene-butadiene rubber, and structurally different polystyrene, on the drag reduction of crude oil flow, and for the first time, analyze the variations in the rheological properties of crude oil containing different concentrations of polymers. In this study, very low concentrations of each sample were made compared to the commercial sample, and the optimal concentration was found according to the actual operating conditions. At the end, its comparison with the commercial sample proved the positive performance of these manufactured samples. Meanwhile, in contrast to other studies in this field, we have innovatively, employed a real crude oil rather than the synthetic ones, which makes our results more realistic and trustworthy. Moreover, most of the current studies were conducted with operational conditions, and their analytics were explained using operating parameters. Meanwhile, all the experiments are conducted in a torque meter equipped with a rotating disk apparatus and beyond its critical Reynolds number. In fact, the viscoelastic behavior of two different types of flexible and inflexible polymers added to typical crude oil and the effect of polymer concentration on the viscoelastic behaviors and its relation with drag reduction was investigated. We discuss how to find the optimum concentration and type of polymers to reduce drag in the crude oil by conducting a few routine rheological tests (include of instabilities, viscosity and Young’s modulus) prior to performing the real operating runs.
2 Materials and methods
2.1 Materials
The aqueous suspensions of three different polymers were used as drag reducer agents. The detailed procedure of fabrication of polymer suspensions, which were prepared through the so-called emulsification method, is provided and discussed elsewhere (Dastbaz and Ashrafizadeh, 2020, Dastbaz et al., 2021). Polyisobutylene (PIB), polystyrene (PS), and styrene butadiene rubber (SBR) having different structures were used as drag reducers. Polyisobutylene was purchased from Aldrich (USA), and the other two were industrial grade polymers. An unknown commercial DRA from the Iranian market was also used for comparison purposes. The molecular structures of used polymers are shown in Fig. 1, and some of their characteristics are provided in Table 1.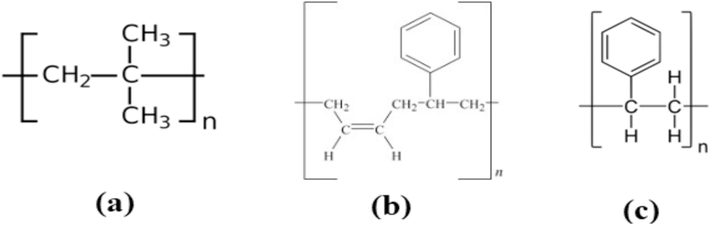
Molecular structure of a) PIB, b) SBR, and c) PS.
Sample Code
Polymer
Polymer Molecular Weight (Da)
Age of suspensions
Specific viscosity in oil @40 °C & 12.5 ppm
Color
Storage Temp
No Shaking
Shaking every week
PIB
Poly isobutylene
2,000,000
Less than 1 month
More than 6 month
0.05
Bright white
Ambient
SBR
Styrene Butadiene Rubber
300,000
Less than 1 month
More than 6 month
0.14
Blurry yellow
Ambient
PS
Polystyrene
400,000
About 10 days
More than 6 month
0.18
Bright white
Ambient
COM
Commercial
−-
−-
−-
−-
Blurry white
Ambient
Also, the composition of manufactured suspensions is given in Table 2. The authors' earlier paper give the rationale behind the values' selection (Dastbaz and Ashrafizadeh, 2020).
Polymer (g)
Anionic surfactant (g)
Co-surfactant ratio (%)
2.00
0.45
0.66
The crude oil as the main fluid was obtained from the Tehran refinery and was used as received. The characteristics of the crude oil are provided in Table 3.
Characteristic
Amount
Standard Method
Unit
Specific Gravity @ 15 °C,API
0.865, 32.083
D-4052
−
Water Content
0.08
D-4006
vol%
Salt Content
28
D-3230
ppm
Kinematic Viscosity @ 20 °C, @ 40 °C
12.5, 6.6
D-445
cSt
Saturated
60
D-1319
vol%
Aromatic
10
D-1319
vol%
Resin
8.4
D-1319
wt%
Asphaltene
0.1
IP-143
mgKOH/g
2.2 Torque meter equipped with rotating disc apparatus
A torque meter equipped with a rotating disk apparatus (which is schematically shown in Fig. 2.) was designed and fabricated to examine the amount of drag reduction in crude oil samples containing various contents of polymer DRAs.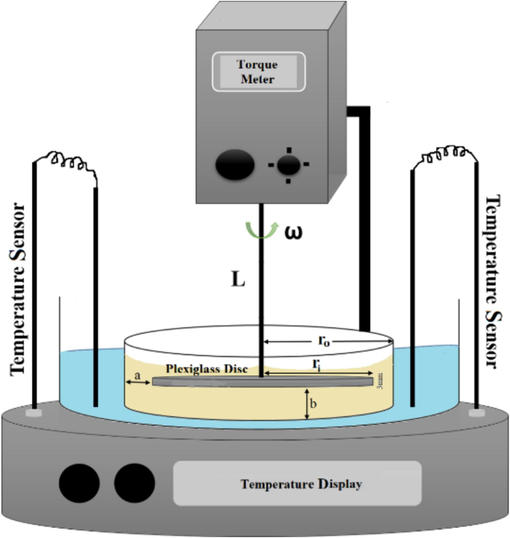
Schematic of torque meter equiped with rotating disc.
The supplied torque meter was a commercial one, known as Heidolph RZR 2102, and manufactured by Heidolph Instruments GmbH & Co. Schwabach, Germany. The rotating disc, which was made of plexiglass, was submerged in the fluid. A rotor rotated the disc at a given angular velocity. Given that the critical Reynolds number is reported to be 300,000 for Taylor-Couette geometry (Lee et al., 2010, Rashed et al., 2016), the initial calculation for the radius of the disc in order to bring a turbulent state to the fluid was determined to be 12 cm. In other words, the calculations for the disk radius were performed according to the critical Reynolds number. The temperature of the oil was controlled by supplying a jacket surrounding the apparatus and circulating water in it. The small differences in the temperatures measured before and after the process (which were less than 1 °C) proved the applicability of the supplied jacket.
The distance between the edge of the disk and the reservoir was fixed at . To prevent the occurrence of end effects in the regions between disc tip and wall of the reservoir, the height of the liquid was fixed at (Ge et al., 2007). At last, the height of the rotor and the volume of the liquid were decided to be , and about 1000 , respectively.
The Reynolds number was calculated using Eq. (1), in which
is the radius of the disc (12 cm),
is the angular velocity,
is the fluid density, and
is the fluid viscosity.
Measuring the torque of the pure crude oil (M) as well as that of the contaminated one (
), and benefiting from Eq. (2); one can calculate the drag (Kim et al., 2000):
Finally, the effects of temperature, type of polymer, speed of disc rotation, and polymers concentration, were investigated on drag reduction.
2.3 The rheological measurements
The instabilities of a fluid flow in the rotating disc system, somehow mimics the turbulency of its flow in pipelines. To investigate the instabilities, the shear stress and the shear rate were calculated using Eqs. (3) and (4) (Pereira and Soares, 2012). Discussions on instability measurement results are provided in section 3.1.
To investigate the rheological behavior of the fluid, we used the Anton Paar rheometer, MCR 301, Austria. The rheometer was a dynamic shear Anton Paar with the strain of 0.1 %, in the range of 0.01–100 s−1. Both moduli of (Storage modulus) and (Loss modulus) of mixtures of crude oil and suspensions at two different polymer concentrations were calculated. When , it was concluded that the fluid has elastic behavior and when the fluid was categorized as a viscous one (Xu et al., 2015, Martínez-Arias and Peixinho, 2017). It must be noted that, the storage modulus, , describes the ability of the material to store energy and exhibits the elastic behavior of solids; while the loss modulus, , characterizes the ability of a material to dissipate energy during its flow and represents the typical viscous behavior of liquids.
In addition, we monitored the viscosity changes in order to investigate the intensity of polymer degradation. As it was mentioned before, the more the viscosity drop, the more the intensity of polymer degradation. In this regard, the viscosity was measured before and after applying the torque, by a Cannon-Fenske capillary viscometer, standardized according to ASTM D445, USA. The viscometer had a radius of
and a volume of
. The specific viscosity,
, was then determined by Eq. (5):
The phase angle is considered as a rheological function and is calculated from Eq. (6).
3 Results and discussion
3.1 Rheological measurements
As it was discussed, instabilities in the rotating disc system mimic the turbulence in pipelines. Therefore, the rotating disc can be a convenient and cost-effective mean for simulating the turbulent flow in pipelines. To identify the instabilities, the viscosity of the fluid was obtained in terms of angular velocity. A mixture of either 12.5 or 15 ppm of PIB and the crude oil was poured into the apparatus reservoir at the fixed temperature of 40 °C. The shear stress, , and shear rate, , at the applied torque were calculated using Eqs. (3) and (4) (Pereira and Soares, 2012). The flow instabilities were then calculated through , which represents the viscosity of the fluid, at various velocities.
Fig. 3 illustrates the value of
for both crude oil and mixtures of either 12.5 or 15 ppm of PIB within the crude oil as a function of angular velocity. It is shown that increasing the rotational velocity to values up to 1000 rpm, leads to an increase in the viscosity of the PIB-containing crude oil. However, any further increase in such velocity, intensively decreases
of the fluid. Meanwhile, irrespective to the angular velocity,
of the more concentrated PIB-containing crude oil is a bit higher. On the other hand, beyond 1250–1300 rpm,
of the both PIB-containing samples become lower than that of the crude oil. The primary increase in
value can be attributed to the emergence of instabilities, or turbulent flow. It should be noted that the polymer does not have drag reduction effect as long as the viscosity of polymer-containing crude oils is much more than the crude oil (Dos Santos et al., 2020). As such, it is presumed that the fully-developed turbulent flow occurs beyond the angular velocities of almost 1300 rpm in which a declining trend in
is visible. The angular velocity can be converted to an equivalent Reynolds number which can be calculated through Eq. (1). The kinematic viscosities (μ/ρ) needed for working out the equivalent Reynolds number at 40 °C, are reported in Table 1. The Reynolds number is equal to 300,000 at the critical angular velocity at which instabilities occur.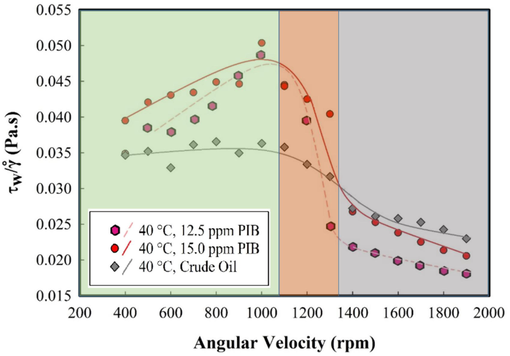
The ratio of wall shear stress to shear rate versus angular velocity for crude oil in the absence and presence of PIB.
A series of frequency and amplitude sweep tests were conducted in order to investigate the DRAs behaviors in the crude oil. Fig. 4 depicts the variation of storage modulus
, loss modulus (
), and the phase angle (
) Eq. (6), with increasing the frequency for the crude oil samples containing either 12.5 or 15 ppm of the polymers. It must be noted that the phase angle is a relative measure of the viscous and elastic characteristics of a material. When
is equal to 0°, the material behaves like a Hookean solid material; when
equals to 90°, the material is considered as a Newtonian fluid. When the phase angle is equal to 45°, the material's elastic contribution is comparable to its viscous contribution (Taborda et al., 2017).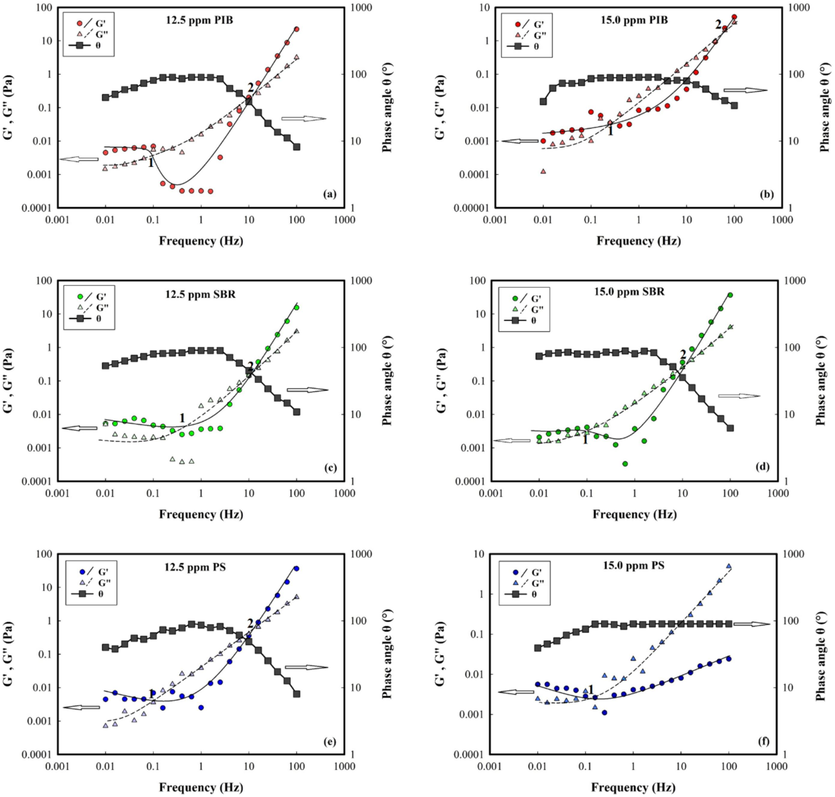
Storage modulus, loss modulus, and phase angle versus frequency at 25 °C for polymer-containing crude oil samples a) 12.5 ppm PIB, b) 15.0 ppm PIB, c) 12.5 ppm SBR, d) 15.0 ppm SBR, e) 12.5 ppm PS, and f) 15 ppm PS.
Although all samples reported in Fig. 4 have a same solvent, the behavior of the six measured moduli was found very different. Depending on the concentration of polymers in the sample, the DRAs exhibited different rheological behaviors. An overview to Fig. 4 shows a constant modulus at frequencies less than 0.1 Hz for PIB and SBR samples. In addition, in the diagrams in Fig. 4, the area between two crossovers represents the frequency of the transition area. Thus, the rubbery plateau region appears before the first crossover (It is shown with 1 in Fig. 4), and the glassy region appears after the second crossover (It is shown with 2 in Fig. 4) (Chile et al., 2018). Comparing Fig. 4(a) and 4(b) illustrate that, some differences arise in the viscoelastic behavior of PIB by increasing concentration. Fig. 4(b) shows that the sample containing 15.0 ppm of PIB has a larger rubbery region than the glassy region, suggesting greater intermolecular entanglements. As this sample shows, relaxation occurs faster because there is a small area of the glassy zone. A comparison between the two crude oil samples containing PIB with different concentrations shows that the entanglement and relaxation behavior depends on the PIB concentration. Consequently, viscoelastic behavior is influenced by PIB concentration. In addition, the same is also correct for PS-containing samples, i.e. viscoelastic behavior depends on the PS concentration. As can be seen in Fig. 4e and 4f, increasing the concentration of PS leads to more viscose behavior. On the other hand, in SBR-containing samples, the rubbery and glassy regions are at the same frequencies, which indicates that viscoelastic behavior is independent of the polymer concentration. In this article, we intend to explain the effect of the viscoelastic behavior of polymers with different structures on drag reduction.
The relatively constant moduli of the crude oil, containing PIB and SBR, at frequencies lower than 0.1 Hz (Their independence from frequency), reveals its linear gel-like elastic behavior (Qiao et al., 2016). In contrast, no gel-like structure is formed at frequencies higher than 0.1 Hz, because in such a range, experiences some changes (Grein-Iankovski et al., 2016).
In the field of rheology, large amplitude oscillatory shear (LAOS) behavior appears to be highly dependent on the interactions or microstructure-induced formation of microstructures. In the classification of complex fluids based on Hyun et al. (Hyun et al., 2011), frequency sweep tests shown in Fig. 4, are classified as strain hardening (G' and G'' increasing). The formation of complex microstructures and nonlinear elastic network elements is thought to be associated with strain hardening or strain stiffening. There is increasing evidence that strain hardening is linked to developing complex microstructures and nonlinear elastic networks. It is predicted that entanglement among long linear PIB and SBR polymers deal with strain hardening. Moreover, more distance between G' and G“ at higher strain rates means strengthen entanglement of associated polymer molecules. As a result, it increases the energy involved in breaking up and forming the cross-linked network structure. A polymer's resistance to strain force varies with its chain length, concentration, and relaxation time. It is expected that increasing the concentration leads to increasing entanglement, however, the viscoelastic behavior of PIB at 15.0 ppm (Fig. 4(b)) showed that increasing the concentration leads to faster relaxation which could balance the stiffness of the entangled chains formed and the dissipation of energy, till the polymers return to their original state. In fact, this situation is the best situation expected from a drag reducer. As the polymer is entangled, it becomes more robust, and the faster its relaxation time, the more energy is wasted.
Besides, varying PS concentration led to significant changes in its viscoelastic behavior. The behavior of polystyrene solution at 12.5 ppm was the same as other linear polymers, however, a gel-like structure did not appear at low frequencies. It seems to be due to the formation of a network of styrene aromatic molecules that can increase resistance. Increasing the concentration leads to a big change in viscoelastic behavior. These findings are attributed to large aggregates at higher concentrations. This kind of viscoelastic behavior for the PS sample was described before (Lepcio et al., 2016).
For the sample containing 12.5 ppm of PIB (Fig. 4(a)), the storage modulus is smaller than the loss modulus at frequencies lower than 10 Hz, which means that the viscous behavior is dominant. The opposite is true at frequencies above 10 Hz, wherein an elastic behavior would be dominant. Although the sample containing 15 ppm of PIB (Fig. 4(b)) shows viscose behavior in the intermediate frequencies, the behavior of solution became viscoelastic at over frequencies.
According to Fig. 4(c, d) one can say that both SBR contaminated samples have a viscous property at frequencies lower than 10 Hz and exhibit an elastic behavior beyond 10 Hz.
Fig. 4(e, f) illustrate the viscoelastic solid-like behavior for the PS-containing samples at frequencies less than 0.1 Hz. However, for the sample containing 12.5 ppm of PS, the viscous behavior predominates at frequencies lower than 10 Hz. On the other hand, a liquid-like behavior is observed for the sample containing 15 ppm of PS, at all frequencies (Qiao et al., 2016, Ranjbar and Hatzikiriakos, 2019).
The measured phase angles of crude oil samples are included in Fig. 4. As shown, for all samples, the angle reaches the constant value of 90° at intermediate frequencies. For the samples containing PIB and SBR, at the intermediate frequencies (1–10 Hz), the phase angle decreases from 90° to 10° and even below. However, for the sample containing 15 ppm of PS, the phase angle almost remains constant at 90°. Therefore, it can be said that crude oil samples containing PIB and SBR show more severe viscoelastic solid-like behaviors. Increasing concentrations caused a diminution of the viscoelastic behavior at high frequencies. Conversely, according to the literature, increasing the concentration does not suppress such behavior (Qiao et al., 2016). This observation can be explained by the fact that some fractal aggregates and transient structures might form through reconstruction under the shear (Behzadfar and Hatzikiriakos, 2013, Qing et al., 2019). In addition, what pushes rigid polystyrene polymers toward elastic behavior is, probably, the arrangement of the polymer chains due to their strong viscous behavior and weak aggregation at the optimal concentration of 12.5 (Sandkühler et al., 2004). In fact, for the sample containing 12.5 ppm of PS, the increase of
at higher frequencies can be attributed to the existence of an elastic network structure in the crude oil; however, an increase in the PS concentration can destroy these structures (Qing et al., 2019). Table 4 illustrated the results of polymer behaviors in crude oil related to phase angle.
Polymer concentration
Phase angle (°)
Frequency (Hz)
Result
12.5 PIB
92
<10
0.1–10
10–100
Elastic
Viscose
15.0 PIB
94
45
0.01–10
10–100
Elastic
Viscoelastic
12.5 SBR
93
10
0.1–10
10–100
Elastic
Viscose
15.0 SBR
92
<10
0.01–10
10–100
Elastic
Viscose
12.5 PS
94
<10
1
1–100
Elastic
Viscose
15.0 PS
96
96
0.1–100
0.1–100
Elastic
Elastic
Generally, in addition to the resistance created by the entanglement, the sample containing 15.0 ppm of PIB has a faster relaxation time, which contributes to energy dissipation. At the concentration of 12.5 ppm, although a entanglement is formed, relaxation time occurs normally. Thus the viscoelastic behavior of the 15.0 ppm sample is greater than that of 12.5 ppm. On the other hand, the change in concentration did not cause much difference in the viscoelastic behavior of SBR samples. However, the elastic modulus is slightly bolder due to the phase angle at a concentration of 15.0 ppm. Moreover, the PS sample at a concentration of 12.5 forms network structures that could be resistant to strain, and this has led to elastic behavior. However, with increasing the concentration up to 15.0 ppm, due to the destruction of network structures, the strain resistance is eliminated and the behavior of the material is completely out of viscoelastic state and tends to viscous behavior.
In the following, we will use this obtained data to investigate the effect of rheological behaviors on drag reduction.
Fig. 5 shows the specific viscosity of various crude oil samples versus concentration of the polymers at Re = 300,000. Specific viscosities were measured at the temperatures of 25 °C and 40 °C and Reynolds numbers of 300,000 and 350,000 before and after applying the torque. The viscosity of the samples was measured using a capillary viscometer with a radius of
and a volume of
, for 420 to 1020 s. The values of specific viscosity reported in Fig. 5 were calculated by Eq. (5). The “before” and “after” items in the legends of the figures are the crude oil samples before and 30 min after applying the torque, respectively.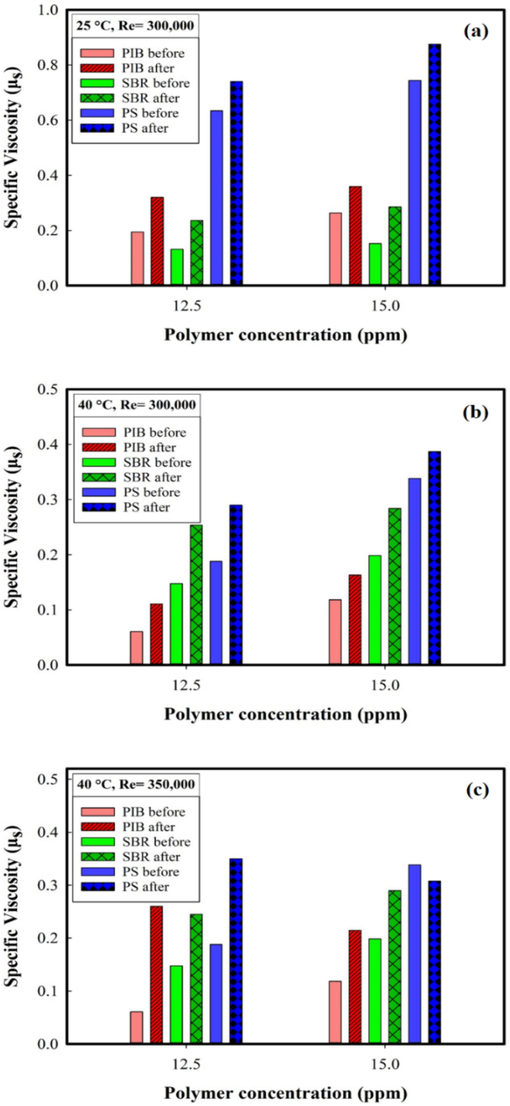
Specific viscosity for different crude oil samples before and after applying the torque a) at 25 °C and Re = 300,000, b) at 40 °C and Re = 300,000, and c) at 40 °C and Re = 350,000.
Fig. 5(a) and 5(b) show that the viscosity of all samples increases after applying the torque at 25 °C and 40 °C, respectively. A comparison between Fig. 5(a) and 5(b) reveals that, unlike SBR- and PIB-containing samples whose viscosities remain approximately the same with temperature change, the viscosity of PS-containing samples is lower at 40 °C.
The specific viscosities at a higher velocity (or at a higher Reynolds number) are reported in Fig. 5(c). Accordingly, unlike PS-containing solution having a lower viscosity than in Fig. 5(b), the viscosities of both PIB- and SBR-containing samples at 15 ppm rise with the fluid velocity.
The viscosity drop reflects the degradation of the inflexible polystyrene polymer chains due to exertion of stronger shear force (Dos Santos et al., 2020). It means increasing the shear velocity leads to a decrease in polystyrene viscosity, while the other polymers showed an increase in viscosity. Viscosity plays an important role in understanding polymer degradation during drag reduction. As the polymer molecules break down, the ability to change the viscosity of the liquid is reduced. This can lead to reduce drag reduction effectiveness. As polymer molecules degrade, the ability of the fluid to change viscosity and reduce drag is reduced, leading to a decrease in overall drag reduction effectiveness. This issue is described more completely in the following section.
Increase of viscosity for other polymers was the result of enhanced solubilization of polymers in the crude oil due to the turbulancy, and it is may be the only acceptable justification for such an increase in viscosity.
Besides, the slight increase in the viscosity of “after” samples containing 15 ppm of PIB or SBR, probably stems from the weakening of intermolecular interactions or elongation of polymer chains due to exertion of more intensive tensions and the consequent temperature increase (Qiao et al., 2016). The elastic structures in PIB and SBR were strong enough to prevent polymer chains to break down, however, they were affect from high tensions and experience an elongation which weaken the chains. Also, it is clear that increase in temperature may change the apparent viscosity at the molecular level (Qing et al., 2019). For making a comprehensive conclusion about the degradation of polymers, we focus on drag reduction and viscosity results simultaneously in the following section.
3.2 Drag reduction measurements
In order to measure the amount of drag reduction, the crude oil samples containing 15.0 ppm of either of DRAs were poured into the reservoir of the rotational disc apparatus. The disk was then rotated at the particular speed of 2000 rpm (Re = 300,000) at 25 °C. The exerted tension, which was proportional to the rotating speed, was displayed as a torque output and was recorded every 2 min. One of the important and fundamental factors in reducing drag is the molecular weight of polymers, which brings them to the highest level of drag reduction (Nesyn et al., 2018). In the present study, polyisobutylene with a molecular weight of 2,000,000 is expected to be the most effective among the three selected polymers. The effectiveness of polyisobutylene was then monitored by changes in concentration, velocity, and temperature.
The amount of drag reduction was finally calculated from Eq. (2). The drag reduction performance of the prepared DRAs within the crude oil was measured over 1 h. According to Fig. 6, the drag reduction percentage of all the samples sharply increased in the beginning of the experiments and then became tangential to a constant value. It is noteworthy that the maximum drag reduction for each polymer occurs after a particular period (about 30 min for all the polymers). Therefore, further drag reduction measurements were conducted after 30 min of mixing polymer suspensions with the crude oil. The impact of time on drag reduction was the subject of several studies (Pereira et al., 2013, Andrade et al., 2014, Andrade et al., 2016, Pereira et al., 2017), all of which reported drag reduction to be a complex function of time. The deformation and rearrangement of polymer chains, due to exertion of turbulency, takes time, so DRAs don’t show the maximum drag reduction capability immediately after shear exertion (Soares et al., 2019). As such, the deformation time of the polymers determine their needed time for showing maximum drag reduction. In addition, due to the coiling and expansion of polymer chains as well as de-aggregation of some probable small aggregated polymer lumps, the amount of drag reduction gradually increases until it reaches its maximum value after a very limited period of time.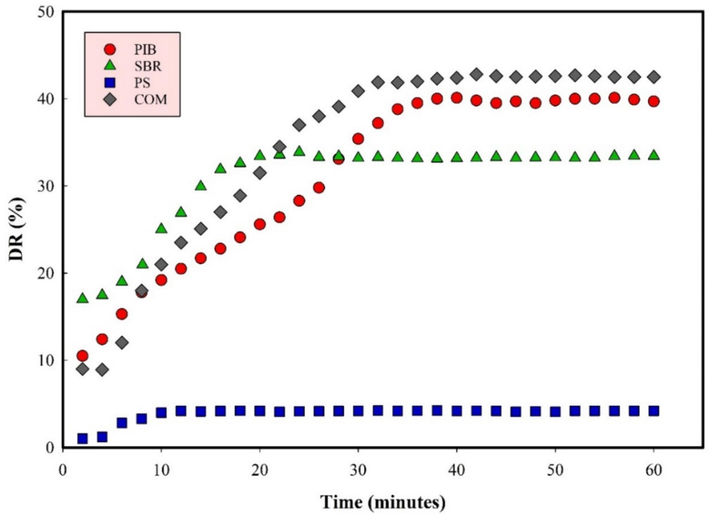
The drag reduction measured over 1 h for crude oil containing 15.0 ppm of each polymer at 25 °C and Re = 300,000.
The amount of drag reduction for crude oil samples containing 15.0 ppm of either of polymers was determined for a wide range of Reynolds numbers. Fig. 7 depicts drag reduction versus Reynolds number at two temperatures of 25 and 40 °C. As shown, up to the Reynolds number of almost 300,000, which is the critical Reynolds number in Taylor-Couette flows, there is almost no drag reduction for all samples. Nevertheless, the amount of drag reduction increases dramatically beyond Re = 300,000. The graphs in Fig. 7(b) illustrate that in some cases such as the case of PIB at 40 °C, increasing the Reynolds number leads to only a slight increase in drag reduction. In contrast, a drastic fall in drag reduction with the Reynolds number is observed for the PS. Generally, the amount of drag reduction slightly decreases, or stays constant, at Reynolds numbers above the critical value.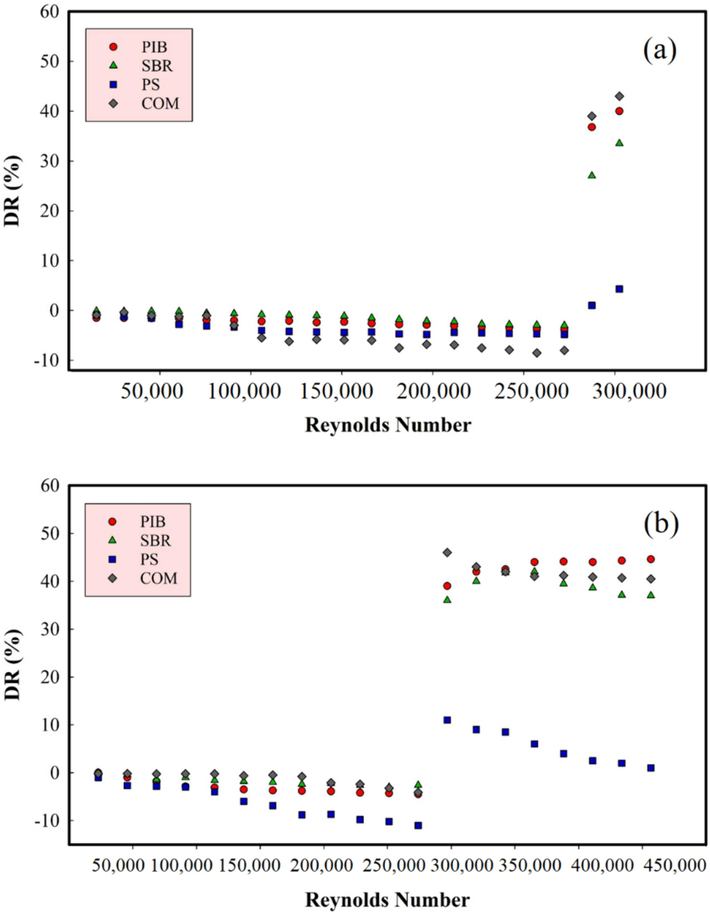
Drag reduction versus Reynolds number from laminar to fully turbulent flows for crude oil samples containing 15.0 ppm of each polymer at a) 25 °C and b) 40 °C.
Laminar flows at Reynolds numbers lower than almost 300,000 did not show any drag reduction, as expected. Beyond Reynolds number of 300,000, the elasticity or rigidity of polymer chains can be affected by the mode of turbulence. The intrinsic structure of polymers determines how the mode of turbulence may affect their performance (Pereira et al., 2013). Enhancement in the entanglements of polymer chains may occur at higher Reynolds numbers (Qing et al., 2019). The interaction of the entanglement chain of polymers and eddies may have different effects on the polymer performance. In addition, the weakening of intermolecular interactions among polymer chains of SBR and PIB at higher Reynolds numbers, which can be deduced from the decrease in viscosity (see Fig. 5(c)), probably leads to a decrease in drag reduction (Qiao et al., 2016).
Although the use of the Carreau-Yasuda Equation (Japper-Jaafar et al., 2009, Pereira et al., 2013) has been suggested as the most convenient procedure to determine the optimum concentration of polymer drag reducing agents, in this work, the optimum concentration of DRAs was determined by conducting drag reduction experiments in rotating disc system. A particular large volume of DRA suspensions containing 5 % (w/v) of either of polymers was prepared and then 0.05 to 0.5 of it, i.e. 2.5 to 25 of polymers, was added to 1000 of the crude oil. An amount of 1 L of polymer-containing crude oil was poured into the reservoir. The angular velocity and temperature were kept constant at 2000 rpm (Re = 300,000) and 25 °C, respectively. After 30 min, the amount of drag reduction was calculated through Eq. (2) and using the applied torque which was displayed as the output of the torque meter apparatus.
The drag reduction versus polymer concentration at 25 °C and Re = 300,000 is illustrated in Fig. 8. Accordingly, in all of studied concentrations, except at concentrations above 20 ppm wherein SBR DRA performs better, the PIB contaminated crude oil exhibits the highest level of drag reduction. Meanwhile, the maximum drag reduction of PIB and SBR samples occurs at concentrations between 12.5 and 15 ppm, respectively, and declines beyond that. However, a different trend is observed for the PS sample; a relatively mild increase in drag reduction is observed at low concentrations (up to 12.5 ppm), which is followed by negligible upward change.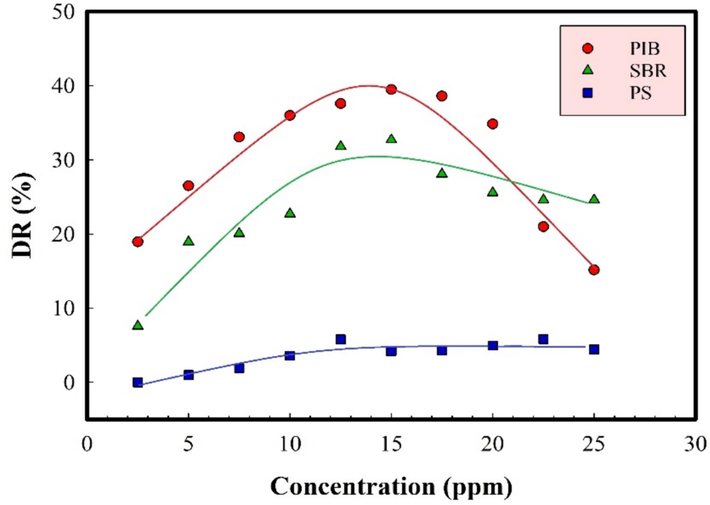
Drag reduction versus polymer concentration in the range of 2.5 to 25 ppm at 25 °C and Re = 300,000.
The higher DR% of PIB relative to other polymers stems from its intrinsic linear flexible molecular structure. However, the decrease in drag reduction beyond a particular concentration can be attributed to an increase in the entanglements of linear PIB and SBR polymer chains (Bhambri and Fleck, 2016). Abdulbari et al. investigated the drag reduction performance of polyisobutylene with increasing concentration. Their results also stated the optimal drag reduction concentrations, above which the drag reduction concentration decreases. They attributed this problem to the balance between the degree of turbulence, the type of flow medium and the properties of additives (type and concentration) (Abdulbari et al., 2018). While, Alsaeidi et al. reported an increase in drag reduction with increasing polymer concentration (Alsaedi et al., 2020).
Moreover, the aromatic molecules of styrene in the SBR structure undergo less entanglement at higher concentrations. Therefore, its DR% experiences a less pronounced reduction at higher concentrations. On the other hand, as expected, only a negligible reduction in the drag was observed for inflexible polystyrene polymers.
As such, two concentrations of 12.5 and 15 ppm were chosen as optimum concentrations for drag reduction experiments. By tracking the trend of drag reduction changes with concentrations of PIB and SBR, one may observe a slight increase in DR% from 12.5 ppm to 15.0 ppm at 25 °C and Re = 300,000. The obtained results are similar to those reported by Karami and Mowla (Karami and Mowla, 2012), claiming that different results are possible for different polymers at concentrations rather than the optimum one.
According to the rheological evaluations, the high drag reduction of PIB can be attributed to its elastic behavior within the crude oil, which was depicted in Fig. 4(a, b). The observations from Fig. 4(a, b) reveal that the elastic behavior is a dominant behavior for PIB which explains its better drag reduction performance. Also, the gel-like behavior of 15.0 ppm PIB at low frequencies and its better viscoelastic behavior illustrated in Fig. 4(b) explains the slight increase in its DR% at this concentration. Similarly, relatively high drag reduction for SBR can also be attributed to its elastic rheological behavior in the crude oil (Fig. 4(c, d)). According to these Figures, the elastic modulus was identified at 12.5 and 15.0 ppm of SBR, however, the viscoelastic solid-like region is to some extent prominent at 12.5 ppm. Materials with solid-like behavior can easily dampen the energy of eddies and promote the amount of drag reduction.
In addition, the low drag reduction performance of PS samples may be caused by the high viscosity of the PS samples in crude oil (Fig. 5(a)) and intrinsic properties of this polymer. High viscosities of the solution can increase the viscous friction; therefore damping the amount of drag reduction at such regions (Martini et al., 2018, Dos Santos et al., 2020). Moreover, the intrinsic fragile structure of the polymers cannot dampen eddies' energy, so less drag reduction would be expected. Similar results have been reported in a study comparing drag reduction behavior of polyethylene oxide with that of xanthan gum and diutan gum (Dos Santos et al., 2020).
The viscoelastic behavior of the materials illustrated in Fig. 4 and the drag reduction data provided in Fig. 8 show that the drag reduction at first depends on the intrinsic properties of the polymers, and then on their viscoelastic behaviors in the fluid. Although improving the rheological behaviors of a polymer such as PS, which is an inflexible polymer, can improve its drag reduction performance, the inherently inflexible structures of this polymer do not allow the development of these proceeds beyond a certain limit. However, flexible polymers showed that the drag reduction increased to an acceptable level by developing viscoelastic behaviors using concentration tuning. Therefore, it can be a good idea to investigate the optimum concentration of a polymer using its rheological behaviors before operational tests.
The amount of drag reduction for crude oil samples containing 15.0 ppm of either of polymers versus temperature at the constant Reynolds number of 300,000 is demonstrated in Fig. 9. As shown, increasing the temperature leads to a slight increase in the drag reduction of all samples; while such an increase is less pronounced for the higher temperatures towards 55 °C.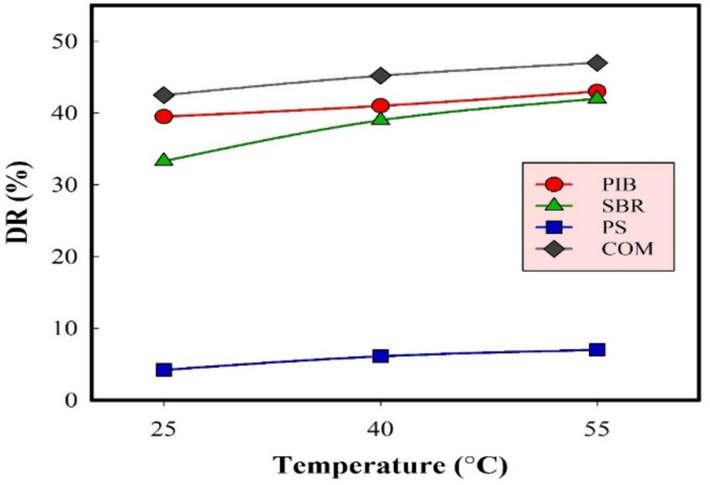
Drag reduction versus temperature for crude oil containing 15.0 ppm of each polymer at Re = 300,000.
At first, Turbulence, which is a key factor in drag reduction, can be influenced by temperature. As temperature increments, turbulence can ended up more strongly, driving to diminished drag. In any case, this impact can be complex and subordinate on the particular stream conditions (Lan et al., 2022). Also, the increase in drag reduction with temperature can be obviously explained by the fact that the viscosity fall due to the temperature rise, partially diminishes the torque. Therefore, the torque gradient between the pure and the polymer-containing crude oil samples increases (Kim et al., 2000). In addition, in some cases, increasing the temperature leads to an increase in the solubility of polymers and thus an increase in drag reduction (Karami and Mowla, 2012). Heat transfer between the liquid and the surface can moreover affect drag. As the temperature increments, Heat transfer can become more proficient, driving to diminished resistance. Usually, because of improving Heat transfer can decrease the warm boundary layer, permitting the liquid to stream more effortlessly (Soleimani and Eckels, 2021).
Although PIB has a regular increase in drag reduction versus temperature, SBR showed a greater amount of drag reduction in the first temperature step. It seems that the increase in turbulence at 55 °C and the elastic behavior of this material, which affects its relaxation, would be the cause of this change. The very slight increase in the drag reduction of the PS sample can be also attributed to its lower viscosities at higher temperatures (Fig. 5(b)). As such, higher temperatures (e.g. 40 °C in this study) can be beneficial for the drag reduction performance of rigid polymers like PS. Meanwhile, for the synthesized DRAs in this work, the ideal drag reduction parameters are found to be 15 ppm polymer concentration in crude oil, Reynolds number of 300,000, and temperature of 40 °C.
4 Conclusions
Three aqueous polymer suspensions fabricated by polyisobutylene, styrene-butadiene rubber, and polystyrene were used as drag reducing agents to lessen the drag of petroleum flow in the rotating disc system. The performance of three suspensions in drag reduction were investigated as a function of temperature, concentration, and Reynolds number and compared to a kind of commercial DRA. Drag reduction was a function of optimum concentration, but it had a direct relationship with velocity and temperature.
The rheological behavior of DRAs are linked to their drag reduction performance. Rheological behaviors were a function of suspension concentration and the more viscoelastic behavior showed the more drag reduction efficiency. In addition, to figure out the degradation of polymers during tension, a capillary viscometer was used. The pre-tensioned solution of polystyrene showed a decreased viscosity which resulted in polymer degradation and a decrease in drag reduction. Besides, the weakening of intermolecular forces as well as the entanglement of high molecular weight and/or long chain polymers at higher Reynolds numbers can slightly have a detrimental effect on the performance of DRAs.
The most comparable drag reduction to the commercial sample belonged to the polyisobutylene with the highest molecular weight, and the least drag reduction belonged to the polystyrene. The rigidity and short length of the polymer chains were found responsible for the lower performance of this polymer.
CRediT authorship contribution statement
Zahra Dastbaz: Conceptualization, Data curation, Formal analysis, Validation, Writing – original draft. Seyed Nezameddin Ashrafizadeh: Data curation, Funding acquisition, Supervision, Writing – review & editing.
Acknowledgements
This work was supported by Iran National Science Foundation (INSF) (grant number 97018159).
Declaration of competing interest
The authors declare that they have no known competing financial interests or personal relationships that could have appeared to influence the work reported in this paper.
References
- Passive, active, and interactive drag-reduction technique to reduce friction and enhance the mixing intensity in rotating disk apparatus. Chem. Eng. Commun.. 2018;205:1623-1640.
- [CrossRef] [Google Scholar]
- Alsaedi, S. S., Z. Y. Shnain, M. K. Rashed, et al., 2020. Triple solutions of nanoparticle plus polymer-surfactant compound for enhancing the drag reduction using a rotational disk apparatus. IOP Conference Series: Materials Science and Engineering, IOP Publishing.
- Drag increase at the very start of drag reducing flows in a rotating cylindrical double gap device. J. Nonnewton. Fluid Mech.. 2014;212:73-79.
- [CrossRef] [Google Scholar]
- Drag reduction in synthetic seawater by flexible and rigid polymer addition into a rotating cylindrical double gap device. J. Fluids Eng.. 2016;138
- [CrossRef] [Google Scholar]
- Emulsification of heavy crude oil in water for pipeline transportation. J. Pet. Sci. Eng.. 2010;71:205-211.
- [CrossRef] [Google Scholar]
- Emulsification of heavy crude oil in water by natural surfactants. J. Petrolium Sci. Eng.. 2012;86:137-143.
- [CrossRef] [Google Scholar]
- A review of drag reduction by additives in curved pipes for single-phase liquid and two-phase flows. Eng. Reports.. 2021;3:e12294
- [CrossRef] [Google Scholar]
- Viscoelastic properties and constitutive modelling of bitumen. Fuel. 2013;108:391-399.
- [CrossRef] [Google Scholar]
- A short review on drag reduction by polymers in wall bounded turbulence. PhysicaD: Nonlinear Phenomena.. 2010;239:1338-1345.
- [CrossRef] [Google Scholar]
- Drag reduction using additives in a Taylor-Couette Flow. Master of Science: University of Alberta; 2016.
- Drag Reduction using high molecular weight polymers in Taylor-Couette Flow. Int. J. Mechanical and Production Eng. Res. Develop. (IJMPERD).. 2016;6:59-72.
- [Google Scholar]
- Effect of TiO2 nanoparticles on the tribological properties of lubricating oil: an experimental investigation. Sci. Rep.. 2022;12:5201.
- [CrossRef] [Google Scholar]
- Taylor-Couette flow of polymer solutions with shear-thinning and viscoelastic rheology. J. Fluid Mech.. 2020;905
- [CrossRef] [Google Scholar]
- Synthesis and thermorheological analysis of biobased lignin-graft-poly (lactide) copolymers and their blends. ACS Sustain. Chem. Eng.. 2018;6:1650-1661.
- [CrossRef] [Google Scholar]
- The drag reduction and degradation characteristics of poly α olefin in diesel via rotating disk apparatus. Pet. Sci. Technol.. 2018;36:981-986.
- [CrossRef] [Google Scholar]
- Preparation, stabilization, and characterization of polyisobutylene aqueous suspension. Colloid Polym. Sci.. 2020;298:1335-1347.
- [CrossRef] [Google Scholar]
- Preparation of a stabilized aqueous polystyrene suspension via phase inversion. RSC Adv.. 2021;11:17547-17557.
- [CrossRef] [Google Scholar]
- Drag reduction in turbulent flows by diutan gum: a very stable natural drag reducer. J. Nonnewton. Fluid Mech.. 2020;276:104223
- [CrossRef] [Google Scholar]
- The effects of drag reducing polymers on flow stability: Insights from the Taylor-Couette problem. Korea-Australia Rheology J.. 2009;21:213-223.
- [Google Scholar]
- Applicability of a Taylor-Couette device to characterization of turbulent drag reduction in a pipeline. Chem. Eng. Sci.. 2014;116:275-283.
- [CrossRef] [Google Scholar]
- Surfactant turbulent drag reduction in an enclosed rotating disk apparatus. Exp. Fluids. 2007;42:459-469.
- [CrossRef] [Google Scholar]
- Exploring the relationship between nanoscale dynamics and macroscopic rheology in natural polymer gums. Soft Matter. 2016;12:9321-9329.
- [CrossRef] [Google Scholar]
- Couette-Taylor flow in a dilute polymer solution. Phys. Rev. Lett.. 1996;77:1480.
- [CrossRef] [Google Scholar]
- Applications of water-soluble polymers in turbulent drag reduction. Processes.. 2017;5:24.
- [CrossRef] [Google Scholar]
- Estimation of drag reduction by polymer additives at high reynolds numbers using rheological measurements. J Industrial & Eng. Che. Res. 2023
- [CrossRef] [Google Scholar]
- Streamwise development of turbulent boundary-layer drag reduction with polymer injection. J. Fluid Mech.. 2008;597:31-66.
- [CrossRef] [Google Scholar]
- Brownian dynamics modeling of flow-induced birefringence and chain scission in dilute polymer solutions in a planar cross-slot flow. Macromolecules. 2005;38:1456-1468.
- [CrossRef] [Google Scholar]
- A review of nonlinear oscillatory shear tests: analysis and application of large amplitude oscillatory shear (LAOS) Prog. Polym. Sci.. 2011;36:1697-1753.
- [CrossRef] [Google Scholar]
- Turbulent pipe flow of a drag-reducing rigid “rod-like” polymer solution. J. Nonnewton. Fluid Mech.. 2009;161:86-93.
- [CrossRef] [Google Scholar]
- Investigation of the effects of various parameters on pressure drop reduction in crude oil pipelines by drag reducing agents. J. Nonnewton. Fluid Mech.. 2012;177:37-45.
- [CrossRef] [Google Scholar]
- Degradation of drag reducing polymers in aqueous solutions. Korean J. Chem. Eng.. 2018;35:34-43.
- [CrossRef] [Google Scholar]
- A high-precision rotating disk apparatus for drag reduction characterization. Polym. Test.. 2000;20:43-48.
- [CrossRef] [Google Scholar]
- Effects of temperature on drag reduction in a subsonic turbulent boundary layer via micro-blowing array. Chin. J. Aeronaut.. 2022;35:174-193.
- [CrossRef] [Google Scholar]
- Time dependence of turbulent drag reduction efficiency of polyisobutylene in kerosene. J. Ind. Eng. Chem.. 2010;16:499-502.
- [CrossRef] [Google Scholar]
- Rheological behavior of polystyrene-based nanocomposite suspensions under LAOS. Mater. Sci: Forum, Trans Tech Publ; 2016.
- Torque in Taylor-Couette flow of viscoelastic polymer solutions. J. Non-Newtonian Fluid Mechanics.. 2017;247:221-228.
- [CrossRef] [Google Scholar]
- Review of viscosity modifier lubricant additives. Tribol. Lett.. 2018;66:1-14.
- [CrossRef] [Google Scholar]
- Aqueous solutions of associating poly (acrylamide-co-styrene): a path to improve drag reduction? Macromolecules. 2022;55:10479-10490.
- [CrossRef] [Google Scholar]
- Drag reduction in transportation of hydrocarbon liquids: from fundamentals to engineering applications. J. Petroleum Sci. Eng.. 2018;161:715-725.
- [CrossRef] [Google Scholar]
- Flow-induced polymer degradation probed by a high throughput microfluidic set-up. J. Nonnewton. Fluid Mech.. 2010;165:313-322.
- [CrossRef] [Google Scholar]
- CFD simulation of drag-reducing fluids in a non-Newtonian turbulent pipe flow. Chemical Engineering Science. 2024;285:119612
- [CrossRef] [Google Scholar]
- Degradation of polymer solutions in extensional flows. Macromolecules. 1990;23:3092-3103.
- [CrossRef] [Google Scholar]
- Turbulent flow drag reduction and degradation with dilute polymer solutions. J. Fluid Mech.. 1970;43:689-710.
- [CrossRef] [Google Scholar]
- Drag reduction induced by flexible and rigid molecules in a turbulent flow into a rotating cylindrical double gap device: comparison between Poly (ethylene oxide), Polyacrylamide, and Xanthan Gum. J. Nonnewton. Fluid Mech.. 2013;202:72-87.
- [CrossRef] [Google Scholar]
- Polymer degradation of dilute solutions in turbulent drag reducing flows in a cylindrical double gap rheometer device. J. Nonnewton. Fluid Mech.. 2012;179:9-22.
- [CrossRef] [Google Scholar]
- Structure and rheological properties of cellulose nanocrystals suspension. Food Hydrocoll.. 2016;55:19-25.
- [CrossRef] [Google Scholar]
- Effect of organically modified nanosilica on the viscosity and rheological behavior of karamay heavy crude oil. Energy Fuel. 2019;34:65-73.
- [CrossRef] [Google Scholar]
- Effect of ionic surfactants on the viscoelastic properties of chiral nematic cellulose nanocrystal suspensions. Langmuir. 2019;36:293-301.
- [CrossRef] [Google Scholar]
- Enhancing the drag reduction phenomenon within a rotating disk apparatus using polymer-surfactant additives. Appl. Sci.. 2016;6:355.
- [CrossRef] [Google Scholar]
- Kinetics of aggregation and gel formation in concentrated polystyrene colloids. J. Phys. Chem.B.. 2004;108:20105-20121.
- [CrossRef] [Google Scholar]
- Review of mechanical degradation and de-aggregation of drag reducing polymers in turbulent flows. J. Nonnewton. Fluid Mech.. 2020;276:104225
- [CrossRef] [Google Scholar]
- The role played by the aging of aloe vera on its drag reduction properties in turbulent flows. J. Nonnewton. Fluid Mech.. 2019;265:1-10.
- [CrossRef] [Google Scholar]
- The role played by the flexible polymer polyacrylamide (PAM) and the rigid polymer xanthan gum (XG) on drag in Taylor-Couette geometry: from Taylor’s vortexes to fully turbulent flow. J. Braz. Soc. Mech. Sci. Eng.. 2020;42:1-12.
- [CrossRef] [Google Scholar]
- A review of drag reduction and heat transfer enhancement by riblet surfaces in closed and open channel flow. Int. J. Thermofluids.. 2021;9:100053
- [CrossRef] [Google Scholar]
- The correspondence between drag enhancement and vortical structures in turbulent Taylor-Couette flows with polymer additives: a study of curvature dependence. J. Fluid Mech.. 2019;881:602-616.
- [CrossRef] [Google Scholar]
- Rheological demonstration of alteration in the heavy crude oil fluid structure upon addition of nanoparticles. Fuel. 2017;189:322-333.
- [CrossRef] [Google Scholar]
- Estimation of the dissipation rate of turbulent kinetic energy: a review. Chem. Eng. Sci.. 2021;229:116133
- [CrossRef] [Google Scholar]
- Rheological properties and thickening mechanism of aqueous diutan gum solution: effects of temperature and salts. Carbohydr. Polym.. 2015;132:620-629.
- [CrossRef] [Google Scholar]
- Drag reduction by linear flexible polymers and its degradation in turbulent flow: a phenomenological explanation from chemical thermodynamics and kinetics. Phys. Fluids. 2020;32
- [CrossRef] [Google Scholar]


