

Translate this page into:
Isolation and characterization of bioactive compounds from Lepisorus thunbergianus (Kaulf.)
*Corresponding author. Tel.: +82 33 250 6413; fax: +82 33 244 6413 kimmjo@kangwon.ac.kr (Myong Jo Kim)
-
Received: ,
Accepted: ,
This article was originally published by Elsevier and was migrated to Scientific Scholar after the change of Publisher.
Available online 16 December 2014
Peer review under responsibility of King Saud University.

Abstract
Lepisorus thunbergianus (Kaulf.) (LET) is an evergreen fern found on rocks and tree trunks that is distributed in East and Southeast Asia. Our previous study showed that the methanol extract from LET had significant anti-oxidant activity, but the active components of LET are still unclear. In the present study, isovitexin, orientin, isoorientin and chlorogenic acid were isolated from LET under the guidance of antioxidant activity. In addition, the structure of isovitexin, orientin, isoorientin and chlorogenic acid was characterized using matrix-assisted laser desorption/ionization time of flight mass spectrometry (MALDI-TOF-MS) and nuclear magnetic resonance spectroscopy (NMR). Orientin and isoorientin presented similar activities toward the DPPH, with half maximal inhibitory concentrations (IC50) of 15–17 μmol, and inhibition of reactive oxygen species (ROS) production by 50% at 100 μmol. Chlorogenic acid significantly inhibited intracellular ROS and nitric oxide (NO) production and had a strong effect toward DPPH. Furthermore, chlorogenic acid demonstrated decreased iNOS, COX-2, IFN-β and TNF-α gene expression. These findings demonstrate the potential anti-inflammatory effects of chlorogenic acid. Isoorientin, at a concentration of 100 μmol, showed 50% inhibition of human liver cancer cells (Huh7 and HepG2). These results suggest that compounds isolated from LET have potential to prevent liver cancer cell lines.
Keywords
Lepisorus thunbergianus (Kaulf.)
Antioxidants
Antiinflammatory
Flavonoid C-glycosides

1 Introduction
Lepisorus thunbergianus (Kaulf.) (LET) is an evergreen fern found on rocks and tree trunks that is distributed in East and Southeast Asia. The plant has been reported to show topical anti-lipid peroxidative activity (Chung et al., 1993). Moreover, it was found that treatment of oral cavity cancer cells with LET extracts resulted in concentration-dependent growth inhibition (Jang, 2010).
Free radicals and reactive oxygen species (ROS) have been proposed as causative factors in the toxicity of numerous chemicals and in the pathogenesis of many diseases, such as cardiovascular disease (Simonne et al., 1997), certain cancers (Ames et al., 1993), diabetes (Laaksonen and Sen, 2000), rheumatoid arthritis and cataracts (Taylor, 1992). Antioxidants are able to prevent the adverse effects of oxygen by helping to capture and neutralize free radicals, thereby eliminating free radical damage to the human body. Nitric oxide (NO) along with superoxide (O2•−) and the products of their interaction initiate a wide range of toxic oxidative reactions causing tissue injury (Hogg, 1998). Likewise, reactive oxygen intermediates are believed to be mediators of inflammation and responsible for the pathogenesis of tissue destruction in rheumatoid arthritis. Much attention has been directed toward the characterization of the antioxidant properties of plant extracts and their components in order to identify the constituents responsible for these activities. Previous studies have reported that among the many different groups of natural products, flavonoids are a group of chemical entities that are widely distributed in the plant kingdom. Flavonoids are a large group of polyphenolic compounds that are known to have antioxidative activity and to have scavenging effects on ROS (Nijveldtet al., 2001).
Preliminary assays carried out in our study show antioxidant activity of a methanol extract of LET. Therefore, in this study, the main antioxidants from LET were isolated, identified and quantified.
2 Materials and methods
2.1 Chemicals
All solvents used were of analytical grade. Methanol (MeOH), butanol (BuOH), n-hexane, ethyl acetate (EtOAc), chloroform (CHCl3), benzene and acetone were obtained from Dae Jung chemicals & metals Co. Silica gel (70–30 mesh) and thin layer chromatography (TLC) plate (silica gel 60F254; 60RP-18 F254S) was purchased from Merck Co. (Germany). Human liver cancer (HepG2, Huh7) and RAW 264.7 macrophage cell lines were purchased from the Korean Cell Line Bank (Seoul, Korea). 1,1-diphenyl-2-picrylhydrazyl (DPPH), gallic acid, butylated hydroxyanisole (BHA), 2,6-di-tert-butyl-4-methylphenol (BHT), phosphate buffered saline (PBS) buffer and 1-(4,5-dimethylthiazol-2-yl)-3,5-diphenylformazan (MTT) were purchased from Sigma (St. Louis, MO, USA). Dulbecco’s modified Eagle’s medium (DMEM), RPMI medium 1640 and fetal bovine serum (FBS), and Penicillin were acquired from Thermo Scientific (USA).
2.2 Plant material and extraction
The entire LET plant was dried in the shade at room temperature and then powdered. 1.2 kg of sample powder was extracted with 100% methanol. The methanol extract was filtered and three sample replicates were extracted under the same conditions with new solvent. The methanol extracts were filtered and evaporated under reduced pressure using a vacuum rotary evaporator to produce a crude extract. The crude extract was suspended in deionized water and partitioned sequentially with n-hexane, ethyl-acetate (EtOAc) and butanol (water saturated BuOH) fractions were then evaporated using a vacuum rotary evaporator. The antioxidant profile of the extract and fractions were determined by means of the selected assays.
2.3 Purification
The BuOH fraction was the most active in preliminary assays and was therefore selected for the isolation and characterization of the main antioxidants from LET. Each fraction was assessed for the free radical scavenging effect using the DPPH decoloration test.
The BuOH fraction (19.1 g) was separated on silica gel (320 g, 0.263–0.2 mm) using stepwise gradient elution with benzene:acetone:methanol (9:1:0–0:0:100) to yield 11 fractions (Fr. 1–Fr. 11). Fraction Fr. 9 (7.5 g) was chromatographed on silica gel (120 g, 0.263–0.2 mm), and eluted with benzene:methanol:water (88:7:5) to yield four subfractions (Fr. 9-1–Fr. 9-4). Subfraction Fr. 9-2 was recrystallized from methanol to give compound 1 (27.6 mg). Subfraction Fr. 9-3 (2.0 g) was separated by column chromatography (CC) on an octadecylsilyl (ODS) gel (23 g, 12 nm S-75 μm) using stepwise gradient elution with methanol:water (0:100–100:0) to yield seven subfractions (Fr. 9-3-1–Fr. 9-3-7). Subfraction Fr. 9-3-5 was re-crystallized from methanol to give compound 2 (17.9 mg). Subfraction Fr. 9-3-3 was chromatographed on a silica gel column (12 g, 0.04–0.06 mm) by isocratic elution with benzene:methanol:water (100:50:3) to give compound 3 (10.1 mg). Subfraction Fr. 9-4 (2.5 g) was re-chromatographed on a Sephadex LH-20 gel (16 g, 40–120 μm) by gradient elution with methanol:water (0:100–20:80) and divided into six sub-fractions (Fr. 9-4-1–Fr. 9-4-6). Subfraction Fr. 9-4-3 (0.98 g) was purified by CC on an ODS gel (11 g) with 100% water to yield compound 4.
2.4 Structural identification of the compounds
Nuclear magnetic resonance (NMR) spectra were obtained using a Bruker spectrometer (Rheinstetten, Karlsruhe, Germany). Dimethyl sulfoxide (DMSO-d6) and methanol (CD3OD) were used as solvents. MALDI-TOF MS data were recorded with a Maldi-top (Bio-Tek Instruments Inc, Winooski, USA).
2.5 DPPH radical scavenging activity
The DPPH radical scavenging activity of the extract and isolated compounds were determined by the method of Blois (1958) with some modifications. Initially, a 4 ml methanol solution containing 0.1 ml of samples at different concentrations was mixed with 1 ml 0.15 mM DPPH (dissolved in methanol). The reaction mixture was incubated for 30 min at room temperature. The control contained all reagents without the sample, and methanol was used as the blank. Measurements were performed in triplicate. DPPH radical scavenging activity was determined by measuring absorbance at 517 nm using a spectrophotometer (V530, Jasco Co., Tokyo, Japan). DPPH radical scavenging activity was expressed as the percentage of free radical inhibition by the sample and was calculated using the following formula: (%) inhibition = (absorbance of sample/1/2 absorbance of control) × 100. The IC50 value (μmol/ml) is the concentration at which the scavenging activity is 50%.
2.6 Cell culture and cell viability
HepG2 and Huh7 cells were grown in RPMI 1640 medium supplemented with 10% FBS and 1% antibiotics (penicillin and streptomycin, 100 U/ml). RAW 264.7 cells were grown in DMEM supplemented with 10% fetal bovine serum (FBS) and 1% antibiotics (penicillin and streptomycin, 100 U/ml). The cells were incubated at 37 °C in a humidified chamber, 5% CO2 atmosphere. Cell viability was determined by the MTT assay. Briefly, MTT (5 mg/ml), dissolved in phosphate-buffered saline (PBS), was filtered through a 0.2 μm filter and stored at 2 °C for routine use. This stock solution was diluted 10-fold with RPMI for each culture assayed, and the MTT (0.1 mg/ml) solution was added to each well of a 96-well plate. The culture wells were washed once with 1 ml of PBS to remove the remaining test sample after culture supernatants were collected and before the MTT solution was added. After an additional 4 h incubation at 37 °C in a humidified chamber, the formazan crystals were dissolved by adding DMSO (100 μl). Absorbance was read at 540 nm using an enzyme-linked immunosorbent assay reader multilable counter (Wallac VICTOR2, Tokyo, Japan).
2.7 Assay for ROS production using Raw 264.7 cells
The evolution of reactive oxygen species (ROS) using 2′,7′-dichlorodihydrofluorescein diacetate (H2DCFDA) assay (Schauss et al., 2006). In brief, RAW 264.7 cells were plated in a 6-well dish in PBS buffer for 30 min at 37 °C. The cells were washed twice with 1 ml/well PBS. ROS production was induced by lipopolysaccharide (LPS) (100 ng/ml), which was added 30 min before. ROS production was analyzed immediately by flow cytometry (FACS, Becton Dickinson, Sam Jose, CA, USA).
2.8 Assay for NO production using Raw 264.7 cells
Nitrite concentration was used as an indication of NO production. The procedure for NO determination was based on the Griess reaction (Green et al., 1982). A standard procedure used Griess reagent [1:1] mixture (v/v) of 1% sulfanilamide and 0.1% N-(1-naphthyl)-ethylenediamine dihydrochloride in 5% phosphoric acid; the two parts being mixed together within 30 min of use were employed. Griess reagent was mixed in the 96-well plates. After 10 min at room temperature, the absorbance at 540 nm was measured by a microtitration plate reader (Wallac VICTOR2, Japan).
2.9 RNA preparation and reverse transcription polymerase chain reaction (RT–PCR)
Total cellular RNA extraction, reverse transcription, and PCR analyses were performed as described previously (Lahti et al., 2006) with some modifications. SW620 cells (1 × 10⁵ cells) were incubated in a 6-well plate. After a 24 h incubation, cells were treated with sample for predetermined times and then the cells were harvested and washed twice with cold PBS. Total RNA was isolated with Trizol reagent in accordance with the manufacturer’s instructions (Invitrogen, Carlsbad, CA, USA). First-strand cDNA was synthesized from total RNA (2 μg) containing oligo (dT) primers and Moloney murine leukemia virus reverse transcriptase (Invitrogen). The primer and probe sequences and concentrations were optimized according to the manufacturer’s instructions for Tag DNA Polymerase part number P025A and were as follows: β-actin-F, 5′-TAC AGC TTC ACC ACC ACA GC-3′, β-actin-R, 5′-AAG GAA GGC TGG AAA GC-3′, iNOS-F, 5′-CTC ACT GGG ACA GCA CAG AA-3′, iNOS-R, 5′-TGG TCA AAG TCT TGG GGT TC-3′, COX-2-F, 5′-CAC TAC CTG ACC CAC TT-3′, COX-2-R, 5′-ATG CTC CTG CTT GAG TAT GT-3′, TNF-α-F, 5′-TTGACC TCA GCG CTG AGT TG-3′, TNF-α-R, 5′-CCT GTA GCC CAC GTC GTA GC-3′, IFN- β-α-F, 5′-CAG GAT GAG GAC ATG AGC ACC-3′, IFN-β-R, 5′-CTC TGC AGA CTC AAA CTC CAC-3′.
2.10 Data analysis
Data are expressed as means ± standard deviations. Statistical significance was determined by analysis of variance. Duncan’s multiple range test was used to detect differences between groups. A P < 0.05 was considered significant.
3 Results and discussion
3.1 Identification of the chemical structure of the isolated compounds
The following compounds were identified by comparison of its 1H and 13C NMR data with literature and are in agreement with the proposed structures. The structures of compounds 1–4 are presented in Fig. 1. Compound 1 was obtained as a yellow solid. UVλmaxMeOH/nm:270, 337; Its molecular formula C21H20O10 was obtained from the TOF-MS m/z: 433 [M + H]+ with a combination of 1H NMR and 13C NMR data. 1H NMR (400 MHz, DMSO-d6) δ: 13.55 (1H, brs, 5-OH), 7.93 (2H,d, J = 8.8 Hz, 2′, 6′-H), 6.93 (2H, d, J = 8.8 Hz, 3′, 5′-H), 6.78(1H, s, 8-H), 6.51 (1H, s, 3-H), 4.55 (1H, d, J = 9.8 Hz, 1″-H). 13C NMR (100 MHz, DMSO-d6) δ: 164.36 (C-2), 104.25(C-3), 182.81 (C-4), 161.52 (C-5), 109.75 (C-6), 164.17 (C-7), 94.48 (C-8), 157.08 (C-9), 103.65 (C-10), 121.96 (C-1′), 129.34 (C-2′, 6′), 116.84 (C-3′, 5′), 162.04 (C-4′), 73.91 (C-1″), 71.47 (C-2″), 79.80 (C-3″), 71.06 (C-4″), 82.45 (C-5″), 62.34 (C-6″). Compound 1 was identified as isovitexin, by NMR analysis, and comparison with its literature data (Li et al., 2005).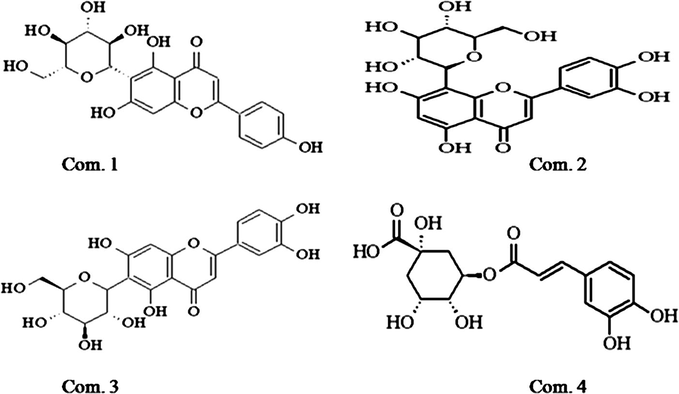
Chemical structure of the compounds isolated from Lepisorus thunbergianus.
Compound 2 was obtained as a yellow solid. TOF-MS m/z: 449 [M + H]+. Thus, its molecular formula was deduced to be C21H20O11 from a combination of 1H NMR and 13C NMR data. 1H NMR (400 MHz, DMSO-d6) δ: 3.22–3.88 (6H, m, glucosyl-H), 4.69 (1H, d, J = 9.9 Hz, H-1″), 6.25 (1H,s, H-6), 6.64 (1H, s, H-3), 6.86 (1H, d, J = 8.4 Hz, H-5′), 7.48 (1H, d, J = 2.0 Hz, H-2′), 7.54 (1H, dd, J = 2.0, 8.4 Hz, H-6′), 13.20 (1H, s, 5-OH). 13C NMR (100 MHz, DMSO-d6) δ: 164.41 (C-2), 102.68 (C-3), 182.32 (C-4), 160.74 (C-5), 98.53 (C-6), 163.24 (C-7), 104.91 (C-8), 156.36 (C-9), 104.25 (C-10), 122.24 (C-1′), 114.34 (C-2′), 146.22 (C-3′), 150.16 (C-4′), 116.00 (C-5′), 119.71 (C-6′), 73.76 (C-1″), 71.13 (C-2″), 79.12 (C-3″), 71.06 (C-4″), 82.35 (C-5″), 62.04 (C-6″). Compound 2 was identified as orietin by NMR analysis, and comparison with its literature data (Song and Sun, 2004).
Compound 3 was isolated as a yellow solid. UVλ λmaxMeOH/nm: 348, 270, 255.TOF-MS m/z: 470 [M + Na]+. Thus, its molecular formula was deduced to be C21H20O11 from a combination of 1H NMR and 13C NMR data. 1H NMR (600 MHz, DMSO-d6) δ: 13.2 (1H, brs, 5-OH), 7.55 (1H, dd, J = 2.5, 9.0 Hz, 6′-H), 7.45 (1H, d, J = 2.5 Hz,2′-H), 6.85 (1H, d, J = 9.0 Hz, 5′-H), 6.63 (1H, s, 3-H), 4.7 (1H, d, J = 9.7 Hz, 1″-H). 13C NMR (150 MHz, DMSO-d6) δ: 163.24 (C-2), 102.68 (C-3), 182.32 (C-4), 160.74 (C-5), 108.88 (C-6), 164.41 (C-7), 98.53 (C-8), 156.36 (C-9), 102.68 (C-10), 122.24 (C-1′), 114.34 (C-2′), 146.22 (C-3′), 150.16 (C-4′), 116.00 (C-5′), 119.71 (C-6′), 73.76 (C-1″), 70.13 (C-2″), 79.12 (C-3″), 70.06 (C-4″), 82.35 (C-5″), 62.01 (C-6″). Compound 3 was identified as isoorientin, by NMR analysis, and comparison with its literature data (Li et al., 2002).
Compound 4 was obtained as a colorless needle powder. Its molecular formula C16H18O9 was obtained from the TOF-MS m/z: 377 [M + Na]+. The 1H NMR (400 MHz, DMSO-d6), δ 7.42 (1H, d, J = 15.9 Hz, H-7′), 7.08 (1H, d, J = 2.0 Hz, H-2′), 6.98 (1H, dd, J = 2.0, 8.2 Hz, H-6′), 6.68 (1H, d, J = 8.2 Hz, H-5′), 6.20 (1H, d, J = 15.9 Hz, H-8′), 5.18 (1H, br d, J = 6.8 Hz, H-5), 3.93 (1H, br s, H-3), 3.51 (1H,br d, J = 6.8 Hz, H-4), 1.99–2.04 (2H, m, H-6), 1.85 (1H, m, H-2ax), 1.67 (1H, m, H-2 eq); 13C NMR (100 MHz, DMSO-d6) δ: 177.61 (C-7), 167.21 (C-9′), 149.44 (C-4′), 145.64 (C-7′), 145.55 (C-3′), 126.33 (C-1′), 122.07 (C-6′), 116.71 (C-5′), 115.62 (C-2′), 115.41 (C-8′), 76.22 (C-1), 74.06 (C-4), 72.40 (C-5), 72.21 (C-3), 49.46 (C-6), 38.92 (C-2). Compound 4 was identified as chlorogenic acid, by NMR analysis, and comparison with its literature data (Gao et al., 1998).
3.2 Antioxidant capacities of compounds
The compounds isolated from LET were examined for their inhibitory activity against the DPPH radical (Table 1). Compound 4 (at a concentration of 6.86 μmol/ml) showed higher radical scavenging activity than ascorbic acid (IC50 = 11.07 μmol/ml). Compounds 2 and 3 (at concentrations of 15.22 and 17.36 μmol/ml, respectively) exhibited the good inhibition of the DPPH radical. Compound 1 possessed weak activity. These results indicate that the ability of LET to significantly protect against active free radicals is attributable to its component active compounds. LET has also been reported to show significant topical anti-lipid peroxidase activity (Chung et al., 1998). However, the antioxidant activity of compounds isolated from this plant has not yet been studied. aMean values with the same letter are not significantly different at p < 0.05 by Duncan’s multiple range test.
Compounds
DPPH radical scavenging activity IC50 (μmol/ml)
Com. 1
126.38 ± 1.85 d
Com. 2
17.36 ± 1.07 c
Com. 3
15.22 ± 0.74 b
Com. 4
6.86 ± 0.56 a
Ascorbic acid
11.70 ± 0.82
α-Tocopherol
13.85 ± 0.46
BHA
81.73 ± 0.39
BHT
601.84 ± 0.29
3.3 Effect of compounds on reactive oxygen species (ROS) generation from RAW 264.7 cells
The cellular direct free radical scavenging effect of varying concentrations of compounds 2, 3 and 4 were tested on RAW 264.7 cells because these cells are able to produce a high amount of ROS following stimulation. ROS production can be inhibited by antioxidants capable of entering live cells and can be further inhibited by anti-inflammatory compounds in a complex product. The pretreatment of RAW 264.7 cells with samples of compounds 2, 3 and 4 resulted in inhibition of the formation of ROS by the RAW 264.7 cells (Fig. 2). Untreated RAW 264.7 cells (no sample, no lipopolysaccharide (LPS)) served as a baseline, and RAW 264.7 cells treated with LPS in the absence of sample served to show maximum ROS production. RAW264.7 cells treated with the sample produced fewer ROS than cells treated with LPS in the absence of sample. The inhibition of ROS formation was dose-dependent and, at the highest dose of compound 4 tested (100 μmol/ml), the inhibition was highly significant (P < 0.05). These results confirm that compounds 2, 3, and 4 scavenged free radicals and inhibited radical-mediated oxidation in RAW 264.7 cells. A similar result was observed by Budzianowsk et al. (1991), who suggest that the antioxidant activity is due to C-glycosyl flavones orientin and isoorientin, as well as chlorogenic acid. Compound 4 showed superior antioxidant activity than other compounds; this is because the Compound 4 has vicinal hydroxyl groups on an aromatic residue, which is to scavenge reactive oxygen species (ROS) (Rice-Evans et al., 1996).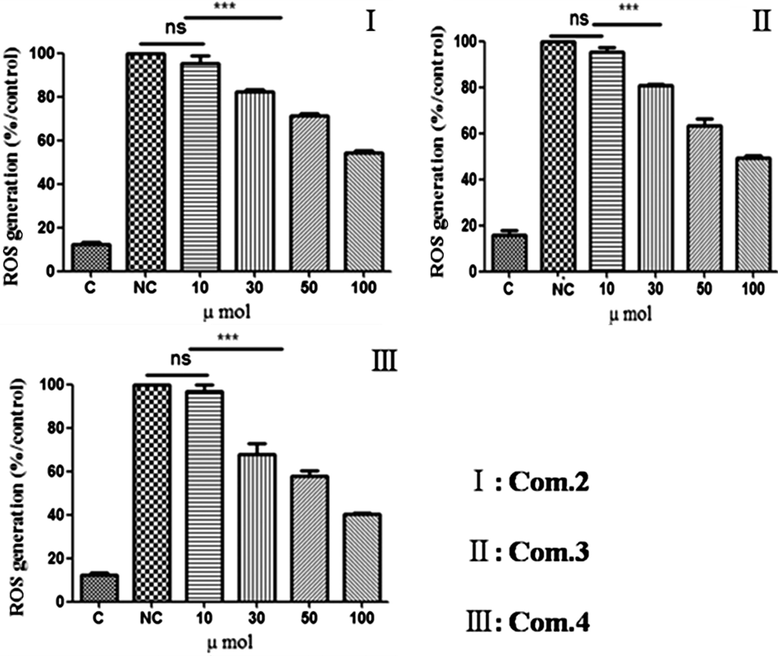
Reactive oxygen species (ROS) generation in LPS-induced RAW 264.7 cells following treatment with compounds 2–4. Data are mean ± standard deviation of three independent experiments. ∗∗∗P < 0.001.
3.4 Effect of com. 4 on nitric oxide (NO) production from RAW 264.7 cells
It is believed that the activation of macrophages plays an important role in the inflammatory process. Increasing evidence also suggests that NO is centrally involved. Thus, NO production may reflect the degree of inflammation and provides a measure by which the effects of drugs on the inflammatory process can be assessed (Chiou et al., 1997). In the present study, compound 4 was examined for anti-inflammatory properties by studying its effect on NO production in RAW 264.7 cells when stimulated by LPS inducers. The results indicated that a 30-min pre-treatment with compound 4 (at a concentration 0.1 mM) followed by 24 h of stimulation with LPS, had no effect on LPS-induced NO production. However, the NO production decreased to 40% when the concentration of compound 4 was increased to 1 mM. In addition, the MTT (3-[4,5-dimethylthiazol-2-yl]-2,5 diphenyl tetrazolium bromide) assay results showed that compound 4 at concentrations ranging from 0.3 to 1 mM had no effect on RAW 264.7 cell viability after 24 h of incubation (Fig. 3A). These results suggest that compound 4 at a concentration of 1 mM appears to be nontoxic to the RAW 264.7 cells and significantly inhibits NO production. Inhibition of NO production may contribute to the anti-inflammatory and immunoregulatory activities of compound 4, so was used for subsequent experiments.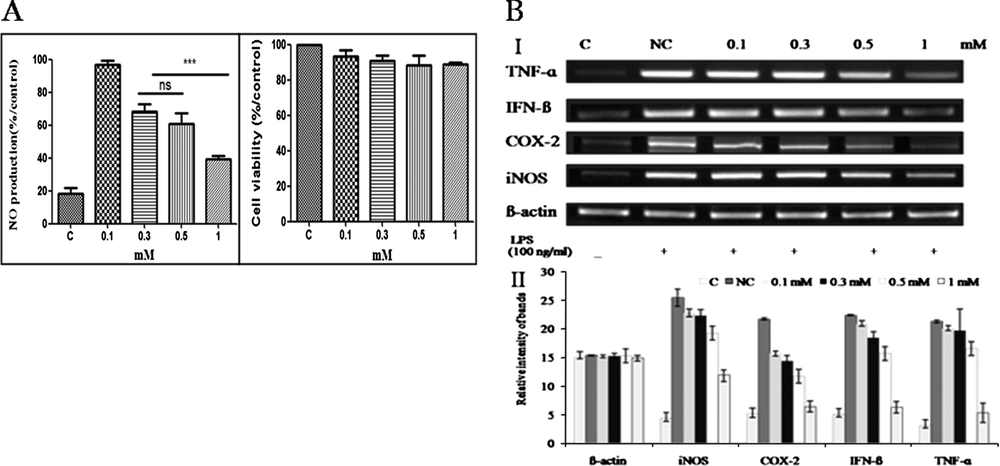
The anti-inflammatory effects of compound 4. (A) The effect of compound 4 on LPS-induced NO production in RAW 264.7 cells. Data are mean ± standard deviation of three independent experiments. ∗∗∗P < 0.001. (B) The effect of compound 4 on LPS-induced ß-actin, iNOS, COX-2, IFN-ß and TNF-α expression in RAW 264.7 cells. I: Gel electrophoresis of amplified product of ß-actin, iNOS, COX-2, IFN-ß and TNF-α; II: Quantitative data of panel A; C: control; NC: negative control.
3.5 Effect of compound 4 on inducible nitric oxide synthase (iNOS), COX-2, interferon-beta (IFN- β) and tumor necrosis factor-alpha (TNF-α) genes expression
To delineate the mechanism of the anti-inflammatory action of compound 4 in LPS-activated RAW 264.7 macrophages, we investigated whether the inhibitory effects of compound 4 on these proinflammatory mediators are related to iNOS, COX-2, IFN-β and TNF-α using a reverse-transcriptase polymerase chain reaction (RT-PCR) assay (Fig. 3B). Quantitative RT-PCR showed that LPS dramatically up-regulated iNOS mRNA expression in RAW 264.7 cells when compared with the unstimulated control. However, iNOS, COX-2, IFN-β and TNF-α were markedly expressed by LPS, and expression levels decreased in a dose-dependent manner following treatment with compound 4. In addition, it was found that iNOS, COX-2, IFN-β and TNF-α expression decreased to almost undetectable levels after treatment with a 1 mM sample of compound 4. Taken together, these findings suggest that the anti-inflammatory properties of compound 4 may be due to the reduction of iNOS, COX-2, IFN-β and TNF-α gene expression. Antioxidant consumption, along with anti-inflammatory treatment, is being critically evaluated as a potential strategy for reversal of disease progression. The anti-inflammatory activity of compound 4 may be partly due to its antioxidant potential. The reactive free radical NO synthesized by iNOS is a potent pro-inflammatory mediator. Increased expression of iNOS has been observed in several human tumor tissues as well as in inflammatory disorders [Goldstein et al. (1998), Takahashi et al. (1997)]. Bingham (2002) has also reported that COX-2 and iNOS are deeply associated with inflammatory disease. In particular, TNF-α is a prominent contributor to chronic inflammation. Therefore, inhibition of iNOS, COX-2 and TNF-α activities or down-regulation of their expression may be beneficial to reduce the inflammatory response.
3.6 Antiproliferative activity of com. 3
The antiproliferative activity of compound 3 was investigated with the MTT bioassay using a human liver cancer line (HepG2 and Huh7). Fig. 4 shows that treatments (incubation for 24 h) with different test sample concentrations (10–100 μmol) induced cytotoxic effects that were dose dependent (P < 0.05). The HepG2 and Huh7 cells showed a similar pattern, exhibiting a significant reduction in cell viability at the compound 3 concentration of 10 μmol. At the highest concentration tested (100 μmol), a > 50% decrease in cell viability was observed in the cell line. Our results are in agreement with the report of Pacifico et al. (2010). The mechanism of action of the antiproliferative activity of compound 3 could be induced by apoptosis in HepG2 and Huh7 cells. It was also reported that compound 3 can induce HepG2 cell death mainly by triggering apoptosis based on results that several apoptotic characteristics, including cellular shrinkage, the cleavage of PARP and DNA fragmentation, were observed in compound 3-treated HepG2 cells (Li et al., 2012).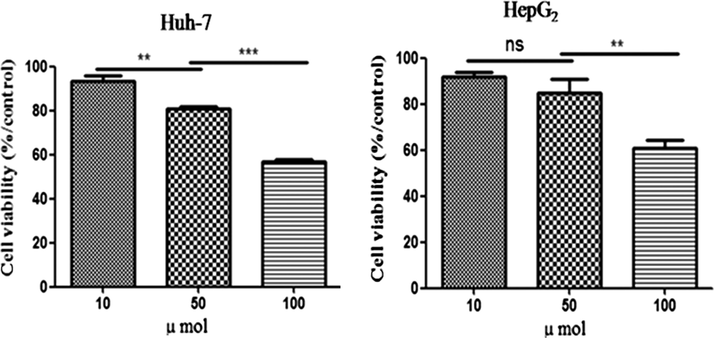
Inhibitory effect of compound 3 on proliferation of Huh7 and HepG2 (human liver cancer cell). Data are mean ± standard deviation of three independent experiments. ∗∗P < 0.01, ∗∗∗P < 0.001.
4 Conclusion
In summary, four compounds were isolated and purified from LET and then identified as isovitexin, orientin, isoorientin and chlorogenic acid. Furthermore, the antioxidant, anti-inflammatory and antiproliferative activities of these four compounds were evaluated. The results indicate that orientin, isoorientin and chlorogenic acid significantly inhibited intracellular ROS production and had a strong effect on DPPH. Isoorientin at concentration of 100 μmol showed 50% inhibition of human liver cancer cells (Huh7 and HepG2). The present study also supports the use of chlorogenic acid for treatment of inflammatory related diseases because of its ability to inhibit NO production and decrease iNOS, COX-2, IFN-β and TNF-α gene expression. Further work about the antiproliferative activity of these compounds using in vivo models is worth investigation.
Acknowledgment
This research was supported by the 2013 Research Grant from Kangwon National University (NO. 120140294) and Cooperative Research Program for Agriculture Science and Technology Development (Project NO. PJ009859) Rural Development Administration, Republic of Korea.
References
- Oxidants, antioxidants, and the degenerative diseases of aging. J. Proc. Natl. Acad. Sci.. 1993;90:7915-7922.
- [Google Scholar]
- The pathogenesis of rheumatoid arthritispivotal cytokines involved in bone degradation and inflammation. J. Rheumatol.. 2002;29(10):3-9.
- [Google Scholar]
- Antioxidant determinations by the use of a stable free radical. J. Nat.. 1958;181:1199-1200.
- [Google Scholar]
- Studies on antioxidative activity of some C-glycosylflavones. J. Pharmacol. Pharm.. 1991;43:395-401.
- [Google Scholar]
- Inhibitory effect of dehydroevodiamine and evodiamine on nitric oxide production in cultured murine macrophages. J. Nat. Prod.. 1997;60:708-711.
- [Google Scholar]
- Effect of butanol extract from Lepisorus thunvergians on the lipid peroxidantion. Tech. papers Kyungsung Uni. 1993:207-216.
- [Google Scholar]
- Phenolic glucosides and a γ-lactone glucoside from the sprouts of crocus sativus. Planta. Med.. 1998;65:425-427.
- [Google Scholar]
- Studied of iron deposits, inducible nitric oxide synthase and nitrotyrosine in a rat model for esophageal adenocarcinoma. Carcinogenesis. 1998;19:1445-1449.
- [Google Scholar]
- Analysis of nitrate, nitrite, and [15N] nitriate in biological fluids. Anal. Biochem.. 1982;126:131-138.
- [Google Scholar]
- Jang, Y.H., 2010. The study of anti-cancer effects by boiled and methanol extracts of Lepisorus thunvergians. Master degree thesis Chosun Uni.
- Exercise and oxidative stress in diabetes mellitus. J. Pathophysiol.. 2000;12:1105-1136.
- [Google Scholar]
- Inhibition of p38mitogen-activated protein kinase enhances c-Jun N-terminal kinase activity: implication in inducible nitric oxide synthase expression. Biomed. Cenral. Pharmacol. 2006;6:5.
- [Google Scholar]
- Isoorientin induces apoptosis through mitochondrial dysfunction and inhibition of PI3K/Akt signaling pathway in HepG2 cancer cells. Toxicol. Appl. Pharm.. 2012;265:83-92.
- [Google Scholar]
- Flavonoids: a review of probable mechanisms of action and potential applications. J. Am. Nut.. 2001;74:418-425.
- [Google Scholar]
- Spectroscopic characterization and antiproliferative activity on HepG2 human hepatoblastoma cells of flavonoid C-glycosides from Petrorhagia velutina. J. Nat. Prod.. 2010;73:1973-1978.
- [Google Scholar]
- Structure-antioxidant activity relationships of flavonoids and phenolic acids. Free Radical. Biol. Med.. 1996;20(7):933-956.
- [Google Scholar]
- Antioxidant capacity and other bioactivities of the freeze-dried Amazonian palm berry. Euterpeoleraceae Mart. (acai) J. Agri. Food Chem.. 2006;54:8604-8610.
- [Google Scholar]
- Ascorbic acid and provitamin a contents in unusually colored bell peppers (Capsicum annuum L.) J. Food Com. Analysis.. 1997;10:299-311.
- [Google Scholar]
- Chemical studies on constituents of Trollius altaicus CA Mey. Medi. Chem.. 2004;14:233-235.
- [Google Scholar]
- Increased expression of inducible and endothelial nitric oxide synthases in rat colon tumors induced by azoxymethane. Cancer Res.. 1997;57:1233-1237.
- [Google Scholar]


