

Translate this page into:
Isolation and identification of bioactive compounds from Tinospora cordifolia stem extracts as antibacterial materials in seawater environments
⁎Corresponding author at: Postgraduate Program of Materials Science Study, Department of Physics, Faculty of Mathematics and Natural Sciences, Universitas Indonesia, Depok 16424, Indonesia. azwar@sci.ui.ac.id (Azwar Manaf),
-
Received: ,
Accepted: ,
This article was originally published by Elsevier and was migrated to Scientific Scholar after the change of Publisher.
Peer review under responsibility of King Saud University.
Abstract
The Tinospora genus is widely utilized because of its numerous bioactive compounds. This work aimed to isolate the bioactive constituents and antibacterial activities of the T. cordifolia plant. Maceration, column chromatography, and thin-layer chromatography plates were utilized to identify and visualize the extracted and isolated compounds. Total phenolics and flavonoids in the extracts and active fractions were also analysed. Substances were identified through their molecular structure and molecular mass. The names, molecular weights, and structures of the components of the test materials were verified using Fourier transform infrared (FT-IR) spectroscopy and nuclear magnetic resonance (1H NMR, 13C NMR, HMQC, and HMBC). The minimum inhibitory concentration (MIC) values were 3294, 156, and 32 µg/mL for the crude extract, active fraction, and isolate of T. cordifolia, respectively. The total phenol active fraction was 38.44 mg GAE/g, while the total flavonoid content was 79.46 mg QE/g. N-trans-Feruloyltyramine or Moupinamide, a phenol group compound with a molecular ion weight of 314 m/z (M + H)+, was successfully isolated as the bioactive compound. The moupinamide isolate may be responsible for the antibacterial activity of T. cordifolia in this work. Our findings indicate that the bioactive isolate from T. cordifolia is a potential source of green material and exhibits the potential to inhibit P. aeruginosa biofilm, which is responsible for microbial corrosion.
Keywords
Antibacterial
Bioactive material
Isolation
N-trans-Feruloyltyramine
P. aeruginosa
Tinospora cordifolia

1 Introduction
Microbiologically influenced corrosion is a type of corrosion that is induced or accelerated by specific microorganisms or metabolic products (Marciales et al., 2019). Pseudomonas aeruginosa is a Gram-negative facultative aerobic bacterium that produces biofilms on metal surfaces and promotes corrosion (Jia et al., 2017; Cardona and Muñoz Mata, 2013). P. aeruginosa causes corrosion in the marine environment by forming biofilms (Pu et al., 2020; Lekbach et al., 2018). The corrosion mediated by P. aeruginosa has been shown to decrease the performance of pipe network systems that distribute water (Lekbach et al. 2018). It is critical to use inhibitors to control corrosion and prevent material damage caused by corrosion (Nikitasari et al., 2020). Many synthetic compounds are highly resistant to corrosion, but most are highly toxic to the environment (Verma et al., 2018). Because of the growing awareness of green chemistry and sustainable development, using chemicals derived from plants is becoming increasingly popular in many industrial applications, such as corrosion inhibition. Due to their affordability, availability, renewability, ecological acceptability, and ecologically friendly qualities, green inhibitors or green biocides from plants have recently undergone tremendous growth and advancements (Royani, Hanafi and Manaf, 2022; Satheesh et al., 2016). On the other hand, due to the large variety of bioactive molecules that plants produce, they are a potential source of antibacterial agents against P. aeruginosa (Parthipan et al., 2018; Swaroop et al., 2016; Parthipan et al., 2021). In order to create and exploit bioactive components that are more efficient at resolving corrosion issues brought on by the P. aeruginosa biofilm bacterium, researchers can benefit from harvesting and separating bioactive compounds.
Tinospora cordifolia is a tropical vine belonging to the Menispermaceae family utilized as a traditional medicinal herb. Due to its bioactive compounds, T. cordifolia has been widely studied in literature from various scientific disciplines. Various extracts, fractions, and constituents were examined and several bioactive substances were quantitatively evaluated (Singh and Chaudhuri, 2017). According to previous studies, the dominant phytochemical elements of the genus Tinospora are quaternary alkaloids (Yusoff et al., 2014). The other results indicated that the extract of T. cordifolia included pharmacologically active chemicals that exhibit potent antioxidant and antibacterial properties (Ramesh et al., 2016). Another study stated that crude extracts and isolated chemicals from T. crispa possess different pharmacological properties, such as antioxidant, anti-inflammatory, cytotoxic, and antidiabetic properties (Ahmad et al., 2016). Although there have been numerous studies on the extraction and use of T. cordifolia in medicine and pharmaceuticals, to the best of our knowledge, no research has isolated bioactive components from this species to create corrosion biofilms through green antibacterial material. In this case, further research is needed to explore this type of plant because of its extraordinary potential to inhibit and control various microbes.
Previous studies on crude extract have demonstrated that T. cordifolia stem extract exhibits antibacterial activity against P. aeruginosa (Royani et al., 2023), inspiring more investigation into these positive qualities of the plant and possible applications. This work focused on isolating and assessing the antibacterial activity of the identified bioactive compounds due to their promising biological properties. This work aimed to identify bioactive chemicals as sustainable materials for growing antibacterial biofilms in synthetic seawater media. T. cordifolia was utilized in this investigation because it is a medicinal herb that contains numerous bioactive components. Extracts and isolation were performed using maceration, column chromatography, and thin-layer chromatography. The antibacterial activity against P. aeruginosa was assessed by dilution in synthetic seawater broth. Utilizing AlCl3 and Folin-Ciocalteu calorimetry, the flavonoid and phenolic contents were evaluated. Pure isolates/compounds were distinguished by FT-IR, 1H NMR, 13C NMR, HMQC, and HMBC.
2 Materials and methods
2.1 Materials
Tinospora cordifolia plants were provided by the Indonesian Medical and Aromatic Crops Research Institute (IMACRI) - Bogor. The plant samples were identified in the Herbarium Bogoriense laboratory, Directorate of Scientific Collection Management of BRIN, Cibinong – Bogor (ID number: B-1810/II.6.2/DI.05.07/6/2022). Pseudomonas aeruginosa (ATCC 15,442 strain) was obtained from IPB University Culture Collection (IPBCC) – Department of Biology, IPB University.
The solvents for extraction, fractionation, and isolation were distilled methanol, n-hexane, ethyl acetate, and distilled water. TLC silica gel sheet 60 F254 aluminium sheets (Merck, 1.05554.0001) were used for thin layer chromatography, and silica gel (0.063–0.200 mm, Merck 1.07734.1000) was used for column chromatography. The antibacterial test materials were Brain Heart Infusion (BHI, BD, Bacto 237500), Mueller Hinton Agar (MHA), and synthetic seawater media (Marine Art, SF-1, Japan). Both tetracycline and ampicillin (Sigma) were used for positive control.
2.2 Extract preparation
The stems of T. cordifolia plants were washed and dried before being cut into small pieces and pulverized in a blender. The powdered simplicia was stored in a closed container at room temperature. One thousand grams of powdered simplicia were extracted using the repeated maceration method with 50% methanol (v/v) in the macerator for three consecutive days. The filtrate was filtered and evaporated using a rotary vacuum evaporator after maceration. Furthermore, the extract was collected, weighed, and refrigerated until further processing.
2.3 Isolation of the active compounds
The flow chart in Fig. 1 shows the process of isolating the active compound from the T. cordifolia plant extract. The extract was fractionated using column chromatography and solvents containing n-hexane, ethyl acetate, and methanol. After preparation, 12.5 g of crude stem extract was slowly added to the column. In this study, column chromatography used a flow rate of 2 mL/min with 100 mg/mL of concentration and 125 mL of volume. After that, the eluent was streamed and collected. The eluent was gradually changed from nonpolar to polar. A rotary vacuum evaporator was used to collect and evaporate the results of the column chromatographic elution. The fraction concentrates were then visualized, and aggregation was performed using the same thin-layer chromatography (TLC) profile. The active fraction was then isolated using a two-stage column chromatography method. 94.5 mg of the active fraction was prepared with a volatile solvent, 90 mg of silica gel was added, and the mixture was loaded into the chromatography column. The column chromatography elution results were placed in a vial and dried in an oven. The isolates or subfractions were then separated using TLC to produce pure isolates and combinations based on the same TLC profile. The subfraction (isolate) was weighed and placed in a bottle, and its activity was determined. Furthermore, for pure isolates, the compound structure was analysed and identified.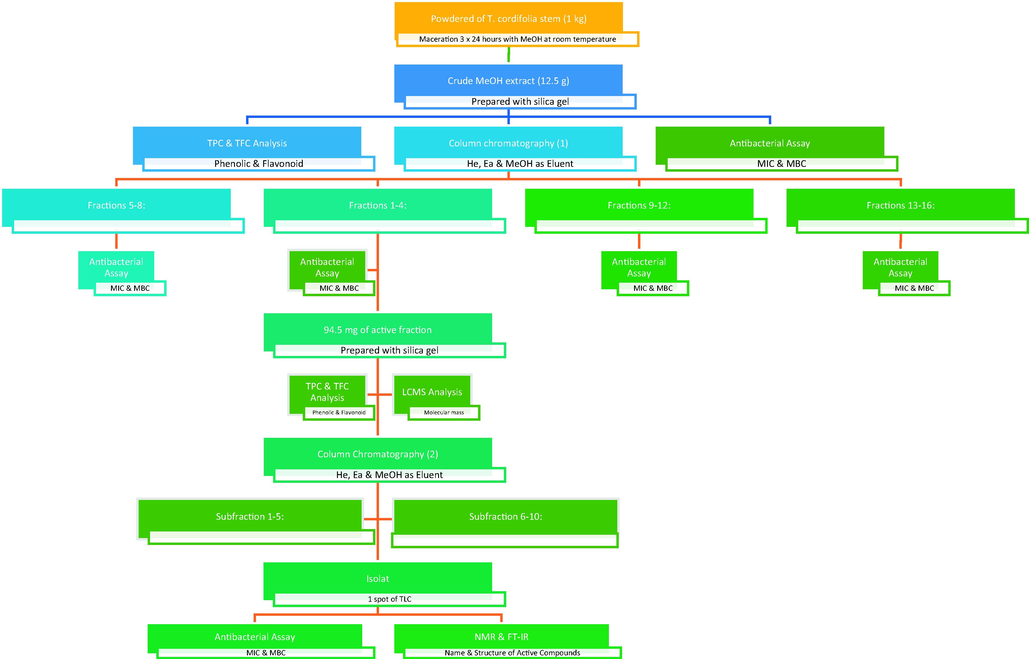
Flowchart of the isolation of bioactive compounds from T. cordifolia plants consisting of crude extract maceration, including initial column chromatography, secondary column chromatography with the most active fraction, and identification of the isolated compounds.
2.4 Phenolic and flavonoid content analyses
The total phenolic content (TPC) of the resulting extract and active fraction was analysed using the Folin-Ciocalteu method (Singleton, Orthofer, and Lamuela-Raventós, 1999) with gallic acid as a standard. Pipette 500 L of sample solution and reference solution (25, 50, 100, 150, and 200 µL) into a test tube and dilute with 250 µL of Folin-Ciocalteu reagent and distilled water to a volume of 4 mL. After 8 min, 750 µL of 20% Na2CO3 was added and shaken until homogeneous. The mixing solution remained at room temperature for 2 h. Absorption was measured at a wavelength of 765 nm. Each measurement was repeated twice to obtain the average phenol content. The total phenolic content was represented as gallic acid equivalents (mg/g extract) by using the calibration regression equation of the curve.
Meanwhile, the total flavonoid content was analysed by the colorimetry aluminium chloride (AlCl3) method described by Chang et al. with slight modification (Chang et al., 2002). 4 mg of quercetin was dissolved in 4 mL methanol. The standard curve measurements used 10, 20, 30, 40, and 50 µg/mL concentrations with standard solution volumes of 50, 100, 150, 200, and 250 µL. Each test tube (standard and sample) received 2 mL of distilled water and 150 µL of NaNO2 (5%). After 5 min, 150 µL of AlCl3 (10%) was added. After 6 min, 2 mL of 1 M NaOH was added, and the volume was adjusted with distilled water to 5 mL. After homogenizing the solution mixture, the absorbance was measured using a UV–Vis spectrophotometer at 510 nm.
2.5 Antibacterial assay
Antibacterial activity was assessed by serial broth dilution methods following previous methods as described elsewhere (Priyanto et al., 2022). Before the antibacterial test, all instruments were cleaned and sterilized in a UV chamber for 24 h. The media and nutrients were prepared according to the manufacturer’s instructions and autoclaved for 15 min at 121 °C. The 96-well microplate well (Iwaki) was filled with 100 µL of BHI medium (diluted with artificial seawater), and well (A) was filled with 100 µL of the extract solution (diluted on methanol) before generating a series of dilution concentrations (serially dilution was set starting from 5000 to 50 μg/mL for fraction samples, and from 300 to 10 μg/mL for sub-fraction and isolate samples). Next, 100 µL of the 24-hour cultured bacterial suspension was added to each well plate and incubated at room temperature for 24 h. This study used the standard McFarland 0.5 of 24-hour bacterial culture, equivalent to 1 × 10⁸ CFU/mL. The turbidity and clarity of each incubated test medium were compared to the control media solution to determine the minimum inhibitory concentration (MIC). When the inhibition of bacterial growth is at a lower concentration, referred to as the MIC value, the test (Mueller Hinton Agar (MHA) media is cleaner. After incubation, the minimum bacterial concentration (MBC) was observed by searching for areas on the agar medium with no bacterial growth.
2.6 Analysis thin layer chromatography (TLC)
TLC analysis isolated or separated the active compound from the liquid solution. Aluminium plates and silica gel 60 F254 as the stationary phase were used for TLC analysis. The mobile phase (eluent) was a mixture of n-hexane, ethyl acetate, and methanol. The sample (fraction/isolate) was dissolved in the appropriate solvent and shaken until completely dissolved. Furthermore, the solution was spotted on the bottom plate line (1 cm from the bottom), dried, and then eluted in a chamber containing eluent in a specific ratio. The plates were removed and dried after being completely adsorbed (up to the top line of the plates). The spots formed were observed at wavelengths of 254 and 366 nm.
2.7 Identification of bioactive compounds by LC-MS, FT-NMR, and FT-IR
The molecular weights of the compounds were determined using liquid chromatography-mass spectrometry (LC-MS) with a UNIFI chromatography instrument (Xevo G2-XS QToF) equipped with Mariner Biospectrometry software. The LCMS test was performed with methanol solvent, a 5 µL injection volume, and a C-18 column (15 mm × 2 mm) with a 0.2 mL/minute flow rate. Furthermore, Fourier transfer nuclear magnetic resonance (FT-NMR) JEOL JNM 500 MHz was used to identify pure compounds from isolated results, such as proton (1H NMR), carbon (13C NMR), and 2D-NMR, which included HMQC and HMBC. Approximately 3 mg of the pure isolate was dissolved in a special deuterated solvent (CD3OD) and then placed in a unique glass tube for NMR in the centre of the magnetic field tank to be measured by NMR. The functional groups (chemical bonds) of the compounds were detected using Fourier transform infrared spectrometry (FT-IR) (Bruker-Tension II). The scan frequency range was 4000 cm−1 to 500 cm−1, with a resolution of 4 cm−1 for 45 s.
3 Results and discussion
3.1 Yield extract
In this study, the maceration technique was used to obtain yield extracts because, compared to other techniques, maceration is a more straightforward process, requires less equipment and is widely used on a large scale (Vongsak et al., 2013). T. cordifolia stem extract with 50% methanol solvent yielded a 20.35% yield. This study calculated yield by weighing the dry extract (concentrated extract) and dividing it by the initial weight (powdered plant material). The extraction efficiency is influenced by extraction time, temperature, method, solvent, and phytochemical composition (Elboughdiri, 2018; Ida Madiha et al., 2017). Because methanol has a boiling point of 65 °C, it is commonly used as a solvent in maceration. In comparison, ethanol has a boiling point of 78 °C, and ethyl acetate has a boiling point of 77.1 °C (Nawaz et al., 2020). As a result, the temperature used to evaporate the resulting extract with methanol solvent is not too high, reducing the risk of overheating and destroying the secondary metabolite content of the extract. As a result, the time needed to evaporate the sample is relatively short.
3.2 Fractionation and antibacterial activity
Fractionation was accomplished through column chromatography with silica gel as the stationary phase and combined solution as the mobile phase. The mobile phases in the fractionation mixtures were hexane, ethyl acetate, and methanol solvents with increasing polarity. Table 1 shows the T. cordifolia stem extract fractionation results and the eluent ratio after combining based on similarities in TLC spots. Methanol produced the highest yield (21.94%), followed by ethyl acetate (10.40%). The type, composition, and activities of the extracted phytochemicals were influenced by the polarity of the solvent used in extraction and fractionation (Nawaz et al., 2020). Ethyl acetate is a semipolar solvent (index polarity of 4.4) that can dissolve alkaloids, flavonoids, sterols, and terpenoids. Methanol is polar (with an index polarity of 5.1). It can dissolve polar compounds, such as amino acids, flavones, flavonoids, glycosides, polyphenols, saponins, phenolic compounds, tannins, and terpenoids (Sri Widyawati et al., 2014). Furthermore, hexane is nonpolar but can dissolve lignin, lipids, terpenoids, and sterols (Sri Widyawati et al., 2014). This result demonstrates that T. cordifolia contains more phytochemicals with polar properties.
Component
Eluent
Weight (mg)
Yield (%)
Fraction 1
n-Hex: AcOEt (3:1)
82.2
0.66
Fraction 2
n-Hex: AcOEt (2:1)
121.1
0.97
Fraction 3
n-Hex: AcOEt (1:1)
177.4
1.42
Fraction 4
n-Hex: AcOEt (1:1)
288
2.30
Fraction 5
n-Hex: AcOEt (1:2)
149.4
1.20
Fraction 6
n-Hex: AcOEt (1:2)
628.9
5.03
Fraction 7
n-Hex: AcOEt (1:2)
79.6
0.64
Fraction 8
n-Hex: AcOEt (0:1)
1300.4
10.40
Fraction 9
n-Hex: AcOEt (0:1)
336.9
2.70
Fraction 10
n-Hex: AcOEt (0:1)
16.1
0.13
Fraction 11
AcOEt: MeOH (9:1)
319.3
2.55
Fraction 12
AcOEt: MeOH (8:2)
243.3
1.95
Fraction 13
AcOEt: MeOH (8:2)
532.9
4.26
Fraction 14
AcOEt: MeOH (7:3)
471
3.77
Fraction 15
AcOEt: MeOH (1:1)
957.5
7.66
Fraction 16
AcOEt: MeOH (0:1)
2742.9
21.94
Additionally, the flow velocity influences the fractionation process, which is affected by gravity, the polarity of the eluent, and the density of the stationary phase (silica gel) (Ravisankar et al., 2019; Pirrung et al.; 2018). In addition, the resulting fractions were subjected to an antibacterial test to determine their antibacterial activity level and the fraction's minimal inhibitory concentration. Table 2 displays the antibacterial activity of T. cordifolia stem extract fractions against P. aeruginosa bacteria. According to the antibacterial activity results, the 1st and 2nd fractions exhibited the lowest minimum inhibitory concentration (MIC) values (140 and 156 µg/mL). In contrast, the minimum inhibitory concentration (MIC) of positive control (tetracycline and ampicillin) was 3.9 µg/mL. The MIC values of the 1st and 2nd fractions are close to those of the positive control, indicating that the 1st and 2nd fractions possess a potent inhibitory effect; consequently, they were isolated for the subsequent processes.
Component
Concentration (µg/mL)
MIC
MBC
Crude extract
3293.75
>6587.5
Fraction 1
140.625
>128.25
Fraction 2
156.25
>312.5
Fraction 3
284.375
>568.75
Fraction 4
1325
2650
Fraction 5
1500
3000
Fraction 6
3562.5
7125
Fraction 7
1312.5
2625
Fraction 8
1868.75
3737.5
Fraction 9
1762.5
>3525
Fraction 10
1006.25
>2012.5
Fraction 11
3387.5
6775
Fraction 12
1125
>2250
Fraction 13
2875
5750
Fraction 14
4437.5
8875
Fraction 15
2850
5700
Fraction 16
4825
9650
Positive control (tetracyclin)
3.9
7.8
Positive control (ampicillin)
3.9
7.8
Negative control (methanol)
–
–
3.3 Total phenolic and flavonoid contents
The Folin-Ciocalteu and colorimetric aluminium chloride (AlCl3) methods were used to determine the increase in the content of these two phytochemicals (phenolic and flavonoids) in the active fraction. The TPC and TFC values of the initial extract increased significantly, according to the results in Table 3.
Component
TPC (GAE/g, %)
TFC (QE/g, %)
Crude extracts
(50% methanol)6.56 ± 0.17
0.33 ± 0.04
Active fraction
38.44 ± 0.24
79.46 ± 1.00
The total phenolic content and bioactive properties of extracts significantly impact their antioxidant and antimicrobial activities (Sukiman et al., 2022). Studies have shown that an increase in the phenolic content of plant extracts leads to an increase in antioxidant and antibacterial activity (Kadir, 2021). Correlation studies of phytochemical content on biological activity were also conducted in the T. crispa stem extracts (Sukiman et al., 2022). Based on the TPC and TFC values, it is highly probable that the active fraction belongs to the phenol group and is responsible for antibacterial activities. Therefore, isolation and further analysis are needed to obtain the active compound and its molecular structure.
3.4 LCMS of active fractions
The analysis result of liquid chromatography-mass spectrophotometry (LCMS) for the active fraction is presented in Fig. 2.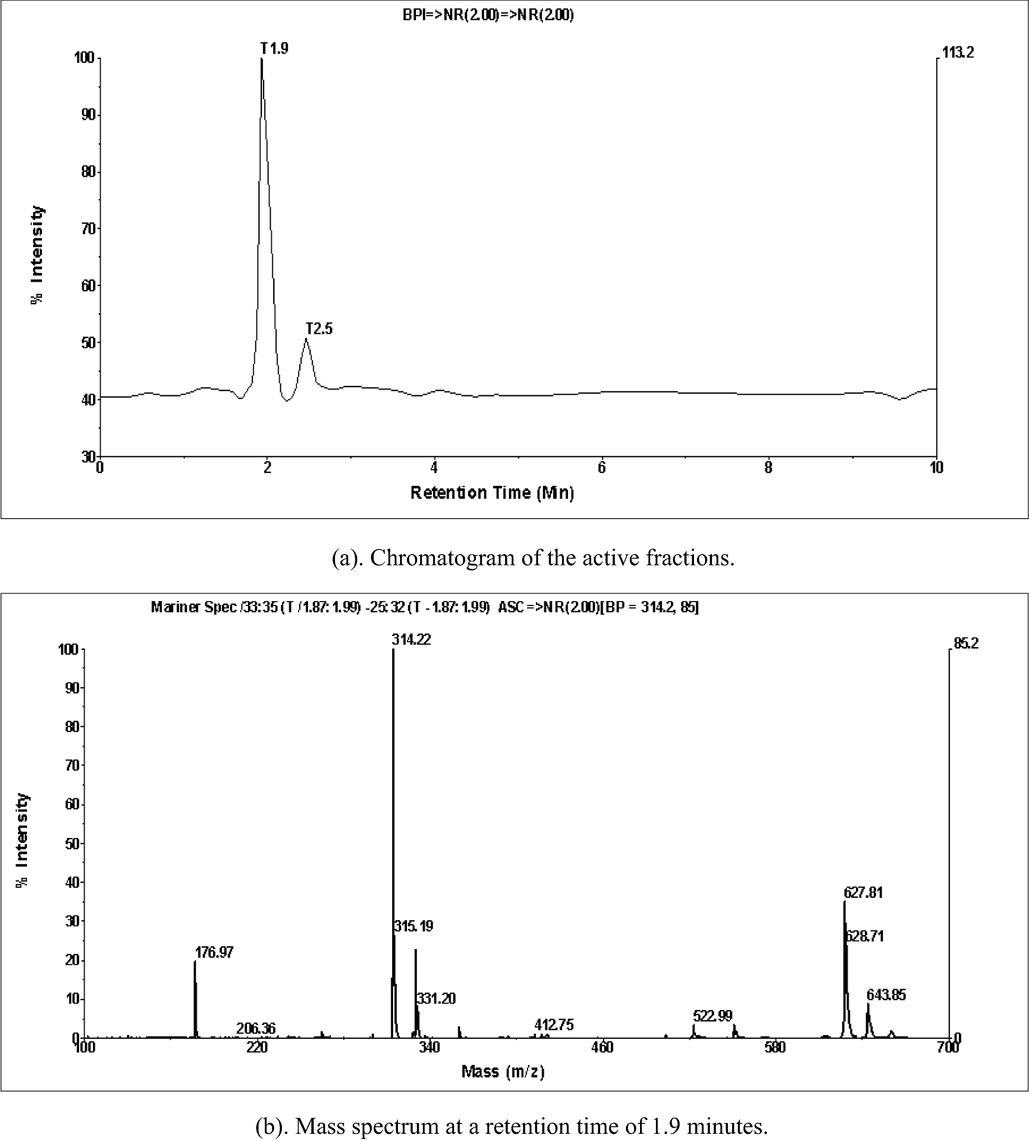
Results of LCMS analysis for active fractions.
The active fraction chromatogram results are shown in Fig. 2, and there is a peak with a high intensity at a retention time of 1.9 min. At 1.9 min of retention time, a dominant (high) spectrum, m/z 314.22 (M + H)+, indicates a molecular weight of 313.22. Previous researchers reported that the m/z spectrum of 312.1235 (M−H)+ indicated the compound N-trans-feruloyltyramine (Khan et al., 2021). Another study found an N-feruloyl tyramine compound in the 314 (M + H)+ spectrum (Sun et al., 2019). These findings support previous findings that the T. cordifolia plant contains the compound N-trans-feruloyltyramine, also known as moupinamide, with a molecular weight of 313.13141 (Royani et al., 2023).
3.5 Isolation of the active Fraction and antibacterial properties
The active fraction was isolated to obtain pure isolates with activity against P. aeruginosa bacteria. Table 4 shows the mass gain results and the eluent ratio used.
Component
Eluent
Weight (mg)
Yield (%)
Sub-Fraction 1
n-Hex: AcOEt (3:1)
6
6.35
Sub-Fraction 2
n-Hex: AcOEt (2:1)
5.5
5.82
Sub-Fraction 3
n-Hex: AcOEt (1:1)
4.7
4.97
Sub-Fraction 4
n-Hex: AcOEt (1:2)
5.2
5.50
Sub-Fraction 5
n-Hex: AcOEt (0:1)
40.2
42.54
Sub-Fraction 6
AcOEt: MeOH (9:1)
6.4
6.77
Sub-Fraction 7
AcOEt: MeOH (8:2)
3
3.17
Sub-Fraction 8
AcOEt: MeOH (7:3)
3.6
3.81
Sub-Fraction 9
AcOEt: MeOH (1:3)
3.2
3.39
Sub-Fraction 10
AcOEt: MeOH (0:1)
14.3
15.13
Based on the similarity of the TLC plate results, ten subfractions were obtained from the isolation process. The fifth subfraction showed the highest mass gain (40.2 mg) of approximately 42.5%. The 7th fraction exhibited the lowest mass gain (about 3 mg) and is indicated as a pure compound with a single TLC spot, as shown in Fig. 3.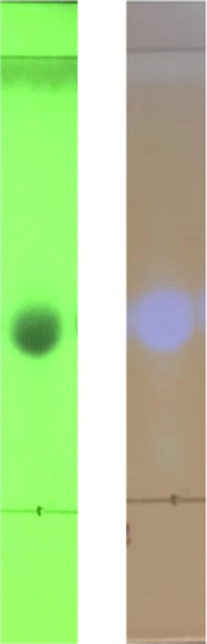
Spot TLC isolate results under UV lamp 254 and 366 nm of T. cordifolia subfraction 7th.
The subfractions were then subjected to antibacterial tests to determine their activity against bacterial inhibition. Table 5 summarizes the findings of the antibacterial activity test performed on each subfraction against bacteria capable of forming biofilms.
Component
Concentration (µg/mL)
MIC
MBC
Sub-Fraction 1
64
>128
Sub-Fraction 2
64
>128
Sub-Fraction 3
32
>64
Sub-Fraction 4
16
>32
Sub-Fraction 5
64
>128
Sub-Fraction 6
128
>256
Sub-Fraction 7
32
>64
Sub-Fraction 8
32
>64
Sub-Fraction 9
42.5
>85
Sub-Fraction 10
Not detected
Not detected
Positive control (tetracyclin)
3.9
7.8
Negative control (methanol)
–
–
The results of the antibacterial activity revealed that the minimum inhibitory concentration (MIC) values ranged from 16 to 128 µg/mL with varying minimum bacterial concentration (MBC) values, as shown in Table 5. Antibacterial activity from the subfraction results tended to be much stronger than that of the fractions and extracts, which could occur because the secondary metabolite content in the subfraction was purer, which significantly impacted its activity. In addition to the bacterial test, pure isolates were analysed with FT-IR, 1H NMR, and 13C NMR to determine their molecular structure.
3.6 Identification of bioactive compounds
The 1H NMR and 13C NMR spectra of the pure isolate are shown in Fig. 4 and Table 6, respectively. The results of the 1H NMR spectrum of the isolate indicate that there are two aromatic rings, namely, the substitution at 1–4 (A2B2) on the benzene ring, in which the two signals overlap because they are symmetrical, namely, at δH 6.72 (2H, d, 8 Hz) and δH 7.06 (2H, d, 8 Hz). The aromatic ring with the ABX system (trisubstituted at C 1, 3, and 4) at δH 6.79 (d, 8 Hz), 7.01 (dd, 1.5; 8 Hz), and 7.15 (d, 1.5 Hz). Trans double bonds were detected at δH 6.40 (d, 16 Hz) and 7.42 (d, 16 Hz), and CH2-CH2 groups were detected at δH 2.75 (2H, t, 7 Hz) and 3, 47. (2H, t, 7 Hz). In addition to a methoxy group (—OCH3) at 3.87 (s), as summarized in the structure shown in Fig. 4. The 1H NMR and 13C NMR (Table 6) spectral data are consistent with published data (Al-Taweel et al., 2012; Jiang et al., 2015; Marques et al., 2022).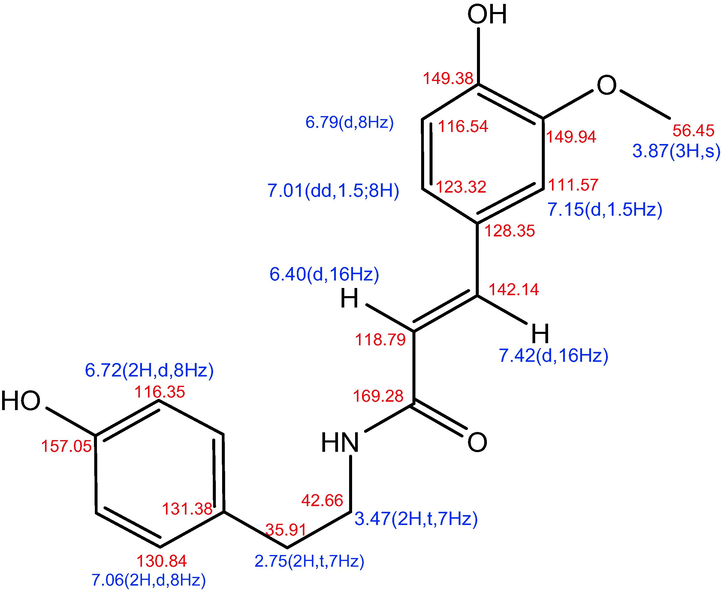
Analysis of isolated bioactive compounds (N-(4-hydroxy-3-methoxy-E-cinnamoyl)-4-(2-aminoethyl) phenol) with HMQC.
Position
Isolate in this study
(500 MHz in CD3OD)Reference (Al-Taweel et al., 2012)
(500 MHz in CD3OD)Reference (Jiang et al., 2015)
(150 and 600 MHz in CD3OD)Reference (Marques et al., 2022)
(50 and 200 MHz in CD3OD)
δ13C
δ1H
δ13C
δ1H
δ13C
δ1H
δ13C
δ1H
1
C
128.35
128.2
128.5
128.22
2
CH
111.57
7.15 (d, 1.5 Hz)
111.5
7.13 (d, 1H, 1.2 Hz)
111.8
7.12 (1H, d, 1.8 Hz
111.45
7.04 (brd, 1H, 8 Hz)
3
C
149.94
149.3
149.5
149.87
4
C
149.38
149.8
150.0
149.22
5
CH
116.54
6.79 (d, 8 Hz)
116.4
6.81 (d, 1H, 8.5 Hz)
116.7
6.81 (1H, d, 8.4 Hz)
116.43
6.79 (d, 1H, 8 Hz)
6
CH
123.32
7.01 (dd, 1.5; 8 Hz)
123.2
7.048 (dd, 1.2; 8.5 Hz)
123.4
7.03 (1H, dd, 1.8 Hz)
123.21
7.03 (bs, 1H)
7
CH
142.14
7.42 (d, 16 Hz)
142.0
7.44 (d, 1H, 15.5 Hz)
142.4
7.46 (1H, d, 15.6 Hz)
142.02
7.43 (d, 15.8 Hz)
8
CH
118.79
6.40 (d, 16 Hz)
118.7
6.41 (d, 1H, 15.5 Hz)
118.9
6.42 (1H, d, 15.6 Hz)
118.69
6.4 (d, 1H, 15.8 Hz)
9
C
169.28
169.2
169.4
169.15
1′
C
131.38
131.3
131.5
131.26
2′, 6′
2 CH
130.84
7.06 (2H, d, 8 Hz)
130.7
7.07 (d, 2H, 8.4 Hz)
131.0
7.06 (2H, dd, 2.4 Hz)
130.73
7.10 (2H, d, 8 Hz)
3′, 5′
2 CH
116.35
6.72 (2H, d, 8 Hz)
116.2
6.73 (d, 2H, 8.4 Hz)
116.5
6.74 (2H, dd, 2.4 Hz)
116.24
6.71 (d, 2H, 8.4 Hz)
4′
C
157.05
156.9
157.1
156.86
7′
CH2
35.91
2.75 (2H, t, 7 Hz)
35.8
2.76 (t, 2H, 7.5 Hz)
36.0
2.77 (2H, t, 7.2 Hz)
35.88
2.74 (2H, t, 6.9 Hz)
8′
CH2
42.66
3.47 (2H, t, 7 Hz)
42.5
3.47 (t, 2H, 7.5 Hz)
42.7
3.48 (2H, t, 7.2 Hz)
42.54
3.46 (2H, t, 6.9 Hz)
OCH3
56.45
3.87 (3H, s)
56.4
3.85 (3H, s)
56.6
3.89 (3H, s)
56.33
3.87 (3H, s)
According to the specific results of 1H NMR and 13C NMR spectral data, this isolate was identified as N-(4-hydroxy-3-methoxy-E-cinnamoyl)-4-(2-aminoethyl) phenol, the synonym of which is 4-(2-aminoethyl) N-trans-feruloyltyramine and moupinamide, with the structure shown in Fig. 4. This compound has never been reported in T. cordifolia previously. However, N-trans-Feruloyltyramine has been isolated from other species, including Smilax aristolochiifolia (Amaro et al., 2014), Polyalthia suberosa (Soi-ampornkul et al., 2022), Solanum procumbens (Solanaceae) (Tran et al., 2019), Datura metel (Xu et al., 2018), and Bassia indica (Othman et al., 2021). This assumption was supported by the results of the 13C NMR spectrum measurements (Table 6) and the H and C correlation measurements (HMQC), as shown in Fig. 4 and Table 6.
Then, as shown in Fig. 5, the results are supported by HMBC long-range correlation, which can determine the position of the chemical movement value in the molecular structure. The primary correlation of HMBC also reveals two aromatic rings on the benzene ring (at δH 6.72 (2H, d, 8 Hz) and 7.06 (2H, d, 8 Hz)) as well as aromatic rings at δH 6.79 (d, 8 Hz), 7.01 (dd, 1.5; 8 Hz), and 7.15 (dd, 1.5; 8 Hz) (d, 1.5 Hz). Furthermore, trans double bonds were discovered at δH 6.49 (d, 16 Hz) and 7.42 (d, 16 Hz), as well as the presence of CH2-CH2 groups at δH 2.75 (2H, t, 7 Hz) and 3.47 (d, 16 Hz) (2H, t, 7 Hz). The long-range correlation coupling in the HMBC spectrum between the signal (3H, 3.87, s) and C at 149.94 can be used to determine the position of the methoxy group at C-3.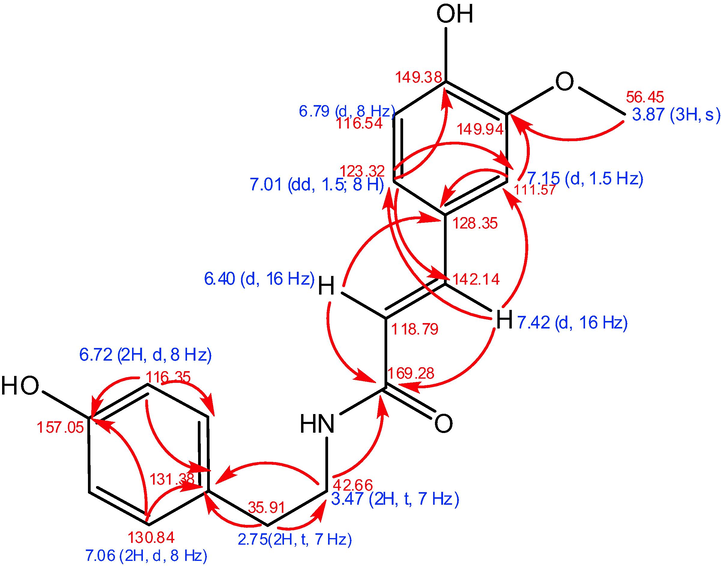
Chemical shift value and summary HMBC correlation for an isolate from T. cordifolia.
Fig. 6 shows the FT-IR spectrum of the T. cordifolia isolates, which confirms the presence of the Moupinamide compound. Significant absorption bands at 3350–3300 cm−1 (N—H bending) and 1651 cm−1 (C⚌O stretch) in the IR spectra of the isolate indicate the amide function. An aromatic group was present, as evidenced by absorption at 1588 cm−1 and between 880 and 680 cm−1. It was also identified that in this isolate, the aliphatic functional group (CH2) at 3010 cm−1, carbonyl (C⚌O) at 1700 cm−1, and ester at 1210 cm−1.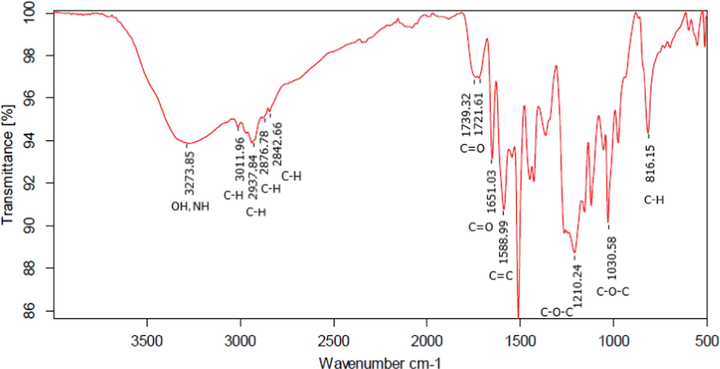
FT-IR spectra of isolate results from T. cordifolia.
The results of the antibacterial test of pure isolates versus crude extracts and active fractions, as illustrated in Fig. 7, indicate that the isolates are promising against the biofilm bacterium P. aeruginosa. The antibacterial activity was relatively high against P. aeruginosa, with a minimum inhibitory concentration of 32 µg/mL, as demonstrated by the bacterial test data. Furthermore, the MIC results in Fig. 7 support the relationship between phenolic and flavonoid content and antibacterial activity. The antibacterial activity increases with increasing concentrations of TPC and TFC in the active fraction of the crude extract (Table 3).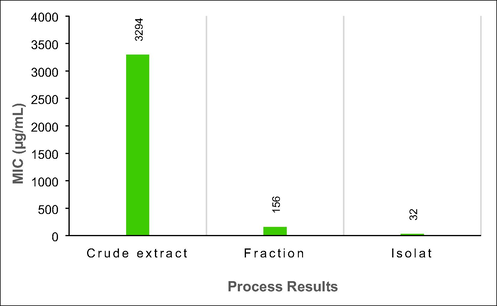
Comparison of MIC values for crude extracts, active fractions, and isolates from T. cordifolia plants.
Several studies have shown that moupinamide or N-trans feruloyltyramine (NTF) compounds isolated from plants show various bioactivities, such as Liriope muscari (Liliaceae), which exhibits antioxidant activity (Li et al., 2012), and Celtis africana, which possesses anti-inflammatory and antioxidant activity (Al-Taweel et al., 2012). Other studies have discovered that N-trans feruloyltyramine from the fruit of Lycium barbarum can potentially be a neuroprotective and neurogenic agent for age-related brain diseases (Khan et al., 2021). Sidastrum paniculatum was effective against Aedes aegypti L (Marques et al., 2022). Piper wallichii has been shown to exhibit antibacterial pathogenic activity (Nongmai et al., 2022). Based on the data and some literature, it appears that moupinamide is responsible for the antibacterial activity of the plant extracts and isolates investigated in this study.
4 Conclusions
Bioactive compounds were successfully isolated from T. cordifolia stems through extraction, fractionation, and isolation. The minimum inhibitory concentration (MIC) values were 3294, 156, and 32 µg/mL for the crude extract, active fraction, and isolate of T. cordifolia, respectively. The total phenol active fraction was 38.44 mg GAE/g, while the total flavonoid content was 79.46 mg QE/g. The isolated bioactive compound confirmed by NMR and FT-IR spectroscopy is N-trans-feruloyltyramine or moupinamide, with a molecular ion weight of 314 M/Z (M + H)+. Compounds isolated from this plant exhibit significant antimicrobial activity. The isolated compound moupinamide could be responsible for the high antibacterial activity against P. aeruginosa bacteria. Our findings indicate that the bioactive isolate from T. cordifolia is a great potential source of green material with the prospect of inhibiting the biofilm of P. aeruginosa, which is responsible for microbial corrosion. Before using this component as a green antimicrobial biocide, the anti-biocorrosion performance on metals must be evaluated.
Author contributions
A.R. proposed and conceptualized the research, designed, and performed experiments, analysed the data, and drafted, reviewed, and final-edited the manuscript. M.H. interpreted the NMR data and reviewed and edited the manuscript. P.D.N.L. extracted and isolated the bioactive compounds. M.E.P. assessed antibacterial activity. C.V. advised, reviewed, and edited the manuscript. A.M. supervised, advised, and reviewed the manuscript. A.A advised and reviewed the manuscript. All authors have read, reviewed, and approved the manuscript.
6 Data supporting
The original contributions made in the study have been included in both the article and supplementary material. Any queries concerning the information that has been decoded can be directed to the corresponding author.
Acknowledgements
This work was supported by the University of Indonesia through the “Hibah Publikasi Terindeks Internasional (PUTI) 2022” programs under contract number NKB-1451/UN2. RST/HKP.05.00/2022. The authors also appreciate the National Research and Innovation Agency (BRIN) for its support of laboratory facilities.
References
- Tinospora Crispa (L.) Hook. f. & Thomson: a review of its ethnobotanical, phytochemical, and pharmacological aspects. Front. Pharmacol.. 2016;7(59):1-19.
- [CrossRef] [Google Scholar]
- Bioactive phenolic amides from Celtis Africana. Molecules. 2012;17(3):2675-2682.
- [CrossRef] [Google Scholar]
- Hypoglycemic and hypotensive activity of a root extract of Smilax Aristolochiifolia, Standardized on N-Trans-Feruloyl-Tyramine. Molecules. 2014;19(8):11366-11384.
- [CrossRef] [Google Scholar]
- Estimation of total flavonoid content in propolis by two complementary colometric methods. J. Food Drug Anal.. 2002;10(3):178-182.
- [CrossRef] [Google Scholar]
- Effect of time, solvent-solid ratio, ethanol concentration and temperature on extraction yield of phenolic compounds from olive leaves. Eng. Technol. Appl. Sci. Res.. 2018;8(2):2805-2808.
- [CrossRef] [Google Scholar]
- Effects of extraction conditions on yield, total phenolic contents and antibacterial activity of Methanolic Cinnamomum Zeylanicum Blume leaves extract. Int. Food Res. J.. 2017;24(2):779-786.
- [Google Scholar]
- Anaerobic Corrosion of 304 stainless steel caused by the pseudomonas aeruginosa biofilm. Front. Microbiol.. 2017;8(2335):1-9.
- [CrossRef] [Google Scholar]
- N-Trans-Feruloyltyramine Inhibits LPS-Induced NO and PGE2 Production in RAW 264.7 Macrophages: involvement of AP-1 and MAP Kinase Signalling Pathways. Chem. Biol. Interact.. 2015;235:56-62.
- [CrossRef] [Google Scholar]
- Statistical evaluation of main extraction parameters in twenty plant extracts for obtaining their optimum total phenolic content and its relation to antioxidant and antibacterial activities. Food Sci. Nutr.. 2021;9(7):3491-4349.
- [CrossRef] [Google Scholar]
- Potential of N-Trans Feruloyl Tyramine from Lycium Barbarum Fruit Extract on Neurogenesis and Neurotrophins; Targeting TrkA/ERK/CREB Signaling Pathway. J. Funct. Foods. 2021;80(104432):1-9.
- [CrossRef] [Google Scholar]
- Mitigation of microbiologically influenced corrosion of 304L stainless steel in the presence of pseudomonas aeruginosa by Cistus Ladanifer leaves extract. Int. Biodeter. Biodegr.. 2018;133:159-169.
- [CrossRef] [Google Scholar]
- Phenolic compounds and antioxidant activities of Liriope Muscari. Molecules. 2012;17(2):1797-1808.
- [CrossRef] [Google Scholar]
- Mechanistic microbiologically influenced corrosion modeling—A review. Corros. Sci.. 2019;146:99-111.
- [CrossRef] [Google Scholar]
- Sidastrum Paniculatum (L.) Fryxell (Malvaceae): A Promising Source of Bioactive Sulfated Flavonoids Against Aedes Aegypti L. Front. Pharmacol.. 2022;12(760156):1-13.
- [CrossRef] [Google Scholar]
- Effect of solvent polarity on extraction yield and antioxidant properties of phytochemicals from bean (Phaseolus Vulgaris) seeds. Braz. J. Pharm. Sci.. 2020;56(e17129):1-9.
- [CrossRef] [Google Scholar]
- Polyphosphate performance for inhibiting corrosion of heat exchanger materials. Int. J. Corrosion Scale Inhibition. 2020;9(2):745-756.
- [CrossRef] [Google Scholar]
- Chemical constituents and antibacterial activity from the stems and leaves of Piper Wallichii. J. Asian Nat. Prod. Res.. 2022;24(4):344-352.
- [CrossRef] [Google Scholar]
- Bassiamide A, a New Alkaloid from Xero-Halophyte Bassia Indica Wight. Nat. Prod. Res.. 2021;36(14):3610-4368.
- [CrossRef] [Google Scholar]
- Allium Sativum (Garlic Extract) as a green corrosion inhibitor with biocidal properties for the control of MIC in carbon steel and stainless steel in oilfield environments. Int. Biodeter. Biodegr.. 2018;132:66-73.
- [CrossRef] [Google Scholar]
- Glycyrrhiza Glabra extract as an eco-friendly inhibitor for microbiologically influenced corrosion of API 5LX carbon steel in oil well produced water environments. J. Mol. Liq.. 2021;333
- [CrossRef] [Google Scholar]
- Chromatographic parameter determination for complex biological feedstocks. Biotechnol. Prog.. 2018;34(4):1006-1018.
- [CrossRef] [Google Scholar]
- The antibacterial and antibiofilm potential of Paederia Foetida Linn. leaves extract. J. Appl. Pharm. Sci.. 2022;12(10):117-124.
- [CrossRef] [Google Scholar]
- Microbiologically influenced corrosion of Cu by nitrate reducing marine bacterium Pseudomonas Aeruginosa. J. Mater. Sci. Technol.. 2020;47:10-19.
- [CrossRef] [Google Scholar]
- Phytochemical analysis and biological studies of Indian medicinal plants Myristica Fragrans and Tinospora Cordifolia. Int. J. Adv. Res.. 2016;4(5):245-258.
- [CrossRef] [Google Scholar]
- Fundamental chromatographic parameters. Int. J. Pharm. Sci. Rev. Res.. 2019;55(2 (9)):46-50.
- [Google Scholar]
- Prospect of plant extracts as eco-friendly biocides for microbiologically influenced corrosion: a review. Int. J. Corrosion Scale Inhibition. 2022;11(3):862-888.
- [CrossRef] [Google Scholar]
- The potential of Tinospora Cordifolia extracts as antibacterial material against pseudomonas Aeruginosa. Trends Sci.. 2023;20(1):1-13.
- [CrossRef] [Google Scholar]
- Natural antifouling compound production by microbes associated with marine macroorganisms — A review. Electron. J. Biotechnol.. 2016;21:26-35.
- [CrossRef] [Google Scholar]
- Chemistry and Pharmacology of Tinospora Cordifolia. Nat. Prod. Commun.. 2017;12(2):299-308.
- [CrossRef] [Google Scholar]
- Analysis of total phenols and other oxidation substrates and antioxidants by means of Folin-Ciocalteu reagent. Methods Enzymol.. 1999;299:152-178.
- [CrossRef] [Google Scholar]
- N-Trans-Feruloyltyramine Protects Human Neuroblastoma SK-N-SH Cell Line Against H2O2-Induced Cytotoxicity. Nat. Prod. Commun.. 2022;17(8):1-8.
- [CrossRef] [Google Scholar]
- Optimization of ultrasound-assisted extraction of Tinospora Crispa Stem, phytochemical screening, total phenolic content and anti gout potential activity. Pharmacognosy J.. 2022;14(2):308-314.
- [CrossRef] [Google Scholar]
- Glucosylation of the Phytoalexin N-feruloyl Tyramine modulates the levels of pathogen-responsive metabolites in Nicotiana Benthamiana. Plant J.. 2019;100:20-37.
- [CrossRef] [Google Scholar]
- Azadirachta Indica leaves extract as inhibitor for microbial corrosion of copper by Arthrobacter Sulfureus in neutral PH conditions-a remedy to blue green water problem. J. Taiwan Inst. Chem. Eng.. 2016;64:269-278.
- [CrossRef] [Google Scholar]
- Chemical constituents from methanolic extract of Solanum Procumbens Lour (Solanaceae) Vietnam J. Sci. Techno. Eng.. 2019;61(3):9-11.
- [CrossRef] [Google Scholar]
- An overview on plant extracts as environmental sustainable and green corrosion inhibitors for metals and alloys in aggressive corrosive media. J. Mol. Liq.. 2018;266:577-590.
- [CrossRef] [Google Scholar]
- Maximizing Total Phenolics, total flavonoids contents and antioxidant activity of Moringa Oleifera Leaf extract by the appropriate extraction method. Ind. Crop. Prod.. 2013;44:566-571.
- [CrossRef] [Google Scholar]
- Difference of solvent polarity to phytochemical content and antioxidant activity of Pluchea Indicia less leaves extracts. Int. J. Pharmacognosy Phytochem. Res.. 2014;6(4):850-885.
- [Google Scholar]
- Metabolites Identification of Bioactive Compounds Daturataturin A, Daturametelin I, N-Trans-Feruloyltyramine, and Cannabisin F from the Seeds of Datura Metel in Rats. Front. Pharmacol.. 2018;9(731):1-9.
- [CrossRef] [Google Scholar]
- Anticholinesterase inhibitory activity of quaternary alkaloids from Tinospora Crispa. Molecules. 2014;19(1):1201-1211.
- [CrossRef] [Google Scholar]
Appendix A
Supplementary material
Supplementary data to this article can be found online at https://doi.org/10.1016/j.arabjc.2023.105014.
Appendix A
Supplementary material
The following are the Supplementary data to this article:Supplementary Data 1
Supplementary Data 1


