

Translate this page into:
Light intensity plays the key role in the regulation of leaf color, anthocyanin and polyphenol profiles, as well as antioxidant activity of Photinia × fraseri leaves
⁎Corresponding authors at: Jiangxi Provincial Key Laboratory of Natural Active Pharmaceutical Constituents, College of Chemical and Biological Engineering, Yichun University, Xuefu Road No. 576, Yuanzhou District, Yichun 336000, China. yanglingguangxdjqz@163.com (Lingguang Yang), happy62889@126.com (Peipei Yin)
-
Received: ,
Accepted: ,
This article was originally published by Elsevier and was migrated to Scientific Scholar after the change of Publisher.
Abstract
Abstract
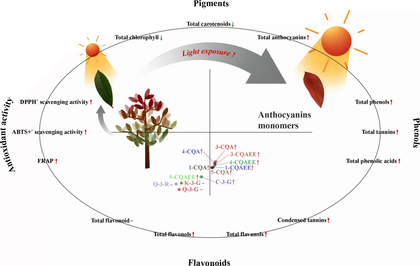
Photinia × fraseri is an important ornamental plant species widely cultivated in China with vibrant leaf color. However, there is limited information about the difference of phenolic constituents and bioactivity among P. fraseri leaves (PFL) with varied color, and the key factor which determines its color formation. Therefore, the aim of the present study was devoted to establishing the correlation among leaf color, anthocyanins and polyphenols profiles, together with antioxidant activity of PFL under varied light intensity. Results of color and pigment analysis on the four PFL groups indicated that total anthocyanins content was positively correlated with red color formation. Meanwhile, red leaves further exhibited a higher level of total anthocyanins (0.66 ± 0.02 mg/g), phenols (24.86 ± 1.33 mg/g), tannins (6.98 ± 0.23 mg/g), phenolic acids (73.60 ± 3.56 mg/g), condensed tannins (131.24 ± 5.51 mg/g), flavanols (3.42 ± 0.03 mg/g), flavonols (57.58 ± 0.19 mg/g), and antioxidant activities (0.17 ± 0.00 mmol/g for DPPH, 0.99 ± 0.06 mmol/g for ABTS, 1.73 ± 0.03 mmol/g for FRAP). Furthermore, a total of 11 phenolic compounds were identified from PFL, while caffeoylquinic acid derivatives and cyanidin-3-O-glucoside were the key phenolic compounds rich in red leaves. Principal component, hierarchical cluster, and correlation analysis indicated that high light intensity was the key factor responsible for the red color formation, as well as the high levels of total anthocyanins, phenolic acids and flavanols and antioxidant activities in the red leaves. Overall, the present study shall contribute to the exploration of the medicinal potential of the important horticultural plant P. fraseri and provide theoretical guidance for its further industrial development and application.
Keywords
Anthocyanin profile
Antioxidant activity
Leaf color
Light intensity
Photinia × fraseri leaves
Principal component analysis

1 Introduction
Standing out for its vibrant leaf coloration and aesthetic appeal, Photinia × fraseri is an evergreen ornamental plant originating from the hybrid of P. glabra and P. serrulate and widely distributing in the sub-tropical and temperate areas of South China and Southeast Asia. Its tender leaves turn red and purple in spring and autumn, and gradually turn green in summer and winter, exhibiting multiple leaf color transition within a year (Mattei et al., 2018){Mattei, 2018 #968}{Mattei, 2018 #968}. As an ornamental plant, P. fraseri also possesses advantages such as fast-growing, high adaptation and resistance, ease of transplantation and shaping, making it an ideal choice for urban landscaping (Kong et al., 2022).
Leaf color is one of the key traits relating to the ornamental value, and its formation was attributed to the content and ratio among plant pigments such as chlorophyll, anthocyanins and carotenoids (Tang et al., 2020). High content of chlorophyll leads to the green color, while carotenoids are often related to the formation of yellow, orange, or red color of leaf (Yang et al., 2015). Anthocyanins, member of the flavonoids, are water-soluble pigments involving in a wide range of color formation including red, purple, and blue. While researches have already reported the existence of anthocyanins in P. fraseri leaves (PFL) (Kytridis and Manetas 2006), their composition and relationship with leaf color have not been thoroughly investigated.
For plants, anthocyanins are of significance in the field of attracting pollinators, protecting ultraviolet irradiation damage, and signaling between plants and microbes (Kaur et al., 2023). Meanwhile, they are also important components of the human diet with a daily intake of 12.5 mg in the United States (Wu et al., 2006), 24.2 mg in Australia, and 37 mg in Asian countries (Gonçalves et al., 2021). Currently, there is a series of evidence demonstrating the roles of anthocyanins in human health as antioxidant, anti-aging, anti-inflammatory, anti-diabetic, anti-cancer, cardiovascular and vascular protection ingredients (Gamel et al., 2020, Kalt et al., 2020, Abdel-Aal et al., 2022, Chen et al., 2022).
Other than anthocyanins, current research indicates that PFL also contains various active components such as phenolic acids, flavonoids, and saponins, which exhibit biological activity potentials. Furthermore, studies have shown that the proanthocyanidins found in PFL can inhibit the activity of tyrosinase in melanoma cells, thereby inducing cell apoptosis, further suggesting significant pharmaceutical potential of PFL (Song et al., 2021). While P. fraseri has a long history of cultivation as an ornamental plant, most of the current research and applications focus on landscaping (Xu et al., 2022, Liu et al., 2023, Mo et al., 2023) and cultivation techniques (Llorente and Larraburu 2013, Zheng et al., 2022), leaving a significant gap in exploring its comprehensive healthy value. A number of research have been conducted to investigate the correlation between leaf color, anthocyanin and phenolic constituents, and bioactivities in basil microgreens (Fayezizadeh et al., 2023), purple pakchoi (Song et al., 2020), and Triadica sebifera (Liu et al., 2024), etc.
One such factor that plays a crucial role in plant physiology is light intensity. Light serves as both an energy source for photosynthesis and a vital regulatory signal for various metabolic pathways within plants. While a number of studies have validated the correlation between leaf color and light intensity in other plants, it is still unclear whether and how light influence the color formation of PFL.
Taken together, the present study aims to explore the correlation between leaf color variation, anthocyanins content, polyphenols levels, and antioxidant activity in PFL under different light intensities. Through systematic analysis, this research seeks to unravel the intricate relationships between these parameters, provide diverse strategies for optimizing leaf coloration during cultivation processes or landscape design involving P. fraseri, and shed light on the medicinal potential of P. fraseri as an ornamental plant.
2 Materials and methods
2.1 Reagents and chemicals
6-hydroxy-2,5,7,8-tetramethylchroman-2-carboxylic acid (Trolox), 2,2′-diphenyl-1-picrylhydrazyl (DPPH), 2,2′-azobis-(3-ethylbenzothiazoline-6-sulfonic acid) (ABTS), Folin-Ciocalteu and gallic acid (GA) were obtained from Shanghai Yuanye Biotechnology Co., Ltd. (Shanghai, China). Vanillin, and catechin were purchased from Shanghai Aladdin Biochemical Technology Co., Ltd. (Shanghai, China). Rutin (RT) was purchased from Beijing Biotopped Technology Co., Ltd. (Beijing, China). Ethanol and methanol were purchased from Tianjin Damao Chemical Reagent Factory (Tianjin, China). All reagents were of analytical grade.
2.2 Plant materials
The PFL were collected in February 2023 from Huachengzhou wetland park (Yichun, China) at an altitude of 96 to 100 m, within a radius of approximately 150 m from the approximate center point (GPS coordinates 27°47′25.2″N 114°21′26.3″E). And the specimen was deposited at the herbarium of Jiangxi Provincial Key Laboratory of Natural Active Pharmaceutical Constituents, Yichun University. About 20P. fraseri shrubs with similar growth ages and cultivation conditions were randomly selected and divided into four groups based on their leaf color: red (R), light red (LR), light green (LG), and green (G) (Fig. 1). And the leaf samples from the morphological upper end of plants in each group were collected in a uniform manner from the four directions (north, south, east, and west). After simple cleaning, the collected leaves other than those for fresh use were dried at 60 °C for 24 h to achieve a constant mass, and the ground leaf powder was passed through a 60-mesh sieve and stored in a −20 °C freezer for preservation.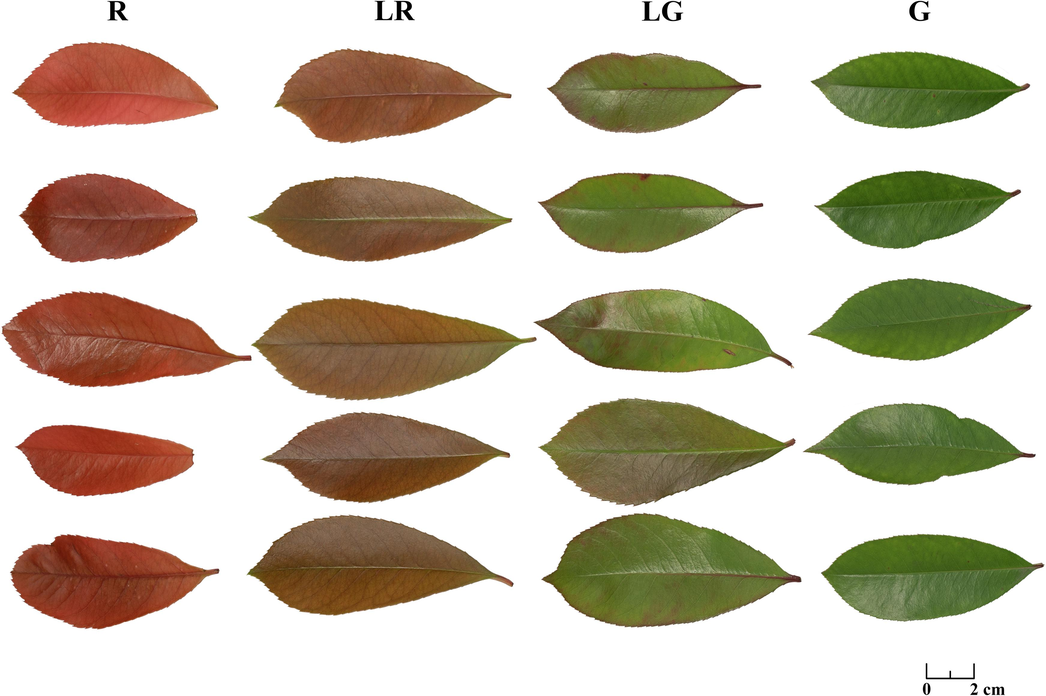
2.3 Leaf color measurement
Leaf color measurement was determined through the method described by Riccardi et al., (2014) with slight modification. Briefly, totally 5 fresh leaves from each color group of the P. fraseri samples were randomly selected for recording digital image. A LED artificial light source was set up in a camera obscura, and a Nikon Z50 camera (Nikon, Japan) equipped with a Nikkor Z 50 mm f/1.8 S lens was used to capture the front view of the leaves in manual mode (f/2.8, 1/30 s, ISO 100). The images were stored in NEF (Nikon's RAW image files) format, transferred to the PC, and analyzed using Adobe Photoshop version 23.02 (Adobe, USA). For each leaf, 3 random points were selected avoiding the leaf veins to read the color. The color parameters of the different color leaves of the P. fraseri were expressed in Lab (8-bit) color space.
2.4 Determination of leaf pigment content
2.4.1 Chlorophyll and carotenoid
To determine the chlorophyll and carotenoids content in the P. fraseri samples, the methanol method based on Mita et al., (1997) was used with some modifications. In brief, 0.2000 g of fresh PFL was homogenized with 2 mL of methanol. After thorough mixing, the mixture was centrifuged at 13,000 × g for 10 min. The supernatant was then analyzed for absorbance at wavelengths of 652 nm, 665 nm, and 470 nm using an Infinite M200 Pro multifunctional microplate reader (Tecan, Switzerland). The chlorophyll and carotenoid contents were expressed as mg/g.
The calculation formula for chlorophyll and carotenoids quantification is as follow:
Chlorophyll a
Ch-a = 16.72OD665 – 9.16OD652
Chlorophyll b
Ch-b = 34.09OD652 – 15.28OD665
Carotenoids
Cx + c = (1000OD470 – 1.63Ch-a – 104.96Ch-b)/221
2.4.2 Anthocyanins
To determine the total anthocyanins content in the P. fraseri samples, the pH-differential method described by Giusti and Wrolstad (2001) was used as a reference with some modifications. In summary, 0.2000 g of fresh PFL was homogenized with a 1 % hydrochloric acid methanol solution in a ratio of 1:100 (w/v). The mixture was thoroughly mixed and kept in the dark at 4 °C for 24 h, and then centrifuged at 13,000 × g for 15 min to collect the supernatant. After that, the supernatant was appropriately diluted with 0.025 M potassium chloride buffer (pH 1.0) and 0.4 M sodium acetate buffer (pH 4.5), respectively. And the absorbance of the supernatant was then measured at 254 and 700 nm using a microplate reader, with cyanidin-3-O-glucoside serving as the standard. The total anthocyanins content was expressed as cyanidin-3-O-glucoside equivalents mg/g, and calculated as below: A = (A254 – A700)pH 1.0 − (A254 – A700)pH 4.5 Total anthocyanin concentrations = (A × MW × DF × V × 1000) / (ε × L × W). where MW is the molecular weight of the standard, DF is the dilution factor, V is the volume of extract solution, ε is the molar absorptivity of the standard, L is the optical path length, and W is the weight of the dry material.
2.5 Extraction of phenolic compounds
Precisely weighed P. fraseri leaf dry powder was mixed with 70 % ethanol containing 1 % hydrochloric acid in a ratio of 1:20 (w/v). The mixture was subjected to ultrasonic extraction using a KQ2200E ultrasonic cleaner (Kunshan Ultrasonic Instruments Co., Ltd., China) in a water bath at 60 °C for 30 min. After the extraction, the filtrate was obtained, and the remaining residue underwent the same extraction process again. The filtrations from the two extractions were combined and concentrated to approximately one-third of the original volume using a rotary evaporator at 25 rpm and 60 °C. The concentrated extract was then dried in a preheated 60 °C constant temperature air blast drying oven for 6 h to obtain the extract. Finally, the extract was collected and stored in sealed centrifuge tubes at −20 °C in a freezer for subsequent biochemical experiments.
2.6 Determination of phenolic contents
2.6.1 Determination of total phenols
To determine the total phenols content, we used the Folin-Ciocalteu method described by Yang et al., (2018). In brief, 40 μL of a 25 % Folin-Ciocalteu reagent solution was mixed with 20 μL of appropriately diluted samples or gallic acid standard solution in a 96-well plate. The mixture was incubated at room temperature in the dark for 5 min, followed by the addition of 140 μL 700 mM Na2CO3 solution. The plate was then shaken at 500 rpm on a shaker for 30 s to ensure thorough mixing. The plate was further incubated at 40 °C in the dark for 30 min. Finally, the absorbance at 765 nm was measured using a microplate reader. The total phenols content was expressed as gallic acid equivalents (GAE) mg/g d.w.
2.6.2 Determination of total tannins
To determine the total tannins content, the phosphomolybdic-tungstic acid reaction based on casein was used, following the method described by Yang et al., (2018) with slight modifications. Briefly, 100 mg of casein was added to a 25 mL sample solution. The mixture was kept in the dark and shaken at 150 rpm on a shaker for 3 h. Afterward, the solution was filtered through a 0.45 μm filter membrane, and the filtrate was used for tannins content determination. The detection method was the same as described above for total phenols compound determination. The results were expressed as GAE mg/g d.w.
2.6.3 Determination of total phenolic acids
To determine the total phenolic acids content, the method described by Barak et al., (2019) was used with some modifications. Briefly, 500 μL of appropriately diluted sample solution and caffeic acid solution were mixed with 500 μL of 0.5 M HCl, 500 μL of Arnova reagent (10 % NaNO2 + 10 % Na2MoO4), 500 μL of 1 M NaOH, and 500 μL of water. The absorbance at 490 nm was measured using a microplate reader, and a standard curve was constructed using the absorbance values of the caffeic acid solution at different concentrations. The total phenolic acids content was expressed as caffeic acid equivalents (CAE) mg/g d.w.
2.7 Determination of flavonoid contents
2.7.1 Determination of total flavonoids
To determine the total flavonoids compound content, the method described by Sumczynski et al., (2015) was used with slight modifications. In brief, 120 μL of appropriately diluted sample solution and rutin standard solution were added to a 96-well plate. Then, 8 μL of a 50 g/L NaNO2 solution was added and mixed thoroughly. The mixture was incubated at room temperature in the dark for 6 min. Next, 8 μL of a 100 g/L AlCl3 solution was added and mixed well. The mixture was incubated at room temperature in the dark for 5 min. Finally, 100 μL of a 40 g/L NaOH solution was added and mixed thoroughly. The plate was incubated at room temperature in the dark for 30 min. The absorbance at 410 nm was measured using a microplate reader. The results were expressed as rutin equivalents (RE) mg/g d.w.
2.7.2 Determination of condensed tannins
To determine the condensed tannins content, the method described by Saad et al., (2014) was used with slight modifications. Firstly, 20 μL of appropriately diluted sample solution and catechin standard solution were added to a 96-well plate. Then, 120 μL of a 4 % vanillin methanol solution was added and mixed thoroughly. The plate was shaken at 200 rpm for 1 min. Next, 60 μL of a 12 mol/L hydrochloric acid standard solution was added and mixed well. The plate was shaken at 200 rpm for 5 min. The mixture was incubated at room temperature in the dark for 15 min. The absorbance at 500 nm was measured using a microplate reader. The condensed tannins content was expressed as catechin equivalents (CE) mg/g d.w.
2.7.3 Determination of total flavonols
To determine the total flavonols content, the method described by Kumaran and Karunakaran (2007) was used with slight modifications. Firstly, 40 μL of rutin solution and appropriately diluted sample solution were mixed with 40 μL of a 20 g/L AlCl3 solution and 120 μL of a 50 g/L sodium acetate solution. The mixture was incubated at 20 °C for 2.5 h. The absorbance at 440 nm was measured using a microplate reader. The results were expressed as RE mg/g d.w.
2.7.4 Determination of total flavanols
To determine the total flavanols content, the method described by Ma et al., (2019) was used. Firstly, 40 μL of catechin solution and appropriately diluted sample solution were mixed with 200 μL of a 0.1 % solution of 4-(dimethylamino) cinnamaldehyde dissolved in 1 mol/L HCl-methanol. The mixture was incubated for 10 min. The absorbance at 640 nm was measured using a microplate reader, and a standard curve was constructed using catechin as the standard. The results were expressed as RE mg/g d.w.
2.8 Determination of antioxidant capacities
2.8.1 DPPḢ scavenging activity
To determine the DPPH radical scavenging activity, the modified method based on Yin et al., (2019) was used. Ultra-pure water was used as a blank control. Firstly, 10 μL of appropriately diluted sample solution and Trolox solution were added to a 96-well plate. Then, 40 μL of freshly prepared 1 mM DPPH methanol solution was added, followed by the addition of 190 μL of methanol. The plate was shaken at 200 rpm for 1 min to ensure thorough mixing. The mixture was then incubated at room temperature in the dark for 30 min. The absorbance was measured at 517 nm using a microplate reader. The DPPH radical scavenging activity of the samples was expressed as Trolox equivalents (TE) mmol/g d.w.
2.8.2 ABTS+̇ scavenging activity
To determine the ABTS radical scavenging activity, the modified method based on Yin et al., (2019) was used. Firstly, a 7 mM ABTS solution and a 2.4 mM K2S2O8 solution were mixed in equal volumes and left at room temperature for 12 ∼ 16 h. The absorbance of the mixture was measured at 734 nm using a UV–visible spectrophotometer, and then adjusted to an absorbance of 0.7 ± 0.02 with methanol to obtain the ABTS working solution. Next, 5 μL of methanol, appropriately diluted sample solution, and Trolox solution were added to a 96-well plate. Then, 200 μL of freshly prepared ABTS working solution was added and mixed thoroughly. The mixture was incubated at room temperature in the dark for 5 min. Finally, the absorbance at 734 nm was measured. The ABTS radical scavenging activity of the samples was expressed as TE mmol/g d.w.
2.8.3 Ferric ion reducing antioxidant power (FRAP)
To determine the reducing power, the modified method described by Yin et al., (2019) was used. Firstly, 100 μL of phosphate buffer (0.2 M, pH 6.6) and 100 μL of 1 % (w/v) potassium ferricyanide solution were added to 40 μL of sample solution or blank solution (distilled water), and incubate in a 50 °C water bath for 20 min. After addition of 50 μL trichloroacetic acid (10 %, w/v), the mixture was incubated at room temperature for 10 min. Subsequently, 100 μL of this mixture was mixed with 100 μL of distilled water and 20 μL of ferric chloride solution (0.1 %, w/v). Finally, the absorbance was measured at 700 nm using a microplate reader. The reducing power is expressed as TE mmol/g d.w.
2.9 UPLC-QTOF-MS/MS analysis
The polyphenol composition of PFL was analyzed using an Agilent 1290 Infinity II Ultra High-Performance Liquid Chromatography (UPLC) system (Agilent, USA) connecting to an Agilent 6545 Quadrupole Time-of-Flight (Q-TOF) mass spectrometer using a Dual AJS ESI ion source in positive ion mode (ESI+). An Agilent C18 column (2.1 × 100 mm, 1.8 μm) was used while UV absorption spectra at 254 nm were collected simultaneously. A 2 μL injection volume was used with a flow rate of 300 μL/min. The mobile phase consisted of water with 0.1 % formic acid aqueous solution (v/v) (A) and acetonitrile (B) under the following gradient program: 0 ∼ 1 min, 5 % B, 1 ∼ 10 min, 5 ∼ 10 % B, 10 ∼ 15 min, 10 ∼ 20 % B, 15 ∼ 30 min, 20 ∼ 28 % B, 30 ∼ 35 min, 28 ∼ 95 % B, 35 ∼ 40 min, 95 % B, 40 ∼ 41 min, 95 ∼ 2 % B, 41 ∼ 45 min, 2 % B. The capillary voltage of the ion source was set at 3500 V, and the drying gas temperature and flow rate were 320 °C and 8 L/min, respectively. Meanwhile, the sheath gas temperature and flow rate were set at 350 °C and 11 L/min, respectively. The nebulizer gas pressure was 35 psi, the cone voltage was 65 V, and the collision energy was set at 25 eV. The scan range was set from 50 to 1500 m/z.
2.10 Construction of molecular networks
ProteoWizard MSConvert GUI 3.0 (ProteoWizard, USA) was first used to convert Agilent MassHunter mass spectrometry data (.d directories) into 32-bit mzML standard data format (.mzML) (Martens et al., 2011, Holman et al., 2014), which was further imported to create a molecular network through the classical online workflow (https://ccms-ucsd.github.io/GNPSDocumentation/) on the GNPS website (https://gnps.ucsd.edu) (Chambers et al., 2012, Wang et al., 2016). The data was filtered by removing all MS/MS fragment ions within +/- 17 Da of the precursor m/z. MS/MS spectra were window filtered by choosing only the top 6 fragment ions in the +/- 50 Da window throughout the spectrum. The precursor ion mass tolerance was set to 0.02 Da and a MS/MS fragment ion tolerance of 0.02 Da. A network was then created where edges were filtered to have a cosine score above 0.7 and more than 6 matched peaks. Further, edges between two nodes were kept in the network if and only if each of the nodes appeared in each other's respective top 10 most similar nodes. Finally, the maximum size of a molecular family was set to 100, and the lowest scoring edges were removed from molecular families until the molecular family size was below this threshold. The spectra in the network were then searched against GNPS' spectral libraries. The library spectra were filtered in the same manner as the input data. All matches kept between network spectra and library spectra were required to have a score above 0.7 and at least 6 matched peaks.
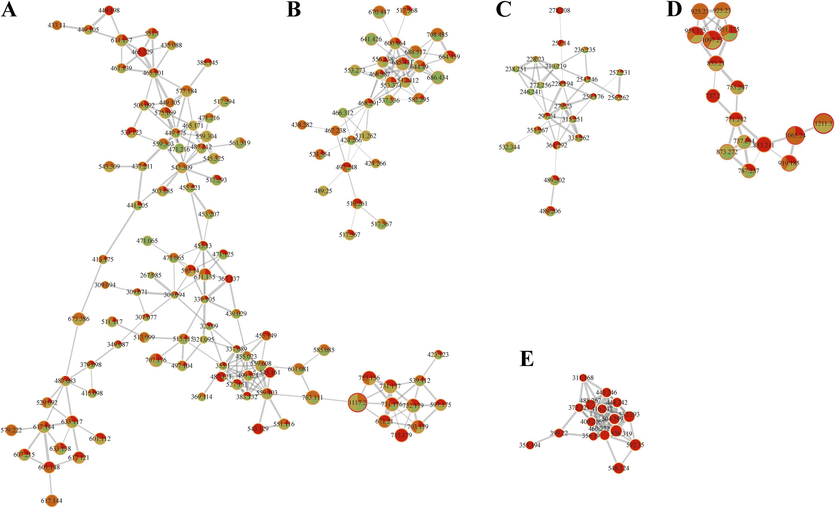
The analysis results were visualized using Cytoscape 3.10.1 software (Cytoscape Consortium, USA) (Shannon et al., 2003). The molecular network diagram can directly show the structural similarities between compounds in an extract, where each node represents a compound, compound molecules with similar structures are clustered in clusters in the molecular network, the thickness of the gray lines connecting nodes indicates the degree of similarity.
2.11 Ambient light illumination
Vertical sampling points are evenly distributed in the growing area of P. fraseri. The ambient illuminance of each leaf color group was recorded at different heights consistent with the vertical sampling point of PFL. On a clear day (June 3, 2023), from 8:00 to 20:00, the ambient light illumination for each group was measured every 2 h using a PP720 illuminometer (Sanliang, China), and expressed in LUX units. Accordingly, the cumulative light illumination (LUX-h) was calculated.
2.12 Data analysis
Significant difference calculation and correlation analysis were performed using IBM SPSS Statistics 28.0 software (IBM, USA). The mass spectrometry data was analyzed and processed using Agilent Technologies Qualitative Analysis 10.0 software (Agilent Technologies, USA). Principal component analysis was conducted using GraphPad Prism 10.1.2 software (GraphPad Software, USA). The experiment was repeated at least three times, and the results were expressed as mean ± standard deviation (SD).
3 Results and discussion
3.1 Color parameter and pigment content analysis
The Lab color model uses Lab coordinates to represent colors, where L* represents lightness, a* represents the red-green hue (positive values for red and negative values for green), and b* represents the yellow-blue hue (positive values for yellow and negative values for blue) (Riccardi et al., 2014). According to the Fig. 2A, it could be observed that the L* and b* values kept steady among the four groups, while the a* values showed a decreasing trend from red to green leaf color, following the order ranked as R > LR > LG > G. This indicated that the color changes in those leaves were mainly reflected by the a* value, which represents the transition in the red-green hue.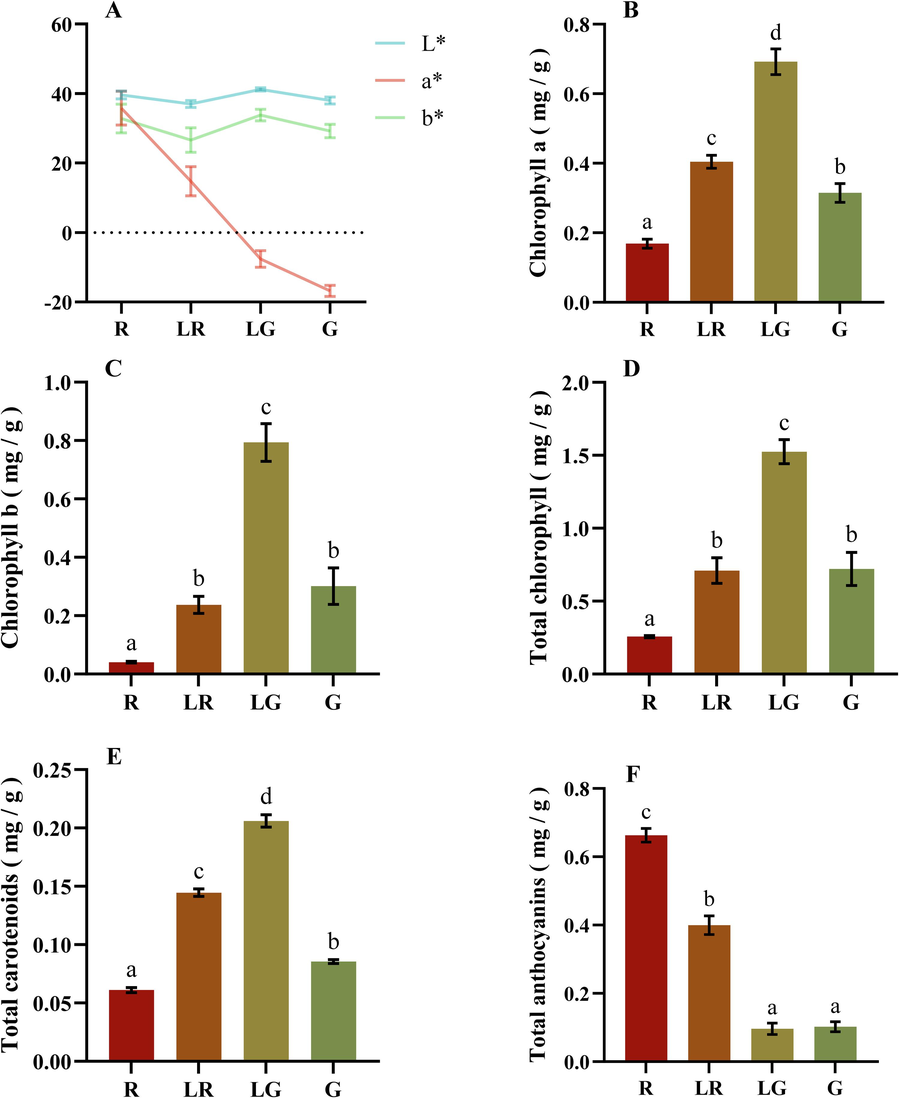
The variation of content and ratio of common pigment in leaves such as chlorophylls, carotenoids, and anthocyanins might be the main reason for the observed variations in the a* values (Tang et al., 2020). To test this hypothesis, the contents of those pigments were determined among the four PFL groups. From Fig. 2B-E, it could be observed that the concentrations of chlorophyll and carotenoid varied among the four groups. From red to green leaves, contents of chlorophyll a, chlorophyll b, total chlorophyll, and carotenoids exhibited a peak-shaped distribution with LG being the highest. The specific order of chlorophyll a and carotenoids content could be ranked as LG > LR > R > G, while the order of chlorophyll b and total chlorophyll content was LG > G≈LR > R. Overall, contents of total chlorophyll in all four groups were much higher than those of total carotenoids, with an at least 4.2-fold variation, indicating a stronger contribution of chlorophyll on the color formation. As for the anthocyanins, Fig. 2F exhibited that anthocyanins content in red leaves was significantly higher than those in other groups, with the specific order as R > LR > LG≈G. Anthocyanins are found to be the main red pigments in leaves, flowers, fruits, and many other parts of ornamental plant (Kalt et al., 2020). Consistent with those previous studies, total anthocyanins content was positively correlated with the a* value in the present study, indicating that anthocyanins were the main contributor of red color formation in PFL. Meanwhile, our data further validated that the ratio, but not the content of plant pigments influenced the leaf color formation. The ratio of carotenoids + anthocyanins /chlorophyll in green leaves was lower than the light green and other leaves, which determined their color formation.
3.2 Phenolic and flavonoid composition analysis
3.2.1 Total phenols, tannins, and phenolic acids contents
To establish the correlation between leaf color and phenolic composition, contents of total phenols, tannins, and phenolic acids were further evaluated in the four PFL groups. As illustrated in Fig. 3A, overall contents of phenols, tannins, and phenolic acids in R were significantly higher than those in other groups. To be specific, total phenols and phenolic acids contents showed a gradual decrease from red to green leaves, with an order as R > LR≈LG≈G. Moreover, the total phenols of PFL in four groups (11.2 ∼ 24.9 mg/g) were significantly higher than those of 15 medicinal plants belonging to the Lamiaceae and Asteraceae family (Sytar et al., 2018). Besides, total tannins content of PFL in four groups were 3.6 ∼ 6.7 mg/g, which was similar with that of common buckwheat (Xiao et al., 2022). And the order of total tannins contents was different from those of total phenols and phenolic acids contents, as follows: R > LG > LR > G. The results above indicated that PFL might be a good source of natural phenols.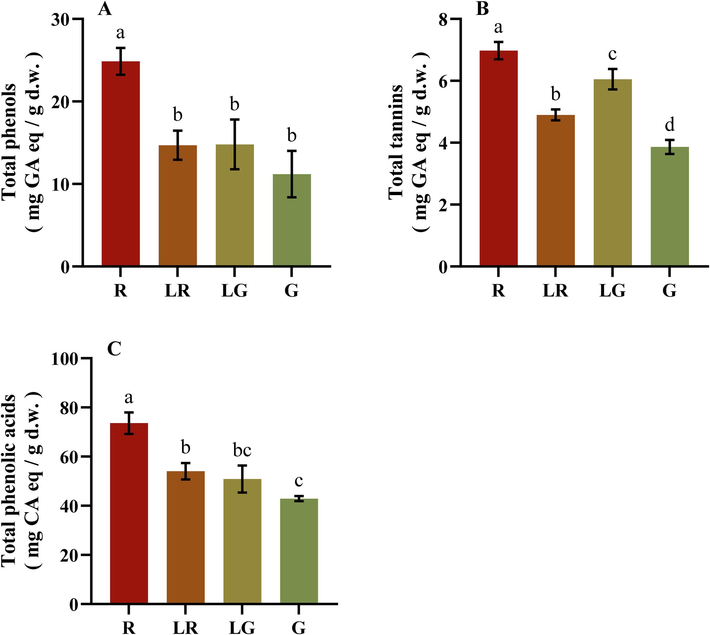
3.2.2 Total flavonoids, flavonols, flavanols, and condensed tannins contents
Flavonoids and phenolic acids are two main groups of natural phenolic compounds (Bagheri et al., 2021), and flavonoids can usually be categorized into flavonols, flavanols, flavones, flavan-3-ols and et al. (Volikakis and Efstathiou 2005). Condensed tannins are oligomeric and polymeric flavan-3-ols, and the most common monomers of condensed tannins are (epi)catechin, (epi)gallocatechin, and (epi)afzelechin (Chai et al., 2018). As shown in Fig. 4A, the content of total flavonoids in four groups exhibited no significant differences, which was different from those of flavonols, flavanols and condensed tannins. As shown in Fig. 4B and C, the contents of flavonols and flavanols in red leaves were the highest and those in green leaves were the lowest, indicating that flavonols and flavanols contents decreased while other types of flavonoids increased in the green color formation of PFL. Moreover, the trend of condensed tannins content was similar to those of total phenols, tannins, phenolic acids, flavonols and flavanols, still indicating that the red leaves contained more phenolic compounds than the green ones (Fig. 4D).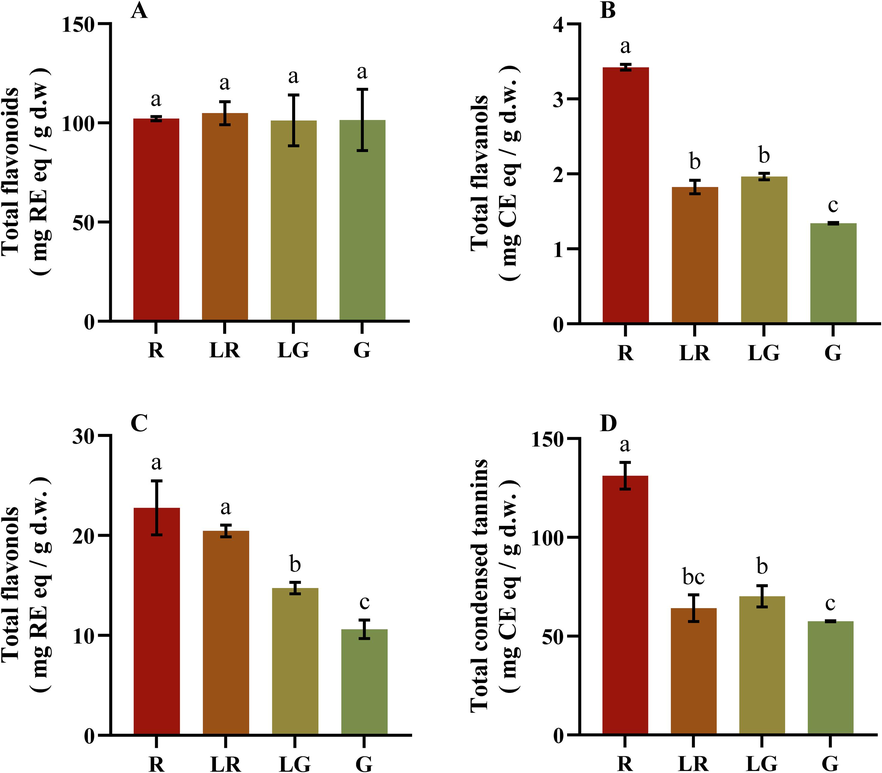
3.3 Antioxidant capacities determined with DPPH, ABTS, and FRAP assays
It is known that one single method can hardly reflect comprehensive antioxidant activity generated by a series of complex compounds in plant extracts, because different antioxidant compounds may act through distinct mechanisms against oxidizing agents (Marazza et al., 2012, Yin et al., 2019). Thus, three antioxidant assays were used to determine the antioxidant activities of phenolic compounds in PFL, and Trolox was used as the standard. As shown in Fig. 5 and Supplementary Table 1, R exhibited the strongest antioxidant activities in all three assays, while those of G or LG were the weakest. These results indicated that the PFL in red color contained higher concentrations of antioxidants or compounds with stronger antioxidant activities. Beyond that, the results of three antioxidant assays in four groups exhibited slightly different. In Fig. 5A, antioxidant activity of LR determined with DPPH was just weaker than R, followed by G and LG, and there was no significant difference between LG and G. As shown in Fig. 5B, there was no significant difference among the ABTS antioxidant activity of LR, LG and G. For FRAP values in Fig. 5C, it also displayed no significant difference between LR and LG, or LR and G.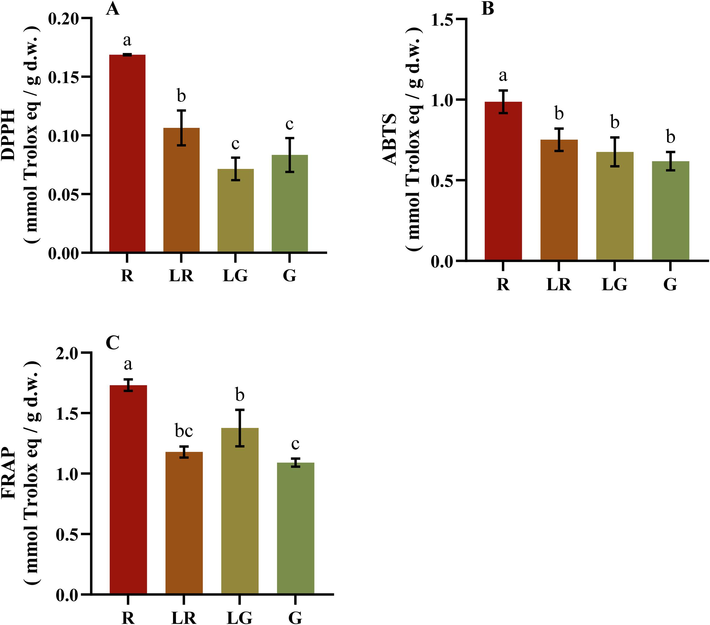
3.4 Phenolic compounds identification with UPLC-QTOF-MS/MS and feature-based molecular networks
For a comprehensive overview of the phenolic metabolome of PFL among the four groups, UPLC-QTOF-MS/MS was recruited in positive ionization mode in the present study. The UV spectra and total ion chromatographs revealed qualitative and quantitative differences among the constitutive phenolic metabolome of the PFL groups (Fig. 6A and B). Subsequently, feature-based molecular networks (FBMNs) were constructed through the GNPS platform to facilitate the visual inspection of the metabolite distributions across the PFL groups (Fig. 7). In the constructed networks, node attributes were portrayed as pie charts to reflect the distribution of each ion among the four groups of PFL (Fig. 7).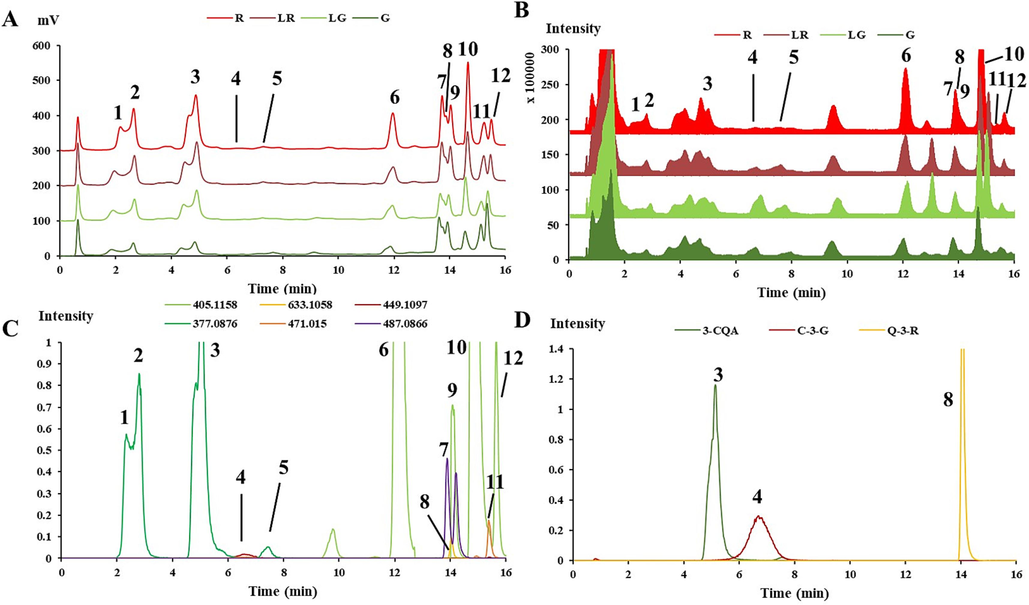
Over the 68 metabolites annotated by the GNPS platform (Supplementary Table 2), 12 of them existed simultaneously in the four PFL groups with higher absorbance intensities were confirmed through comparing retention time and MS/MS data of the reference standards or literatures. Their detail retention time (tR), m/z, formula and fragmentation behavior were listed in Table 1. “STD” means those compounds identified by comparing with their MS/MS data with those of the standard.
No.
RT (min)
Found at m/z
Expected at m/z
Adduct ion
Error(ppm)
Formula
MS/MS fragments
Proposed compounds
Content (μg/mg)
R
LR
LG
G
Caffeoylquinic acids
1
2.332
377.0862
377.0843
[M + Na]+
5.36
C16H18NaO9
377.0845, 163.0384
1-O-Caffeoylquinic acid (1-CQA)
2.65 ± 0.25c
2.32 ± 0.15c
1.62 ± 0.05b
0.82 ± 0.11a
2
2.795
377.0878
377.0843
[M + Na]+
9.88
C16H18NaO9
377.0841, 163.0379
5-O-Caffeoylquinic acid (5-CQA)
5.09 ± 0.25d
4.09 ± 0.13c
3.05 ± 0.11b
1.53 ± 0.09a
3
5.043
377.0875
377.0843
[M + Na]+
9.03
C16H18NaO9
377.0839, 163.0384, 145.0273
3-O-Caffeoylquinic acid (3-CQA)STD
9.78 ± 0.09d
8.99 ± 0.18c
6.62 ± 0.14b
2.75 ± 0.04a
5
7.438
377.0845
377.0843
[M + Na]+
0.56
C16H18NaO9
377.0844, 361.0897, 163.0385
4-O-Caffeoylquinic acid (4-CQA)
0.3 ± 0.01c
0.27 ± 0.01c
0.19 ± 0.04b
0.07 ± 0.02a
6
12.165
405.1183
405.1156
[M + Na]+
7.06
C18H22NaO9
405.1186, 163.0386
1-O-Caffeoylquinic acid ethyl ester (1-CQAEE)
20.28 ± 0.32d
15.19 ± 0.99c
13.08 ± 0.95b
7.85 ± 1.02a
9
14.078
405.1158
405.1156
[M + Na]+
0.51
C18H22NaO9
405.1158, 389.1210, 163.0385
5-O-Caffeoylquinic acid ethyl ester (5-CQAEE)
2.28 ± 0.21b
1.09 ± 0.04a
0.99 ± 0.08a
1.04 ± 0.11a
10
14.876
405.1183
405.1156
[M + Na]+
7.06
C18H22NaO9
405.1186, 163.0391
3-O-Caffeoylquinic acid ethyl ester (3-CQAEE)
19.52 ± 0.36d
16.17 ± 0.71c
14.37 ± 0.56b
9.59 ± 0.18a
12
15.654
405.1183
405.1156
[M + Na]+
7.06
C18H22NaO9
405.1170, 163.0387
4-O-Caffeoylquinic acid ethyl ester (4-CQAEE)
2.84 ± 0.12d
1.97 ± 0.11c
1.73 ± 0.16b
0.81 ± 0.05a
Anthocyanidins
4
6.555
449.1075
449.1078
[M + H]+
−0.75
C21H20O11+
287.0544, 309.0361
Cyanidin-3-O-glucoside (C-3-G) STD
0.35 ± 0.01c
0.03 ± 0b
0 ± 0a
0 ± 0a
Flavonols
7
13.89
487.0866
487.0847
[M + Na]+
4.1
C21H20NaO12
487.0849, 303.0495, 325.0314
Quercetin-3-O-glucoside (Q-3-G)
1.87 ± 0.03c
1.65 ± 0.06b
0.86 ± 0.01a
1.55 ± 0.06b
8
14.057
633.1058
633.1062
[M + Na]+
−0.69
C26H26NaO17
475.3269, 633.1428, 303.0494
Quercetin-3-O-rutinoside (Q-3-R) STD
0.28 ± 0.01c
0.24 ± 0b
0.13 ± 0a
0.27 ± 0.01c
11
15.36
471.0912
471.0898
[M + Na]+
3.16
C21H20NaO11
471.0891, 309.0363
Kaempferol-3-O-glucoside (K-3-G)
0.62 ± 0.02c
0.71 ± 0.04d
0.3 ± 0.01a
0.54 ± 0.02b
3.4.1 Caffeoylquinic acids (CQA)
Compounds 1 (tR = 2.332 min), 2 (tR = 2.795 min), 3 (tR = 5.043 min) and 5 (tR = 7.438 min) were isomers and had [M + Na]+ at m/z 377 with the predicted molecular formula C16H18NaO9. The elution order was confirmed by comparing with 3-O-caffeoylquinic acid standard and previous study (Tena et al., 2015), and compounds 1, 2, 3 and 5 were assigned as 1-O-caffeoylquinic acid, 5-O-caffeoylquinic acid, 3-O-caffeoylquinic acid and 4-O-caffeoylquinic acid, respectively. Moreover, four caffeoylquinic acid ethyl ester isomers (Compounds 6, 9, 10 and 12) were extracted from the TIC chromatogram of PFL with [M + Na]+ at m/z 405 and the predicted molecular formula was C18H22NaO9. According to Ma et al., (2022) and Tena et al., (2015), the sequence of elution for the four caffeoylquinic acid ethyl ester isomers was 1-O-caffeoylquinic acid ethyl ester, 5-O-caffeoylquinic acid ethyl ester, 3-O-caffeoylquinic acid ethyl ester, and 4-O-caffeoylquinic acid ethyl ester, respectively.
3.4.2 Anthocyanidins
Compound 4 (tR = 6.555 min) displayed the [M + H]+ ion at m/z 449.1075 (C21H20O11+). The MS/MS fragmentation demonstrated that the pseudomolecular cation of identified anthocyanin was the precursor of cyanidin ([M + H]+ at m/z 287), indicative of cyanidin-glycosides. Compound 4 was identified as cyanidin-3-O-glucoside on the basis of their retention time and MS/MS fragments, compared with the standard and the previous study (Kolniak-Ostek et al., 2015).
3.4.3 Flavonols
Compound 7, with a [M + Na]+ ion at m/z 487.0866 that fragmented in m/z 303.0495 owing to the loss of a hexose residue (162 Da), was identified as quercetin-3-O-glucoside by comparison with the MS/MS data of a previous study (Kolniak-Ostek et al., 2015). Compound 8 had a [M + Na]+ ion at m/z 633.1058 that fragmented in m/z 303.0494, owing to the loss of rhamnose (146 Da) and glucose (162 Da) residues. This compound was therefore tentatively identified as quercetin-3-O-rutinoside compared with the standard, as well as the previous references (Kolniak-Ostek et al., 2015, Chen et al., 2021). Compound 11 (tR = 15.36 min) was identified as kaempferol-3-O-glucoside with the molecular formula of C17H20O11, with fragment ions at m/z 471.0891 and 309.0363 based on a previous report (Chen et al., 2021).
Furthermore, the regression equations of 3-O-caffeoylquinic acid (3-CQA), cyanidin-3-O-glucoside (C-3-G), and quercetin 3-O-rutinoside (Q-3-R) were constructed by the areas of extracted ion peak and the concentrations for the quantification of these three phenolic compounds and semi-quantification of the other 9 among the four groups (Fig. 6C and D, Supplementary Table 3). As shown in Table 1, Contents of all caffeoylquinic acid and anthocyanin compounds exhibited a gradually decrease from red to green leaves, with the contents of all 9 compounds being the highest in the R group. In contrast, contents of the three flavonols kept relatively steady among the four groups, exhibiting no obvious variation trend. Overall, the distribution trend of caffeoylquinic acid and anthocyanin compounds were found to be similar with the above phenolic content and antioxidant activities, exhibiting the highest levels in the R group.
3.5 Principal component and hierarchical cluster analysis
We next moved to perform principal component analysis (PCA) and hierarchical cluster analysis (HCA) based on the levels of color parameters, overall contents of pigments, phenols, and flavonoids, as well as levels of phenolic compounds of PFL. In general, PCA provided a good summary of the aforementioned data as PC1 and PC2 accounted for 85.12 % of total variance and clearly discriminated against the four PFL groups based on their specific parameters in the score plot (Fig. 8A). As shown in Fig. 8A, the overall classification of different groups of P. fraseri samples was good. Meanwhile, as the PFL turned to green from red color, there was an obvious conversion trend from left to right.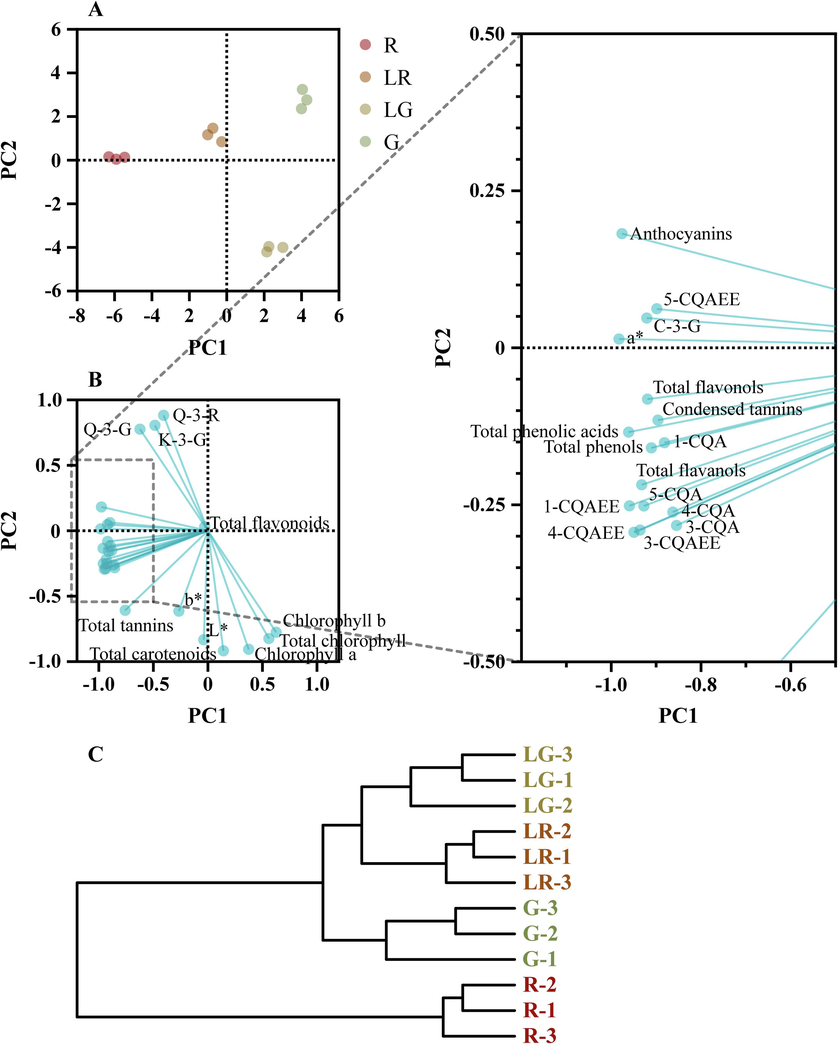
In the loading plot (Fig. 8B), the distance of each data point from the origin represented the magnitude of their impact of inter-group differences. The differences in total flavonoids content among the four groups were relatively small, explaining that it appeared closer to the origin in the loading plot. PC1, which explained 59.08 % of the variance, separated chlorophyll and carotenoids (quadrant IV, related to LG and G) from anthocyanins (quadrant II, related to LR and R). Data points for chlorophyll b, chlorophyll a, total chlorophyll and carotenoids belonged to the quadrant IV, indicating that they had higher content (or indicators) in LG and contributed significantly to the differentiation between the LG and other groups. Meanwhile, PC2 (26.04 %) separated a* in quadrant II (related to G, LR and R) from L* and b* in quadrant III (related to LG). Moreover, data points for total anthocyanins, phenols, phenolic acids, flavanols, flavonols, and condensed tannins, and the phenolic compounds belonging to caffeoylquinic acids and anthocyanins all shared a direction constant with the R group, revealing their high levels in the R group once again.
The HCA grouped samples together based on their proximity in terms of classification distance. The HCA results for the PFL groups were shown in Fig. 8C. The R group was classified as a distinct first category due to its clear separation from other groups. The remaining samples were clustered into a second category. Within the second category, the R group was grouped separately, while the remaining LG and LR group were grouped together. These results indicated that the active compound composition or antioxidant properties of the red leaves possessed significant differences compared with other groups.
3.6 Ambient light illumination
To explore the correlation among the detected parameters including leaf color, contents of phenols and anthocyanins, and levels of antioxidant activity, and the light intensities in PFL, the environmental illuminance over time in the four groups were determined with an illuminance meter. As shown in Fig. 9A, it can be observed that the environmental illuminances were the highest at noon (12:00) in the four groups, and the illuminance was the highest in the environment of the R group, followed by those of LR, LG and G. Fig. 9B was the area under the LUX-h curve of each PFL group. Thus, it could be found that the cumulative light intensity in the environment of the four groups exhibited a decreasing trend, with the specific order being R > LR > LG > G.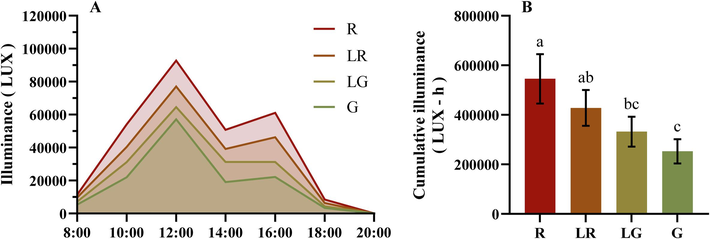
Light is a well-known signal for various metabolic pathways within plants, and a certain number of plants have been verified to accumulate anthocyanins in their leaves for photoprotection, leading to the red color formation (Landi et al., 2021). Our result also indicated that light intensity was an important factor affecting the leaf color of P. fraseri, suggesting that the stronger light intensity, the redder of PFL color (Fig. 9B). Furthermore, when the level of the accumulated anthocyanins was high enough to mask the chlorophyll, the leaves turn red from green. Anthocyanins possess various biological effects for plant leaves (Chalker-Scott, 1999; Gould 2004), while cyanidin-3-O-glucoside was found to be the dominant compound in PFL. Considering the relationship between light and leaf color, the high level of anthocyanins content in the red group samples may be related to the photoprotective effect of P. fraseri (Kytridis and Manetas 2006), which may explain to a certain extent the strong resistance to light of P. fraseri as a facultative shade plant (Norcini et al., 1991). Although the object of this study is not the young leaves of P. fraseri, it should be pointed out that young leaves have more photoprotection needs than mature leaves (Krause et al., 1995), which may explain why we observed that young leaves of P. fraseri tend to be redder than mature leaves.
3.7 Correlation analysis
Finally, the color parameters, contents of overall pigments, phenols, flavonoids, levels of antioxidant capacity, and contents of identified phenolic compounds among the four PFL groups were imported into SPSS software for correlation analysis, and the correlation results were then visualized.
As shown in Fig. 10, total phenols showed a significant positive correlation with total phenolic acids and condensed tannins content (0.98 < R < 1, P < 0.05). This indicates that total phenolic acids and condensed tannins were the main components of phenolic compounds in PFL. DPPH and ABTS, two antioxidant assay methods, showed a significant correlation (R = 0.97, P < 0.05), indicating the reliability of the methods. The principle of FRAP assay is different from DPPH and ABTS (Nimse and Pal 2015), providing a new perspective for evaluating the antioxidant capacity of active compounds. The results showed that ABTS radical scavenging activity was significantly positively correlated with total anthocyanins, phenolic acids, condensed tannins, total phenols, total flavanols, C-3-G and 5-O-Caffeoylquinic acid ethyl ester (5-CQAEE) contents (0.95 < R < 0.994, P < 0.05), while FRAP assay was significantly positively correlated with total tannins, condensed tannins, total phenols and total flavanols (0.95 < R < 0.973, P < 0.05).
In addition, the cumulative light intensity of the PFL samples showed a significant positive correlation with their a* value, contents of total anthocyanins, phenolic acids, flavonols, 1-O-Caffeoylquinic acid ethyl ester (1-CQAEE), 5-O-Caffeoylquinic acid (5-CQA), 3-O-Caffeoylquinic acid (3-CQAEE), and 1-O-Caffeoylquinic acid (1-CQA), and ABTS radical scavenging activity (0.96 < R < 0.98, P < 0.05). Antioxidant capacity can provide protection for plants under high-intensity light exposure (Stevanato et al., 2014, Yu et al., 2021). Considering the highly significant correlation between anthocyanins and ABTS, total phenolic acids content and ABTS, total flavanols and ABTS, the high ABTS scavenging activity exhibited by PFL samples under higher cumulative light intensity may be achieved through increased synthesis of anthocyanins, total phenolic acids and total flavanols. This could be a mechanism for photoprotection in PFL.
4 Conclusion
According to the present study, the leaves of P. fraseri are rich in various phenolic compounds, which contribute to their high antioxidant capacity. Among PFL with different colors, red leaves further exhibited significantly higher level of total anthocyanins, phenols, tannins, phenolic acids, condensed tannins, flavanols, flavonols, and antioxidant activities. Principal component, hierarchical cluster, and correlation analysis revealed that total phenolic acids, condensed tannins, total phenols, total flavanols, and anthocyanins are the main contributors to the antioxidant activity in the PFL, while caffeoylquinic acid derivatives such as caffeoylquinic acid and caffeoylquinic acid ethyl ester and anthocyanin compounds such as cyanidin-3-O-glucoside were the key phenolic compounds. Additionally, high light intensity could significantly increase the content of anthocyanins, total flavonols and total phenolic acids in the leaves, thereby enhancing their photoprotection ability and antioxidant capacity and leading to the red color formation of PFL.
The results of this study indicated that the red leaves of P. fraseri had the highest content of the main active components (anthocyanins, phenolic compounds, condensed tannins, flavonols, and flavanols) as well as the highest antioxidant activity. Therefore, it can be concluded that red leaves of P. fraseri have the strongest potential to be an ideal source for extracting bioactive compounds.
CRediT authorship contribution statement
Chuang Deng: Writing – original draft, Investigation, Conceptualization. Xiang Liu: Investigation. Fuchang Liao: Investigation. Shuiqing Chen: Investigation. Lingguang Yang: Writing – review & editing, Supervision, Conceptualization. Peipei Yin: Writing – review & editing, Supervision.
Acknowledgements
This work was supported by National Natural Science Foundation of China (32301055), Jiangxi Province Major Discipline Academic and Technical Leaders Training Project (20243BCE51140), Natural Science Foundation of Jiangxi Province (20224BAB215006, 20242BAB20270), Jiangxi Higher Education Teaching Reform Project (JXJG-23-15-10, JXJG-23-15-15) and College Students' Innovative Entrepreneurial Training Plan Program of Yichun University (X202310417002).
Declaration of Competing Interest
The authors declare that they have no known competing financial interests or personal relationships that could have appeared to influence the work reported in this paper.
References
- Identification and Quantification of Anthocyanin and Catechin Compounds in Purple Tea Leaves and Flakes. Molecules. 2022;27:6676.
- [CrossRef] [Google Scholar]
- Simultaneous determination of total phenolic acids and total flavonoids in tea and honey samples using an integrated lab on a chip device. Food Chem.. 2021;342:128338
- [CrossRef] [Google Scholar]
- Influence of in vitro human digestion on the bioavailability of phenolic content and antioxidant activity of Viburnum opulus L. (European cranberry) fruit extracts. Ind. Crop. Prod.. 2019;131:62-69.
- [CrossRef] [Google Scholar]
- Condensed Tannins from Longan Bark as Inhibitor of Tyrosinase: Structure, Activity, and Mechanism. J Agric Food Chem.. 2018;66:908-917.
- [CrossRef] [Google Scholar]
- Environmental Significance of Anthocyanins in Plant Stress Responses. Photochem. Photobiol.. 1999;70:1-9.
- [CrossRef] [Google Scholar]
- A cross-platform toolkit for mass spectrometry and proteomics. Nat. Biotechnol.. 2012;30:918-920.
- [CrossRef] [Google Scholar]
- Anthocyanins as Promising Molecules Affecting Energy Homeostasis, Inflammation, and Gut Microbiota in Type 2 Diabetes with Special Reference to Impact of Acylation. J. Agric. Food Chem.. 2022;71:1002-1017.
- [CrossRef] [Google Scholar]
- Flavonoids and caffeoylquinic acids in Chrysanthemum morifolium Ramat flowers: A potentially rich source of bioactive compounds. FoodChemistry.. 2021;344:128733
- [CrossRef] [Google Scholar]
- Biochemical Compounds, Antioxidant Capacity, Leaf Color Profile and Yield of Basil (Ocimum sp.) Microgreens in Floating System. Plants.. 2023;12:2652.
- [CrossRef] [Google Scholar]
- Consumption of whole purple and regular wheat modestly improves metabolic markers in adults with elevated high-sensitivity C-reactive protein: a randomised, single-blind parallel-arm study. Br. J. Nutr.. 2020;124:1179-1189.
- [CrossRef] [Google Scholar]
- Characterization and Measurement of Anthocyanins by UV-Visible Spectroscopy. Curr. Protocol Food Anal. Chem.. 2001;00 F1.2.1-F1.2.13
- [CrossRef] [Google Scholar]
- Dietary Effects of Anthocyanins in Human Health: A Comprehensive Review. Pharmaceuticals. 2021;14:690.
- [CrossRef] [Google Scholar]
- Nature's Swiss Army Knife: The Diverse Protective Roles of Anthocyanins in Leaves. J. Biomed. Biotechnol.. 2004;2004:314-320.
- [CrossRef] [Google Scholar]
- Employing ProteoWizard to Convert Raw Mass Spectrometry Data. Curr. Protoc. Bioinformatics. 2014;46:13-24.
- [CrossRef] [Google Scholar]
- Recent Research on the Health Benefits of Blueberries and Their Anthocyanins. Adv. Nutr.. 2020;11:224-236.
- [CrossRef] [Google Scholar]
- Protective and defensive role of anthocyanins under plant abiotic and biotic stresses: An emerging application in sustainable agriculture. J. Biotechnol.. 2023;361:12-29.
- [CrossRef] [Google Scholar]
- Characterization of Phenolic Compounds of Thorny and Thornless Blackberries. J. Agric. Food Chem.. 2015;63:3012-3021.
- [CrossRef] [Google Scholar]
- Effects of periodic drought with severe exhaust exposure on particle retention capacity and physiological responses of Photinia × fraseri Dress. Ecotoxicol. Environ. Saf.. 2022;241:113807
- [CrossRef] [Google Scholar]
- High susceptibility to photoinhibition of young leaves of tropical forest trees. Planta. 1995;197:583-591.
- [CrossRef] [Google Scholar]
- Antioxidant activity of Cassia auriculata flowers. Fitoterapia. 2007;78:46-47.
- [CrossRef] [Google Scholar]
- Mesophyll versus epidermal anthocyanins as potential in vivo antioxidants: evidence linking the putative antioxidant role to the proximity of oxy-radical source. J. Exp. Bot.. 2006;57:2203-2210.
- [CrossRef] [Google Scholar]
- Unveiling the shade nature of cyanic leaves: A view from the “blue absorbing side” of anthocyanins. Plant Cell Environ.. 2021;44:1119-1129.
- [CrossRef] [Google Scholar]
- First Report of Powdery Mildew on Photinia × fraseri Caused by Podosphaera leucotricha in Guizhou Province. China. Plant Disease.. 2023;107:951.
- [CrossRef] [Google Scholar]
- Metabolome and Transcriptome Reveal Chlorophyll, Carotenoid, and Anthocyanin Jointly Regulate the Color Formation of Triadica sebifera. Physiol. Plant.. 2024;176:e14248.
- [Google Scholar]
- In vitro propagation of fraser photinia using Azospirillum-mediated root development. Methods Mol. Biol.. 2013;994:245-258.
- [CrossRef] [Google Scholar]
- Comparison of Common Analytical Methods for the Quantification of Total Polyphenols and Flavanols in Fruit Juices and Ciders. J. Food Sci.. 2019;84:2147-2158.
- [CrossRef] [Google Scholar]
- Rapid identification of chemical components of Folium Photiniae based on UPLC-Q-TOF-MS. Chin. Tradit. Herb. Drug. 2022;53:6401-6411.
- [CrossRef] [Google Scholar]
- Enhancement of the antioxidant capacity of soymilk by fermentation with Lactobacillus rhamnosus. J. Funct. Foods. 2012;4:594-601.
- [CrossRef] [Google Scholar]
- mzML—a Community Standard for Mass Spectrometry Data. Mol. Cell. Proteomics. 2011;10(R110):000133
- [CrossRef] [Google Scholar]
- Phytoremediated marine sediments as suitable peat-free growing media for production of red robin photinia (Photinia x fraseri) Chemosphere. 2018;201:595-602.
- [CrossRef] [Google Scholar]
- Mutants of Arabidopsis thaliana with pleiotropic effects on the expression of the gene for beta-amylase and on the accumulation of anthocyanin that are inducible by sugars. Plant J.. 1997;11:841-851.
- [CrossRef] [Google Scholar]
- Leaf Spot on Photinia × fraseri Caused by Neopestalotiopsis asiatica in China. Plant Dis.. 2023;107:215.
- [CrossRef] [Google Scholar]
- Free radicals, natural antioxidants, and their reaction mechanisms. RSC Adv.. 2015;5:27986-28006.
- [CrossRef] [Google Scholar]
- Light Intensity Influences Leaf Physiology and Plant Growth Characteristics of Photinia × fraseri. J. Am. Soc. Hort. Sci.. 1991;116:1046-1051.
- [CrossRef] [Google Scholar]
- Non-destructive evaluation of chlorophyll content in quinoa and amaranth leaves by simple and multiple regression analysis of RGB image components. Photosynth. Res.. 2014;120:263-272.
- [CrossRef] [Google Scholar]
- Characterization of Tunisian Aleppo pine tannins for a potential use in wood adhesive formulation. Ind. Crop. Prod.. 2014;61:517-525.
- [CrossRef] [Google Scholar]
- Cytoscape: a software environment for integrated models of biomolecular interaction networks. Genome Res.. 2003;13:2498-2504.
- [CrossRef] [Google Scholar]
- Study of the Relationship between Leaf Color Formation and Anthocyanin Metabolism among Different Purple Pakchoi Lines. Molecules. 2020;25:4809.
- [CrossRef] [Google Scholar]
- Proanthocyanidins isolated from the leaves of Photinia × fraseri block the cell cycle and induce apoptosis by inhibiting tyrosinase activity in melanoma cells. Food Funct.. 2021;12:3978-3991.
- [CrossRef] [Google Scholar]
- Photoprotective characteristics of natural antioxidant polyphenols. Regulatory Toxicology and Pharmacology : RTP.. 2014;69:71-77.
- [CrossRef] [Google Scholar]
- Total phenolics, flavonoids, antioxidant activity, crude fibre and digestibility in non-traditional wheat flakes and muesli. Food Chem.. 2015;174:319-325.
- [CrossRef] [Google Scholar]
- Comparative analysis of bioactive phenolic compounds composition from 26 medicinal plants. Saudi Journal of Biological Sciences.. 2018;25:631-641.
- [CrossRef] [Google Scholar]
- Color characteristics, pigment accumulation and biosynthetic analyses of leaf color variation in herbaceous peony (Paeonia lactiflora Pall.) 3 Biotech. 2020;10:76.
- [CrossRef] [Google Scholar]
- Determination of caffeoylquinic acids in feed and related products by focused ultrasound solid–liquid extraction and ultra-high performance liquid chromatography–mass spectrometry. J. Chromatogr. A. 2015;1400:1-9.
- [CrossRef] [Google Scholar]
- Fast screening of total flavonols in wines, tea-infusions and tomato juice by flow injection/adsorptive stripping voltammetry. Anal. Chim. Acta. 2005;551:124-131.
- [CrossRef] [Google Scholar]
- Sharing and community curation of mass spectrometry data with Global Natural Products Social Molecular Networking. Nat. Biotechnol.. 2016;34:828-837.
- [CrossRef] [Google Scholar]
- Wu, X., J. M. Beecher Gr Fau - Holden, D. B. Holden Jm Fau - Haytowitz, et al., 2006. Concentrations of anthocyanins in common foods in the United States and estimation of normal consumption. Journal of Agricultural and Food Chemistry 54, 4069-4075. DOI: 10.1021/jf060300l.
- The profile of buckwheat tannins based on widely targeted metabolome analysis and pharmacokinetic study of ellagitannin metabolite urolithin A. Lwt.. 2022;156:113069
- [CrossRef] [Google Scholar]
- Leaf Blight on Photinia × fraseri Caused by Pestalotiopsis trachicarpicola in China. Plant Dis.. 2022;106:1520.
- [CrossRef] [Google Scholar]
- Phenotype and transcriptome analysis reveals chloroplast development and pigment biosynthesis together influenced the leaf color formation in mutants of Anthurium andraeanum ‘Sonate’. Front. Plant Sci.. 2015;6:139.
- [CrossRef] [Google Scholar]
- Seasonal dynamics of constitutive levels of phenolic components lead to alterations of antioxidant capacities in Acer truncatum leaves. Arab. J. Chem.. 2018;11:14-25.
- [CrossRef] [Google Scholar]
- Bioactive components and antioxidant activities of oak cup crude extract and its four partially purified fractions by HPD-100 macroporous resin chromatography. Arab. J. Chem.. 2019;12:249-261.
- [CrossRef] [Google Scholar]
- Photoprotection of Arabidopsis leaves under short-term high light treatment: The antioxidant capacity is more important than the anthocyanin shielding effect. Plant Physiology and Biochemistry : PPB.. 2021;166:258-269.
- [CrossRef] [Google Scholar]
- Comparison of Leaf Shape between a Photinia Hybrid and One of Its Parents. Plants.. 2022;11:2370.
- [CrossRef] [Google Scholar]
Appendix A
Supplementary data
Supplementary data to this article can be found online at https://doi.org/10.1016/j.arabjc.2024.106046.
Appendix A
Supplementary data
The following are the Supplementary data to this article:Supplementary Data 1
Supplementary Data 1


