Translate this page into:
Linifanib induces apoptosis in human ovarian cancer cells via activation of FOXO3 and reactive oxygen species
⁎Corresponding authors at: Department of Pathology, Jeonbuk National University Medical School, Jeonju 54896, South Korea (K.Y. Jang). Department of Bio and Chemical Engineering, Hongik University, Sejong 30016, South Korea (S-H. Park). kyjang@jbnu.ac.kr (Kyu Yun Jang), shpark74@hongik.ac.kr (See-Hyoung Park)
-
Received: ,
Accepted: ,
This article was originally published by Elsevier and was migrated to Scientific Scholar after the change of Publisher.
Abstract
Linifanib is known as an inhibitor of receptor tyrosine kinase. Even though it has been widely recognized as efficient inhibitor of receptor tyrosine kinases, anti-carcinogenic effect has not been investigated enough in ovarian cancer. In this study, we investigated the anti-cancer effect of linifanib on human ovary cancer SKOV3 cells. WST-1, cell counting assay, and observation of morphological changes were performed to evaluate the cytotoxic effect of linifanib in SKOV3 cells. We analyzed SKOV3 cells treated with linifanib using Muse cell analyzer. We focused on investigating the effect of linifanib on DNA damage in nucleus. Additionally, intracellular reactive oxygen species (ROS) level was measured through Muse cell analyzer. Western blotting was performed to evaluate the protein expression level related to apoptosis. We found that linifanib inhibited proliferation of SKOV3 cells. Our results showed that linifanib induced apoptosis in SKOV3 cells. Additionally, linifanib induced DNA damage in SKOV3 cells. We found that intracellular ROS level increased after treatment of linifanib in SKOV3 cells. Interestingly, FOXO3 was transferred from cytosol into nucleus after linifanib treatment. Taken together, our results supported that linifanib inhibited the proliferation of human ovary cancer SKOV3 cells, which suggested that linifanib might have the potential to be developed as drugs for ovarian cancer treatment.
Keywords
Linifanib
Ovarian cancer
DNA damage
Apoptosis
FOXO3
Reactive oxygen species
1 Introduction
Ovary is an organ female has that produces an ovum. It was recently reported that ovarian cancer was the seventh most common cancer in women (Pokhriyal et al., 2019). Unfortunately, most of patients who were diagnosed ovarian cancer had poor prognosis and mortality rate of this cancer is pretty high (Momenimovahed et al., 2019). Many scientists and doctors have been trying to find effective and safe ways to treat ovarian cancer, however, current treatments have many side effects and prognosis of patients is poor. For instance, cisplatin is typical drug that has been widely used for ovarian cancer treatment (Zhang et al., 2018). Even though it suppresses tumor in ovary to some extent, there are several side effects such as tumor recurrence and drug resistance (Zhang et al., 2018). Therefore, efficient therapy that has fewer side effects for ovarian cancer treatment needs to be developed.
Linifanib has been known as a multi-targeted receptor tyrosine kinase inhibitor and it has been used for the treatment of various cancers, such as lung cancer, colon cancer, and breast carcinoma (Aversa et al., 2015, Wani et al., 2017). This compound also inhibits vascular endothelial growth factor (VEGF) and platelet-derived growth factor (PDGF) (Cainap et al., 2015). Linifanib has potential to be efficient reagent for cancer treatment, however, the effects of linifanib on cancer development have not been investigated enough. Because the effect of linifanib on human ovarian cancer has not been studied, we investigated anti-carcinogenic effect of linifanib on human ovarian cancer SKOV3 cells in this study.
Fork head box O (FOXO) is well-known transcription factor and it plays a crucial role in regulating various signaling pathways (Tia et al., 2018). The mammalian FOXO family is made up of FOXO1, 3, 4, and 6, whose structures and functions are similar (Tia et al., 2018). Among them, FOXO3 is involved in various cellular processes such as cell metabolism and cell proliferation (Loebel et al., 2018). It has been recently reported that FOXO3 pathway induced apoptosis and cell cycle arrest, which suggested that FOXO3 pathway plays a crucial role in survival of cancer cells (Li et al., 2020a, 2020b). In this study, various experiments were conducted to demonstrate the mechanism of apoptosis induced by linifanib on SKOV3 cells. We evaluated the expression level of FOXO3 after treatment of linifanib. Additionally, we tried to investigate the translocation of FOXO3 from cytosol to nuclei after treatment of linifanib on SKOV3 cells.
2 Materials and methods
2.1 Reagents
Linifanib was purchased from Selleckchem (Houston, TX, United States) and was dissolved in dimethyl sulfoxide (Sigma-Aldrich, St. Louis, MO, United States) and stored in −20℃ (The concentration of stock solution was 40 mM). Formaldehyde solution for fixation was purchased from Sigma-Aldrich. Triton X-100 for permeabilization was purchased from Sigma-Aldrich. Muse cell analyzer was purchased from Luminex Corporation (Austin, TX, United States). Muse data was analyzed and redesigned by FlowJo software (version 10.5.3, FlowJo LCC, Ashland, OR, United States). Primary antibodies against PARP-1, cleaved PARP-1, and β-actin were purchased from Santa Cruz Biotechnology (Santa Cruz, CA, United States). Primary antibodies against thioredoxin-1, peroxiredoxin-1, caspase-3, cleaved caspase-3, FOXO3, p27, bax, bim, and bcl-2 were purchased from Cell Signaling Technology (Danvers, MA, United States). Primary antibodies against cytochrome c oxidase I (COX 1) and succinate dehydrogenase (SDHA) were from Abcam (Cambridge, MA, United States). Anti-rabbit and anti-mouse secondary antibodies for western blot were purchased from Cell Signaling Technology.
2.2 Cell lines and cell culture
Human ovarian cancer SKOV3 cells were purchased from Korean Cell line Bank (Seoul, Republic of Korea). The cells were incubated in humidified incubator maintaining 37℃ and 5 % CO2. Following Korean Cell line Bank’s instructions, we used RPMI 1640 (Hyclone, Logan, UT, United States) containing 10 % Fetal Bovine Serum (GW Vitek, Seoul, Republic of Korea) inactivated by heat (56℃, 30 min) and 1 % penicillin/streptomycin (Thermo Fisher Scientific, Grand Island, NY, United States).
2.3 WST-1 assay
SKOV3 cells were seeded in 96-well culture plates (4 × 10³ cells/well) and incubated for 24 h. The cells were treated with linifanib (0, 5, 10, and 20 µM) for 24, 48, and 72 h, respectively. After incubation, media was removed and 100 µL of media containing 10 % EZ-Cytox (DoGenBio, Seoul, Republic of Korea) was added to each well and incubated for 2 h in 37℃ incubator. The absorbance was measured at 450 nm wavelength through spectrophotometer (Molecular Devices, Mountain View, CA, United States).
2.4 Observation of morphological changes
SKOV3 cells were seeded in 60 mm culture dishes (1.5 × 10⁵ cells/dish) and incubated for 24 h (24 h after seeding, confluency was about 80 ∼ 90 %). The cells were treated with linifanib (0, 10, 20, and 40 µM) for 24 h (Before treatment, pictures should be taken). After 24 h, morphological changes were observed through microscopy (CKX53, Olympus, Shinjuku, Tokyo, Japan).
2.5 Cell counting assay
SKOV3 cells were seeded in 6-well culture plates (1.5 × 10⁵ cells/well). The cells were treated with linifanib (0, 10, 20, and 40 µM) for 24, 48, and 72 h, respectively. After treatment, media was carefully removed and the cells were washed twice with 1 × PBS. After washing step, Trypsin-EDTA was used to detach cells from dish. The cells were collected using centrifuge. After supernatant removed, the cells were suspended with 1 mL of fresh media. The number of cells was counted using hemocytometer.
2.6 Colony formation assay
SKOV3 cells were seeded in 60 mm culture dish (1500 cells per dish) and incubated for 24 h. The cells were treated with linifanib (0, 10, 20, and 40 µM) for 24 h. Media was carefully removed and replaced with fresh media containing 10 % FBS and the cells were incubated for 2 weeks in incubator. After 2 weeks, media was removed and the cells were washed twice with 1 × PBS. After washing, the cells were fixed with 4 % formaldehyde solution (Sigma-Aldrich) for 20 min at room temperature. The cells were washed twice with 1 × PBS and dyed with 1 % crystal violet solution (Sigma-Aldrich) for 30 min at room temperature. After staining, the cells were washed with distilled water carefully and dried in air. The number of colonies was counted.
2.7 Cell viability assay
SKOV3 cells were seeded in 6-well culture plates (1.5 × 10⁵ cells/well). Cell viability of SKOV3 cells treated with linifanib (0, 10, 20, and 40 µM) for 24 and 48 h was evaluated by Muse Cell Analyzer. We purchased the Muse Count & Viability Kit (Luminex Corporation, Part number: MCH100102) and performed experiment according to manufacturer’s protocol. The date was analyzed by FlowJo software.
2.8 Apoptosis assay
SKOV3 cells were seeded in 6-well culture plates (1.5 × 10⁵ cells/well). Apoptotic cell rates of SKOV3 cells treated with linifanib (0, 10, 20, and 40 µM) for 24 and 48 h were evaluated by Muse Cell Analyzer. We purchased the Muse Annexin V & Dead Cell Kit (Luminex Corporation, Part number: MCH100105) and performed experiment according to manufacturer’s protocol. The data was analyzed by FlowJo software.
2.9 Caspase-3/7 activity assay
SKOV3 cells were seeded in 6-well culture plates (1.5 × 10⁵ cells/well). Caspase-3/7 activity of SKOV3 cells treated with linifanib (0, 10, 20, and 40 µM) for 24 and 48 h was measured by Muse Cell Analyzer. We purchased the Muse Caspase-3/7 Kit (Luminex Corporation, Part number: MCH100108) and performed experiment according to manufacturer’s protocol. The data was analyzed by FlowJo software.
2.10 Multi-caspase activity assay
SKOV3 cells were seeded in 6-well culture plates (1.5 × 10⁵ cells/well). Multi-caspase activity of SKOV3 cells treated with linifanib (0, 10, 20, and 40 µM) for 24 and 48 h was measured by Muse Cell Analyzer. We purchased the Muse Multi-Caspase Kit (Luminex Corporation, Part number: MCH100109) and performed experiment according to manufacturer’s protocol. The data was analyzed by FlowJo software.
2.11 ATM and H2A.X phosphorylation assay
SKOV3 cells were seeded in 6-well culture plates (1.5 × 10⁵ cells/well). Phosphorylation of ATM and H2A.X after SKOV3 cells were treated with linifanib (0, 10, 20, and 40 µM) for 24 and 48 h was measured by Muse Cell Analyzer. We purchased the Muse Multi-Color DNA Damage Kit (Luminex Corporation, Part number: MCH200107) and performed experiment according to manufacturer’s protocol. The data was analyzed by FlowJo software.
2.12 Mitochondria depolarization assay
SKOV3 cells were seeded in 6-well culture plates (1.5 × 10⁵ cells/well). Depolarization of mitochondria after treatment of linifanib (0, 10, 20, and 40 µM) for 24 and 48 h in SKOV3 cells was determined by Muse Cell Analyzer. We purchased the Muse Mito-Potential Kit (Luminex Corporation, Part number: MCH100110) and performed experiment according to manufacturer’s protocol. The data was analyzed by FlowJo software.
2.13 Ki67 assay
SKOV3 cells were seeded in 6-well culture plates (1.5 × 10⁵ cells/well). The level of Ki67 after treatment of linifanib (0, 10, 20, and 40 µM) for 24 h and 48 h in SKOV3 cells was measured by Muse Cell Analyzer. We purchased the Muse Ki67 Proliferation Kit (Luminex Corporation, Part number: MCH100114) and performed experiment according to manufacturer’s protocol. The data was analyzed by FlowJo software.
2.14 Cell cycle arrest assay
SKOV3 cells were seeded in 6-well culture plates (1.5 × 10⁵ cells/well). Cell cycle of SKOV3 cells treated with linifanib (0, 10, 20, and 40 µM) for 24 h and 48 h was analyzed by Muse Cell Analyzer. We purchased the Muse Cell Cycle Kit (Luminex Corporation, Part number: MCH100106) and performed experiment according to manufacturer’s protocol. The data was analyzed by FlowJo software.
2.15 Bcl-2 phosphorylation assay
SKOV3 cells were seeded in 6-well culture plates (1.5 × 10⁵ cells/well). Phosphorylation of bcl-2 after treatment of linifanib (0, 10, 20, and 40 µM) for 24 h and 48 h in SKOV3 cells was evaluated by Muse Cell Analyzer. We purchased the Muse Bcl-2 activation Dual Detection Kit (Luminex Corporation, Part number: MCH200105) and performed experiment according to manufacturer’s protocol. The data was analyzed by FlowJo software.
2.16 Reactive oxygen species assay
SKOV3 cells were seeded in 6-well culture plates (1.5 × 10⁵ cells/well). Oxidative stress of SKOV3 cells after treatment of linifanib (0, 10, 20, and 40 µM) was evaluated by Muse Cell Analyzer. We purchased The Muse Oxidative Stress Kit (Luminex Corporation, Part number: MCH100111) and performed experiment according to manufacturer’s protocol. The date was analyzed by FlowJo software.
2.17 ATP assay
SKOV3 cells were seeded in 6-well plates (1 × 10⁶ cells/well). Cells were treated with linifanib (0, 10, 20, and 40 µM) for 24 h. Then, according to manufacturer’s protocol, cells were washed with PBS and ATP levels were determined by CellTiter-Glo luminescent assay kit (Promega, Madison, MI, United State).
2.18 Terminal deoxynucleotidyl transferase dUTP nick end labeling (TUNEL) assay
SKOV3 cells were seeded in 6-well plate (2 × 10⁵ cells/well) and incubated for 24 h. The cells were treated with linifanib (0, 10, 20, and 40 µM) for 24 h and 48 h. After treatment, the cells were washed twice with 1 × PBS thoroughly and fixated with 4 % formaldehyde for 20 min at 4℃. After fixation, cells were washed twice with 1 × PBS thoroughly. The cells were permeabilized using 0.2 % Triton-100 for 5 min at room temperature. After then, we performed experiment following manufacturer’s protocol (TUNEL detection system, Promega, Madison, WI, United States). DNA strand breaks were observed by fluorescence microscopy (CKX53, Olympus).
2.19 Comet assay
SKOV3 cells were seeded in 6-well culture plates (1.5 × 10⁵ cells/well). Cells were treated with linifanib (0, 10, 20, and 40 µM) for 24 h and 48 h. We performed experiment according to manufacturer’s protocol (Abcam, catalog number: ab238546). Comet tail was visualized by fluorescence microscopy (CKX53, Olympus).
2.20 Nuclear fractional western blot analysis
SKOV3 cells (1.5 × 10⁶ cells/dish) were seeded in 100 mm culture dishes and incubated for 24 h. After incubation, the cells were treated with linifanib (0, 10, and 20 µM) for 48 h. After treatment, nuclear and cytosol proteins were separated using Nuclear/Cytosol Fractionation Kit (BioVision, Milpitas, CA, United States). We followed manufacturer’s instruction and after separation of nuclear and cytosol proteins, western blotting was performed.
2.21 Western blotting analysis
SKOV3 cells were seeded in 6-well culture plates (1.5 × 10⁵ cells/well). Cells were treated with linifanib (0, 10, 20, and 40 µM) for 48 h. After treatment, the cells were collected with centrifuge (1350 rpm, 5 min, 4℃) and washed twice with cold 1 × PBS. After washing, the cells were collected and suspended with 1 × RIPA buffer (Cell Signaling Technology). The protein was separated on 10–12 % sodium dodecyl sulfate (SDS)-polyacrylamide gels and transferred onto 0.45 µm PVDF Immobilon-P membrane (Merch Millipore, Burlington, MA, United States). The membranes were blocked with 5 % bovine serum albumin (BSA, Sigma-Aldrich), incubated with the primary antibodies (1:1000 dilution), and incubated with the secondary antibody (1:10000 dilution). Bands were detected using ECL (GE Healthcare, Chicago, IL, United States) and Chemi-doc detection system (Bio-Rad, Hercules, CA, United States).
2.22 Wound healing assay
SKOV3 cells were seeded in 6-well plate (3.5 × 10⁵ cells/well) and incubated for 24 h. After incubation, wounds were made artificially by yellow pipette tip and the cells were rinsed with 1 × PBS. After then, the cells were treated with linifanib (0, 10, 20, and 40 µM) and observed by microscopy (CKX53, Olympus). Wounds were observed for 48 h at intervals of 24 h (0, 24, and 48 h).
2.23 Invasion assay
RPMI (1 % FBS) containing different concentration of linifanib (0, 10, 20, and 40 µM) was added to the bottom of the Boyden chamber. After then, Gelatin-coated membrane was located. 50 µL of SKOV3 cells (cell density was 1 × 10⁶ cells/ml and the cells were suspended in 0.1 % FBS RPMI) were seeded into the upper part of the Boyden chamber. The chamber was incubated in humidified incubator for 24 h. After incubation, Boyden chamber was dissembled and the membrane was stained with 1 % crystal violet solution for 30 min. After staining, the membrane was washed with 30 % glycerol solution and observed by microscopy (CKX53, Olympus).
2.24 Zymography
SKOV3 cells were seeded in 100 mm culture dishes and incubated for 24 h. 24 h after seeding, confluency is about 90 %. The cells were treated with linifanib (0, 10, and 20 µM) in medium containing 0.1 % FBS, and incubated for 24 h. The culture medium was collected carefully and mixed with sample buffer without β-mercaptoethanol. Proteins were separated by 8 % acrylamide gels containing gelatin. Gels were washed with 2.5 % Triton-X100 for 10 min three times. Gels were incubated in developing buffer overnight at dark. The gels were dyed with a Coomassie staining buffer for 2 h at 37℃. The gels were washed with destaining solution for 1 h.
2.25 Statistical analysis
Data was analyzed with SPSS software (version 20.0, Chicago, IL, United States). Two-sided unpaired Student’s t-test was conducted and p-value lower than 0.05 was considered statistical significance.
3 Results
3.1 Linifanib inhibits proliferation of SKOV3 cells.
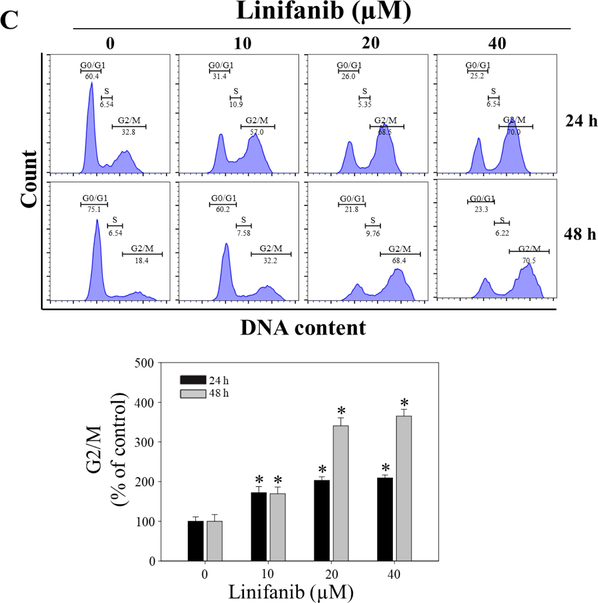
To evaluate the effects of linifanib on proliferation and survival of SKOV3 cells, several experiments were performed. WST-1 assay results indicated that linifanib decreased cell viability significantly (Fig. 1A). When the cells were treated with 40 µM of linifanib for 24 h, cell viability decreased lower than 50 %. Cell counting assay results showed that the number of cells decreased after treatment of linifanib in SKOV3 cells (Fig. 1B). We observed morphology of SKOV3 cells treated with linifanib using microscopy (Fig. 1C). We found that proliferation was inhibited after treatment of linifanib. The number of colonies decreased significantly after treatment of linifanib (Fig. 1D). We also found that linifanib decreased cell viability using Muse cell analyzer (Fig. 2A). Additionally, Ki67 expression level was decreased after linifanib treatment (Fig. 2B). Moreover, cell cycle arrest was induced by linifanib treatment (Fig. 2C). Our results showed that proportion of G2/M phase increased after linifanib treatment. Taken together, our results showed that linifanib has anti-proliferative effects on human ovarian cancer SKOV3 cells.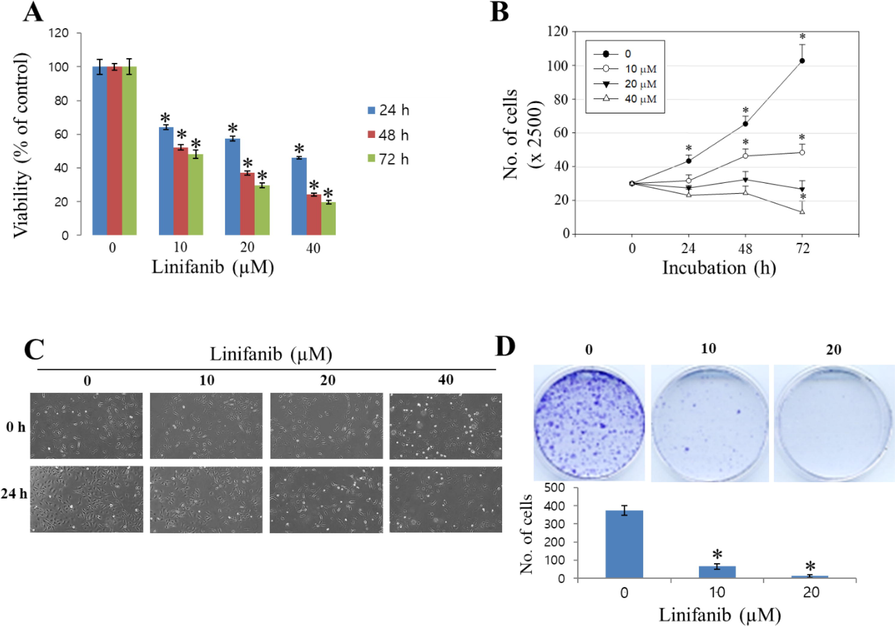
Cytotoxic effect of linifanib on SKOV3 cells. (A) Cell viability was measured by WST-1 assay. Each bar represents the mean ± SD of at least three independent experiments and *p < 0.05. (B) Cell counting assay was performed to count the number of cells that are living after treatment of linifanib. Each bar represents the mean ± SD of at least three independent experiments and *p < 0.05. (C) Morphological change was observed by microscope. (D) Colony formation assay was performed to visualize anti-proliferative effect of linifanib on SKOV3 cells. Each bar represents the mean ± SD of at least three independent experiments and *p < 0.05.
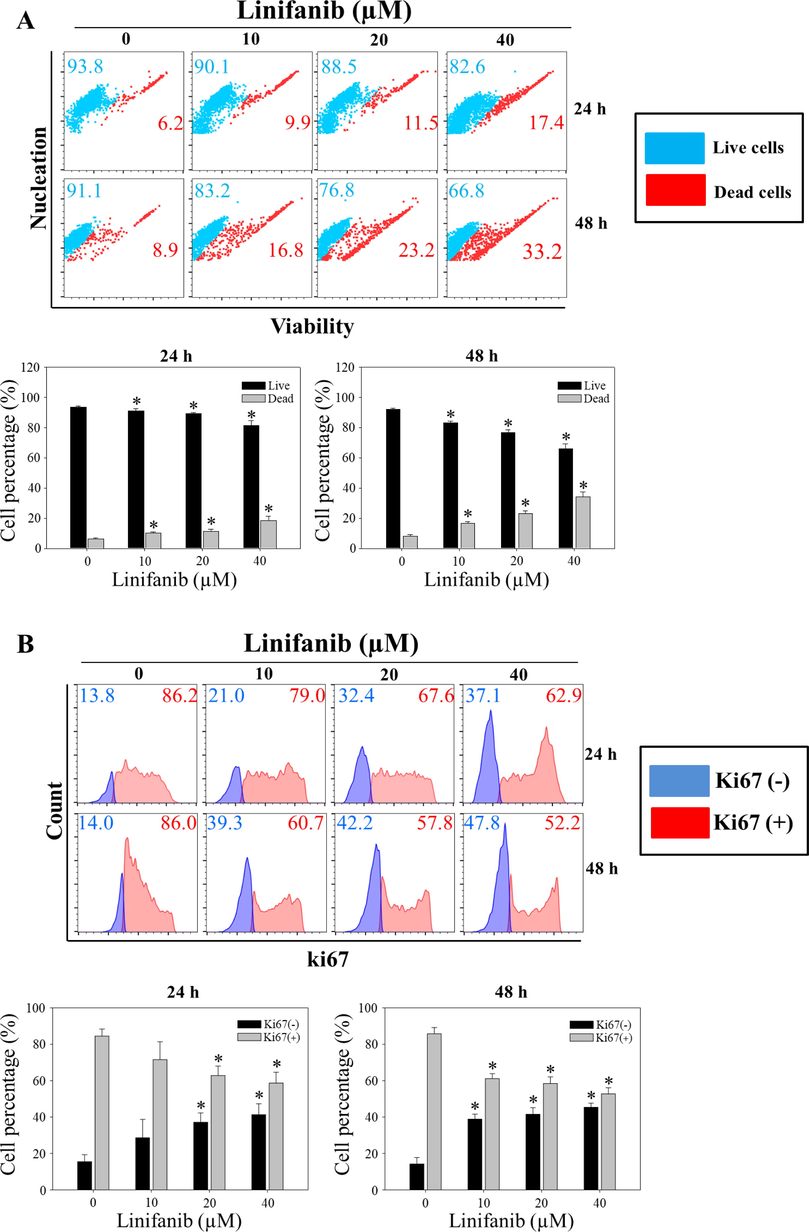
Anti-proliferative effect of linifanib on SKOV3 cells. (A) Evaluation of viability using the Muse Cell Analyzer. SKOV3 cells were treated with linifanib for 24 h and 48 h and analyzed. The percentages of live and dead cells were measured and the percentages were analyzed statistically. Each bar represents the mean ± SD of at least three independent experiments and *p < 0.05. (B) Evaluation of Ki67 using the Muse Cell Analyzer. SKOV3 cells were treated with linifanib for 24 h and 48 h and analyzed. The percentage of KI67-positive and KI67-negative cells were detected and the percentages were analyzed statistically. Each bar represents the mean ± SD of at least three independent experiments and *p < 0.05. (C) Analysis of cell cycle arrest using the Muse Cell Analyzer. SKOV3 cells were treated with linifanib for 24 h and 48 h and analyzed. The percentage of G2/M phase was measured and the results were analyzed statistically. Each bar represents the mean ± SD of at least three independent experiments and *p < 0.05.
Anti-proliferative effect of linifanib on SKOV3 cells. (A) Evaluation of viability using the Muse Cell Analyzer. SKOV3 cells were treated with linifanib for 24 h and 48 h and analyzed. The percentages of live and dead cells were measured and the percentages were analyzed statistically. Each bar represents the mean ± SD of at least three independent experiments and *p < 0.05. (B) Evaluation of Ki67 using the Muse Cell Analyzer. SKOV3 cells were treated with linifanib for 24 h and 48 h and analyzed. The percentage of KI67-positive and KI67-negative cells were detected and the percentages were analyzed statistically. Each bar represents the mean ± SD of at least three independent experiments and *p < 0.05. (C) Analysis of cell cycle arrest using the Muse Cell Analyzer. SKOV3 cells were treated with linifanib for 24 h and 48 h and analyzed. The percentage of G2/M phase was measured and the results were analyzed statistically. Each bar represents the mean ± SD of at least three independent experiments and *p < 0.05.
3.2 Linifanib inhibits migration and invasion of SKOV3 cells.
The anti-migratory and anti-invasive effects of linifanib were evaluated via wound healing assay, Boyden chamber assay, and zymography. We performed wound healing assay to assess the effect of linifanib on cell migration (Fig. 3A). We found that cells in control group moved faster to fill in the gap made by scratch than linifanib-treated groups. Yellow line indicated the boundary between cells and empty area. Statistical analysis revealed that empty area increased significantly after treatment of linifanib (20 and 40 µM) for 24 h and 48 h. We additionally performed Boyden chamber assay to investigate the anti-invasive effect of linifanib on SKOV3 cells (Fig. 3B). The number of invasive cells was significantly decreased in linifanib-treated groups compared to control. Furthermore, enzymatic activity of MMP2 was evaluated by zymography (Fig. 3C). The results showed that MMP2 activity decreased significantly in linifanib-treated groups compared to control. Taken together, our results suggested that linifanib inhibited migration and invasion of SKOV3 cells.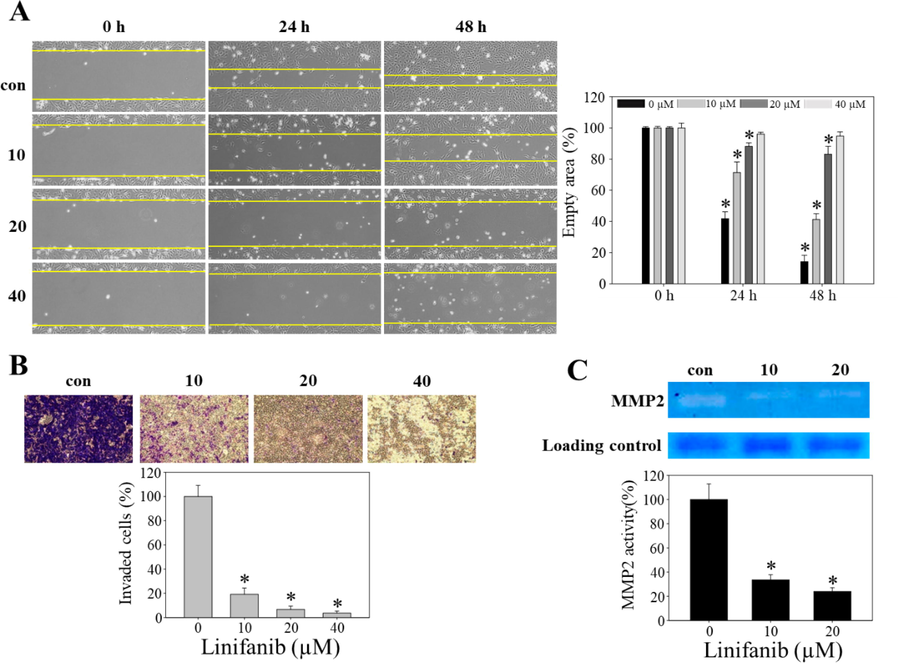
Anti-migration effect of linifanib on SKOV3 cells. (A) Cell migration was analyzed by wound-healing assay. Empty area was measured by ImageJ software and the results were statistically analyzed. Each bar represents the mean ± SD of at least three independent experiments and *p < 0.05. (B) Cell invasion was analyzed by Boyden Chamber assay. The number of cells that invaded the gelatin membrane was counted and the results were statistically analyzed. Each bar represents the mean ± SD of at least three independent experiments and *p < 0.05. (C) MMP2 enzyme activity was evaluated by gelatin zymography. Band area was measured by ImageJ software and the results were analyzed statistically. Each bar represents the mean ± SD of at least three independent experiments and *p < 0.05.
3.3 Linifanib induces apoptosis in SKOV3 cells.
To measure the total apoptotic cell rates (early and late apoptotic cells) of SKOV3 cells treated with linifanib, Muse Annexin V & Dead Cell kit was used. We found that linifanib increased total apoptotic cell rates (Fig. 4A). We also found that caspase-3,7-acviated cell rates increased after linifanib treatment (Fig. 4B). Furthermore, linifanib increased percentage of multi-caspase activated cells after treatment of linifanib (Fig. 4C). Interestingly, the percentages of bcl-2 inactivated and non-expression cells increased after linifanib treatment (Fig. 5A). Additionally, we found that depolarized mitochondria increased and mitochondrial biogenesis was reduced after linifanib treatment (Fig. 5B, C, and D). This result suggested that linifanib results in dysfunction of mitochondria. Furthermore, TUNEL assay was performed to visualize DNA strand breaks and showed that TUNEL-positive cells increased after linifanib treatment (Fig. 5E). Western blot results showed that PARP1, caspase-3, bcl-2 expression levels decreased and cleaved PARP1, cleaved caspase-3, FOXO3, p27, bax, and bim expression levels increased (Fig. 6). Interestingly, we found that FOXO3 and p27 were translocated from cytosol into nucleus after 48 h treatment of linifanib. Taken together, our results demonstrated that linifanib induced apoptosis in SKOV3 cells.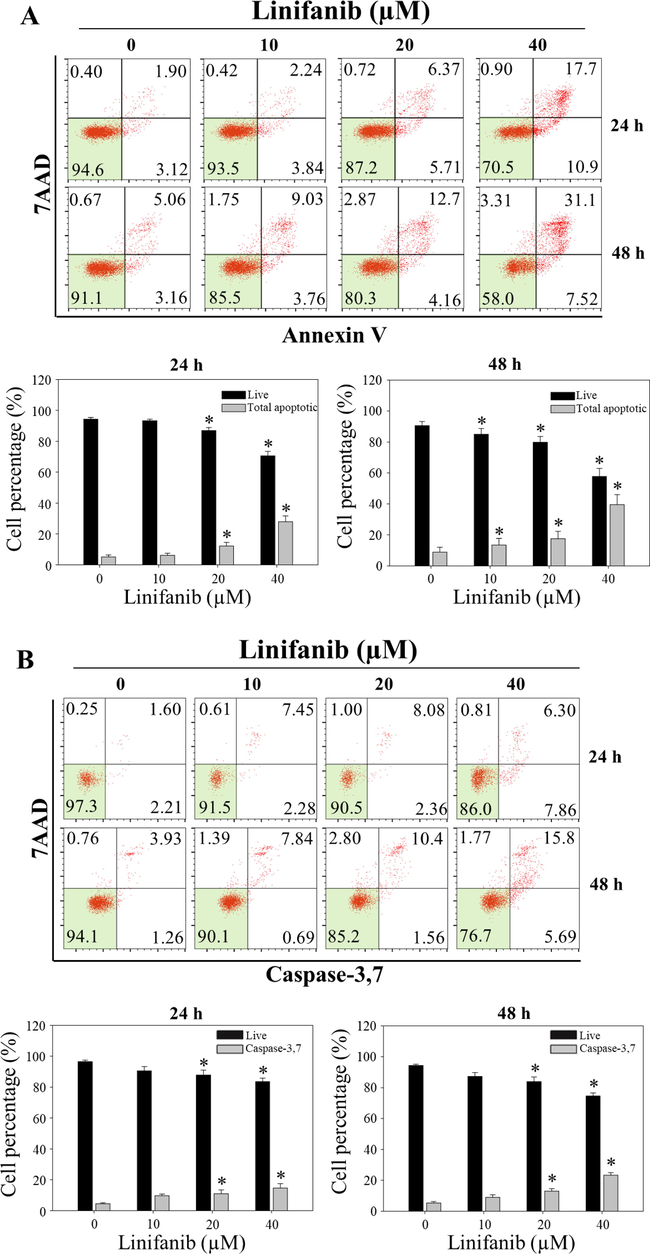
Induction of apoptotic by linifanib on SKOV3 cells. (A) Analysis of apoptosis using the Muse Cell Analyzer. SKOV3 cells were treated with linifanib for 24 h and 48 h and analyzed. The percentage of live, early apoptotic, and late apoptotic cells were measured and analyzed statistically. Each bar represents the mean ± SD of at least three independent experiments and *p < 0.05. (B) Evaluation of caspase-3,7 activity using the Muse Cell Analyzer. SKOV3 cells were treated with linifanib for 24 h and 48 h and analyzed. The percentage of caspase-3,7 activated cells were measured and analyzed statistically. Each bar represents the mean ± SD of at least three independent experiments and *p < 0.05. (C) Evaluation of Multi-caspase activity using the Muse Cell Analyzer. SKOV3 cells were treated with linifanib for 24 h and 48 h and analyzed. The percentage of multicaspase-activated cells were measured and analyzed statistically. Each bar represents the mean ± SD of at least three independent experiments and *p < 0.05.
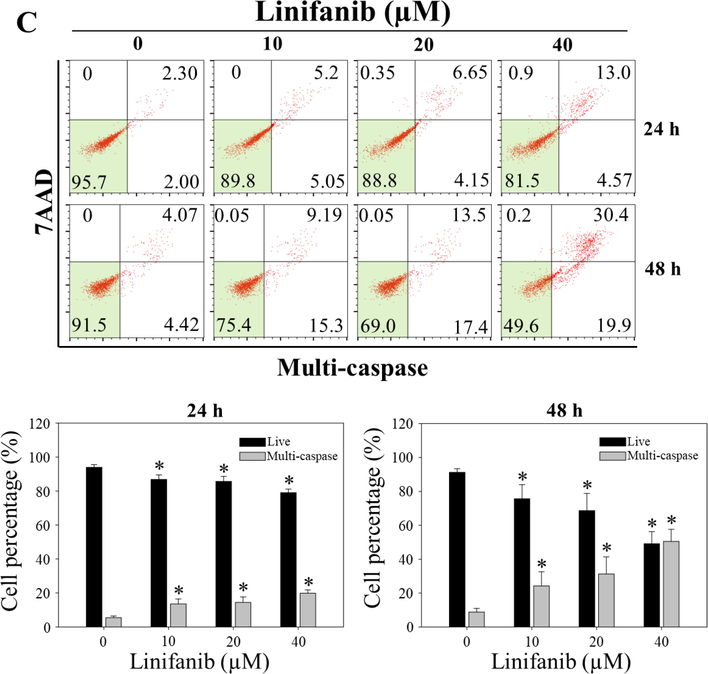
Induction of apoptotic by linifanib on SKOV3 cells. (A) Analysis of apoptosis using the Muse Cell Analyzer. SKOV3 cells were treated with linifanib for 24 h and 48 h and analyzed. The percentage of live, early apoptotic, and late apoptotic cells were measured and analyzed statistically. Each bar represents the mean ± SD of at least three independent experiments and *p < 0.05. (B) Evaluation of caspase-3,7 activity using the Muse Cell Analyzer. SKOV3 cells were treated with linifanib for 24 h and 48 h and analyzed. The percentage of caspase-3,7 activated cells were measured and analyzed statistically. Each bar represents the mean ± SD of at least three independent experiments and *p < 0.05. (C) Evaluation of Multi-caspase activity using the Muse Cell Analyzer. SKOV3 cells were treated with linifanib for 24 h and 48 h and analyzed. The percentage of multicaspase-activated cells were measured and analyzed statistically. Each bar represents the mean ± SD of at least three independent experiments and *p < 0.05.
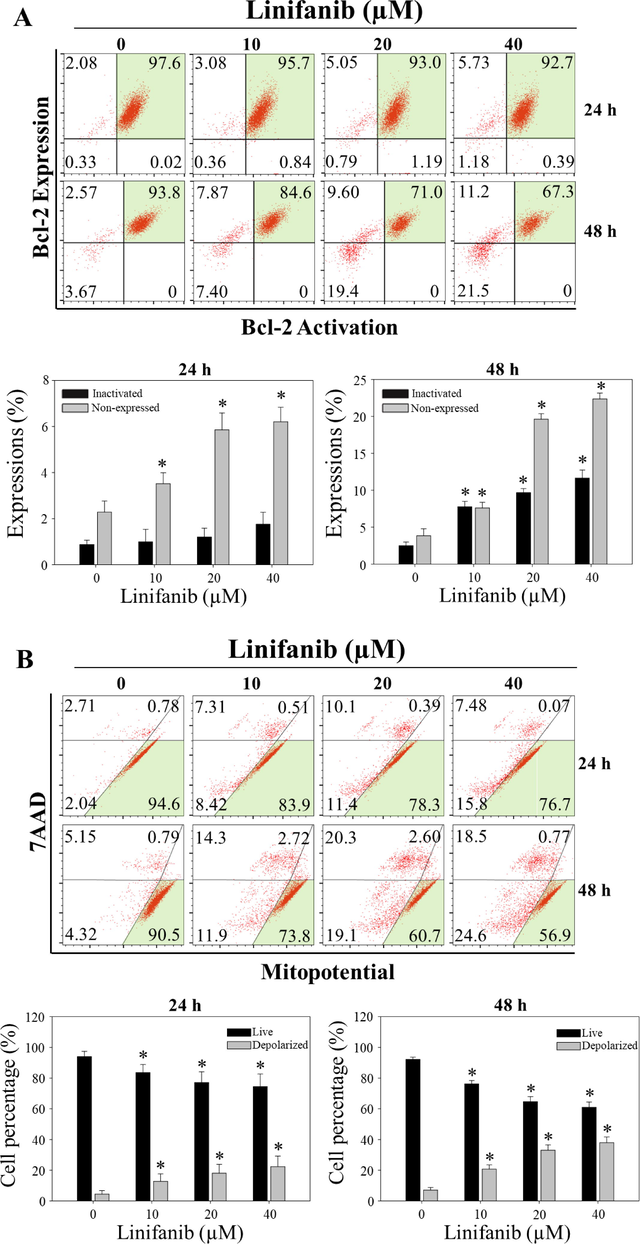
Induction of apoptotic by linifanib on SKOV3 cells. (A) Bcl-2 activation and expression profile of linifanib-treated SKOV3 cells using the Muse Cell Analyzer. SKOV3 cells were treated with linifanib for 24 h and 48 h and analyzed. The percentage of bcl-2 inactivated cells and bcl-2 non-expressed cells were measured and analyzed statistically. Each bar represents the mean ± SD of at least three independent experiments and *p < 0.05. (B) Evaluation of mito-potential using the Muse Cell Analyzer. SKOV3 cells were treated with linifanib for 24 h and 48 h and analyzed. The percentages of depolarized cells were measured and analyzed statistically. Each bar represents the mean ± SD of at least three independent experiments and *p < 0.05. (C) Western blotting analysis of COX1 and SDHA in SKOV3 cells treated with linifanib. Cells were treated with linifanib for 24 h and the expression levels of COX1 and SDHA were evaluated. β-actin was used as a loading control. (D) Analysis of ATP levels in SKOV3 cells treated with linifanib. Cells were treated with linifanib for 24 h and ATP levels were evaluated by CellTiter-Glo luminescent assay kit. Each bar represents the mean ± SD of at least three independent experiments and *p < 0.05. (E) DNA strand breaks induced by linifanib in SKOV3 cells. The cells were treated with linifanib for 24 h and 48 h and TUNEL assay was performed following manufacturer’s instruction. Nucleus was stained with Hoechst (blue) and DNA strand breaks were stained with TUNEL (green). Merged images showed DNA strand breaks in nucleus. The percentages of TUNEL-positive cells were counted and statistically analyzed. Each bar represents the mean ± SD of at least three independent experiments and *p < 0.05.
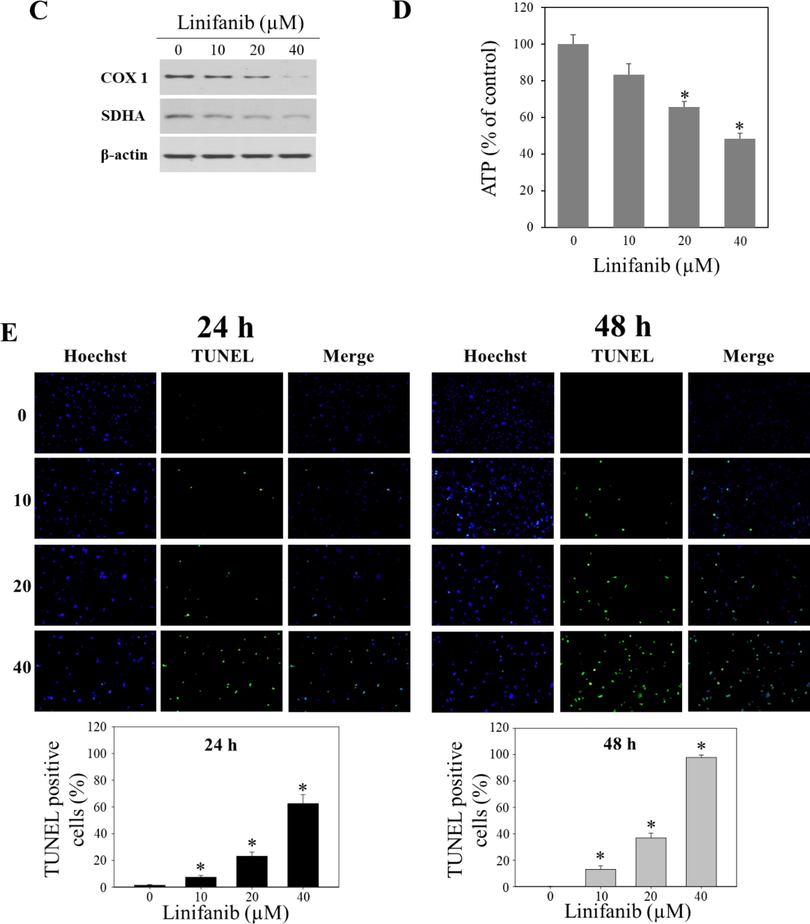
Induction of apoptotic by linifanib on SKOV3 cells. (A) Bcl-2 activation and expression profile of linifanib-treated SKOV3 cells using the Muse Cell Analyzer. SKOV3 cells were treated with linifanib for 24 h and 48 h and analyzed. The percentage of bcl-2 inactivated cells and bcl-2 non-expressed cells were measured and analyzed statistically. Each bar represents the mean ± SD of at least three independent experiments and *p < 0.05. (B) Evaluation of mito-potential using the Muse Cell Analyzer. SKOV3 cells were treated with linifanib for 24 h and 48 h and analyzed. The percentages of depolarized cells were measured and analyzed statistically. Each bar represents the mean ± SD of at least three independent experiments and *p < 0.05. (C) Western blotting analysis of COX1 and SDHA in SKOV3 cells treated with linifanib. Cells were treated with linifanib for 24 h and the expression levels of COX1 and SDHA were evaluated. β-actin was used as a loading control. (D) Analysis of ATP levels in SKOV3 cells treated with linifanib. Cells were treated with linifanib for 24 h and ATP levels were evaluated by CellTiter-Glo luminescent assay kit. Each bar represents the mean ± SD of at least three independent experiments and *p < 0.05. (E) DNA strand breaks induced by linifanib in SKOV3 cells. The cells were treated with linifanib for 24 h and 48 h and TUNEL assay was performed following manufacturer’s instruction. Nucleus was stained with Hoechst (blue) and DNA strand breaks were stained with TUNEL (green). Merged images showed DNA strand breaks in nucleus. The percentages of TUNEL-positive cells were counted and statistically analyzed. Each bar represents the mean ± SD of at least three independent experiments and *p < 0.05.
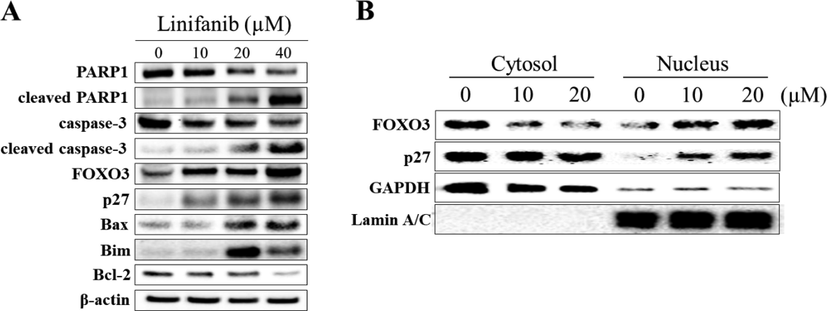
Western blotting analysis of SKOV3 cells treated with linifanib. (A) Cells were treated with linifanib for 24 h and the expression levels of PARP1, cleaved PARP1, caspase-3, cleaved caspase-3, FOXO3, p27, bax, bim, and bcl-2 were evaluated. β-actin was used as a loading control. (B) Additionally, SKOV3 cells were treated with linifanib for 48 h and cytosol/nucleus fractionation was performed. Translocation of FOXO3 and p27 was observed. GAPDH and Lamin A/C were used as a loading control.
3.4 Linifanib induces intracellular ROS generation and DNA damage in SKOV3 cells.
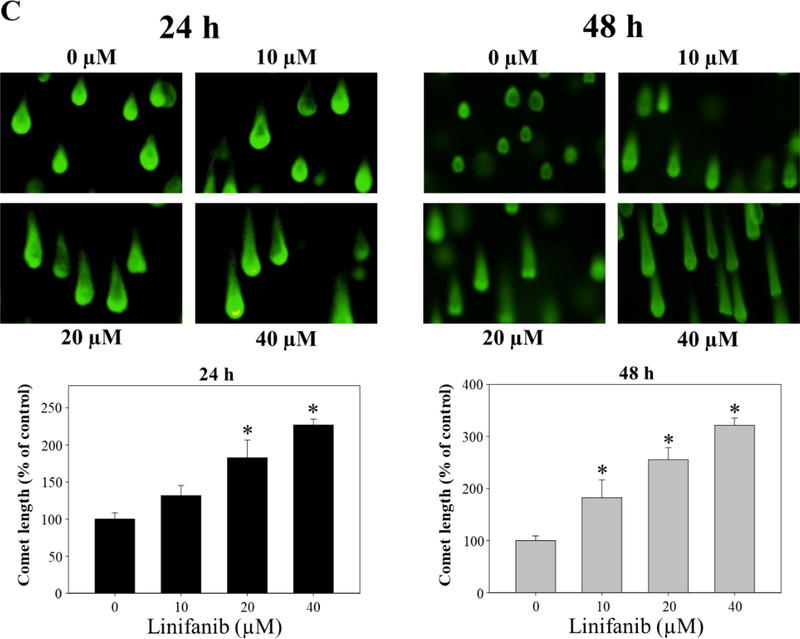
Intracellular ROS level after treatment of linifanib in SKOV3 cells was measured using Muse cell analyzer. We found that intracellular ROS level increased after linifanib treatment (Fig. 7A). We also found that thioredoxin-1 and peroxiredoxin-1 expression levels decreased after 48 h linifanib treatment. The percentages of pATM and pH2A.X after treatment of linifanib were measured through Muse cell analyzer. As shown in Fig. 7B, we found that total DNA damage cells (pATM-positive, pH2A.X-positive, and pATM/pH2A.X-positive cells) increased after treatment of linifanib in SKOV3 cells. Furthermore, comet assay that is a different experiment to show DNA damage was performed and the results showed that comet tail length increased after linifanib treatment, which suggested that DNA was damaged by linifanib (Fig. 7C).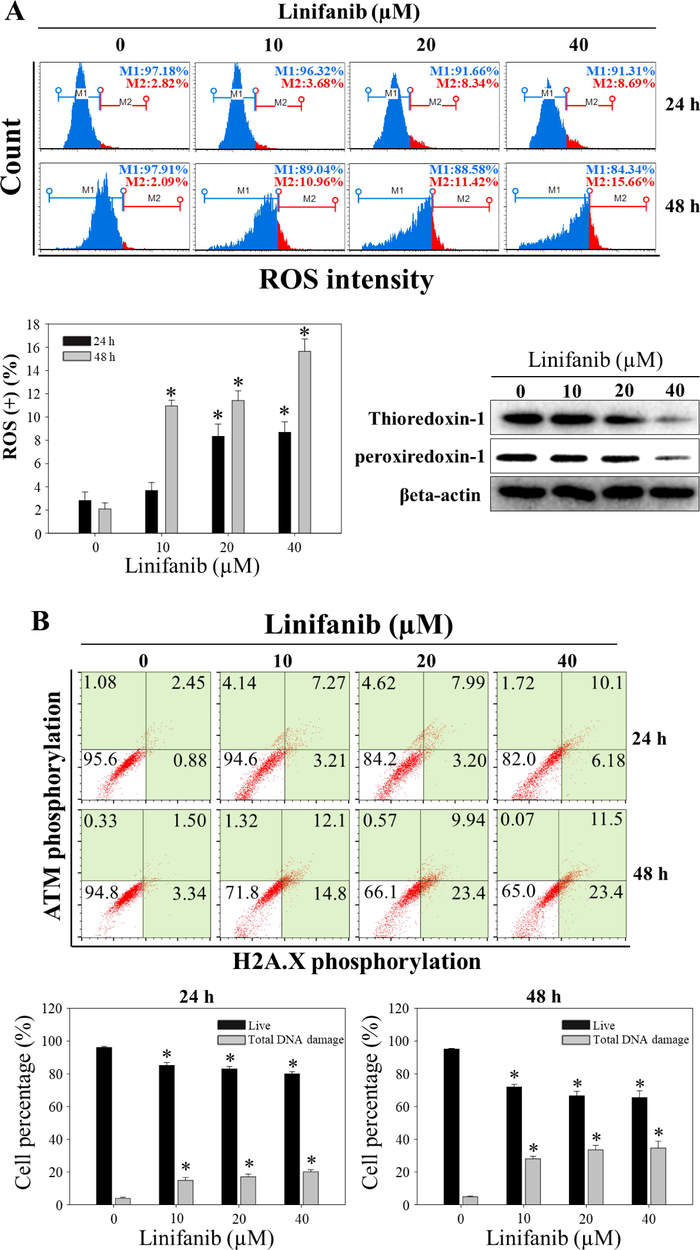
Induction of ROS by linifanib on SKOV3 cells. (A) Intracellular ROS induced by linifanib. SKOV3 cells were treated with linifanib for 24 h and 48 h. SKOV3 cells were treated with linifanib for 24 h and 48 h and analyzed. The percentages of ROS-positive cells (red) were measured and analyzed statistically. Each bar represents the mean ± SD of at least three independent experiments and *p < 0.05. Additionally, SKOV3 cells were treated with linifanib for 48 h and expression levels of thioredoxin-1 and peroxiredoxin-1 were evaluated through western blotting. β-actin was used as a loading control. (B) Evaluation of DNA-damage using the Muse Cell Analyzer. SKOV3 cells were treated with linifanib for 24 h and 48 h and analyzed. The percentages of total DNA-damaged cells (pATM-positive, pH2A.X-positive, and pATM/pH2A.X-positive cells) were measured and analyzed statistically. Each bar represents the mean ± SD of at least three independent experiments and *p < 0.05. (C) Visualization of DNA damage induced by linifanib in SKOV3 cells through comet assay. The cells were treated with linifanib for 24 h and 48 h and comet assay was performed following manufacturer’s instruction. Comet length was measured and analyzed statistically. Each bar represents the mean ± SD of at least three independent experiments and *p < 0.05.
Induction of ROS by linifanib on SKOV3 cells. (A) Intracellular ROS induced by linifanib. SKOV3 cells were treated with linifanib for 24 h and 48 h. SKOV3 cells were treated with linifanib for 24 h and 48 h and analyzed. The percentages of ROS-positive cells (red) were measured and analyzed statistically. Each bar represents the mean ± SD of at least three independent experiments and *p < 0.05. Additionally, SKOV3 cells were treated with linifanib for 48 h and expression levels of thioredoxin-1 and peroxiredoxin-1 were evaluated through western blotting. β-actin was used as a loading control. (B) Evaluation of DNA-damage using the Muse Cell Analyzer. SKOV3 cells were treated with linifanib for 24 h and 48 h and analyzed. The percentages of total DNA-damaged cells (pATM-positive, pH2A.X-positive, and pATM/pH2A.X-positive cells) were measured and analyzed statistically. Each bar represents the mean ± SD of at least three independent experiments and *p < 0.05. (C) Visualization of DNA damage induced by linifanib in SKOV3 cells through comet assay. The cells were treated with linifanib for 24 h and 48 h and comet assay was performed following manufacturer’s instruction. Comet length was measured and analyzed statistically. Each bar represents the mean ± SD of at least three independent experiments and *p < 0.05.
4 Discussion
As we mentioned previously in introduction, ovarian cancer is common in women, however, prognosis of women who are diagnosed with ovarian cancer is not good. Even though 5-year survival rates of most cancers have increased gradually, ovarian cancer still remains an exception (Trinidad et al., 2020). Even though up-to-date therapeutic methods, such as surgery and chemotherapy can get rid of tumors to some extent, however, the main side effect of these methods is that the recurrence rate is high (Cortez et al., 2018). Therefore, alternative methods to treat ovarian cancer with few side effects need to be developed. Recently, target therapy has been recognized as new method to treat human diseases, especially cancers (Chiang et al., 2020, Li et al., 2020a, 2020b). In target therapy for cancer treatment, it is important to understand the mechanism of cancer development. To understand the mechanism of cancer development, in vitro experiments should be conducted and we have to try to find important factors that regulate cancer cell proliferation. Here, we investigated how linifanib that is known as tyrosine-receptor kinase could suppress human ovarian cancer SKOV3 cells. We expected our study to help understand the mechanism of how ovarian cancer develops and how to inhibit this cancer effectively.
FOXO3 is a transcription factor that plays an important role in regulation of cell survival-related genes (Tezil et al., 2012, Kang et al., 2019). For instance, it was reported that FOXO3 up-regulates p21 and p27, which are well known to induce cell cycle arrest and prohibit cell survival (Zhang and Zhang 2019). It has been identified that FOXO3 is regulated by AKT that is a upstream kinase of FOXO3 (Tzivion et al., 2011). Phosphorylated FOXO3 is transferred to cytosol from nucleus through 14–3-3 proteins and exportins (Liu et al., 2018). FOXO3 in cytosol cannot act as a transcription factor. FOXO3 and Akt signaling pathways are important factors of cell survival, which suggested these pathways could be important target for cancer treatment.
FOXO3 has been an important target for inhibition of ovarian cancer cells. It was reported that up-regulation of FOXO3 by microRNAs-498 suppressed human ovarian cancer cell lines (Liu et al., 2015). This study showed that FOXO3 knock-down promoted cell survival, which suggested that FOXO3 up-regulation could be important target for inhibition of ovarian cancer cells. Furthermore, a previous study showed that down-regulation of FOXO3 promotes cell survival, which implies that FOXO3 up-regulation can be a key of how to suppress ovarian cancer cells (Wei et al., 2016).
Tyrosine kinase inhibitors have been recognized as potential reagents for targeted therapy of cancers (Luo et al., 2012). Linifanib is one of tyrosine kinase inhibitors that has future potential in cancer treatment (Aversa et al., 2015). Several studies showed the anti-cancer effect of linifanib clinically. It was reported that linifanib exerts anti-carcinogenic effects in patients of hepatocellular carcinoma (Toh et al., 2013). Furthermore, linifanib has anti-carcinogenic effect in patients with locally advanced lung cancer (Tan et al., 2011). The other study reported that linifanib has therapeutic effects in patients with metastatic colorectal cancer (Chan et al., 2017).
Suppressive effects of linifanib in various cancer cell lines and in vivo were shown in previous studies. Linifanib induced apoptosis and cell cycle arrest in head and neck squamous cell carcinoma UMSCC-22A and UMSCC-22B cells (Hsu et al., 2013). Moreover, it has been reported that linifanib suppressed AKT/mTOR pathways mediated by receptor tyrosine kinase in gastric cancer (Chen et al., 2016). Not only did this research show that linifanib induced cell cycle arrest and apoptosis in gastric cancer SGC-7901 cells, but also demonstrate that linifanib suppressed tumor growth in a gastric cancer xenograft mouse model.
As we mentioned previously, FOXO3 signaling pathway plays pivotal role in cell survival (Fu and Tindall 2008). Therefore, it is crucial to find the effect reagent to regulate FOXO3 signaling pathway to suppress ovarian cancer. Here, we investigated the effect of linifanib on FOXO3 in human ovarian cancer SKOV3 because there have hardly been any studies that investigated the effect of linifanib on FOXO3 signaling pathway in cancers. We found that linifanib up-regulated FOXO3 expression. Interestingly, we also found that linifanib induced translocation of FOXO3 from cytosol into nucleus, which suggested that FOXO3 acts as transcription factor in nucleus, which activates various signaling pathways related to apoptosis and cell cycle arrest (Dabrowska et al., 2008, Das et al., 2016).
Reactive oxygen species (ROS) is interesting and crucial factor in cell survival, especially cancers because the balance of intracellular ROS level directly affects cell functions (Liou and Storz 2010). It has been reported that increased intracellular ROS level induced DNA damage, which means it affects interpretation and transmission of genetic information (Rowe et al., 2008, Srinivas et al., 2019). Therefore, to suppress cancer, effective reagents that induce intracellular ROS in cancers need to be found. In this study, we found that linifanib increased intracellular ROS levels in SKOV3 cells. Interestingly, our results strongly demonstrated that linifanib induced DNA damage in nucleus. Taken together, our results suggested that linifanib could be an effective reagent that induces intracellular ROS level and DNA damage in human ovarian cancer.
In conclusion, our results showed the anti-carcinogenic effects of linifanib that is a tyrosine receptor kinase in human ovarian cancer SKOV3 cells. We found various physiological characteristics induced in apoptotic cells, such as depolarization of mito-potential, activation of apoptotic signaling pathway, induction of intracellular ROS, and DNA damage. Interestingly, linifanib induced translocation of FOXO3 from cytosol to nucleus, which suggested that FOXO3 was transferred into the nucleus and it can act as transcription factor, which activates apoptotic signaling pathway and induces cell cycle arrest. Taken together, linifanib induced apoptosis and suppressed proliferation in human ovarian cancer SKOV3 cells, which suggested that linifanib might be a future therapeutic reagent for ovarian cancer treatment.
Acknowledgements
This research was supported by the Basic Science Research Program (NRF-2014R1A6A3A04054307) through the National Research Foundation of Korea (NRF) funded by the Ministry of Science and ICT (MSIP). This research was supported by the Medical Research Center Program (NRF-2017R1A5A2015061) through the National Research Foundation of Korea (NRF) funded by the Ministry of Science and ICT (MSIP).
Declaration of Competing Interest
The authors declare that they have no known competing financial interests or personal relationships that could have appeared to influence the work reported in this paper.
References
- Linifanib: current status and future potential in cancer therapy. Expert Rev. Anticancer Ther.. 2015;15:677-687.
- [CrossRef] [Google Scholar]
- Linifanib versus Sorafenib in patients with advanced hepatocellular carcinoma: results of a randomized phase III trial. J. Clin. Oncol.. 2015;33:172-179.
- [CrossRef] [Google Scholar]
- Phase II study of the Multikinase inhibitor of angiogenesis, Linifanib, in patients with metastatic and refractory colorectal cancer expressing mutated KRAS. Invest. New Drugs. 2017;35:491-498.
- [CrossRef] [Google Scholar]
- Linifanib (ABT-869) Potentiates the Efficacy of Chemotherapeutic Agents through the Suppression of Receptor Tyrosine Kinase-Mediated AKT/mTOR Signaling Pathways in Gastric Cancer. Sci. Rep.. 2016;6:29382.
- [CrossRef] [Google Scholar]
- EGFRI-associated health-related quality of life by severity of skin toxicity in metastatic colorectal cancer patients receiving epidermal growth factor receptor inhibitor target therapy. Support. Care Cancer. 2020;28:4771-4779.
- [CrossRef] [Google Scholar]
- Advances in ovarian cancer therapy. Cancer Chemother. Pharmacol.. 2018;81:17-38.
- [CrossRef] [Google Scholar]
- Tat-induced FOXO3a is a key mediator of apoptosis in HIV-1-infected human CD4+ T lymphocytes. J. Immunol. (Baltimore, Md. 1950). 2008;181:8460-8477.
- [CrossRef] [Google Scholar]
- Inhibition of AKT promotes FOXO3a-dependent apoptosis in prostate cancer. Cell Death Dis.. 2016;7:e2111-e.
- [CrossRef] [Google Scholar]
- Linifanib (ABT-869) enhances radiosensitivity of head and neck squamous cell carcinoma cells. Oral Oncol.. 2013;49:591-597.
- [CrossRef] [Google Scholar]
- Interleukin4Rα (IL4Rα) and IL13Rα1 Are Associated with the Progress of Renal Cell Carcinoma through Janus Kinase 2 (JAK2)/Forkhead Box O3 (FOXO3) Pathways. Cancers.. 2019;11:1394.
- [Google Scholar]
- Activation of FOXO3 pathway is involved in polyphyllin I-induced apoptosis and cell cycle arrest in human bladder cancer cells. Arch. Biochem. Biophys.. 2020;687:108363
- [CrossRef] [Google Scholar]
- Applications of genome editing technology in the targeted therapy of human diseases: mechanisms, advances and prospects. Signal Transduction Targeted Therapy. 2020;5:1.
- [CrossRef] [Google Scholar]
- MiR-498 regulated FOXO3 expression and inhibited the proliferation of human ovarian cancer cells. Biomed. Pharmacother.. 2015;72:52-57.
- [CrossRef] [Google Scholar]
- The forkhead transcription factor Foxo3 negatively regulates natural killer cell function and viral clearance in myocarditis. Eur. Heart J.. 2018;39:876-887.
- [CrossRef] [Google Scholar]
- A novel multi-targeted tyrosine kinase inhibitor, linifanib (ABT-869), produces functional and structural changes in tumor vasculature in an orthotopic rat glioma model. Cancer Chemother. Pharmacol.. 2012;69:911-921.
- [CrossRef] [Google Scholar]
- Ovarian cancer in the world: epidemiology and risk factors. Int J Womens Health.. 2019;11:287-299.
- [CrossRef] [Google Scholar]
- Chemotherapy Resistance in Advanced Ovarian Cancer Patients. Biomarkers Cancer. 2019;11 1179299X19860815
- [CrossRef] [Google Scholar]
- DNA damage-induced reactive oxygen species (ROS) stress response in Saccharomyces cerevisiae. Free Radical Biol. Med.. 2008;45:1167-1177.
- [CrossRef] [Google Scholar]
- Phase 2 Trial of Linifanib (ABT-869) in Patients with Advanced Non-small Cell Lung Cancer. J. Thoracic Oncol.. 2011;6:1418-1425.
- [CrossRef] [Google Scholar]
- IKK-β mediates chemoresistance by sequestering FOXO3; A critical factor for cell survival and death. Cell. Signal.. 2012;24:1361-1368.
- [CrossRef] [Google Scholar]
- Role of Forkhead Box O (FOXO) transcription factor in aging and diseases. Gene. 2018;648:97-105.
- [CrossRef] [Google Scholar]
- Phase 2 trial of linifanib (ABT-869) in patients with unresectable or metastatic hepatocellular carcinoma. Cancer. 2013;119:380-387.
- [CrossRef] [Google Scholar]
- Reducing Ovarian Cancer Mortality Through Early Detection: Approaches Using Circulating Biomarkers. Cancer Prevent. Res. (Philadelphia, Pa.). 2020;13:241-252.
- [CrossRef] [Google Scholar]
- FoxO transcription factors; Regulation by AKT and 14–3-3 proteins. Biochim. Biophys. Acta (BBA) – Mol. Cell Res.. 2011;1813:1938-1945.
- [CrossRef] [Google Scholar]
- Spectrophotometric and molecular modelling studies on in vitro interaction of tyrosine kinase inhibitor linifanib with bovine serum albumin. PLoS ONE. 2017;12:e0176015.
- [Google Scholar]
- Downregulation of Foxo3 and TRIM31 by miR-551b in side population promotes cell proliferation, invasion, and drug resistance of ovarian cancer. Med. Oncol.. 2016;33:126.
- [CrossRef] [Google Scholar]
- Flavonoids from Chinese bayberry leaves induced apoptosis and G1 cell cycle arrest via Erk pathway in ovarian cancer cells. Eur. J. Med. Chem.. 2018;147:218-226.
- [CrossRef] [Google Scholar]
- The role of PI3K/AKT/FOXO signaling in psoriasis. Arch. Dermatol. Res.. 2019;311:83-91.
- [CrossRef] [Google Scholar]


