

Translate this page into:
Liquid–liquid extraction of tantalum and niobium by octanol from sulfate leach liquor
*Corresponding author monaellhazek@hotmail.com (M.N. El-Hazek)
-
Received: ,
Accepted: ,
This article was originally published by Elsevier and was migrated to Scientific Scholar after the change of Publisher.
Available online 30 July 2010
Abstract
Extraction of tantalum and niobium from sulfate leach liquor of south Gabal El-A’urf polymineralized ore material was carried out by using octanol. The latter was contacted with the sulfate leach liquor prepared after fusing the highly mineralized ore sample with potassium bisulphate in a weight ratio of 1/3 at 650 °C for 3 h. From the McCabe–Thiele diagram, it is proposed that three extraction stages are sufficient to extract most of the Ta and Nb contents efficiently at the optimum extraction conditions of 100% octanol, and A/O ratio of 1/1.
A highly pure product of Ta was achieved by keeping the pH of the leach liquor at 2.0 with contact time of 15 min. With respect to Nb, pH of 0.7 and contact time of 5 min were sufficient to extract most of the Nb contents efficiently. Finally, a technical flowsheet was constructed.
Keywords
Niobium
Tantalum
Lanthanides
Titanium
Recovery
Liquid–liquid extraction
Octanol

1 Introduction
Recently, a polymineralized ore material containing tanteuxenite, monazite, bastanasite, anatase, and zircon has been discovered in south Gabal El-A’urf area, Eastern Desert, Egypt. This ore material assays 6.65% RE2O3, 5.36% Nb2O5 as well as 6.15% TiO2 and 4.50% ZrO2 besides 0.47% Ta2O5. This ore material has been subjected to fusion with potassium bisulphate in a weight ratio of 1/3 at 650 °C for 3 h. The realized dissolution efficiencies for all metal values were as follows: 98.0% and 99.3% for Nb and Ta, respectively, as well as complete dissolution for lanthanides (REE) and 94% for Ti (El-Hazek et al., 2010).
With respect to Nb and Ta recovery, many works have been studied – in detail – the possibilities of extracting Nb and Ta by liquid–liquid extraction method. Maiorov et al. (2001) regarding the possibility of Nb and Ta recovery with n-octanol from HF acid solutions (Nb about 0.11 M and Ta as low as about 0.0045 M) while containing large amounts of Ti (2–3 M). They recovered 95.7% and 84.1% of Ta and Nb, respectively. Moreover, Mayorov and Nikolaev (2002) as well as Anatoly et al. (2004) carried out the liquid–liquid extraction process of Ta–Nb, as a result of processing tantalite and columbite, by 2-octanol from fluoride–sulfuric acid solutions.
On the other hand, El Hussaini (1996) studied the extraction of Nb and Ta from columbite–tantalite ore material using either TBP or MIBK from HF/HNO3 and HF/H2SO4 leach liquors. Also, El Hazek (2001) studied bulk extraction of Nb and Ta from HF/H2SO4 liquor with undiluted MIBK and then separation between them was achieved by selective Nb stripping using 1 N H2SO4 acid and selective Ta stripping using water. Moreover, Amer (2007) studied the extraction of Nb from pre-processed ore material (after removing U, As, Th, REE and Ta) using TBP from HF/H2SO4 leach liquor.
In the present work, a sulfate leach liquor was prepared from a highly mineralized ore sample using the fusion method (1/3 O/R weight ratio at 650 °C for 3 h). The produced pregnant solution pH is 2.3 and assays 22.18 g/l RE2O3, 17.52 g/l Nb2O5 19.29 g/l TiO2, 3.0 g/l ZrO2 and 1.58 g/l Ta2O5. The pH of this pregnant solution was adjusted with oxalic acid to precipitate both REE and Ti. After filtration, the leach liquor was adopted for Nb and Ta extraction by octan-2-ol. The relevant factors are studied.
2 Experimental
2.1 Analytical procedures
2.1.1 Determination of titanium element
Ti was analyzed by the atomic absorption technique using a Unicam Instrument model 969 (Nitrous–Air acetylene flame), auto gas box. This element was measured at the wavelength 365.4 nm (Welz and Sperling, 1999).
2.1.2 Determination of rare earth elements
A spectrophotometric method was applied where REE form stable colored complex with Arsenazo III in weakly acidic media. In this method, the pH is adjusted to about 2.6 and the absorbance was measured at wavelength 650 nm against a reagent blank solution (Marchzenko, 1986) using a double-beam UV–Visible Shimadzu (model 160A) spectrometer.
2.1.3 Determination of niobium and tantalum
Nb and Ta were analyzed by the atomic absorption technique at the wavelengths 334.4 and 271.5 nm, respectively (Welz and Sperling, 1999).
2.1.4 The environmental scanning electron microscope
(ESEM-EXL 30 Philips type) coupled with an energy dispersive X-ray analyzer (EDX unit system) was also used to define the composition of products.
2.2 Recovery procedures
These include direct precipitation of REE and Ti followed by solvent extraction for Nb and Ta.
2.2.1 Direct precipitation of REE and Ti
REEs and titanium were recovered firstly by the addition of oxalic acid to be precipitated as rare earth and titanium oxalates and then separation between them was done by pH adjustment.
2.2.2 Solvent extraction of Nb and Ta
Extraction of Nb and Ta was carried out using the organic solvent octan-2-ol. The solvent was diluted in kerosene to prepare different concentrations. In each extraction experiment, the organic phase was conducted with the aqueous phase in separating funnel where they were shaken together for the desired time. The two phases were then allowed to settle, separate and an aliquot sample of the aqueous phase was analyzed for its remaining metal content in order to calculate the distribution coefficient.
The relevant solvent extraction factors; namely solvent concentration, the contact time and the pH of the leach liquor as well as aqueous/organic ratio (A/O) were studied. In addition, to calculate the number of theoretical stages required for maximum loading and stripping of the solvent phase, the McCabe–Thiele diagram was constructed. On the other hand, a loaded solvent sample was prepared for studying the stripping behavior of the extracted metal value. Using the same procedures as that used for extraction, mixture of sulfuric and hydrofluoric acids was used for stripping Nb and H2O was used for stripping Ta. The relevant factors thereof have been studied including contact time and A/O ratio. The latter has also been used to construct the stripping McCabe–Thiele diagram.
3 Results and discussion
3.1 Preparation of a sulfate leach liquor
A sulfate leach liquor was prepared from a highly mineralized ore sample (Table 1) (El-Hazek et al., submitted for publication) using the fusion method (1/3 O/R ratio at 650 °C for 3 h). The produced pregnant solution pH is 2.3 and assays 22.18 g/l RE2O3, 17.52 g/l Nb2O5 19.29 g/l TiO2, 3.0 g/l ZrO2 and 1.58 g/l Ta2O5 (Table 2). This sulfate leach liquor is used to extract the interesting metal values Nb, Ta, Ti and REE besides Al and Fe as the major interfering elements. Thus, REE and Ti are first recovered using direct precipitation technique. This is followed by Nb and Ta extraction using extractant octan-2-ol (C8H18O).
Major constituent
Wt. (%)
Trace constituent
Wt. (%)
SiO2
74.00
RE2O3a
6.65
TiO2
6.15
Nb2O5
5.36
Al2O3
5.00
Ta2O5
0.47
Fe2O3
5.10
ZrO2
4.50
CaO
1.64
U3O8
0.01
MgO
0.80
ThO2
0.04
MnO
0.05
Na2O
2.13
K2O
4.92
P2O5
0.06
L.O.I
0.74
Total
100.12
3.2 Recovery of REEs and Ti
3.2.1 Co- precipitation of REEs and Ti
The recovery of REE and Ti was carried out by applying direct precipitation technique using 10% oxalic acid. The precipitation process was studied by adding oxalic acid at different pH values ranging from 0.7 to 2.2 at room temperature. At pH 1.9 nearly complete REEs and Ti precipitation occurred where their precipitation efficiencies attained 97.4% and 95.5%, respectively, as shown in Fig. 1.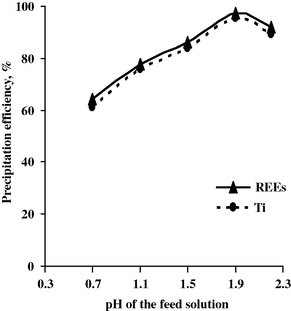
Effect of pH upon REE and Ti precipitation efficiency.
The chemical reaction of oxalic acid with REE and Ti bisulfates can be expressed as:
3.2.2 Separation of titanium from rare earths
To separate REE from Ti, the produced oxalate cake was re-dissolved in 1:1 HCl to form rare earths and titanium chlorides; then KOH was added to precipitate Ti selectively at pH 1 as titanium hydroxide. After filtration, another precipitation step for Fe and Al was performed at a pH range of 2.5–4. Then REE was precipitated at pH 6–7 as rare earths hydroxides. Both Ti and REE products can be calcined at 800 °C to produce their oxides (Marchzenko, 1986) as shown in Figs. 2 and 3.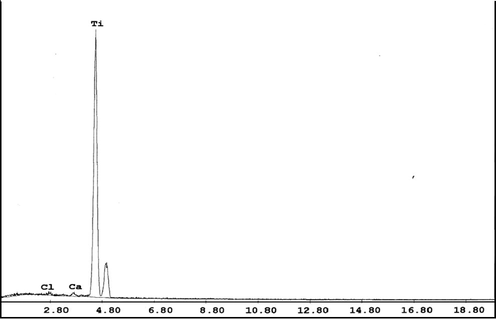
EDAX analysis of Ti product.
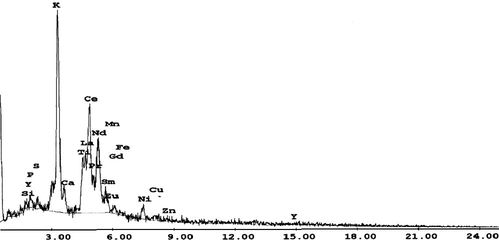
EDAX analysis of REE product.
The expected chemical reactions can be expressed as follows:
3.3 Recovery of tantalum and niobium
Before the recovery of Nb and Ta, the feed solution (free from Ti and REE) should be re-adjusted at pH 2.5–4 to ensure the precipitation of any residual Fe and Al. Increasing the pH of the feed solution above this value may cause co-precipitation of Nb and Ta with Fe and Al.
Solvent octan-2-ol (C8H18O) was chosen for extracting both Nb and Ta from the feed solution because of its availability and low cost. Generally, octan-2-ol besides being used as a modifier to remove the third phase when using other solvents, its good solvating character which depends on the acidity of the leach liquor acts much better with respect to the impurities entrainment than the modified reagents. This may be due to its high dipole moment and the presence of electronegative O–H bond; its molecular formula is {CH3CH (OH) CH2CH2CH2CH2CH2CH3} (Terry, 1983). Alcohols of C8–C12 chain length could have particular interest as prospective extractants for LLE (liquid–liquid extraction) where 1-octanol provides efficiency comparable to both MIBK and TBP in LLE of tantalum and niobium. The main advantages of 2-Octanol are very low solubility in water, sufficiently less volatile and less dangerous.
According to Mayorov and Nikolaev as well as Anatoly (Maiorov et al., 2001; Mayorov and Nikolaev, 2002), the extraction of Nb and Ta using octan-2-ol depends largely on the acidity of feed solution where Nb is extracted at a higher acidity than Ta. In the present work, it was decided to selectively recover Nb and Ta through adjusting the pH value of the feed solution.
To study the effect of pH and the contact time upon the extraction efficiency of Nb and Ta using undiluted octan-2-ol, two sets of extraction experiments were performed. The first series includes the effect of pH upon the extraction efficiency of Nb and Ta at contact time of 15 min, A/O of 1:1 and 100% octan-2-ol. The second series includes the effect of time upon the extraction efficiency of Nb and Ta at pH 2.0, A/O of 1:1 and 100% octan-2-ol. The data are shown in Figs. 4 and 5.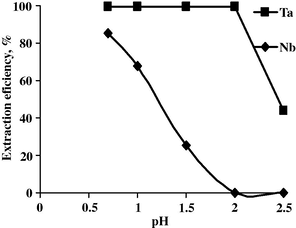
Effect of pH upon the extraction efficiency of Nb and Ta.
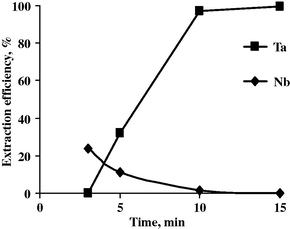
Effect of time upon the extraction efficiency of Nb and Ta.
From the results obtained, it is obvious that by increasing the pH from 0.7 to 2.0, the Ta extraction efficiency is steady to be 99.3% while Nb extraction efficiency decreased from 85.5 to nil. At a pH of 2.5, the Ta extraction efficiency decreased to 43.7 and Nb was not extracted at all under the same experimental conditions.
In the meantime, increasing the contact time at pH 2 increases the Ta extraction efficiency and the reverse is right for the Nb extraction where at 15 min complete Ta extraction was attained while Nb remained unextracted.
So it can be concluded that Ta extraction was achieved completely at pH 2.0 and 15 min as contact time.
3.3.1 Recovery of tantalum
3.3.1.1 Tantalum extraction
Actually, the factors affecting solvent extraction process included solvent concentration, contact time, pH of the leach liquor and aqueous/ organic ratio (A/O). These factors were studied for both interesting metal values; Ta and Nb.
(i) Effect of octan-2-ol concentration:
This effect was studied upon the Ta extraction efficiency by contacting equal volumes of the feed solution with solvent of different concentrations ranging from 50% to 100% at fixed conditions of pH 2.0, contact time of 15 min. From the data obtained from Fig. 6, it is noticed that extraction efficiency of Ta increased from 59.50% to 99.30% when the octan-2-ol concentration increased from 50% to 100%.
Effect of octan-2-ol conc. upon Ta extraction efficiency.
(ii) Effect of pH of the feed solution:
To study the effect of pH of the feed solution upon Ta extraction efficiency, a set of experiments was performed at different pH values of feed solution ranging from pH 1.5 to 2.5 at the fixed conditions of A/O 1:1, 100% octan-2-ol and 15 min as contact time. From the results obtained in Fig. 7, it is clear that the maximum Ta extraction efficiency (99.3%) was attained at pH 1.5 and 2.0. Increasing the pH of the feed solution to more than 2.0 sharply decreased the Ta extraction efficiency.
Effect of pH upon Ta extraction efficiency.
(iii) Effect of contact time:
To study the effect of contact time upon the extraction efficiency of Ta by octan-2-ol, a set of experiments has been performed at different contact times at the fixed conditions of A/O ratio 1:1, 100% octan-2-ol concentration and pH value 2.0. The data are plotted in Fig. 8. From which, it is obvious that increasing the contact time increases the Ta extraction efficiency, where complete Ta extraction was achieved after 15 min. contact time between the leach liquor and the organic phase.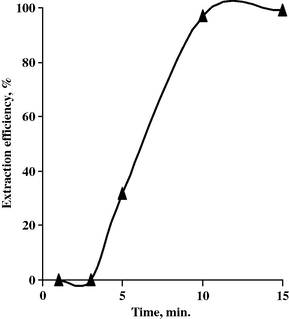
Effect of time upon Ta extraction efficiency.
(iv) Construction of McCabe–Thiele diagram for Ta extraction:
McCabe–Thiele diagram is properly constructed by plotting the equilibrium concentration data of Ta extraction in the organic and aqueous phases, followed by fitting a suitable operating line. The latter would represent the A/O phase ratio that will be used in a suitable counter extraction. The equilibrium data in Fig. 9 are obtained at different A/O ratios using optimum extraction conditions of undiluted octan-2-ol (100%), 15 min. as contact time at room temperature while keeping the pH of the leach liquor (aqueous phase) at 2.0. From this diagram, the required theoretical number of extraction stages would be determined.
McCabe–Thiele diagram for Ta extraction.
From McCabe–Thiele diagram and according to the given slope of the operating line, theoretically three stages are required for almost complete extraction of Ta from the feed solution.
3.3.1.2 Tantalum stripping
Tantalum stripping was carried out at room temperature by shaking equal volumes of the loaded solvent with a suitable stripping solution for a proper time. Factors influencing the stripping efficiency were studied. These include stripping agent type and its concentration, stripping time and aqueous to organic phase ratio (A/O). The concentration of Ta in the loaded solvent was 1282 ppm.
(i) Effect of stripping agent type:
Different stripping agents were used to strip Ta from the loaded solvent. These included distilled water, 0.5 M H2SO4 and 0.5 M HF. The stripping experiments were conducted at 3 min. contact time at 1/1 A/O ratio. The results obtained revealed that distilled water is the most efficient for stripping Ta from the loaded solvent.
(ii) Effect of stripping time:
The effect of stripping time upon Ta stripping efficiency was studied in the range from 3 to 20 min. at the fixed conditions of A/O ratio of 1:1. The corresponding Ta stripping efficiencies were measured and plotted in Fig. 10. From the results obtained, it was found that 20 min. stripping time is sufficient to bring almost complete Ta content in the strip solution.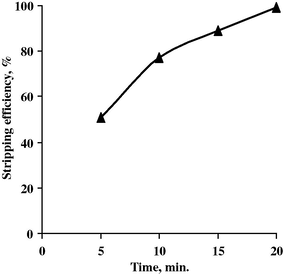
Effect of time upon Ta stripping efficiency.
(iii) Construction of McCabe–Thiele diagram for Ta stripping:
From the equilibrium stripping data and the corresponding McCabe–Thiele diagram shown in Fig. 11, the theoretical number of stripping stages would be determined. These data have been obtained by contacting several loaded solvent aliquots with distilled water for 20 min. using different A/O ratios. From McCabe–Thiele diagram and according to the given slope of the operating line, theoretically three stripping stages are required for complete Ta stripping from the loaded solvent.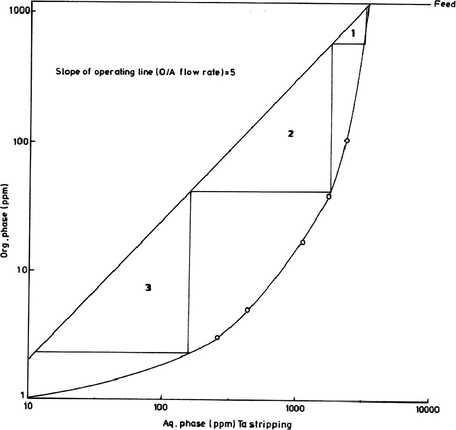
McCabe–Thiele diagram for Ta stripping.
3.3.2 Tantalum precipitation
By neutralizing Ta strip solution using ammonia solution, Ta was completely precipitated at pH 4.5–5.5. After calcination, a relatively pure Ta2O5 was obtained and identified by using energy dispersive X-ray (EDAX) as shown in Fig. 12.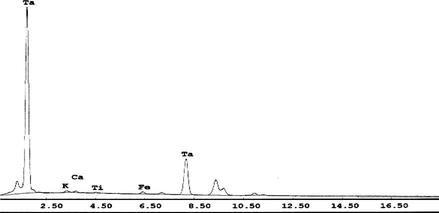
EDAX analysis of Ta product.
3.3.3 Recovery of niobium
3.3.3.1 Niobium extraction
(i) Effect of octan-2-ol concentration:
This effect was studied upon the Nb extraction efficiency by contacting equal volumes of the feed solution (free from Ta) with different solvent concentrations ranging from 50% to 100% at the fixed conditions of pH 0.7, O/A 1:1 and 5 min as contact time. The data are plotted in Fig. 13. From the results, it is clear that the extraction of niobium increases from 73.60% to 99.50% with increasing octan-2-ol concentration from 50% to 100%. So the best concentration of octan-2-ol for Nb extraction is 100%.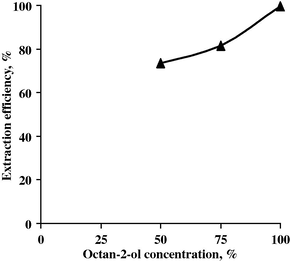
Effect of octan-2-ol conc. upon Nb extraction efficiency.
(ii) Effect of pH of the feed solution:
To study the effect of pH of the feed solution upon Nb extraction efficiency, different pH values ranging from 0.7 to 2.5 of the feed solution were conducted while fixing the other extraction conditions at 5 min, 100% octan-2-ol and A/O of 1/1. The corresponding Nb extraction efficiencies are shown in Fig. 14. From the results obtained, it is obvious that increasing the pH from 0.7 to 2.5 decreases the extraction efficiency of niobium from 99.5% to 47.20%. So, it can be stated that the best pH for Nb extraction is 0.7.
Effect of pH upon Nb extraction efficiency.
(iii) Effect of contact time:
To study the effect of contact time upon the extraction efficiency of Nb by octan-2-ol, a set of experiments was performed at different contact times while fixing the other extraction factors at O/A of 1:1, pH 0.7 and 100% octan-2-ol. The data are plotted in Fig. 15. From the results obtained, it is clear that increasing the time from 1 to 5 min increases the Nb extraction efficiency to 99.5%. By extending the time to 10 min extraction efficiency of niobium decreased to 87.6%. So, it can be concluded that the contact time for maximum extraction of niobium was 5 min.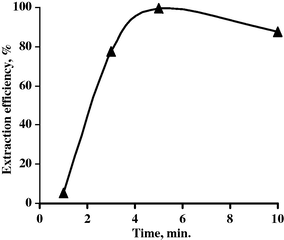
Effect of contact time upon Nb extraction efficiency.
(iv) Construction of the McCabe–Thiele diagram for Nb extraction:
Using the equilibrium concentration data of Nb extraction in the organic and aqueous phases, the McCabe–Thiele diagram of Nb extraction is constructed Fig.16. These data are obtained at different A/O ratios using optimum extraction conditions of undiluted octan-2-ol (100%), 5 min. as contact time at room temperature while keeping the pH of Ta-free leach liquor at 0.7. From the McCabe–Thiele diagram, 3 loading stages are required for almost complete Nb extraction.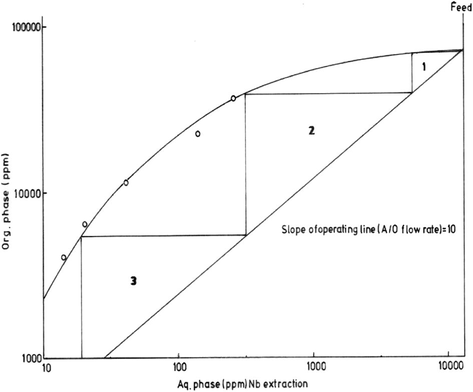
McCabe–Thiele diagram for Nb extraction.
3.3.3.2 Niobium stripping
(i) Effect of stripping agent type:
Different stripping agents were used to strip Nb from the loaded solvent. These included distilled water, 0.5 M H2SO4, 0.5 M HF and mixture of the two acids. The stripping experiments were conducted at 5 min. contact time and 1/1 A/O ratio. The concentration of Nb in the loaded solvent was 12,188 ppm. The results obtained revealed that mixture of HF with H2SO4 is the most efficient for Nb stripping from the loaded solvent.
(ii) Effect of acid concentration:
Different concentrations of acid mixtures (HF + H2SO4) have been studied. H2SO4 conc. varied from 0.5 to 6 M while keeping HF conc. fixed at 7 M, A/O ratio of 1/1 and 20 min. as contact time. Then HF conc. was varied from 0.5 to 7 M while keeping H2SO4 conc. fixed at 6 M under the above-mentioned experimental conditions. The corresponding stripping efficiencies are measured and plotted in Figs. 17 and 18. From the data obtained, it is concluded that the best stripping agent for Nb is a mixture of 6 M H2SO4 and 7 M HF to realize 99.2% stripping efficiency.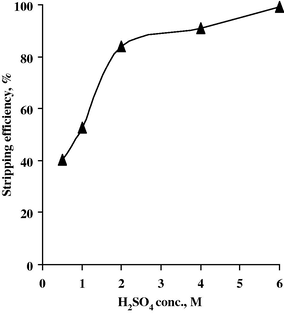
Effect of H2SO4 conc. upon Nb stripping efficiency.
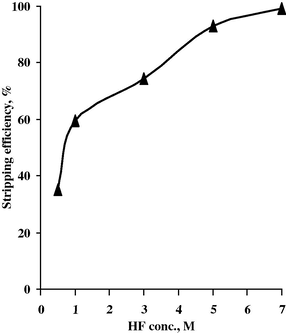
Effect of HF conc. upon Nb stripping efficiency.
(iii) Effect of stripping time:
The effect of stripping time upon Nb stripping efficiency was studied in the range from 5 to 20 min. at 6 M H2SO4 + 7 M HF and O/A ratio 1/1. From the obtained results Fig. 19, it is found that 20 min. as stripping time is sufficient to bring almost all Nb contents into the stripping solution.
Effect of time upon Nb stripping efficiency.
(iv) Construction of McCabe–Thiele diagram for Nb stripping:
From the equilibrium stripping data and the corresponding McCabe–Thiele diagram as shown in Fig. 20, the theoretical number of stripping stages would be determined. These data have been obtained by contacting several loaded solvent aliquots with a mixture of 6 M H2SO4 and 7 M HF for 20 min. using different A/O ratios. From the McCabe–Thiele diagram, and according to the given operating line, theoretically four stripping stages are required for almost complete stripping of Nb from the loaded octan-2-ol.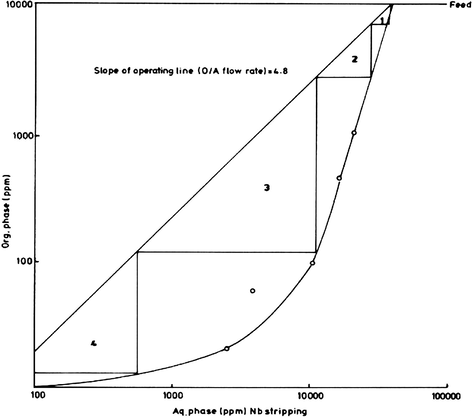
McCabe–Thiele diagram for Nb stripping.
3.3.3.3 Niobium precipitation
By neutralizing Nb strip solution using ammonia solution, Nb was completely precipitated at pH 6.5–7.5. The product obtained was calcined and identified by using EDAX analysis as shown in Fig. 21.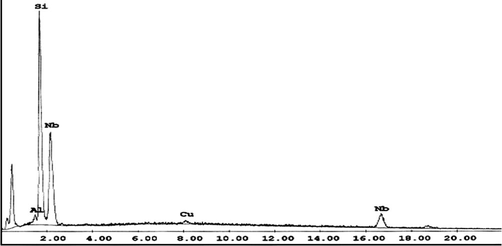
EDAX analysis of Nb product.
4 Conclusion
Ore characterization has first been performed either mineralogically or chemically. Mineralogical study proved the presence of a variety of minerals as tanteuxenite, monazite, bastanasite, anatase, chalcophanite, zircon. Chemical analysis revealed that the presence of valuable metal oxides involves RE2O3 6.65%, Nb2O5 5.36% as well as TiO2 and ZrO2 6.15% and 4.50%, respectively, besides Ta2O5 0.47%.
Given the refractory nature of the study of south Gabal EL-A’urf ore material, a breakdown by potassium bisulfate fusion is applied. The optimum conditions for dissolving the interesting metal values are ore/potassium bisulfate ratio of 1/3, time 3 h and temperature 650 °C. These conditions give dissolution efficiencies of 98%, 99.3% and 94% for Nb, Ta and Ti, respectively, as well as complete REE dissolution.
Recovery of interesting metals (REEs, Nb, Ta and Ti) from bisulphate leach liquor involved several steps. First, direct precipitation technique was used for recovering REEs and Ti by 10% oxalic acid at pH 1.9 followed by re-dissolving in HCl and separation between them by KOH at different pH values where Ti precipitates at pH 1 but REEs precipitate at pH 6–7.
Then, Fe and Al are precipitated at a pH range of 2.5–4 before applying solvent extraction for Nb and Ta. Subsequently, Ta and Nb recovered by solvent extraction technique using octan-2-ol (100%) at different contact times and pH values and stripped by distilled water or different concentrations of HF and H2SO4. Ta is extracted at 100% octan-2-ol, A/O 1/1, pH 2.0 and contact time 15 min and stripped by distilled water, A/O 1/1 and contact time 20 min. Then, Nb is extracted at 100% octan-2-ol, A/O 1/1, pH 0.7 and contact time 5 min and stripped by 7 M HF + 6 M H2SO4, A/O 1/1 and contact time 20 min. Precipitation of Nb and Ta products is revealed by EDAX technique. Finally, a technical flowsheet is proposed for processing south Gabal El-A’urf ore material as shown in Fig. 22.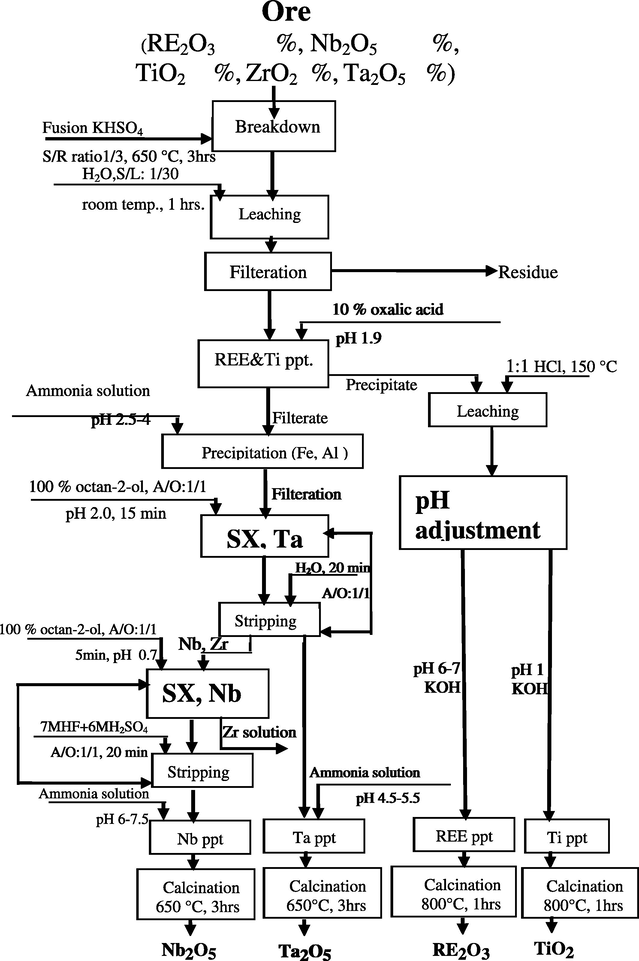
Proposed technical flowsheet for south Gabal El-A’urf ore material.
References
- Amer, T.E., 2007. Recovery of Niobium and Tantalum from the pre-processed multiple-oxide ore material of Gabal Abu Dob, Eastern Desert, Egypt. Ain Shams Education Bulletin of Science
- Liquid–liquid extraction of tantalum with 2 octanol. Chemical Engineering and Processing. 2004;43:1231-1237.
- [Google Scholar]
- El Hazek, M.N., 2001. Recovery of Uranium, Niobium and Tantalum from Kadabora Uraniferous Pegmatites. Eastern Desert, Egypt, Ph.D. Thesis, Faculty of Science, Ain Shams University
- El-Hasek, M.N., Amer, T.E., Abu El-Azm, M.G., Issa, R.M., Omar, S.A., El-Hady, S.M., submitted for publication. Characterization and breakdown of south Gabal El A’urf Polymineralized ore material. Journal of Faculty of Education, Ain Shams University, Cairo, Egypt, 2010.
- El Hussaini, O.M., 1996. Extraction of Niobium and Tantalum Elements from Some Egyptian Ore Materials. Ph.D. Thesis, Faculty of Science, Cairo University.
- Extractive recovery of Ta (V) and Nb (V) with octanol from HF acid solutions containing large amounts of Ti (IV) Russian Journal of Applied Chemistry. 2001;74(6)
- [Google Scholar]
- Separation and Spectophotometric Determination of Elements. New York: Ellis Hrwood Ltd Pupl.; 1986.
- Tantalum (v) and niobium (v) extraction by octanol. Hydrometallurgy. 2002;66:77-83.
- [Google Scholar]
- The acid decomposition of silicate minerals, part 1, reactivities and modes of dissolution of silicates. Hydrometallurgy. 1983;10:1.
- [Google Scholar]
- Welz, B., Sperling, M., 1999. Atomic Absorption Spectrometry, third ed. New York, 1999.


