

Translate this page into:
Low-cost electrochemical biosensor based on a multi-walled carbon nanotube-doped molecularly imprinted polymer for uric acid detection
⁎Corresponding author. fauziyah17@ui.ac.id (Siti Fauziyah Rahman)
-
Received: ,
Accepted: ,
This article was originally published by Elsevier and was migrated to Scientific Scholar after the change of Publisher.
Abstract
Uric acid is a naturally occurring antioxidant that must be maintained in the human body at 1.49–4.46 mM to prevent hyperuricemia, which may lead in the formation of monosodium urate (MSU) and Lesch–Nyhan syndrome. The objective of this research is to examine molecularly imprinted polymers (MIP)-based non-enzymatic electrochemical sensors that simulate the biological mechanism of uricase oxidase. As an affordable working electrode, commercial pencil graphite electrode (PGE) was modified with multi-walled carbon nanotubes (MWCNTs) and polypyrrole. With a 1:10 uric acid to monomer ratio, 20 cycles of polymerization, 100 mV s−1 of polymerization rate, and 30 cycles of template removal, the optimum MIP was obtained. By employing differential pulse voltammetry (DPV) to detect the presence of uric acid over the range of 0.22–3.5 mM, the limit of detection (LOD) was determined to be 0.76 mM, with a sensitivity of 97.459 µA µM−1 cm−2. This sensor demonstrated good repeatability and reproducibility, with relative standard deviation percentage (%RSD) of 3.43 % (n = 10) and 5.37 % (n = 3), respectively, which maintains a performance stability of 71 % after 19 days of use. This sensor also detected uric acid with good selectivity, even in the presence of interfering molecules including K+, Na+, sarcosine, citric acid, ascorbic acid, glucose, and dopamine.
Keywords
Electrochemical biosensor
Molecularly imprinted polymer
Multi-walled carbon nanotubes
Pencil graphite electrode
Uric acid

1 Introduction
Uric acid (7,9-dihydro-1H-purine-2,6,8(3H)-trione) is a biological molecule produced by both endogenous and exogenous purine metabolism (Pasalic et al., 2012; Saito et al., 2021; Wang et al., 2022). Its synthesis is influenced by the amount of protein that enters the body and is produced in the liver, intestine, muscle, kidney, and vascular endothelium to form natural antioxidants (Sukanya et al., 2020; Tao et al., 2022). Uric acid levels in the body range from 240 to 520 μM in serum (Tang et al., 2016), 1.49–4.46 mM in urine (Yang et al., 2018), and 2.6–7.2 mg/dL in blood (Plausinaitis et al., 2020). Abnormal uric acid metabolism can alter the acidity of body fluids, causing fluctuations in excretion products including urine, serum, saliva, and sweat (Tao et al., 2022).
Hyperuricemia is a condition in which the body fluids contain an excess of uric acid. Prolonged uric acid accumulation may result in the development of monosodium urate (MSU) crystals, which can induce joint inflammation (gout) and Lesch–Nyhan disease. Furthermore, uric acid has the potential to interfere with cellular processes, thereby elevating the risk to various diseases including hematuria, kidney failure, hepatitis, and leukemia (Buledi et al., 2021; Perez-Ruiz et al., 2015; Wang et al., 2020).
Numerous laboratory-based techniques have been utilized to detect uric acid, including spectrophotometry (Galbán, 2001; Rocha and Rocha, 2010), chemiluminescence (Kong et al., 2021; Vakh et al., 2017), calorimetry (Chen et al., 2012), high-performance liquid chromatography (HPLC) (Ferin et al., 2013; Zuo et al., 2015), and others (Plausinaitis et al., 2020; Yang et al., 2018). Ever since the initial documentation of uric acid detection in 1894, method development has been an ongoing endeavor. The oxidation of uric acid results in the formation of allantoin and hydrogen peroxide, whereas the reduction of phosphotungstic acid yields the tungsten blue chromophore. Although this methodology has certain limitations in terms of specificity, it has been employed to identify uric acid through the observation of hydrogen peroxide, which is the byproduct (Yang et al., 2021). Access to specialized reagents and expertise to perform these procedures are both necessary, and they may involve significant expenses (Tang et al., 2016).
A novel approach for periodic health screening involving the rapid detection of uric acid levels in blood samples has been established, utilizing a disposable system integrated with a uricase enzyme (Öndeș et al., 2023). However, real-time identification is required as a first step toward providing measurable information for personalized care and preventing treatment delays (Badoei-Dalfard et al., 2019). Real-time monitoring of uric acid levels in non-invasive samples (including saliva and sweat) has become a feasible objective through the utilization of using enzyme-immobilized electrodes and electrochemical detection methods.
Real-time detection is consistently accomplished with enzymatic-based electrochemical sensor. By incorporating a particular enzyme into the electrode, uric acid concentrations can be determined as the molecules undergo a reaction. Certain techniques of uricase enzyme immobilization utilize the unique properties of nanomaterials to accomplish this, such as boron nitride (BN) nanosheets (Öndeș et al., 2023) and gold nanoparticle–titanium disulfide (AuNPs-TiS2) (Öndeş et al., 2022).
Some physical adsorption approaches have been developed employing a multilayer enzyme matrix (Liu et al., 2022) overlaid with kidney cell membranes to improve uric acid selectivity over other antioxidants in the body (Kim et al., 2021). However, due to their sensitivity to environmental conditions and propensity to detach readily during detection, the stability of the enzyme-based bioreceptor continues to be an issue. To achieve extended storage time, improved resistance to denaturation, and increased selectivity towards uric acid, an alternative solution is to utilize a biosensor equipped with a synthetic bioreceptor.
The utilization of nanomaterials to improve the electrocatalytic and physical properties of electrodes enables the detection of uric acid in a non-enzymatic manner (Aafria et al., 2022). The sensitivity of sensors can be enhanced by incorporating carbon or metal-based materials into the electrode. This improvement allows for detection of minuscule quantities of molecules present in intricate matrices, such as sweat and saliva (Chen et al., 2016; Hefnawy et al., 2023). Because of their distinct physicochemical properties, synthesized nanomaterials have been studied in a variety of fields, including as iron oxide nanoparticles (FexOy) (Tang et al., 2022), N,Co-doped porous carbon (CNCo) (Liu et al., 2019), porous g-C3N4-multi-walled carbon nanotubes (PCN/MWCNTs) (Lv et al., 2019), molybdenum disulfide (MoS2) (Sha et al., 2019), thulium phosphate-graphene oxide (TmPO4-GO) (Huang et al., 2019), poly tetraphenylporphyrin-polypyrrole-graphene oxide (pTPP/PPy/GO) (Dai et al., 2016), and reduced graphene oxide-gold nanoparticles (rGO/AuNPs) (Mazzara et al., 2021).
In addition to nanomaterials, molecularly imprinted polymers (MIP) have demonstrated promising results in detecting uric acid, making them a viable choice for non-enzymatic detection. The MIP, which is integrated onto the surface of an electrode, acts as an artificial bioreceptor by forming a polymer layer (Crapnell et al., 2020). By employing uric acid as a template molecule, complementary cavities are generated within the MIP layer. These cavities have morphological and chemical features similar to the active site of uric acid, allowing them to attach to the target molecules in an enzyme-like manner (Zheng et al., 2018). Uric acid, an electroactive molecule, can be identified in this medium since it generates an electrical signal at appropriate potentials. However, the MIP nanostructure must be improved (Liu et al., 2023).
This non-enzymatic detection approach can simulate any natural bioreceptor, allowing the identification of a large variety of chemical compounds. However, the bulk imprinting technique is still limited by the selectivity of the generated MIP and the deposition technique applied to the electrode surface (Abdollahi et al., 2020; Aminikhah et al., 2022). It also allows for large-scale polymerization in a single manufacturing batch by reacting the monomer, crosslinker, porogenic solvent, and template molecule in a predetermined ratio using various polymerization techniques and chemical compounds. This technique offers a highly efficient method for polymer synthesis (Daniels et al., 2021; Diliën et al., 2017; Gestring and Mewes, 2002; Hartmann et al., 2006; Suda et al., 2017; Villa et al., 2021; Yu et al., 2022).
Surface imprinting method using electropolymerization may provide a simpler polymerization strategy than bulk imprinting. However, this technique must be optimized to avoid a thicker MIP layer, which could impact the conductivity or selectivity of the electrode surface (Scheller et al., 2019).
In this study, nanomaterial and MIP were combined to improve electrocatalytic performance of a uric acid sensor. Polypyrrole is a conductive polymer synthesized from pyrrole, an unstable monomer that readily oxidizes with repeated exposures to radical cationic ions (Tan and Ghandi, 2013). It has high conductivity, which facilitates in the development of cavities in transducers (Yang et al., 2014), is non-toxic (Qi et al., 2021), and has wide immobilization ability onto micro-sized surfaces (Khoder and Korri-Youssoufi, 2020). However, one of the obstacles for polypyrrole as a receptor is its weak mechanical stability, which prevents attachment to the electrode (Lee et al., 2021). To overcome this issue, a nanomaterial should be applied into the electrode prior to the polymerization process to enhance the non-covalent attachment of polypyrrole to the electrode surface (BelBruno, 2019).
Multi-walled carbon nanotubes (MWCNTs), which are commonly employed in biosensors, improve sensor adsorption by increasing the electrode’s surface area (Dai et al., 2022). To achieve hydrophilicity, acid functionalization was employed to increase the solubility of MWCNTs in water, polymeric resin, and organic solvents while maintaining their essential properties. The addition of carboxylic acid groups in MWCNTs is expected to lower toxicity while increasing biocompatibility (Gupta et al., 2018).
Commercial pencil graphite electrodes (PGE) are a viable low-cost alternative to carbon electrodes, which is the novelty of this research. PGE has advantages, such as low noise, high sensitivity, and efficient adsorption for detection (Tasić et al., 2021). It is a promising electrode with simple electrode preparation and relatively small diameter (2 mm), making it ideal for future wearable and miniaturized sensors, with after electrocatalytic performance improvement (Torrinha et al., 2018). Following the deposition of MWCNTs into the PGE, electropolymerization approach was employed to generate the MIP polypyrrole layer through the surface imprinting method. The resulting non-enzymatic biosensor demonstrated stable detection with good repeatability and reproducibility, as well as high selectivity and sensitivity.
2 Materials and methods
2.1 Reagents and apparatus
Uric acid (≥99 %, crystalline), potassium chloride (KCl), multi-walled carbon nanotubes (MWCNTs), sarcosine (98 %), dopamine hydrochloride, pyrrole (98 %), Nafion® 117 solution (5 %), were purchased from Sigma-Aldrich, Singapore. Sodium dihydrogen phosphate monohydrate (NaH2PO4), di-sodium hydrogen phosphate dihydrate (Na2HPO4), potassium chloride (KCl), sodium chloride (NaCl), and D-glucose monohydrate, and ethanol were purchased from Merck, Singapore. Potassium ferrocyanide (K4[Fe(CN)6], 98 %) and potassium ferricyanide (K3[Fe(CN)6], 99 %) were purchased from Loba Chemie, India. L-ascorbic acid was purchased from HiMedia Laboratories, India. Citric acid monohydrate was purchased from Chem-Supply Chemicals, Australia. All reagents used for the preparation, modification, and measurement of electrodes were of analytical grade.
All electrochemical measurements were performed in a three-electrode system: PGE (2B; Stabilo; 2 mm diameter) as the working electrode, a silver/silver chloride electrode (Ag/AgCl) with 3 M saturated sodium chloride (NaCl) as the reference electrode, and a platinum electrode (Pt) as the counter electrode. PGE was purchased from the local stationery store, the Ag/AgCl and Pt electrodes were purchased from BASi Instruments, USA. All the electrochemical measurements were conducted using the PalmSens EmStat4s (PalmSens BV, Netherlands) and PSTrace 5.9 software (PalmSens BV, Netherlands).
2.2 Electrode preparation
PGE electrodes were prepared by washing with distilled water and sonicating in an ultrasonic bath for 1 min. After washing, PGE was oven dried at 30℃ for 30 min. To modify the electrodes, 2 mg of functionalized MWCNTs were mixed with 1 ml of 0.5 % Nafion® solution in absolute ethanol and sonicated in an ultrasonic bath for 30 min. Drop-casting was utilized to deposit 9.0 µL of functionalized MWCNTs solution over PGE (Wayu et al., 2016). The PGE/MWCNTs electrodes were air-dried for 24 h at room temperature before use.
2.3 PGE/MWCNTs/PPy fabrication
MIP production consists of three steps: pre-polymerization, polymerization, and template removal. In the pre-polymerization stage, uric acid and pyrrole were dissolved in 0.5 M KCl and combined at a 1:10 ratio in the electrochemical chamber. Electropolymerization was performed using three-electrode systems consisting of a PGE, Ag/AgCl electrode, and a Pt electrode. Cyclic voltammetry (CV) was performed using an EmStat4s potentiostat with PSTrace 5.9, as shown in Fig. 1. Electropolymerization was executed with a potential range of – 0.6 to + 0.9 V, 20 cycles of polymerization, and a scan rate of 100 mV s−1.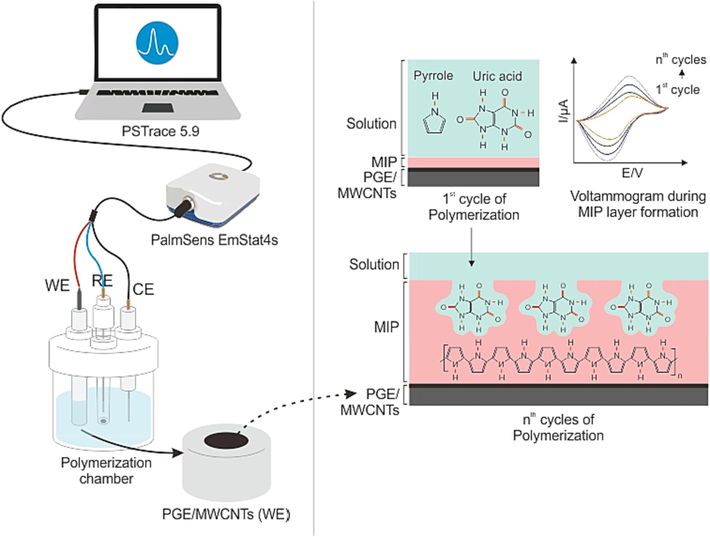
Illustration of electropolymerization using CV technique.
The template removal procedure was used to detach uric acid molecules from the resulting MIP surface by subjecting them to numerous oxidations in a solution that contained no template molecules. This technique, known as overoxidation, allows the release of uric acid from the MIP surface to the surrounding media (Holze, 2022). As the template molecules were removed, the complimentary cavities were imprinted. Throughout this procedure, CV was utilized within a potential range of − 0.7 to + 1.0 V and a scan rate of 100 mV s−1 for 30 cycles, determined by the optimization results displayed in Fig. 2.
Illustration of the overoxidation technique using CV to remove template molecules for cavity formation.
To determine the binding capacity of the MIP, a non-imprinted polymer (NIP) was synthesized utilizing the identical material and technique, but the template molecules were not included. NIP is the polymer generated on the transducer that lacks template molecules and contains no cavities. The imprinting factor (IF) is used to evaluate the binding capacity of the MIP.
The PGE/MWCNTs/MIP and PGE/MWCNTs/NIP samples were dried at room temperature for 5 min, then dried in an oven at 30 °C for 15 min before uric acid detection.
2.4 PGE/MWCNTs/MIP optimization
The objective of the optimization procedure was to identify the optimal electropolymerization parameters for the formation of uric acid MIP. During electropolymerization, the formation of MIP layer is influenced by the ratio of uric acid to monomer, the number of scan cycles, the scan rate, and the number of template removal cycles. The ratios of uric acid to monomer tested were 1:5, 1:10, and 1:15. The scan cycles were examined at 5, 10, 15, 20, 25, and 30 cycles. The scan rates were tested at 25, 50, 75, 100, and 125 mV s–l. The number of template removal cycles were tested at 10, 20, 30, and 40 cycles.
Following the preparation process, CV was performed on the PGE in redox probe solution over a potential range of – 0.4 to + 1.0 V. The redox probe solution was prepared by dissolving 5 mM of [Fe(CN)6]3–/4– in 0.5 M KCl. To observe the phenomenon occurring during the modification process, a redox probe performance was executed following each step of electropolymerization. By comparing the anodic peak current of MIP during template removal and detection using redox probe solution, the optimized parameters were determined. Once the parameters have been determined, each MIP fabrication step must be conducted in accordance with the obtained parameters, as shown in Fig. 3.
The complete process of PGE/MWCNTs/MIP formation.
2.5 Characterization
The material characterization of the formed MIP was performed using scanning electron microscopy (SEM) using Zeiss EVO 10 and Raman spectroscopy using Horiba Scientific LabRam HR laser wavelength of 532 nm. For electrochemical characterization, CV was performed to detect 3.56 mM uric acid in PBS solution (pH 7.4) to assess repeatability, reproducibility, and stability of the MIP. The limit of detection (LOD) was determined based on the uric acid concentrations of 0.22, 0.34, 0.54, 0.86, 1.36, 2.14, 3.38 and 3.5 mM. For the selectivity test, DPV was conducted to detect 2 mM uric acid, dopamine, L-ascorbic acid, citric acid, NaCl, KCl, sarcosine, and 20 mM glucose.
3 Results and discussion
3.1 Electrode preparation
Following rinsing and ultrasonication procedures, PGE was modified by the deposition of MWCNTs. CV measurements were conducted in a redox probe solution with a potential range of − 0.4 to + 1.0 V to observe the peak current response of the PGE following the drop-casting method. The increase in peak current response achieved by the PGE/MWCNTs indicates that depositing nanomaterials, particularly MWCNTs, improves conductivity over bare PGE.
Fig 4 shows a rise in anodic current peak response between PGE/MWCNTs and bare PGE, indicating that bare PGE had less surface area, and electron transfer from the redox probe to the micro- and mesopores resulted in increased electrode capacitance (Venâncio et al., 2022). PGE was chosen due to its abundant availability, cost-effectiveness, high sensitivity, adsorption capability, low noise and straightforward preparation method (Tasić et al., 2021). In general, a Type 2B pencil comprises 79 % graphite and 21 % clay by mass, which is a significantly greater proportion than a Type HB pencil, which comprises merely 68 % graphite, 26 % clay, and 5 % wax by mass (Torrinha et al., 2018). Given its cost-effectiveness and dependable electrochemical characteristics, type 2B PGE provides a viable alternative electrode option in biomedical research.
CV curve response to adding MWCNTs to the PGE surface.
Although a PGE is considered a semiconducting material with poorer conductivity than other carbon electrodes, electrode modification may improve its electrochemical properties (Torrinha et al., 2018). Due to the vast number of micropores, PGE can be immobilized with certain sensing compounds, depending on the chemical and its interaction with graphite or the binding agent associated with the PGE. Depositing particular nanomaterials onto the PGE improves its microstructure and mass transfer, leading to enhanced electrochemical performance during detection (Mushtaq et al., 2023; Zhao et al., 2020).
Pristine MWCNTs have a hydrophobic nature that makes it difficult to dissolve into solvents. Covalent functionalization was accomplished to increase MWCNTs solubility and decrease toxicity utilizing nitric acid and sulfuric acid oxidation processes (Gupta et al., 2018). Functionalized MWCNTs can increase surface area and sensitivity, enabling label-free detection in a broad range of biomedical applications.
3.2 PGE/MWCNTs/MIP optimization
The MIP was optimized by adjusting some important parameters that affect the formation process. These include optimizing the uric acid to monomer ratio, scan cycles, scan rate, and template removal cycles.
3.2.1 Ratio of uric acid to monomer
The uric acid to monomer ratio has a substantial impact on the growth of the MIP layer. The ratio in this investigation ranged between 1:5, 1:10, and 1:15, based on the prior reference ratios (Manickam et al., 2017). In the pre-polymerization solution, MIP optimization was conducted with 0.5 M KCl as a solvent and supporting electrolyte.
The voltammogram curve, as shown in Fig. 5A, demonstrated that the most suitable uric acid to monomer ratio for this sensor was 1:10, according to the greater findings of peak current difference (ΔIP) compared to the higher or lower ratio. Monomer concentrations must be regulated to prevent monomer residues from remaining in the solution surrounding the MIP surface throughout the CV procedure. Excessive monomers in the MIP layer can lower the ΔIP by hindering template removal process and uric acid detection. By utilizing a decreased monomer ratio, uric acid does not bind to the low monomer concentrations, resulting in the creation of MIP with low uric acid attachment. This also has a strong relationship with pH values, as various studies have shown that the best electropolymerization of pyrrole occurs at neutral pH (Mathieu-Scheers et al., 2019), whilst the most conductive MIP is generated around pH 6.0 (Duan et al., 2022). However, further research is required to evaluate uric acid solubility, solvent concentration selection, and their effects on MIP formulation optimization.
CV curve response to varying (A) ratio of template molecule to monomer, (B) polymerization cycles, (C) polymerization rate, and (D) template removal cycles.
3.2.2 Polymerization cycles
The number of polymerization cycles must be examined to achieve a MIP thickness that is neither too thin nor too thick. The purpose of this experiment was to determine which scan cycles of 5, 10, 15, 20, 25, and 30 cycles were most appropriate for this sensor. Fig. 5B demonstrates that the desired number of polymerization cycles in this investigation was 20 cycles, with a significant decrease in the ΔIP at 25 and 30 cycles. It produced the highest ΔIP readings in 20 cycles, implying that this number of cycles is ideal for constructing the following MIP layer. Since just a small fraction of the active surface of uric acid is imprinted, a thin MIP layer may generate unstable cavities that are prone to cross-react with interference molecules. Excessive cycling thickens the MIP layer, trapping template molecules beneath it and making them difficult to remove. As a result, a thick MIP possesses qualities similar to an NIP lacking cavities (Manickam et al., 2017). Previous research has indicated that the ideal MIP thickness for successful signal detection is between 10 and 100 nm, manufactured in 1–40 cycles (Ratautaite et al., 2021).
3.2.3 Polymerization rate
The polymerization rate optimization refers to the rate at which the MIP layer is produced at an obtained monomer ratio during several polymerization cycles. This study investigated the best polymerization rate between 25, 50, 75, 100, and 125 mV s−1. Fig. 5.C indicates that ΔIP increased from 25 to 100 mV s−1 and significantly decreased at 125 mV s−1.
Previous studies have demonstrated that utilizing polymerization rates in the range of 50–150 mV s−1 into specific ratios and solvents may result in template molecule attachment, as low polymerization rates may cause limited diffusion of uric acid molecules into the electrode surface (Anantha-Iyengar et al., 2019; Yeasmin et al., 2022). Both the highest and lowest scan rates will interfere with the detection ability of the MIP due to the resulting irregular cavities shape. A faster polymerization rate will affect the orientation of the cavities printed on the MIP layer once the template molecule is removed. The resulting cavities will be irregular due to the faster scan rate, making the binding direction of the uric acid molecules inhomogeneous (Yulianti et al., 2022). The polymerization rate of 100 mV s−1 was chosen as the optimized parameter, as this rate can generate the highest ΔIP, resulting in a rapid MIP formation process while maintaining the orientation of the uric acid molecules bound to the MIP layer.
3.2.4 Template removal cycle
The template removal method utilizing the overoxidation technique involves constantly exposing a polymer to a particular potential without introducing monomers or template molecules to the supporting electrolyte. As a result of this reaction, carboxyl (–COOH), carbonyl (–C = O), and hydroxyl (–OH) groups are formed on the surface of the MIP. The synthesis of these groups decreases the MIP’s electrochemical characteristics, causing the template molecules and MIP to release their non-covalent bond (Dykstra et al., 2022).
Fig. 5.D indicates a rapid increase in ΔIP from 10 to 30 cycles, with no significant changes in ΔIP between 30 and 40 cycles. Therefore, 30 overoxidation cycles were chosen in this study to reduce the multiple potentials exposure in the MIP. Determining the appropriate number of cycles is critical for maintaining the stability of the MIP and preventing cavities erosion caused by excessive cycles.
All the bonds formed during the MIP-forming sequence are non-covalent or weak. Bonds are frequently formed between the oxygen atom of uric acid’s carboxylic ketone group and the hydrogen atom of the N–H polypyrrole group, as well as between the oxygen atom of uric acid’s hydroxyl group and the nitrogen atom of the N–H polypyrrole group (Gillan & Jansson, 2022). The template removal process releases the complete hydrogen chain, making it reversible and capable of rebinding to MIP cavities during detection. This binding is adequate for effective detection and extraction of the target molecule. Template removal utilizing the overoxidation technique is performed to prevent the MIP layer from swelling and thus retain detection selectivity rather than organic solvent washing.
3.3 PGE/MWCNTs/MIP fabrication
After obtaining the best conditions for MIP formation, the electropolymerization process was performed. Pre-polymerization was conducted using a solution of 3.56 mM uric acid and 35.6 mM polypyrrole in 0.5 M KCl. The polymerization procedure was subsequently executed utilizing the CV technique, which involved 20 cycles, a scan rate of 100 mV s−1, and potential parameters ranging from − 0.6 to + 0.9 V, a scan rate of 100 mV s−1, and 20 cycles. The electropolymerization was conducted at ambient temperature. The uric acid molecules that had been deposited were eliminated through the overoxidation process utilizing the CV method using 0.5 M KCl with potential parameters ranging from − 0.7 to + 1.0 V, a scan rate of 100 mV s−1, and 30 overoxidation cycles.
To observe the phenomena occurring during each modification, all modifications that occurred in this investigation were measured in redox probe solution with a potential range of − 0.7 to + 1.0 V. During the detection procedure after producing PGE/MWCNTs/MIP, a peak current of + 0.34 V potential was discovered, indicating that the uric acid molecules were detected. Fig. 6.A shows that uric acid successfully attached to the MIP and was imprinted during polymerization. Fig. 6.B illustrates how the peak current for each cycle decreased during the overoxidation process. This decrease suggests that some uric acid was released from the MIP cavities, leaving the cavities complimenting the uric acid geometry and chemical structure.
CV curve response to the (A) MIP polymerization and (B) MIP template removal, (C) NIP polymerization, and (D) NIP template removal for each cycle.
As a control, NIP was synthesized without the addition of uric acid molecules using the same manner as MIP formation. The CV curve response revealed no peak during the polymerization and overoxidation process of NIP as shown in Fig. 6.C and Fig. 6.D, indicating that cavities were not generated during these processes and just polymer was formed.
The detection technique was conducted using a 3.56 mM uric acid in 0.1 PBS (pH 5.8) that was drop casted over the surface of the MIP and incubated for 30 min at room temperature. The interaction of MIP and NIP with the uric acid solution was studied in a redox probe solution, demonstrating how the conductivity varies with each modification based on anodic peak current change.
According to Fig. 7, MIP formation considerably raises anodic peak current, whereas template removal decreases anodic peak current by removing uric acid from the cavities. The presence of uric acid in the MIP layer during detection increased the anodic peak current, permitting electron transfer in the redox probe solution, as illustrated in Fig. 7.A. This occurrence proved MIP’s ability to detect uric acid molecules, as uric acid has an electroactive property that increases the anodic peak current response in its presence.
CV curve response to each PGE/MWCNTs/MIP modification.
Fig. 7.B shows that NIP exhibited a peak current response that was comparable to MIP during polymerization and template removal. However, during uric acid detection, the rise in peak current response of NIP from template removal was not substantial and was significantly lower than uric acid detection in MIP, indicating that the polypyrrole generated in the NIP layer is not proportional for uric acid detection.
The imprinting factor is an indicator used to demonstrate that the generated cavities are capable of identifying uric acid, indicating that MIP has a strong binding affinity for template molecules (Daniels et al., 2021). The IF for this sensor design was determined to be 6.24 by comparing the ΔIP between MIP and NIP. This data reveals that MIP has a higher binding capacity than NIP, allowing uric acid to bind selectively to MIP while NIP is unable to bind to uric acid.
3.4 Material characterization
3.4.1 Scanning electron microscopy (SEM)
Scanning electron microscopy was employed to evaluate the surface morphology of each change. According to the SEM images, MWCNTs were successfully deposited on the PGE surface using the described approach, with the deposits equally dispersed across the whole surface, as shown in Figs. 8.A and 8.B. Before the deposition of MWCNTs, the PGE surface was striated, dense, and finely structured. MWCNTs deposition on PGE enhances surface porosity, as indicated by the mesh visible in the cross-section. This is consistent with the features of MWCNTs, which have a large surface area since they are nanoparticles, which increases the surface area of electrodes modified with them (Dai et al., 2022).
SEM images of (A) bare PGE, (B) PGE/MWCNTs, (C) PGE/MWCNTs/MIP, and (D) PGE/MWCNTs/NIP.
Fig. 8.C depicts an equally dispersed rough surface, as opposed to Fig. 8.D, which has irregular shapes. Following the electropolymerization procedure and the removal of the template molecule, cavities with the shape and size of uric acid molecules were created (Sooraj et al., 2020). The incorporation of uric acid into MIP production resulted in a more organized appearance than bare PGE and PGE/MWCNTs, as demonstrated by morphological characterizations. In contrast to MIP, the NIP has a thicker and uneven polymer layer because the electropolymerization process happens without uric acid and only forms around the MWCNTs surface.
Even if the NIP generated on the surface of MWCNTs, which have a wide surface area and might boost the responsiveness of target molecules during detection, covering MWCNTs with NIP may diminish their sensitivity to target molecules. As opposed to MIP, NIP generates cavities that are more substantial in size, indicating that the deposition of NIP results in non-selective cavities.
3.4.2 Raman spectroscopy
The Raman spectra show significant differences in the intensities of the D- and G- bands. The D- and G-band intensities indicate the successful characterization of the carbon material using the Raman shift. The D-band of the carbon electrodes is located between 2443 and 2445 cm−1, indicating the presence of hybridization in the carbon, and the G-band is located between and 1600 cm−1, indicating the vibration of the C = C carbon molecule (Madhu et al., 2020). Since the Raman spectra in Fig. 9 shows the strongest peak around 2443 to 2446 cm−1 and 2717 to 2720 cm−1, it may be due to the second–third order peak (Zhang et al., 2002). This also shows similar peak locations for the D- and G-bands, indicating that each modification affects the active cavities formed in the PGE surface.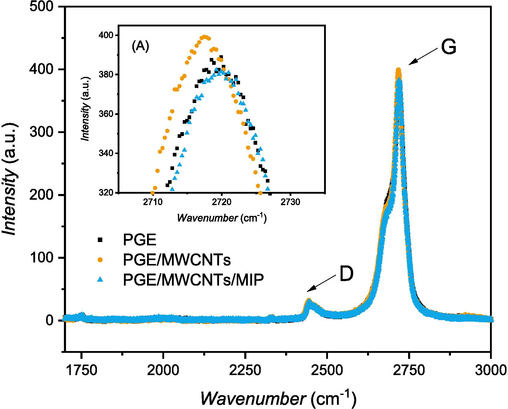
Raman spectra of the three-electrode modifications.
To determine the intensity ratio of the D- and G-bands, a comparative calculation is required. The ID/IG ratio indicates the ratio of D-band (ID) and G-band intensities (IG), which shows the number of surface defects and active sites formed by the formation of graphite structures as a result of each modification, which will increase the conductivity of the modified electrode (Sekar et al., 2019; Wei et al., 2021).
The ID/IG ratios of MWCNTs, PGE/MWCNTs and PGE/MWCNTs/MIP were evaluated. Table 1 displays the ID/IG ratios, revealing a considerable decrease in the ratio of PGE/MWCNTs/MIP compared to PGE/MWCNTs that previously achieved higher intensities than bare PGE. The higher intensity of PGE/MWCNTs indicates that MWCNTs were successfully deposited by the drop-casting method. MWCNTs are nanoparticles that could increase the active cavities of bare PGE to make them more accessible for molecular detection.
Modification
D-band (cm−1)
G-band (cm−1)
ID
IG
ID/IG
PGE
2445.99
2719.93
29.2137
388.902
0.075
PGE/MWCNTs
2444.14
2717.44
32.2695
399.211
0.081
PGE/MWCNTs/MIP
2443.75
2719.22
29.8586
382.439
0.078
The intensity ratio of PGE/MWCNTs/MIP significantly decreased after the previous modification was observed, indicating the formation of more specific gaps and active sites corresponding to the uric acid morphology (Yu et al., 2022). These characterizations show that PGE/MWCNTs/MIP formation successfully created more specific cavities and enhanced electrode detection performance compared to the MWCNTs, which have more general cavities that can bind to any molecule (Huang et al., 2021).
3.5 Electrochemical characterization
3.5.1 Effects of pH value and scan rate in uric acid detection
The impacts of pH value were studied using cyclic voltammetry to dissolve uric acid in PBS solution with a pH range of 5.8 to 7.9. According to Fig. 10, inset number (1), PBS with a pH of 7.4 produces the highest peak current response. Consequently, the PBS solution with a pH of 7.4 was selected as the solvent for detecting uric acid. In Fig. 10 inset number (2), the peak potential switched to fewer positive values as the pH values increased, allowing proton participating in the oxidation process (Li et al., 2020a), with the equation of EP = – 0.1001 pH + 1.0845 (R = 0.8155).
CV curve response of 3.56 mM uric acid in 0.1 M PBS obtained at PGE/MWCNTs/MIP with different pH values. Inset (1): the plot of peak current (IP) versus pH values, inset (2) the plot of peak potential (EP) versus log of pH values.
The effect of scan rate on uric acid detection via CV response was studied using Laviron's approach. This method was used to analyze the quantity of electrons transferred and verify that the electro-oxidation of uric acid was diffusion regulated by monitoring the resulting peak current response of varied scan rates (Fotouhi et al., 2013; Gowda and Nandibewoor, 2014; Li et al., 2020a).
Fig. 11 shows the peak current response (IP) of CV increased linearly with the increasing of scan rate (0.05 to 0.4 V s−1). Therefore, the linear relationship of EP and log v can be expressed as EP (V) = 0.0949 log v (V s−1) + 0.513 (R = 0.9543) for uric acid MIP. Moreover, the calculation was determined using the following equation (1),
CV curve response of 3.56 mM uric acid in 0.1 M PBS (pH 7.4) obtained at PGE/MWCNTs/MIP with different scan rates. Inset (1): the plot of peak potential (EP) versus scan rate (v), inset (2) the plot of peak potential (EP) versus log of scan rate (v).
3.5.2 Limit of detection (LOD)
In the uric acid detection method, three sets of electrodes are required, just as they were utilized in the polymerization process. This study used PGE/MWCNTs/MIP as the working electrode, Ag/AgCl as the reference electrode, and Pt wire as the counter electrode. The uric acid solution concentrations employed for the LOD tests of PGE/MWCNTs/MIP were 0.22, 0.34, 0.54, 0.86, 1.36, 2.14, 3.38, and 3.5 mM in 0.1 M PBS at pH 5.8. This solvent was chosen to increase uric acid solubility and prevent the production of uric acid residue, which happened in 0.1 M PBS solvent at pH 7.4. Following each detection, the MIP was rinsed with 0.5 M KCl and 0.1 M PBS (pH 7.4) to eliminate any leftover uric acid from the previous detection.
According to Fig. 12, the PGE/MWCNTs/MIP cannot detect low concentrations because the pre-polymerization and polymerization processes are still in contact with oxygen, which should be avoided. Oxygen is an oxidizing agent for pyrrole compounds, which might result in early polymer formation. The sensor's selectivity may be reduced during initial polymerization since the pyrrole is deposited for several cycles before the uric acid is imprinted on the transducer. This resulted in a low LOD value of 0.76 mM when comparing the slope of calibration curve to the standard deviation of the blank sample (n = 10). In contrast to prior discoveries, this value was relatively high. However, given that the typical concentration of uric acid in the human body varies between 1.49 and 4.46 mM, further development of this LOD is required.
CV curve response for uric acid detection in the concentration range of 0.22–3.5 mM. Inset (1): the overall CV curve response on each concentration.
3.5.3 Sensitivity
By comparing the standard deviation of the MIP with blank sample (n = 10) with the surface area of the electrode detection, the sensitivity of the PGE/MWCNTs/MIP was calculated to be 97.459 µA µM−1 cm−2. Compared to various earlier research that established a MIP for uric acid, PGE/MWCNTs/MIP has a comparatively high sensitivity, as shown in Table 2. However, degradation of MWCNTs nanomaterials and thickening of MIP cavity sides induced by repetitive template removal must be avoided since they are likely to decrease sensitivity (Gillan and Jansson, 2022).
Electrode Modification
Template Molecule
LOD
Linear Range
Sensitivity
References
GEC/pTS-/pPy
Paracetamol, ascorbic acid, and uric acid
24 μM
50–500 μM
26 nA μM−1
(Wang et al., 2022)
FTO/Poly-azo-BBY
Uric acid
0.160 μM
10–70 μM
2,550 kΩ cm−2 L μM−1
(Trevizan et al., 2021)
ZnO/MAPDIA
Uric acid
0.32 μM
–
–
(Tang et al., 2016)
AuNPs/PVP/SiO2/poly-VTMS
Uric acid
0.4 μM
5 μM–0.1 mM
–
(Rezaei et al., 2022)
GCE/RGO/AMT
Uric acid
and tyrosine0.0032 μM
0.1–100 μM
–
(Zheng et al., 2018)
GCE/NPGL/poly-o-PD
Uric acid dan dopamine
0.4 μM
5–160 μM
98 μA cm−2 μM−1
(Li et al., 2020b)
CPE/pMAA
Uric acid
0.03 μM
0–20 μM
–
(Alizadeh and Karimi, 2022)
M−GCE/Fe3O4/Carbon layer/TiO2
Uric acid
0.02 μM
0.3–34 μM
–
(Zhang et al., 2015)
ITO/TiO2/Au/CdS/poly-o-PD
Uric acid
0.3 nM
1–9 nM
–
(Zhao et al., 2021)
PGE/MWCNTs/pPy
Uric acid
0.76 mM
0.22–3.5 mM
97.459 µA cm−2 μM−1
This work
3.5.4 Selectivity
The selectivity of PGE/MWCNTs/MIP was determined by testing the sensor in a solution containing interference molecules. To conduct the selectivity test, 2 mM uric acid (UA), dopamine (DA), L-ascorbic acid (AA), citric acid (CA), NaCl (Na + ), KCl (K + ), sarcosine (SA), and 20 mM glucose (GA) in 0.1 M PBS (pH 7.4) were prepared. The DPV approach was applied to each solution with a potential ranging from − 0.4 to + 1.0 V. In each measurement, the MIP was washed with 0.5 M KCl and 0.1 M PBS (pH 7.4) prior to performing DPV on another solution. The ΔIP was calculated by comparing the IP of MIP and NIP for each detection.
Fig. 13 shows that the DPV response to uric acid is greater than that to other interference molecules, with the exception of dopamine. This indicates that the assigned MIP showed weak dopamine selectivity but strong uric acid selectivity. Dopamine is a chemical that coexists in the extracellular fluid with uric acid and ascorbic acid (Elugoke et al., 2021). The EP for uric acid was identified at a potential of 0.39 V, while dopamine was found at 0.29 V. This issue needs to be investigated further, particularly in MIP optimization, which includes monomer and solvent selection. Selectivity of uric acid towards interference molecules, particularly for the construction of multi-template MIP for detecting uric acid, ascorbic acid, and dopamine with similar chemical structures (Wang et al., 2022).
DPV curve response in PGE/MWCNTs/MIP selectivity identification process.
3.5.5 Stability
A 19-day stability test was conducted to evaluate the MIP's durability to environmental conditions and repeated use. This was done to calculate the stability current percentage, which must be addressed while developing portable sensors as they are anticipated to be stored and utilized for extended periods.
The stability of PGE/MWCNTs/MIP was sustained for a duration of 19 days during the detecting process. Prior to measurement, each detection procedure was subjected to washing with a solution of 0.5 M KCl and 0.1 M PBS (pH 7.4). The test solution contained 3.56 mM uric acid in 0.1 M PBS at (pH 7.4). During the 19-day detection period, the sensor's performance gradually decreased to 71 %, as illustrated in Fig 14.
CV curve response to the stability of PGE/MWCNTs/MIP after 21 days.
Since MIP is an artificial bioreceptor system meant for repeated binding, stability is an important consideration when deciding if a sensor is suitable for use. The addition of Nafion® to the MWCNTs solution had a considerable impact on the electrode modification's stability. After being deposited on the surface of the PGE, the Nafion® produced a conductive coating that stabilized the MWCNTs solution. After the ethanol solvent evaporated, the stability of the MWCNTs improved, ensuring that they would not fall out or degrade during detection (Hou et al., 2023).
3.5.6 Repeatability and reproducibility
One of the most significant features for evaluating MIP performance is repeatability, which is measured by detecting template molecules for at least ten times consecutively. The MIP was rinsed with 0.5 M KCl and 0.1 M PBS (pH 7.4) prior to each measurement. The relative standard deviation (RSD%) for repeatability in this sensor design was 3.43 %, which must be kept below 5 % to assure the performance of the produced MIP.
For reproducibility, the measurement was performed on freshly created PGE/MWCNTs/MIP (n = 3) that were prepared using the same approach to detect uric acid at the same time (Rezaei et al., 2022). The RSD% for reproducibility was found to be 5.37 %, which is slightly higher than 5 % but still significant enough for future mass production development.
4 Conclusion
MIP was created by combining polypyrrole and PGE-modified MWCNTs for uric acid detection. The obtained MIP creation parameters, including template molecule to monomer ratio, number of polymerization cycles, polymerization rate, and template removal cycles, were 1:10, 10, 100 mV s−1, and 30, respectively. The resultant MIP was characterized morphologically and electrochemically, demonstrating excellent deposition of MWCNTs and MIP on the electrode. The MIP also exhibited superior electrical conductivity, facilitating efficient electron transfer. PGE/MWCNTs/MIP was measured in a uric acid solution using DPV, yielding a linear range of 0.22–3.5 mM and a detection limit of 0.76 mM. PGE/MWCNTs/MIP demonstrates a sensitivity of 97.459 µA µM−1 cm−2 and electrode stability of 71 % after 19 days of use.
PGE/MWCNTs/MIP also showed high selectivity for uric acid against interfering compounds, alongside reproducibility and repeatability of 5.37 % and 3.43 %, respectively. Future studies should include electrochemical tests with natural sweat to assess the MIP's accuracy against more complex interfering chemicals. If the selectivity of PGE/MWCNTs/MIP for uric acid over the interfering molecule in real sweat samples is good, the MIP can be constructed and integrated into a tiny electrical circuit to make a wearable sensor.
CRediT authorship contribution statement
Elly Septia Yulianti: Conceptualization, Data curation, Writing – original draft, Writing – review & editing, Visualization, Investigation, Validation, Formal analysis, Methodology. Siti Fauziyah Rahman: Conceptualization, Funding acquisition, Writing – review & editing, Supervision, Resources, Project administration. Mia Rizkinia: Conceptualization, Funding acquisition, Writing – review & editing. Ahmad Zakiyuddin: Conceptualization, Writing – review & editing.
Acknowledgement
We gratefully acknowledge the funding from Universitas Indonesia through Publikasi Terindeks Internasional (PUTI) Q1 2020 Nomor: NKB-1422/UN2.RST/HKP.05.00/2020.
Declaration of competing interest
The authors declare that they have no known competing financial interests or personal relationships that could have appeared to influence the work reported in this paper.
References
- Electrochemical biosensing of uric acid: a review. Microchem. J.. 2022;182:107945
- [CrossRef] [Google Scholar]
- Application of selective solid-phase extraction using a new core-shell-shell magnetic ion-imprinted polymer for the analysis of ultra-trace mercury in serum of gallstone patients. Sep. Sci. Technol.. 2020;55:2758-2771.
- [CrossRef] [Google Scholar]
- A novel enzyme-less uric acid voltammetric sensor based on highly selective nano-imprinted polymer synthesized utilizing [tetrabutyl ammonium]+-[urate]− ion-pair complex as template. Microchem. J.. 2022;183:108095
- [CrossRef] [Google Scholar]
- A novel electrochemical sensor based on molecularly imprinted polymer nanocomposite platform for sensitive and ultra-selective determination of citalopram. J. Electroanal. Chem.. 2022;918:116493
- [CrossRef] [Google Scholar]
- Functionalized conjugated polymers for sensing and molecular imprinting applications. Prog. Polym. Sci.. 2019;88:1-129.
- [CrossRef] [Google Scholar]
- Fabrication of an efficient and sensitive colorimetric biosensor based on Uricase/ Th-MOF for uric acid sensing in biological samples. Biosens. Bioelectron.. 2019;141:111420
- [CrossRef] [Google Scholar]
- An improved non-enzymatic electrochemical sensor amplified with CuO nanostructures for sensitive determination of uric acid. Open Chem.. 2021;19:481-491.
- [CrossRef] [Google Scholar]
- Determination of glucose and uric acid with bienzyme colorimetry on microfluidic paper-based analysis devices. Biosens. Bioelectron.. 2012;35:363-368.
- [CrossRef] [Google Scholar]
- Three-dimensional Ni 2 P nanoarray: an efficient catalyst electrode for sensitive and selective nonenzymatic glucose sensing with high specificity. Anal. Chem.. 2016;88:7885-7889.
- [CrossRef] [Google Scholar]
- Molecularly imprinted polymer based electrochemical biosensors: overcoming the challenges of detecting vital biomarkers and speeding up diagnosis. Talanta Open.. 2020;2:100018
- [CrossRef] [Google Scholar]
- Voltammetric uric acid sensor based on a glassy carbon electrode modified with a nanocomposite consisting of polytetraphenylporphyrin, polypyrrole, and graphene oxide. Microchim. Acta.. 2016;183:3053-3059.
- [CrossRef] [Google Scholar]
- Recent advances in carbon nanotube-based biosensors for biomolecular detection. TrAC Trends Anal. Chem.. 2022;154:116658
- [CrossRef] [Google Scholar]
- Optimization of cortisol-selective molecularly imprinted polymers enabled by molecular dynamics simulations. ACS Appl. Bio Mater.. 2021;4:7243-7253.
- [CrossRef] [Google Scholar]
- Label-Free detection of small organic molecules by molecularly imprinted polymer functionalized thermocouples: toward in Vivo applications. ACS Sens.. 2017;2:583-589.
- [CrossRef] [Google Scholar]
- A molecularly imprinted electrochemical sensors based on bamboo-like carbon nanotubes loaded with nickel nanoclusters for highly selective detection of cortisol. Microchem. J.. 2022;175:107231
- [CrossRef] [Google Scholar]
- Electropolymerized molecularly imprinted polymer synthesis guided by an integrated data-driven framework for cortisol detection. ACS Appl. Mater. Interfaces.. 2022;14:25972-25983.
- [CrossRef] [Google Scholar]
- Molecularly imprinted polymers (MIPs) based electrochemical sensors for the determination of catecholamine neurotransmitters – review. Electrochem. Sci. Adv.. 2021;1:e2000026
- [CrossRef] [Google Scholar]
- Rapid, sensitive and simultaneous determination of ascorbic and uric acids in human plasma by ion-exclusion HPLC-UV. Clin. Biochem.. 2013;46:665-669.
- [CrossRef] [Google Scholar]
- Electrochemical behaviour and voltammetric determination of sulphadiazine using a multi-walled carbon nanotube composite film-glassy carbon electrode. J. Exp. Nanosci.. 2013;8:947-956.
- [CrossRef] [Google Scholar]
- Direct determination of uric acid in serum by a fluorometric-enzymatic method based on uricase. Talanta.. 2001;54:847-854.
- [CrossRef] [Google Scholar]
- Molecularly imprinted polymer on roll-to-roll printed electrodes as a single use sensor for monitoring of cortisol in sweat. Flex. Print. Electron.. 2022;7:025014
- [CrossRef] [Google Scholar]
- Simultaneous electrochemical determination of 4-aminophenazone and caffeine at electrochemically pre-treated graphite pencil electrode. Anal. Methods.. 2014;6:5147.
- [CrossRef] [Google Scholar]
- Recent advances in carbon nanotube based electrochemical biosensors. Int. J. Biol. Macromol.. 2018;108:687-703.
- [CrossRef] [Google Scholar]
- Effect of Degassing on Surfactant-Free Emulsion Polymerizations of Styrene Mediated with RAFT. Macromol.. 2006;39:904-907.
- [CrossRef] [Google Scholar]
- Competition between enzymatic and non-enzymatic electrochemical determination of cholesterol. J. Electroanal. Chem.. 2023;930:117169
- [CrossRef] [Google Scholar]
- Overoxidation of intrinsically conducting polymers. Polymers.. 2022;14:1584.
- [CrossRef] [Google Scholar]
- Development of a Nafion-MWCNTs and in-situ generated Au nanopopcorns dual-amplification electrochemical aptasensor for ultrasensitive detection of OTA. Food Chem.. 2023;403:134375
- [CrossRef] [Google Scholar]
- An ultrasensitive aptamer-antibody sandwich cortisol sensor for the noninvasive monitoring of stress state. Biosens. Bioelectron.. 2021;190:113451
- [CrossRef] [Google Scholar]
- Electrochemical sensor based on a nanocomposite prepared from TmPO4 and graphene oxide for simultaneous voltammetric detection of ascorbic acid, dopamine and uric acid. Microchim. Acta.. 2019;186:189.
- [CrossRef] [Google Scholar]
- E-DNA biosensors of M. tuberculosis based on nanostructured polypyrrole. Mater. Sci. Eng.. 2020;C 108:110371
- [CrossRef] [Google Scholar]
- Highly permselective uric acid detection using kidney cell membrane–functionalized enzymatic biosensors. Biosens. Bioelectron.. 2021;190:113411
- [CrossRef] [Google Scholar]
- A novel metal organic gel with superior oxidase-like activity for efficient and sensitive chemiluminescence detection of uric acid. Spectrochim. Acta. A. Mol. Biomol. Spectrosc.. 2021;257:119773
- [CrossRef] [Google Scholar]
- One-Pot electrochemical fabrication of high performance amperometric enzymatic biosensors using polypyrrole and polydopamine. J. Ind. Eng. Chem.. 2021;97:316-325.
- [CrossRef] [Google Scholar]
- Electrochemical sensor based on dual-template molecularly imprinted polymer and nanoporous gold leaf modified electrode for simultaneous determination of dopamine and uric acid. Microchim. Acta.. 2020;187:496.
- [CrossRef] [Google Scholar]
- Sensitive and selective detection of puerarin based on the hybrid of reduced graphene oxide and molecularly imprinted polymer. J. Pharm. Biomed. Anal.. 2020;185:113221
- [CrossRef] [Google Scholar]
- A novel electrochemical sensor based on bimetallic metal–organic framework-derived porous carbon for detection of uric acid. Talanta.. 2019;199:478-484.
- [CrossRef] [Google Scholar]
- Uric acid and creatinine biosensors with enhanced room-temperature storage stability by a multilayer enzyme matrix. Anal. Chim. Acta.. 2022;1227:340264
- [CrossRef] [Google Scholar]
- Non-enzymatic electrochemical sensor for wearable monitoring of sweat biomarkers: a mini-review. Curr. Res. Biotechnol.. 2023;6:100143
- [CrossRef] [Google Scholar]
- A novel electrochemical sensor for uric acid detection based on PCN/MWCNT. Ionics.. 2019;25:4437-4445.
- [CrossRef] [Google Scholar]
- ZnO nanorod integrated flexible carbon fibers for sweat cortisol detection. ACS Appl. Electron. Mater.. 2020;2:499-509.
- [CrossRef] [Google Scholar]
- A reusable electrochemical biosensor for monitoring of small molecules (Cortisol) using molecularly imprinted polymers. J. Electrochem. Soc.. 2017;164:B54-B59.
- [CrossRef] [Google Scholar]
- Trace anthracene electrochemical detection based on electropolymerized-molecularly imprinted polypyrrole modified glassy carbon electrode. J. Electroanal. Chem.. 2019;848:113253
- [CrossRef] [Google Scholar]
- Electrochemical detection of uric acid and ascorbic acid using r-GO/NPs based sensors. Electrochim. Acta.. 2021;388:138652
- [CrossRef] [Google Scholar]
- Nanoparticles enrichment to carbon felt electrodes for non-aqueous redox flow battery. J. Energy Storage.. 2023;65:107234
- [CrossRef] [Google Scholar]
- Uricase based amperometric biosensor improved by AuNPs-TiS2 nanocomposites for uric acid determination. Microchem. J.. 2022;181:107725
- [CrossRef] [Google Scholar]
- Boron nitride nanosheet modified amperometric biosensor for uric acid determination. Microchem. J.. 2023;194:109240
- [CrossRef] [Google Scholar]
- Uric acid as one of the important factors in multifactorial disorders – facts and controversies. Biochem. Medica.. 2012;63–75
- [CrossRef] [Google Scholar]
- A review of uric acid, crystal deposition disease, and gout. Adv. Ther.. 2015;32:31-41.
- [CrossRef] [Google Scholar]
- Evaluation of electrochemical quartz crystal microbalance based sensor modified by uric acid-imprinted polypyrrole. Talanta.. 2020;220:121414
- [CrossRef] [Google Scholar]
- Additional polypyrrole as conductive medium in artificial electrochemically active biofilm (EAB) to increase the sensitivity of EAB based biosensor in water quality early-warning. Biosens. Bioelectron.. 2021;190:113453
- [CrossRef] [Google Scholar]
- Molecular imprinting technology for determination of uric acid. Int. J. Mol. Sci.. 2021;22:5032.
- [CrossRef] [Google Scholar]
- Water-compatible synthesis of core-shell polysilicate molecularly imprinted polymer on polyvinylpyrrolidone capped gold nanoparticles for electrochemical sensing of uric acid. Microchem. J.. 2022;177:107312
- [CrossRef] [Google Scholar]
- A flow-based procedure with solenoid micro-pumps for the spectrophotometric determination of uric acid in urine. Microchem. J.. 2010;94:53-59.
- [CrossRef] [Google Scholar]
- Uric acid and cardiovascular disease: a clinical review. J. Cardiol.. 2021;78:51-57.
- [CrossRef] [Google Scholar]
- Molecularly imprinted polymer-based electrochemical sensors for biopolymers. Curr. Opin. Electrochem.. 2019;14:53-59.
- [CrossRef] [Google Scholar]
- Carbon fiber based electrochemical sensor for sweat cortisol measurement. Sci. Rep.. 2019;9:403.
- [CrossRef] [Google Scholar]
- MoS2 based ultra-low-cost, flexible, non-enzymatic and non-invasive electrochemical sensor for highly selective detection of Uric acid in human urine samples. Sens. Actuators B Chem.. 2019;279:53-60.
- [CrossRef] [Google Scholar]
- CuNPs decorated molecular imprinted polymer on MWCNT for the electrochemical detection of l-DOPA. Arab. J. Chem.. 2020;13:2483-2495.
- [CrossRef] [Google Scholar]
- Oriented, molecularly imprinted cavities with dual binding sites for highly sensitive and selective recognition of cortisol. R. Soc. Open Sci.. 2017;4:170300
- [CrossRef] [Google Scholar]
- Voltammetric investigation of uric acid in existence of dopamine at Poly(benzydamine) modified carbon paste electrode. Sens. Int.. 2020;1:100045
- [CrossRef] [Google Scholar]
- Kinetics and mechanism of pyrrole chemical polymerization. Synth. Met.. 2013;175:183-191.
- [CrossRef] [Google Scholar]
- Photoresponsive surface molecularly imprinted polymer on ZnO nanorods for uric acid detection in physiological fluids. Mater. Sci. Eng. C.. 2016;66:33-39.
- [CrossRef] [Google Scholar]
- Sensitive and selective electrochemical determination of uric acid in urine based on ultrasmall iron oxide nanoparticles decorated urchin-like nitrogen-doped carbon. Colloids Surf. B Biointerfaces.. 2022;216:112538
- [CrossRef] [Google Scholar]
- Fiber based organic electrochemical transistor integrated with molecularly imprinted membrane for uric acid detection. Talanta.. 2022;238:123055
- [CrossRef] [Google Scholar]
- Review of applied surface modifications of pencil graphite electrodes for paracetamol sensing. Results Phys.. 2021;22:103911
- [CrossRef] [Google Scholar]
- Biosensing based on pencil graphite electrodes. Talanta.. 2018;190:235-247.
- [CrossRef] [Google Scholar]
- Development of a molecularly imprinted polymer for uric acid sensing based on a conductive azopolymer: Unusual approaches using electrochemical impedance/capacitance spectroscopy without a soluble redox probe. Sens. Actuators B Chem.. 2021;343:130141
- [CrossRef] [Google Scholar]
- An automatic chemiluminescence method based on the multi-pumping flow system coupled with the fluidized reactor and direct-injection detector: Determination of uric acid in saliva samples. Talanta.. 2017;167:725-732.
- [CrossRef] [Google Scholar]
- In-situ electrochemical and operando Raman techniques to investigate the effect of porosity in different carbon electrodes in organic electrolyte supercapacitors. J. Energy Storage.. 2022;50:104219
- [CrossRef] [Google Scholar]
- Preparation of a magnetic molecularly imprinted polymer for non-invasive determination of cortisol. J. Polym. Res.. 2021;28:298.
- [CrossRef] [Google Scholar]
- A novel electronic tongue using electropolymerized molecularly imprinted polymers for the simultaneous determination of active pharmaceutical ingredients. Biosens. Bioelectron.. 2022;198:113807
- [CrossRef] [Google Scholar]
- Bimetallic nanoparticles decorated hollow nanoporous carbon framework as nanozyme biosensor for highly sensitive electrochemical sensing of uric acid. Biosens. Bioelectron.. 2020;150:111869
- [CrossRef] [Google Scholar]
- Electropolymerization of β-cyclodextrin onto multi-walled carbon nanotube composite films for enhanced selective detection of uric acid. J. Electroanal. Chem.. 2016;783:192-200.
- [CrossRef] [Google Scholar]
- Wearable biosensor for sensitive detection of uric acid in artificial sweat enabled by a fiber structured sensing interface. Nano Energy.. 2021;85:106031
- [CrossRef] [Google Scholar]
- Electrodeposited nanoporous ruthenium oxide for simultaneous quantification of ascorbic acid and uric acid using chronoamperometry at two different potentials. Sens. Actuators B Chem.. 2018;255:316-324.
- [CrossRef] [Google Scholar]
- Photoelectrochemical bilirubin biosensor based on Fe3O4/hydroxyapatite/molecularly imprinted polypyrrole nanoparticles. Sens. Actuators B Chem.. 2014;201:167-172.
- [CrossRef] [Google Scholar]
- A 3D electrochemical biosensor based on Super-Aligned Carbon NanoTube array for point-of-care uric acid monitoring. Biosens. Bioelectron.. 2021;179:113082
- [CrossRef] [Google Scholar]
- Nano gold-doped molecularly imprinted electrochemical sensor for rapid and ultrasensitive cortisol detection. Biosens. Bioelectron.. 2022;206:114142
- [CrossRef] [Google Scholar]
- Molecularly imprinted electrochemical aptasensor based on functionalized graphene and nitrogen-doped carbon quantum dots for trace cortisol assay. Analyst.. 2022;147:744-752.
- [CrossRef] [Google Scholar]
- Molecularly imprinted polymer-based sensor for electrochemical detection of cortisol. Biosensors.. 2022;12:1090.
- [CrossRef] [Google Scholar]
- Raman spectra of MWCNTs and MWCNT-based H2-adsorbing system. Carbon.. 2002;40:2429-2436.
- [CrossRef] [Google Scholar]
- A highly selective photoelectrochemical biosensor for uric acid based on core–shell Fe3O4@C nanoparticle and molecularly imprinted TiO2. Biosens. Bioelectron.. 2015;65:115-120.
- [CrossRef] [Google Scholar]
- A photoelectrochemical sensor based on Z-Scheme TiO2@Au@CdS and molecularly imprinted polymer for uric acid detection. Microchim. Acta.. 2021;188:188.
- [CrossRef] [Google Scholar]
- Carbon nanotube/carbon fiber electrodes via chemical vapor deposition for simultaneous determination of ascorbic acid, dopamine and uric acid. Arab. J. Chem.. 2020;13:3266-3275.
- [CrossRef] [Google Scholar]
- Electrochemical sensor based on molecularly imprinted polymer/reduced graphene oxide composite for simultaneous determination of uric acid and tyrosine. J. Electroanal. Chem.. 2018;813:75-82.
- [CrossRef] [Google Scholar]
- Determination of creatinine, uric and ascorbic acid in bovine milk and orange juice by hydrophilic interaction HPLC. Food Chem.. 2015;182:242-245.
- [CrossRef] [Google Scholar]


